How to enjoy our new magazine:
Just scroll!
Click or tap the table of contents icon in the menu bar to find any article.
Read any article by clicking or tapping the read full article button below each article intro.
Jump back to your previous browsing spot from any article using the menu bar or back to issue button.


theparhamgroup.com
Self-Storage
Almanac
-
PUBLISHER
Poppy Behrens
-
Creative Director
Jeffry Pettingill
-
Director Of Sales & Marketing
Lauri Longstrom-Henderson
(800) 824-6864 -
Circulation & Marketing Coordinator
Carlos Padilla • (800) 352-4636
-
Editor
Erica Shatzer
-
Web Manager / News Writer
Brad Hadfield
-
Storelocal® Media Corporation
Travis M. Morrow, CEO
-
Websites
-
Visit Messenger Online!
Visit our Self-Storage Resource Center online at
ModernStorageMedia.com
where you can research archived articles, sign up for a subscription, or submit a change of address. -
Reproduction in whole or in part without written permission is prohibited.
Printed in the United States.Unsolicited manuscripts, artwork and photographs must be accompanied by an addressed return envelope and the necessary postage. Publisher assumes no responsibility for the return of materials.
All correspondence and inquiries should be addressed to:
Modern Storage Media
PO Box 608
Wittmann, AZ 85361-9997
Phone: (800) 352-4636
- 1 Industry Data 13
- 2 Industry Ownership 19
- 3 Self-Storage Supply Forecast 27
- 4 Economics And Demographics 33
- 5 Customer Traits 49
- 6 Integration Of Technology 55
- 7 Occupancy 63
- 8 Rental Rates 71
- 9 Site Information 97
- 10 Marketing 107
- 11 Security Insights 115
- 12 RV & Boat Storage 121
- 13 Self-Storage Market Conditions 129
- 14 The Overall Capitalization Rate 135
- 15 Self-Storage Valuation 141
- 16 Self-Storage Financing 149
- 17 Industry Development 161
- 18 Due Diligence 167


Poppy Behrens
elcome to the 2024 Self-Storage Almanac. In 1992, when the first annual Almanac was published by Hardy Good and MiniCo, it was a far cry from the publication it has become today. That inaugural edition was a short statistical abstract of a growing industry that was fast on the way to becoming a real estate asset class of its own.
Since that time the annual Almanac has become the most sought-after publication in the self-storage industry. On the following pages, in addition to an overview of industry size, you will find comprehensive data and detailed analysis on rental rates, occupancy, site information, and more. We have gathered the latest economic and demographic information as well as important data on the industry’s top developers, technology integration, security, valuation, and financing facts that are instrumental in order to make educated decisions in your self-storage endeavors.
As always, it is extremely important to realize that the 2024 Self-Storage Almanac should be used as a benchmark for your research, along with other educational publications from Modern Storage Media, such as the Development Handbook and the RV & Boat Development Handbook. You should also consider exploring the 2024 Expense Guidebook, a companion to the annual Almanac, providing detailed information about industry expense ratios on a national and regional basis.
We would like to extend a very special, thank you to our data partners at Radius+, and the Self Storage Association for allowing us to use data from the 2023 Self Storage Demand Study. Furthermore, we would like to thank Chris Sonne of Newmark Valuation & Advisory for providing his expertise once again on so many levels.
In closing, remember that the need for comprehensive, market-specific research and ample due diligence is vital to the success of any investment in the self-storage industry. Market dynamics can be dramatically different depending on location. As such, it is essential to retain an unbiased, third party to conduct extensive feasibility studies before making any costly investments.
Whether you are developing a self-storage facility for the first time, expanding an existing facility, or looking to grow your self-storage portfolio, it is our hope that the 2024 Self-Storage Almanac will provide you with valuable data and analytical research and data you need to pursue your endeavors.

Jeff Adler and Ben Bruckner – Yardi Matrix
M. Anne Ballard and Sara Beth Johnson – Universal Storage Group • Poppy Behrens – Modern Storage Media
Anne Mari DeCoster • Shawn Hill – The BSC Group • Jerry LaMartina
Jonathan Lang – Newmark Valuation & Advisory • Tammy LeRoy • Steve Reeder – PTI
R. Christian Sonne, CRE, MAI, FRICS – Newmark Valuation & Advisory
Self Storage Association • Erica Shatzer
Cover Photos courtesy of Messenger’s 2023 Facility of the Year Winners
This study, or parts thereof, may not be reproduced, copied, or transmitted in any form without prior written permission of Modern Storage Media, which has received one-time reproduction permission from the sources referred to herein.
All rights reserved • Copyright © 2024 • Printed in the U.S.A.
Modern Storage Media • PO Box 608 • Wittmann, Arizona 85631 • (800) 824-6864
veryone wants self-storage data; however, collecting it is the real issue. While the 2024 Self-Storage Almanac presents the most accurate data available to the industry today, it is our continual goal to improve that data every year. Hence, we ask the question, why doesn’t every owner-operator share the data for the overall good of the industry?
Gartner, a leading provider of data and analytics across a wide array of industries, believes that these owner-operator fears might not only lack a solid foundation, but safeguarding data could actually be detrimental to your business. In an online article published in 2021, Gartner notes, “Organizations that promote data sharing will outperform their peers on most business value metrics.” Gartner goes on to say that without a well-vetted reason, a lack of data sharing can actually hamper business outcomes rather than promote them.
While benchmarking and industry insights are certainly one potential benefit of data sharing, there are a litany of additional potential benefits that could follow if we had high-quality, safely aggregated industry data available. Companies like Reply are leveraging data from across companies and industries to provide a more holistic understanding of a customer or set of customers. According to a June 2020 article published by Harvard Business Review, “Pooling expertise and information enables a company to exponentially increase the value of the individual pieces of data. A combination of information from different environments and businesses can lead to the creation of a range of information that could not otherwise be derived from a single specific data set.” Here again, sharing data provides an accurate and cost-effective way to glean insights that would otherwise be cost prohibitive and daunting to gather as an individual operator.
Calculated by taking the total supply of rentable square feet of self-storage in the U.S. or market, multiplied by the average occupancy and divided by the population, the demand figures presented in the Almanac are used nationwide in feasibility studies and reporting on the health of the industry. They are widely seen as the most accurate figures available to the industry. The information is gathered from our data partner, Radius+, one of the most tech-savvy data gathering companies in self-storage.
Multimillion-dollar decisions are based on these calculations and this data. Paired with average rent assumptions, developers decide whether the unmet demand justified the costs and projected returns of the project. Over the course of 30-plus years, the Almanac’s data has created many wealthy self-storage developers on the best data available. As technology has improved, so too can the accuracy of the data and the ease with which data sharing is made possible. In the end, making informed, data-driven decisions about development benefits us all.
The key to accurate data is the ability to access it from the source of truth, the property management software. The more accurate the data, the more accurate the decisions. As an industry, we know our data could be more accurate. The challenge has always been the ability to share the data, willingly, in a way that is seamless for the operator and doesn’t take away resources during the workweek to report it.
With the proliferation of property management software, the source of truth (the data) has moved to the cloud. The cloud makes the sharing of data easier, what should be as simple as turning on a “switch” for the operator. It would allow operators to share their data anonymously with data services of their choosing. The value of data from one facility, in one market, is essentially useless except to that owner. The value of data is derived from scale, statistically significant scale, that’s why they call it “Big Data.” Scale can be achieved anonymously.
This is not the first time this idea has been attempted in the industry. The Self Storage Association (SSA) started a similar campaign 15 years ago with REIS. Sometimes, great ideas come too early. The work to create the switch then was far too burdensome for the software companies, and the manual process was too cumbersome for operators to adopt on a wide scale.
That was then; this is now. The next step, at this point, is the creation of that “switch” within our software. MSM has had discussions with management software companies in our industry, and they all believe the creation of the “switch” to be a relatively painless endeavor. Only one has created this capability to date, while the others seek to understand the need from their customers.
Self-storage data sharing is essential to the continued success of our industry. Operators should want the best data available to make their decisions, and they should willingly be able to share their data easily to get it.
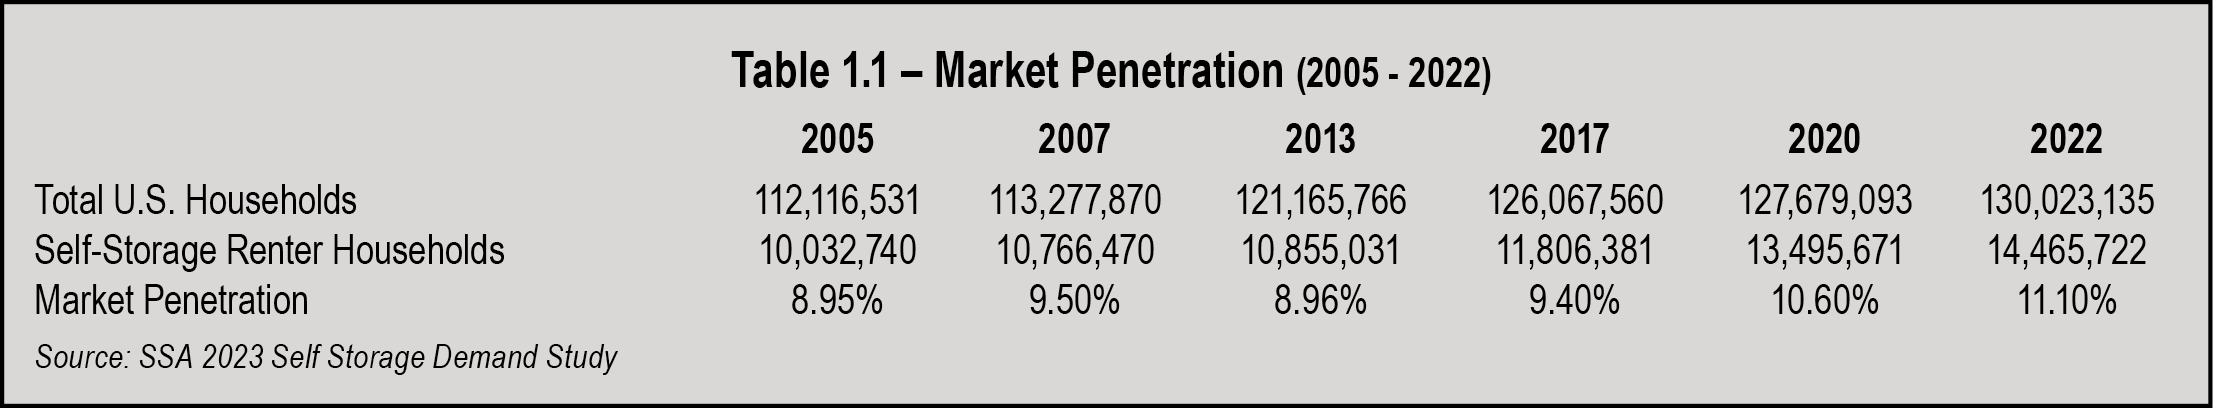
According to the SSA’s 2023 Self Storage Demand Study, of 130,023,135 households in the U.S., 14,465,722 use self-storage, representing a market penetration of 11.10 percent. As seen in Table 1.1 on page 13, market penetration has increased by 2.15 percent since 2005. Simplified, approximately 4,432,982 more households utilize self-storage today than in 2005. Moreover, since 2020, the industry saw an uptick in market penetration of 970,051 households.
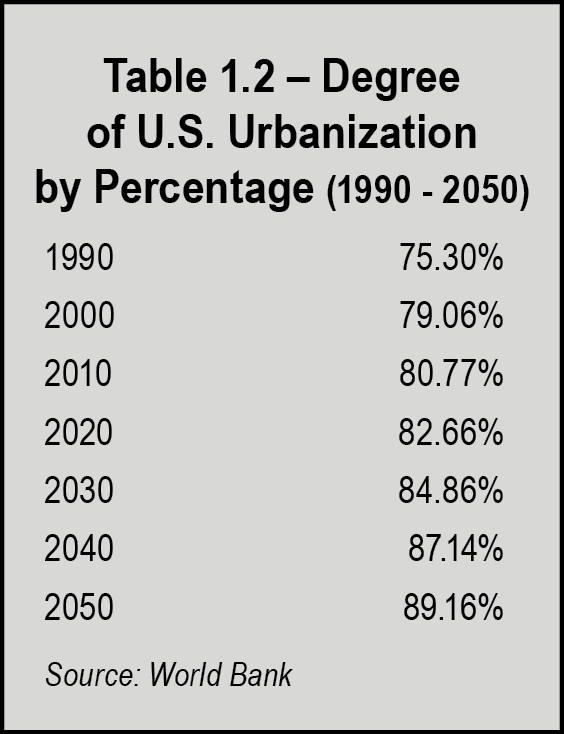
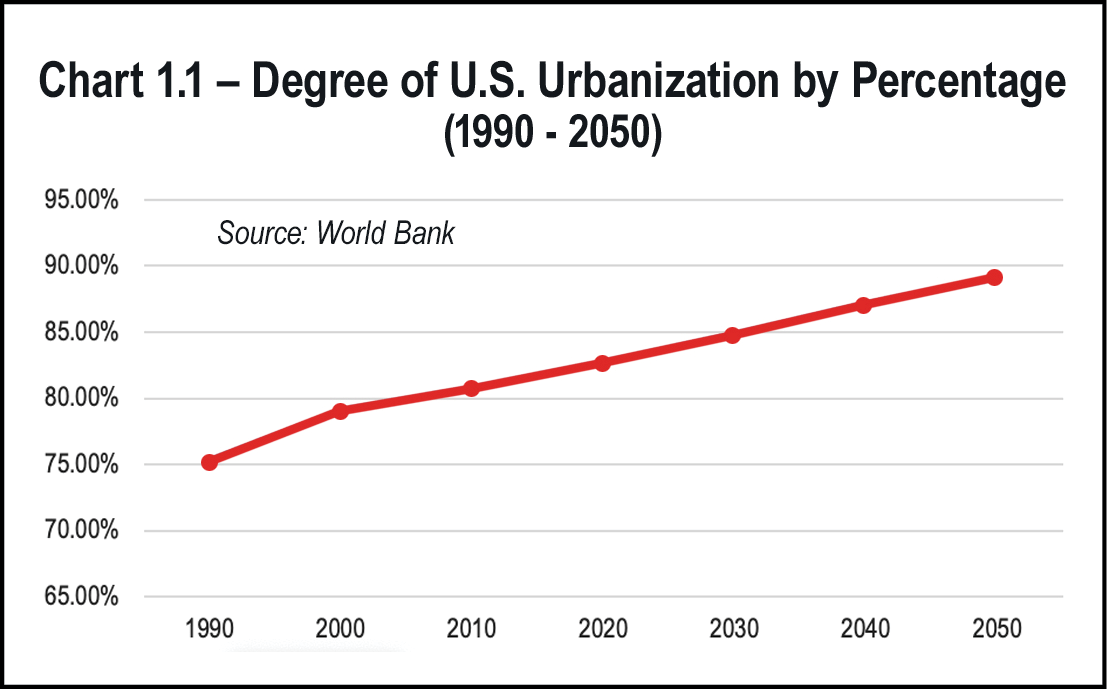
While life changes such as divorce, death, or moving have always been the major reasons for using self-storage, an increase in urbanization has also become a major driver. As seen in Table 1.2 and Chart 1.1 on page 14, more than 82 percent of the U.S. population lived in urban areas as of 2020, a number which is expected to increase to more than 89 percent by 2050. Smaller living spaces in these highly populated areas along with downsizing to smaller homes has led to more demand for storage in these areas. As a result, many self-storage developers are seeking out sites in more densely populated areas to meet this demand.
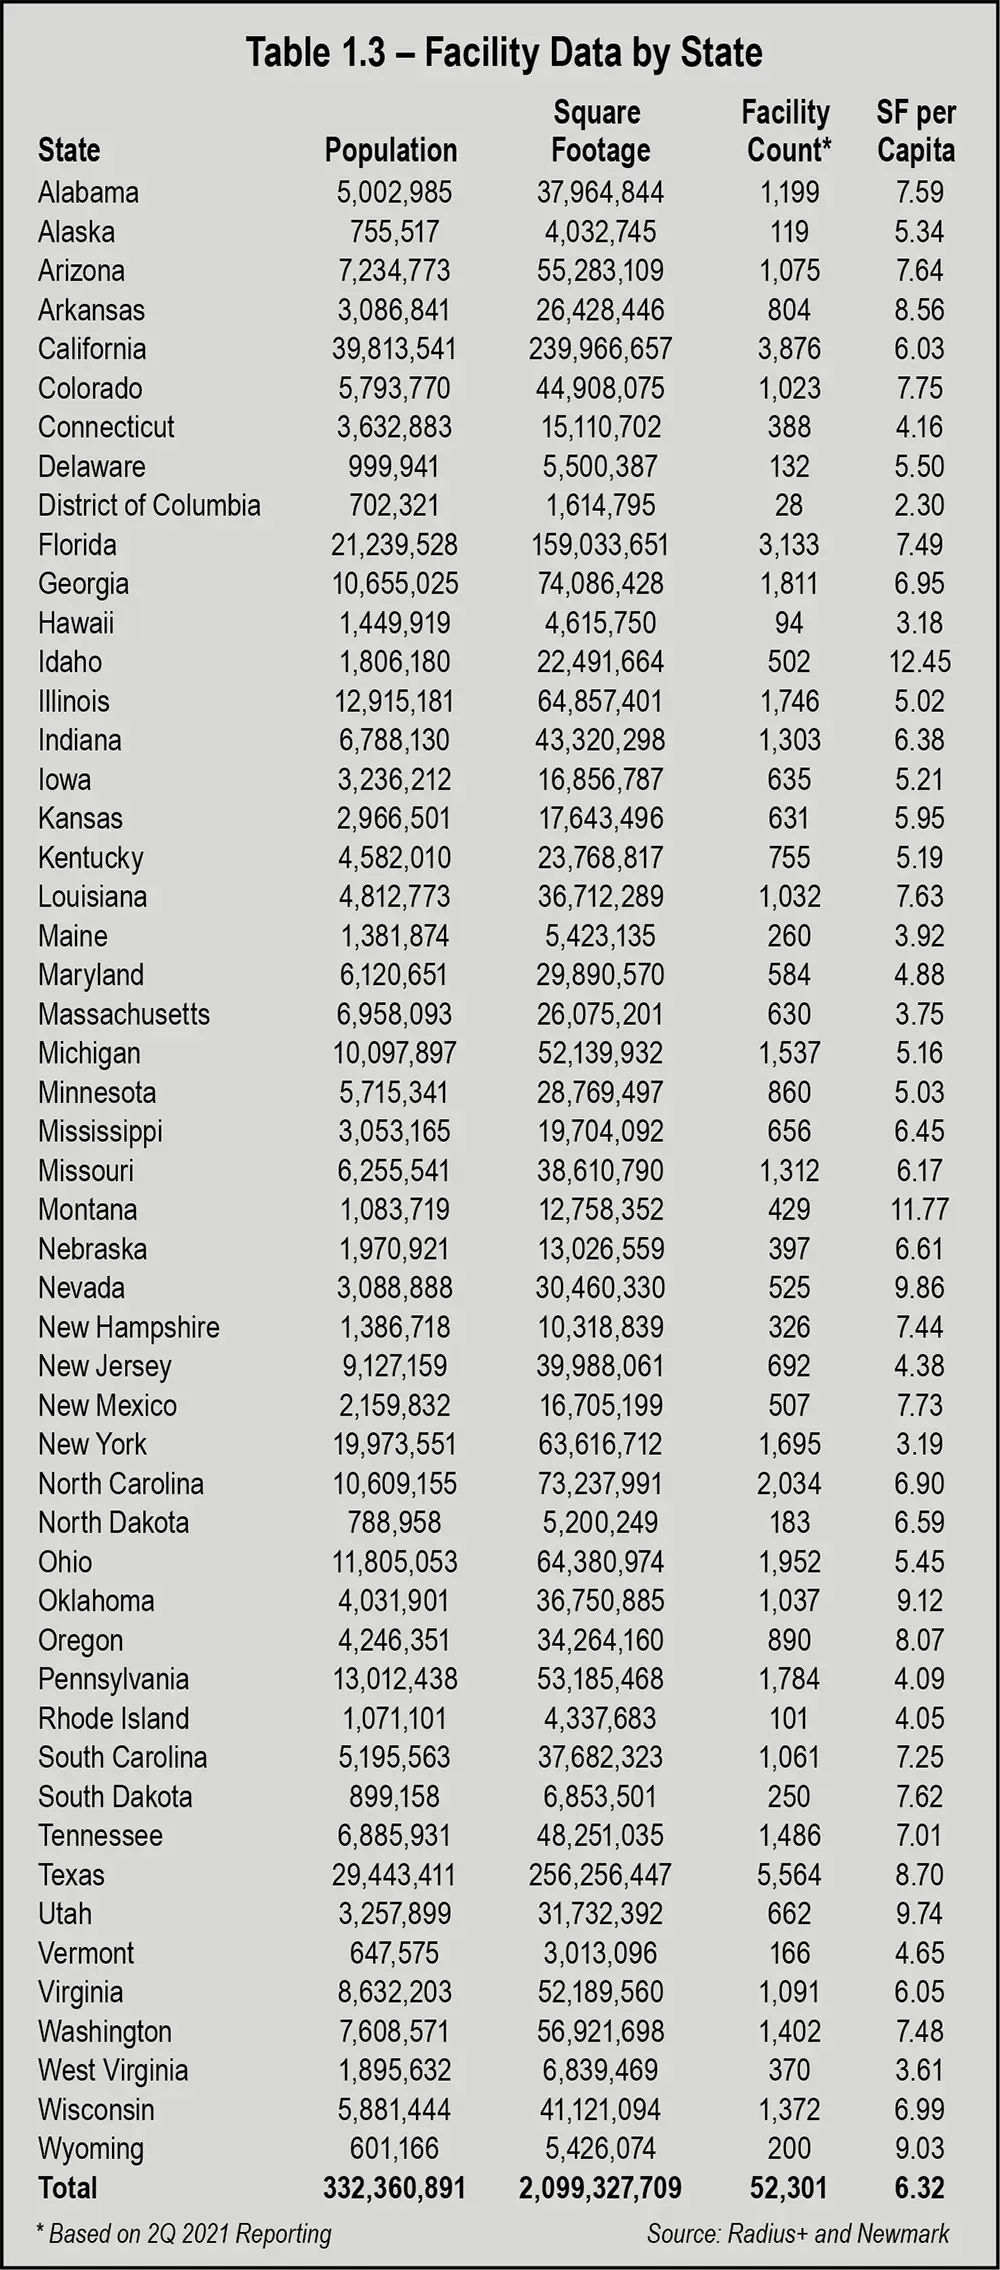
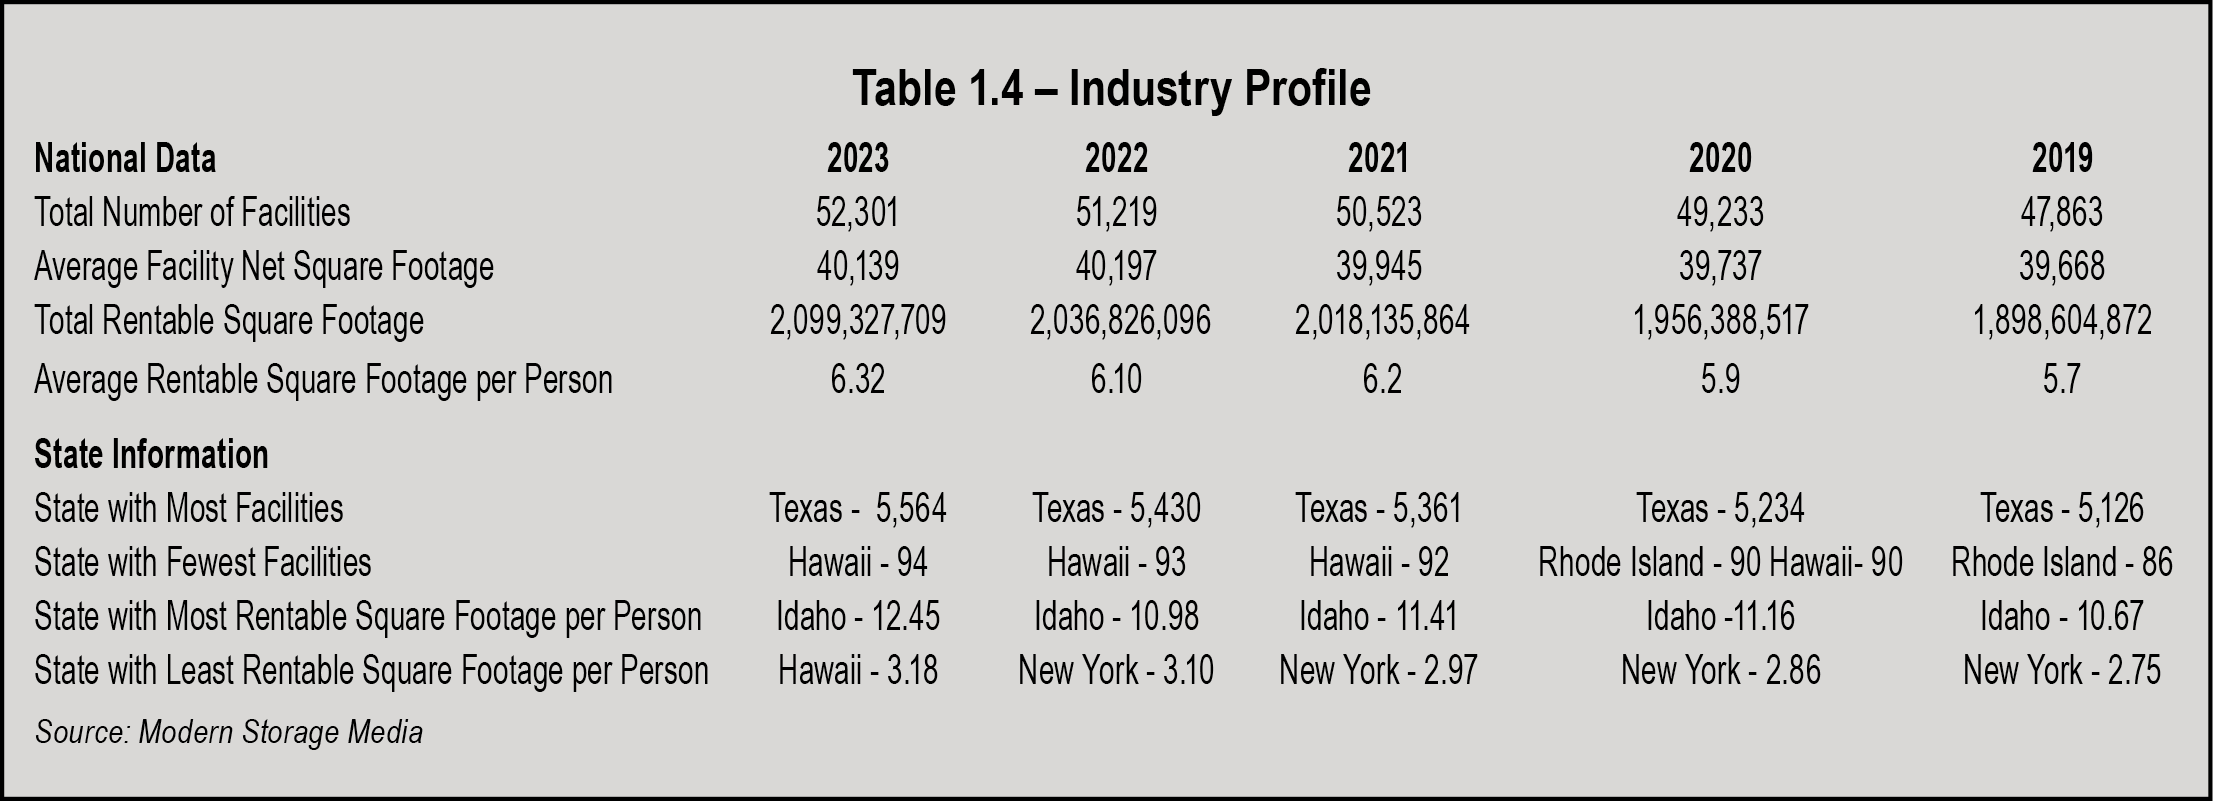
Table 1.3 on page 15 shows self-storage information by state, including the number of facilities, rentable square footage, state population, and square feet per capita. Table 1.4 represents the industry profile for the past five years of Almanac reporting.
Based on data from Radius+, there were approximately 52,301 self-storage facilities in the United States in 2023, an increase of 1,082 facilities from 2022. This number does not include those operations where the primary business is something other than self-storage. It is important to note that this is the best data available today. Based on publicly available earnings reports from innovative building and technology solution providers such as Janus International, we believe that this number could be higher, however, until more owner-operators are willing to share their data, we must rely on the best data available to us.
The industry’s total rentable square footage is 2,099,327,709, up from 2,036,826,096 in 2022—a gain of 62,501,613 square feet. Comparably, the average facility size based on current data is approximately 40,139, a slight decrease from 40,197 net square feet in 2022.
As seen in Table 1.4 below, the state with the most facilities is once again Texas, with 5,564 facilities, representing an increase of 134 facilities in a year’s time. This is nearly double the 69 facilities added two years ago. The state with the least number of facilities is still Hawaii with 94 facilities.
A breakdown of this data by CBSA can be found in Section 13, Market Conditions. Likewise, information for RV and boat storage can be found in Section 12.
In conclusion, presenting the best data available has always been and will continue to be our ultimate goal for the annual Almanac. As such, we will continue to encourage each and every self-storage operator in the U.S. to share their data for the betterment of the industry.
onsolidation continued in 2023 with smaller self-storage companies being acquired by larger operators nationwide. The real consolidation news, however, was the shakeup among the REITs that began in February when No. 1 ranked Public Storage made an $11 billion unsolicited bid for Life Storage, Inc. The all-stock proposal, worth about $129 a share, backfired when Life Storage rejected the bid and instead made a deal with Extra Space in April.
On April 3, Extra Space Storage agreed to acquire Life Storage in an all-stock deal transaction valued at $12.7 billion. This deal ended Public Storage’s 20-year reign as the largest operator in the industry. Extra Space became the new industry leader by facility count and rentable square footage. The acquisition increased its portfolio of properties by more than 50 percent.
Public Storage countered that move in July when it was announced that it had agreed to acquire Simply Self Storage for $2.2 billion. The acquisition included 127 wholly owned properties and 9 million net rentable square feet across 18 states, with approximately 65 percent of the properties located in high-growth, Sun Belt markets. And while the acquisition definitely increased the Public Storage portfolio, it was not enough to take back its position in the No. 1 spot.
- Public companies
- Top 100 operators as reported by Messenger (minus the public companies)
- Owners of the remaining facilities
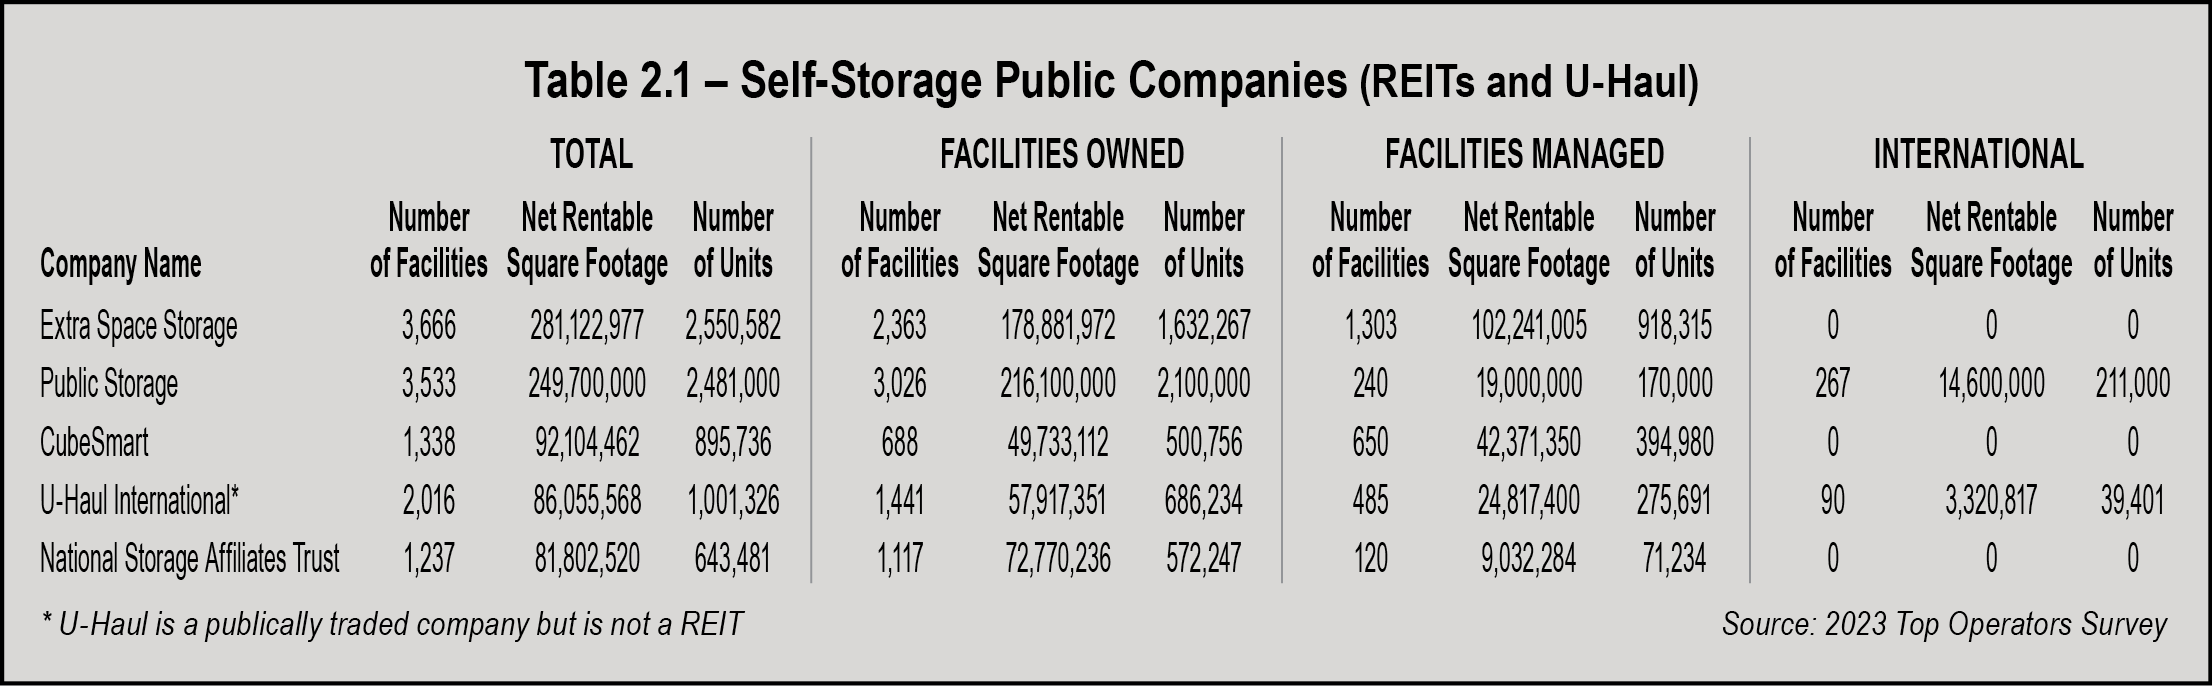
After the Life Storage shakeup, there are now five public companies in the self-storage industry, as seen in as seen in Table 2.1 below. Four of those companies are REITs (real estate investment trusts): Extra Space, Public Storage, CubeSmart, and National Storage Affiliates Trust. The fifth company, U-Haul International, is a public company; however, they are not a REIT. These companies make up the top five self-storage companies.
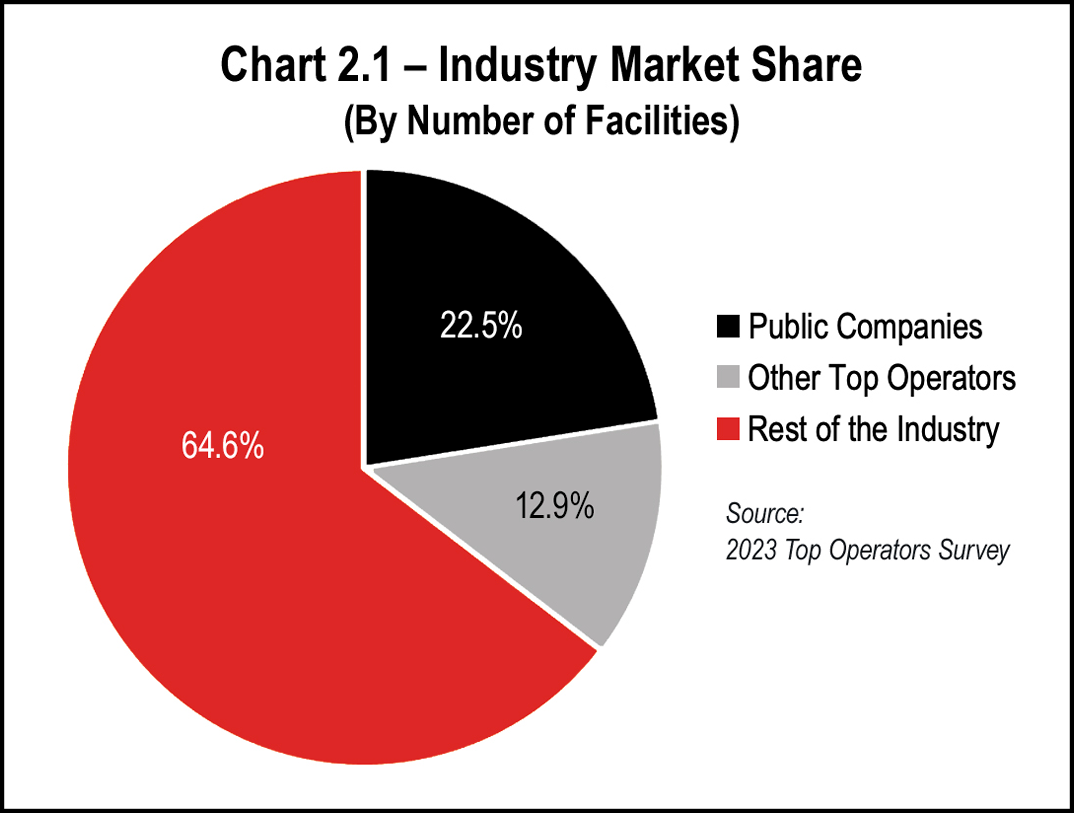
As seen in Chart 2.1 below, the public companies hold 22.5 of the market share by number of facilities. This is an increase from last year’s reported 21.9 percent, with consolidation being the key.
The remaining ownership segment is the small operators, often referred to as the mom-and-pop owners in the industry. Chart 2.1 indicates that this segment of the industry holds a 64.6 percent market share, down 0.7 percent from last year’s reported 65.3 percent.
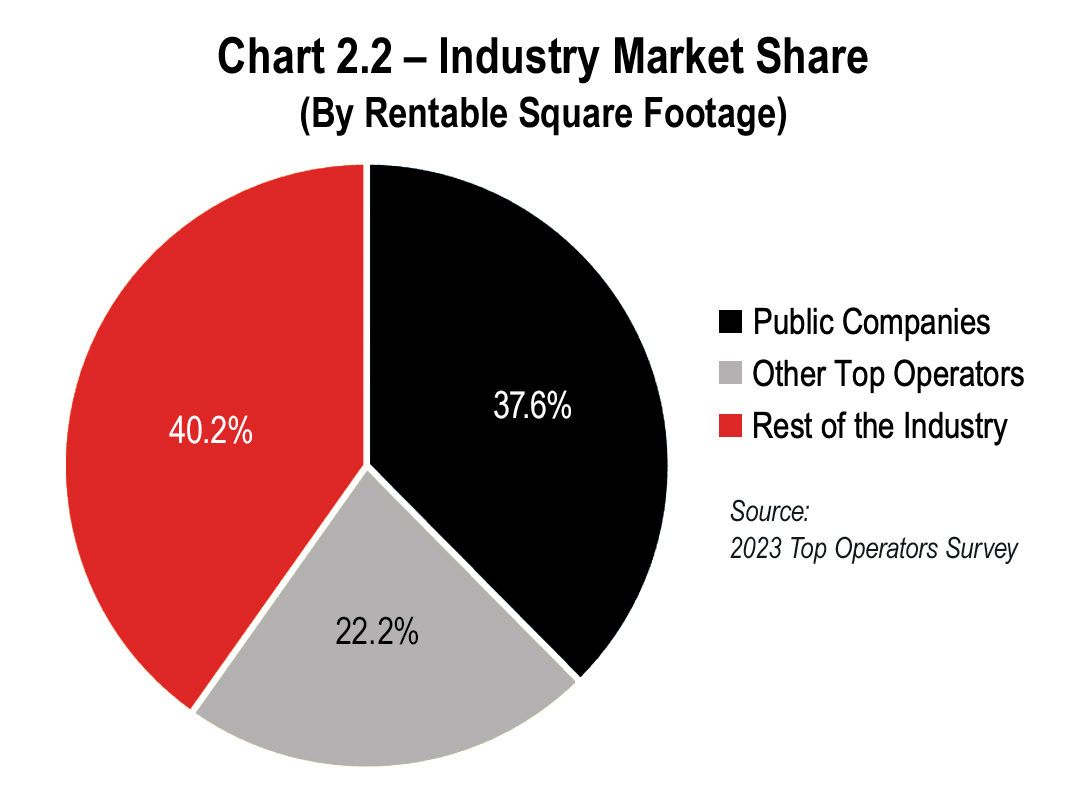
Industry market share by rentable square footage can be seen in Chart 2.2. Looking at this scenario, as opposed to the number of facilities, we can see that the public companies now hold a 37.6 percent market share, up from the 36.6 percent reported in last year’s Almanac. Accordingly, 40.2 percent of the market share is held by the smaller, mom-and-pop owners in the industry. Looking at it from a different perspective, while the public companies hold 37.6 percent of the market, the remaining non-public top operators in the industry hold a 22.2 percent market share. We are sure to see these numbers change as the public companies continue to expand through future acquisitions.
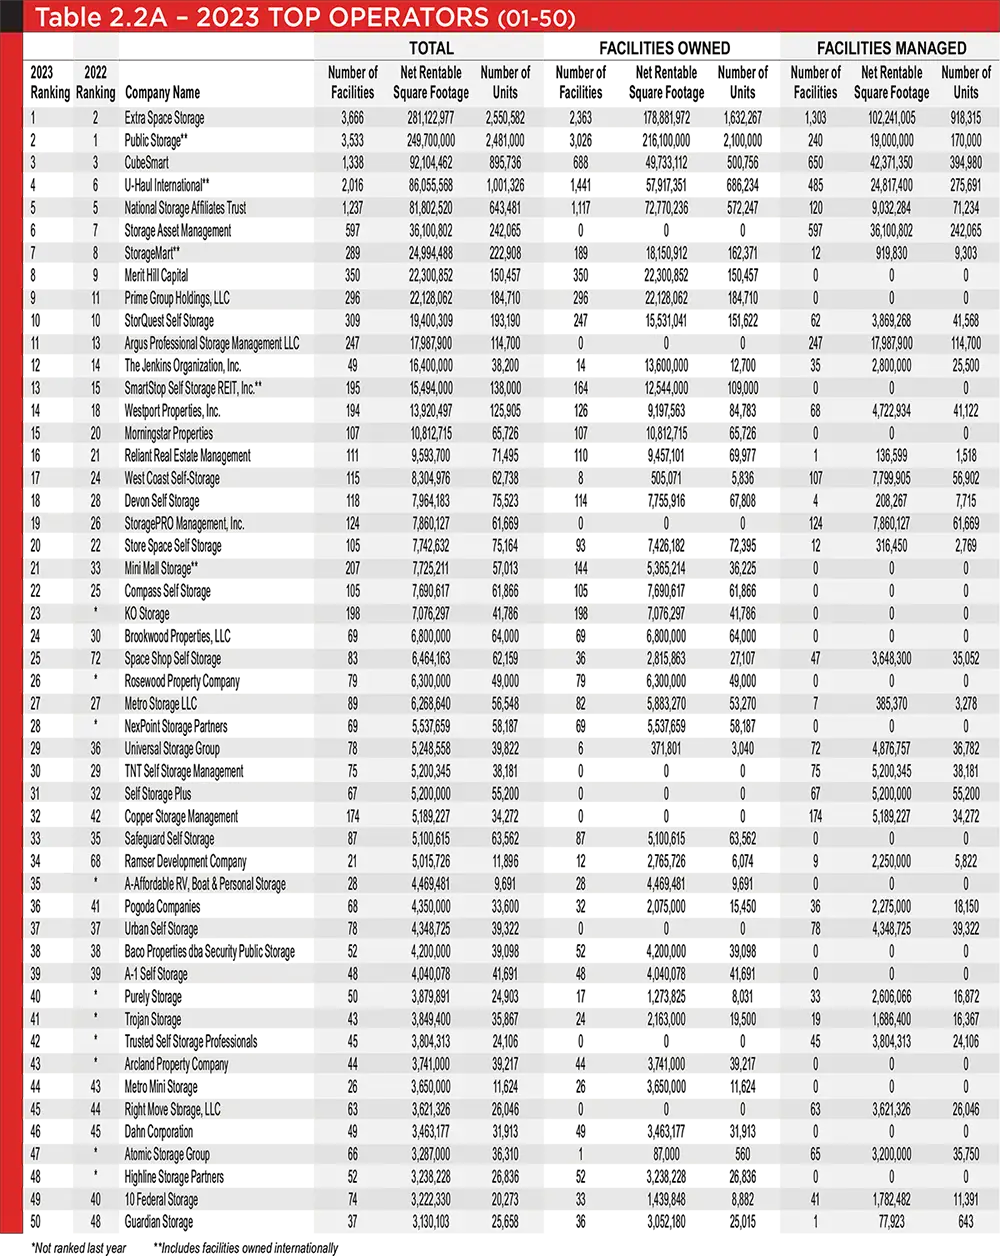
When looking at the top operators list, there are three different types of ownership entities:
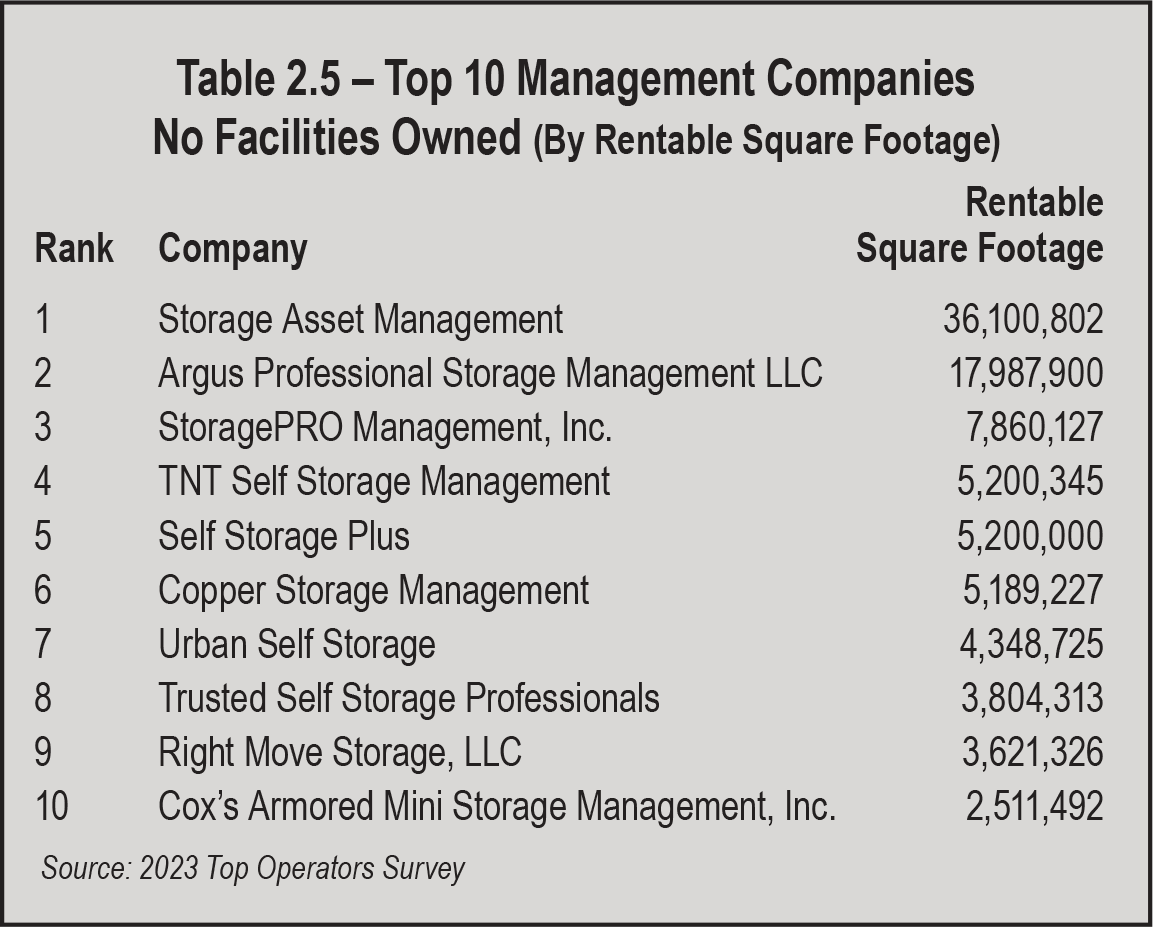
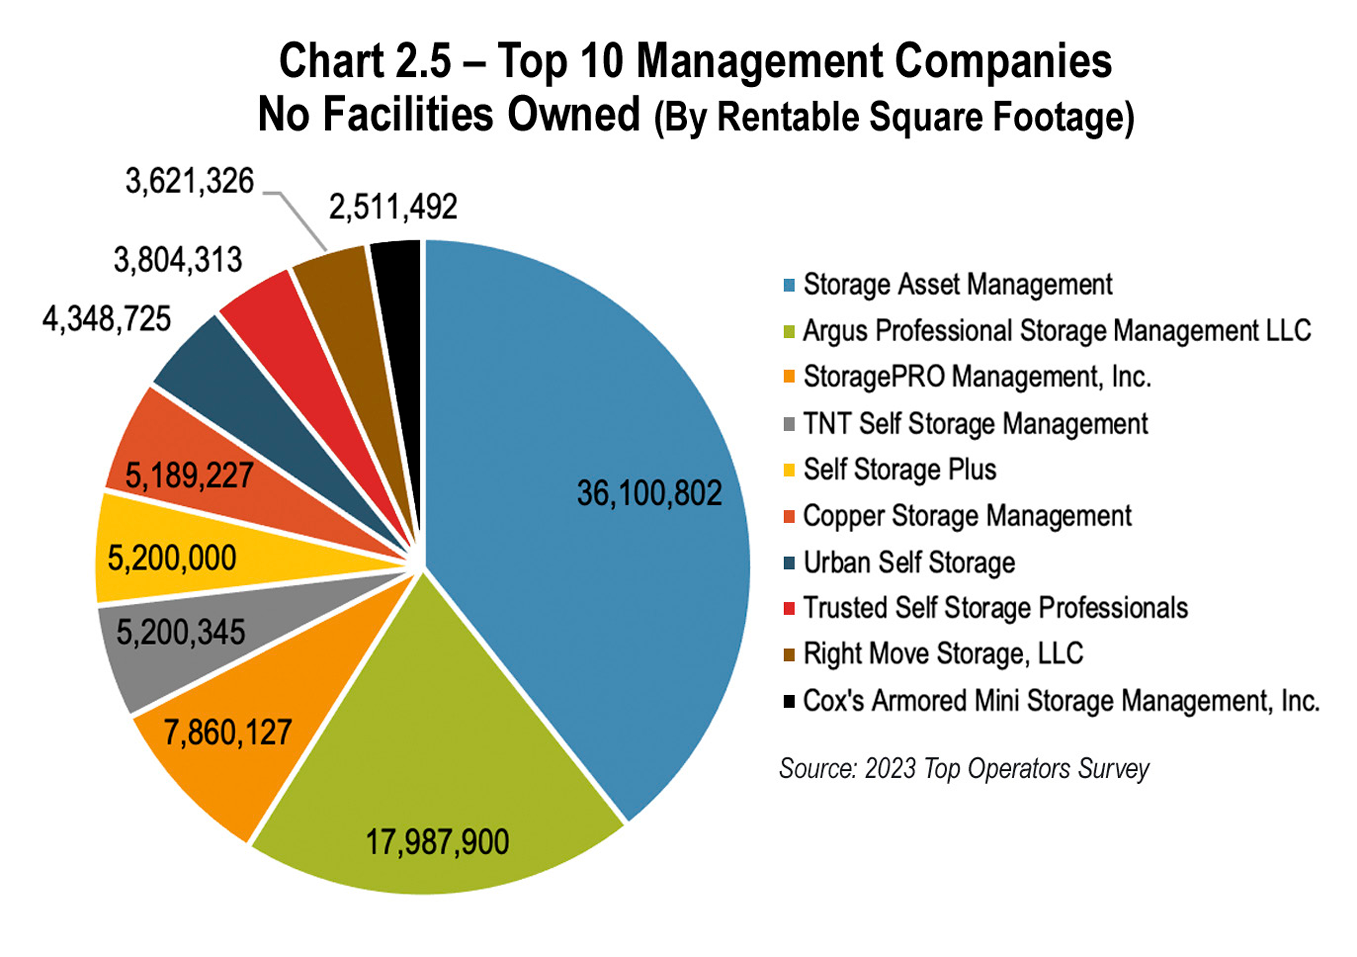
- Operators who own facilities but do not manage any third-party facilities
- Operators who manage facilities but do not own any facilities
- Operators who both own and manage facilities
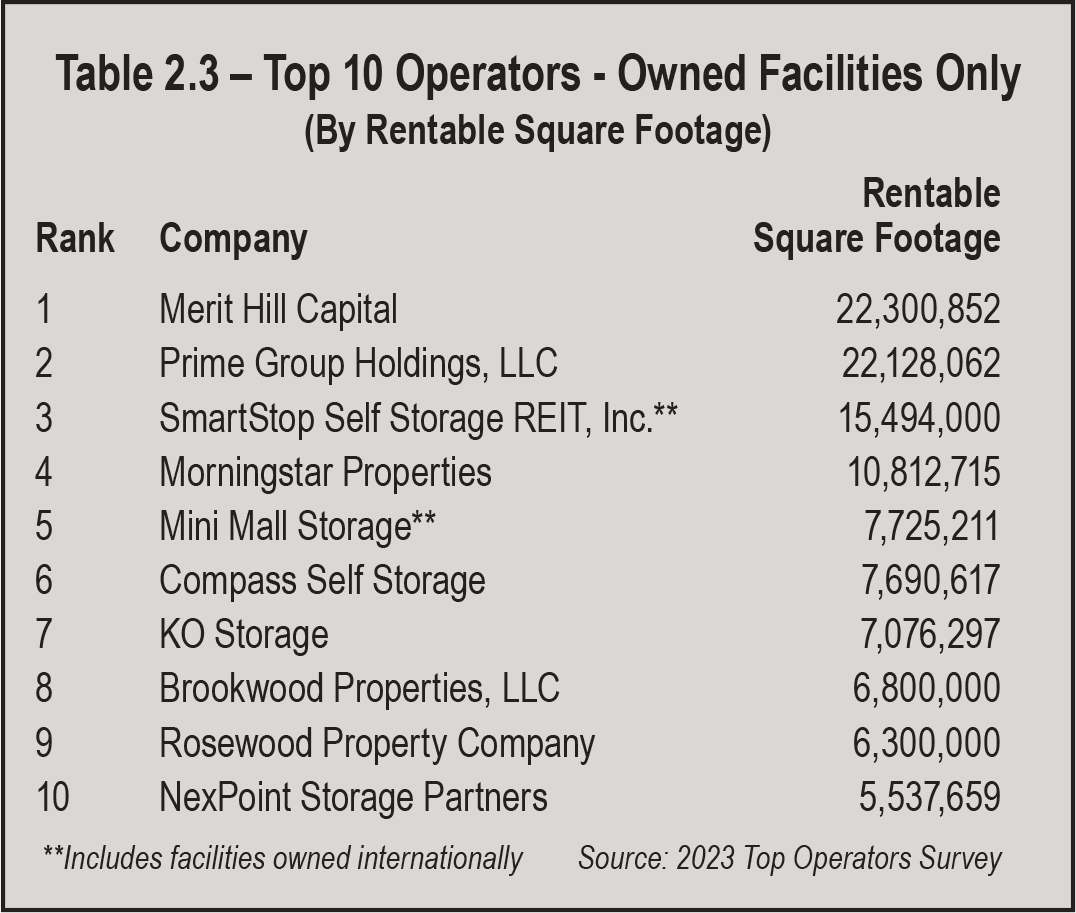
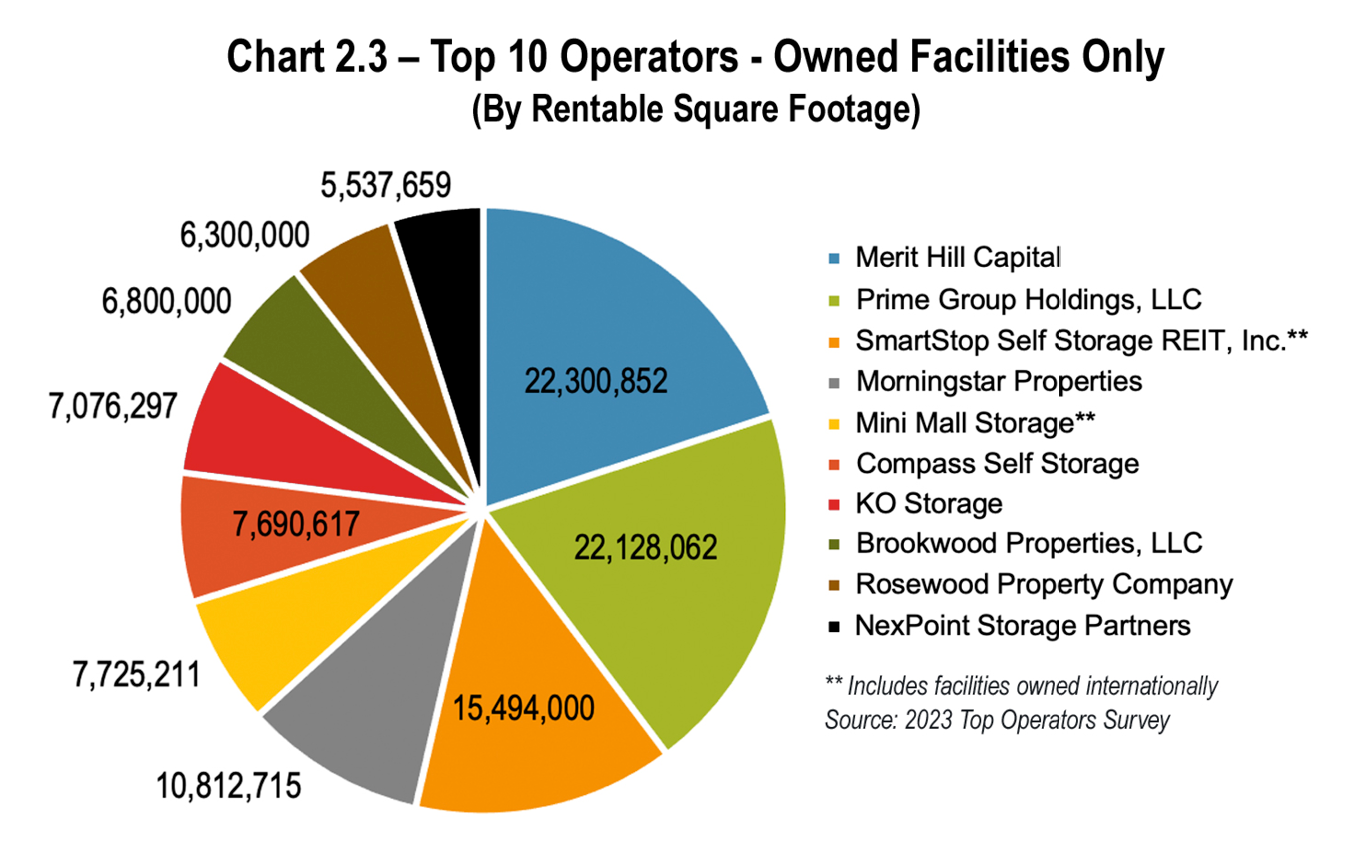
Last year, Compass Self Storage ranked 10th on this list. This year they have also impressively moved up four slots to the sixth position with 7,690,617 rentable square feet of storage space. Following right behind them in the seventh position, and new to this list, is KO Storage with 7,076,297 rentable square feet of storage space.
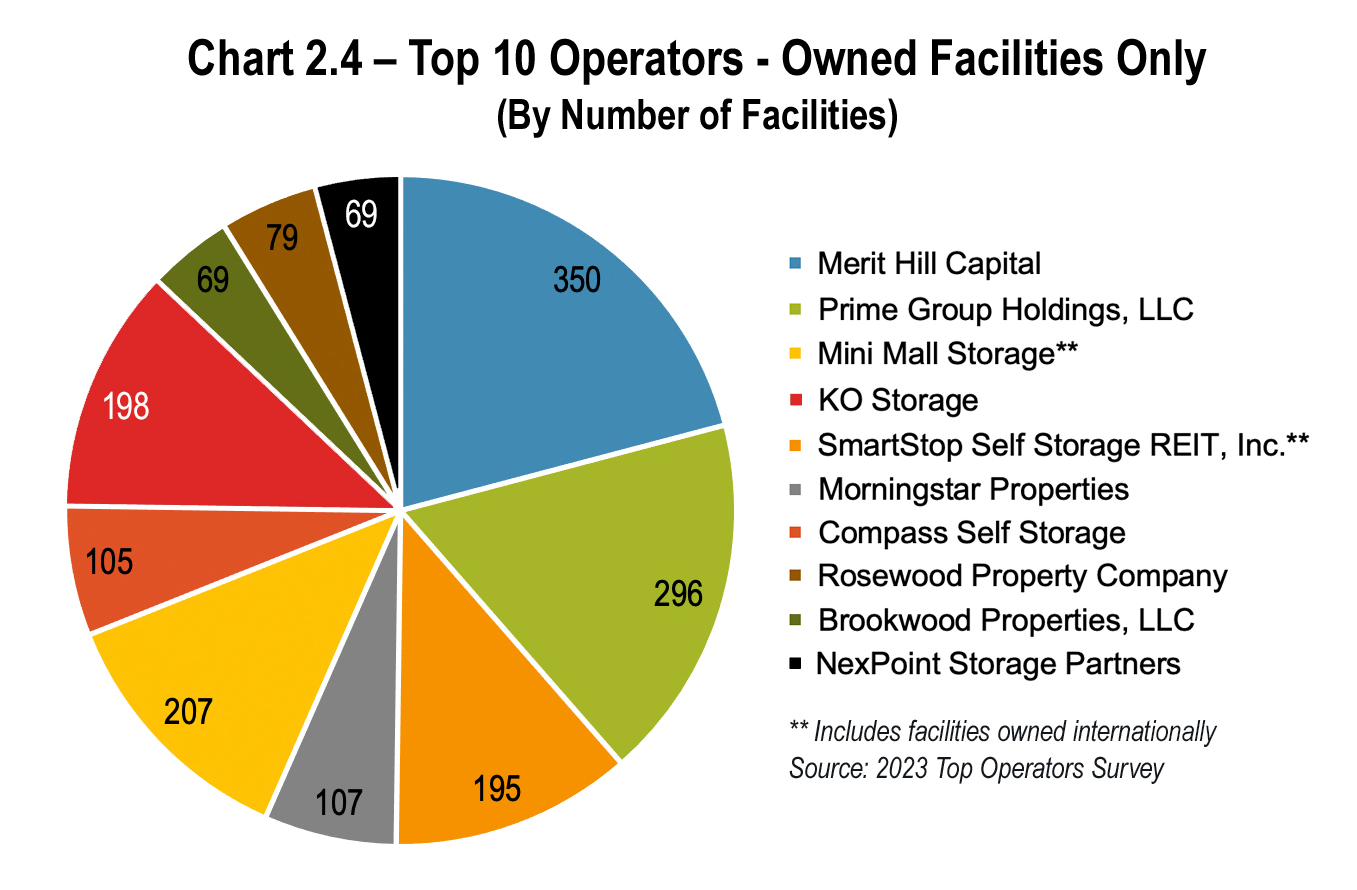
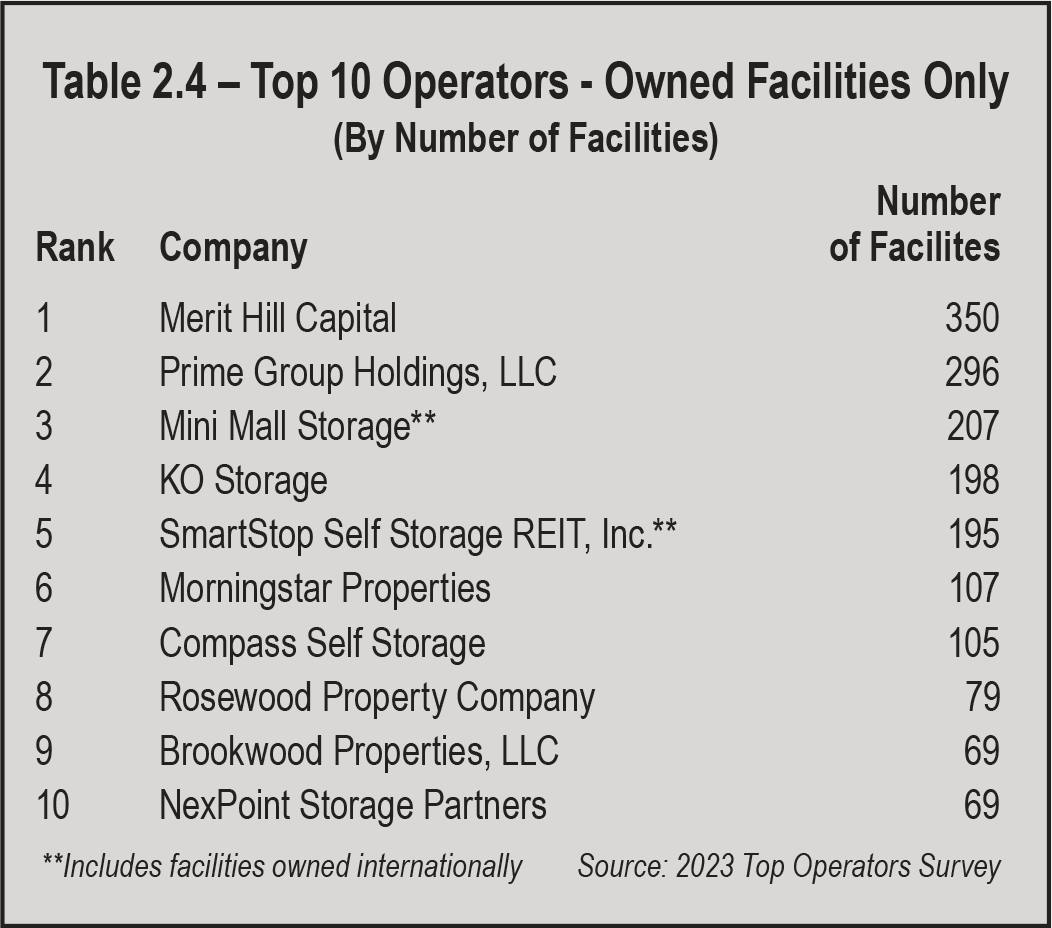
Table 2.4 and Chart 2.4 on page 23 represent the same 10 operators ranked by number of facilities owned. As we can see, the ranking on this list did not change from the list ranked by rentable square footage. The number of facilities owned range from 350 for Merritt Hill Capital to 69 for NexPoint Storage Partners.
Needless to say, we can expect to see consolidation continue in the near future. That means that now more than ever, developers and operators alike must do their due diligence in order to stay competitive in the
market.
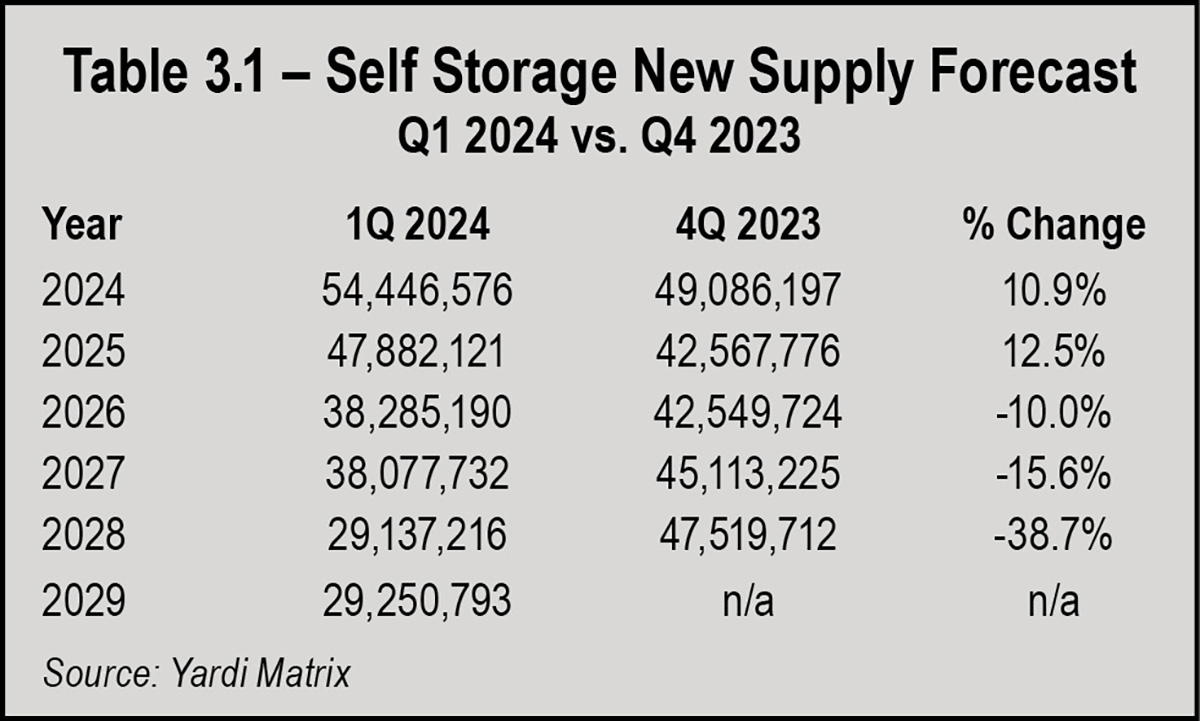
he Q1 2024 self-storage supply forecast update has increased forecast deliveries for 2024 and 2025. For the later years, the forecast has been reduced. See Table 3.1 at the right.
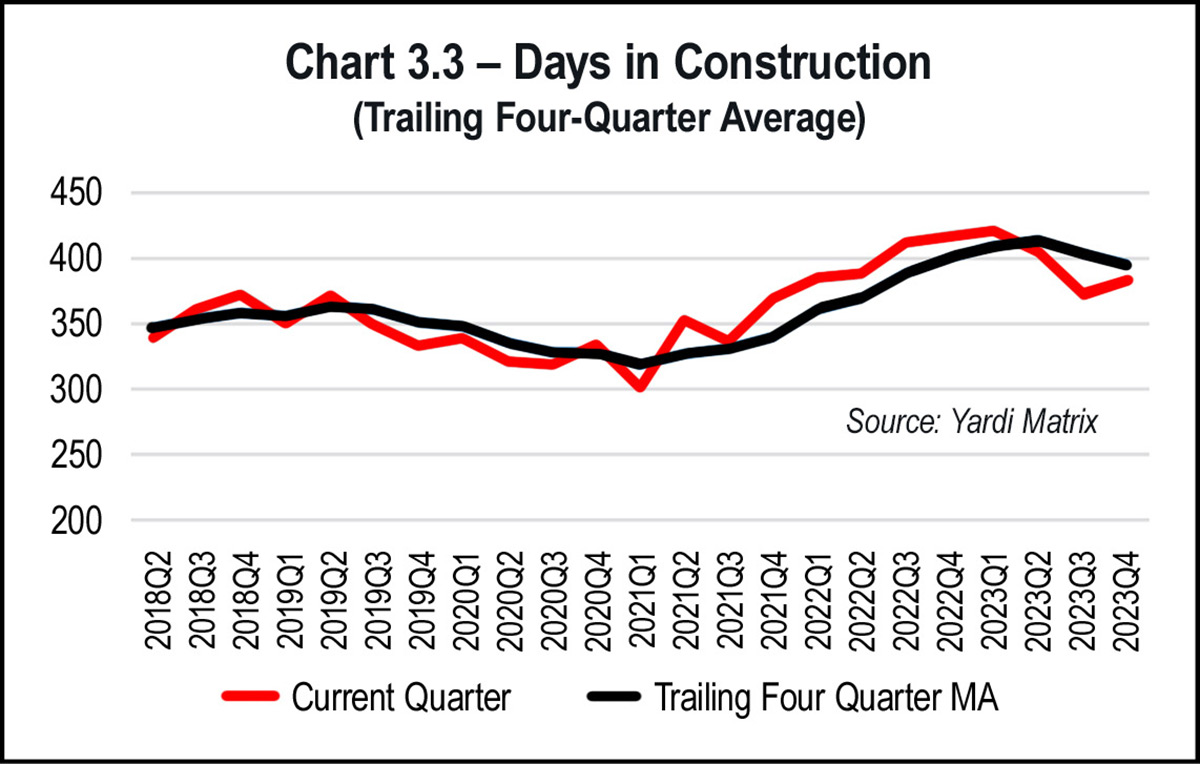
Days in construction continues to moderate, albeit at levels well above long-term averages. To date, Yardi’s database has identified 124 properties completed in Q4 2023, on average in 383 days. This is slightly above Q3 2023’s 372 average days in construction, but still below the trailing four-quarter average of 395 days. See Chart 3.3 on page 28.
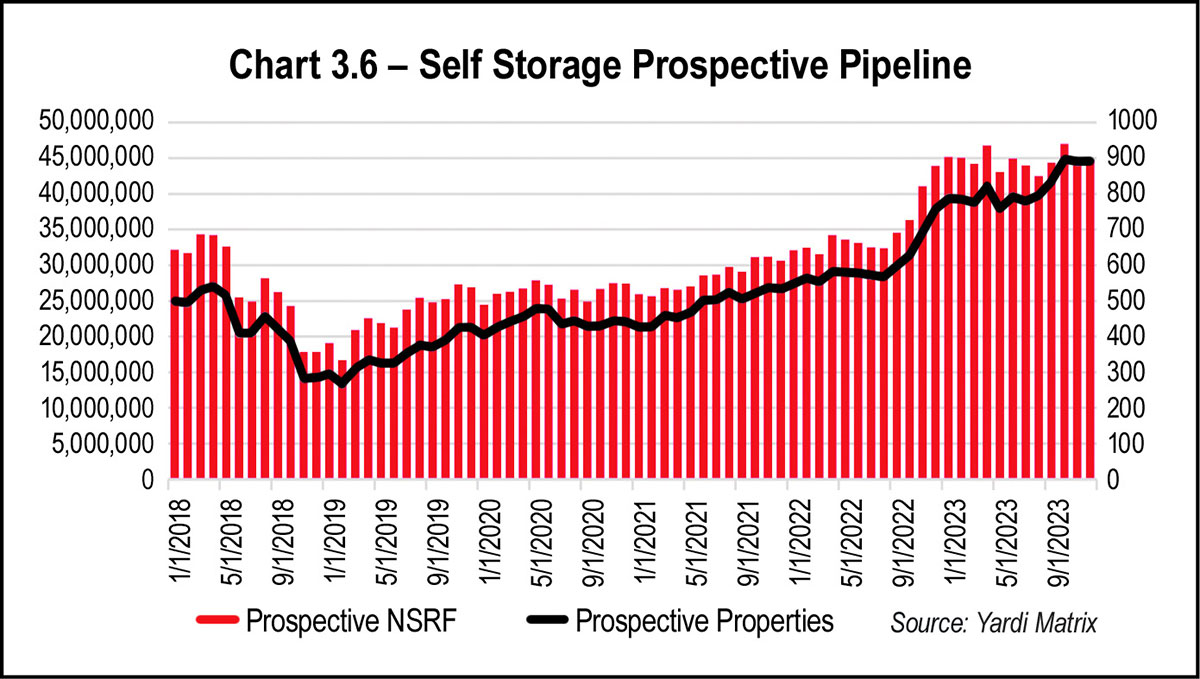
After increasing noticeably in late 2022, the prospective pipeline has been flat for most of 2023. Currently, there are 44.8 million NRSF in the prospective pipeline, a 1.0 percent increase quarter-over-quarter and a 2.06 percent increase year over year. See Chart 3.6 on the opposite page.
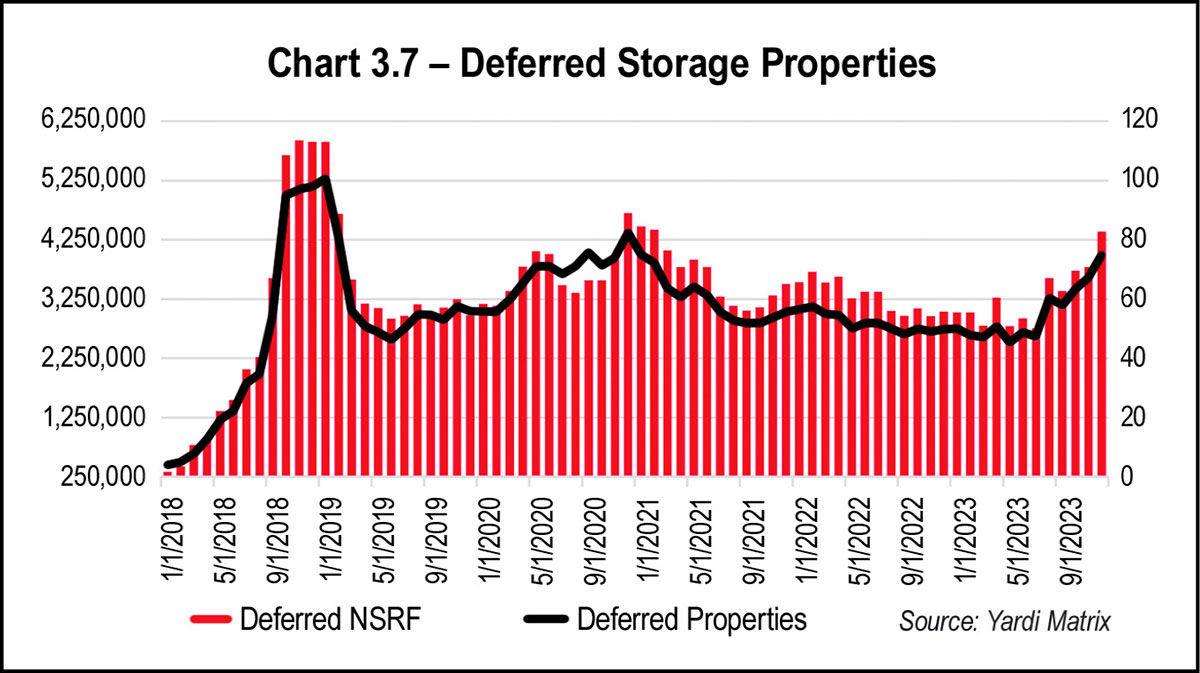
Since mid-year 2023, the number of properties with a deferred status has increased substantially. Currently, 78 properties totaling 4.39 million NRSF are categorized as deferred, a 29.6 percent increase quarter over quarter and a 44.5 percent increase year over year. See Chart 3.7 on the opposite page.
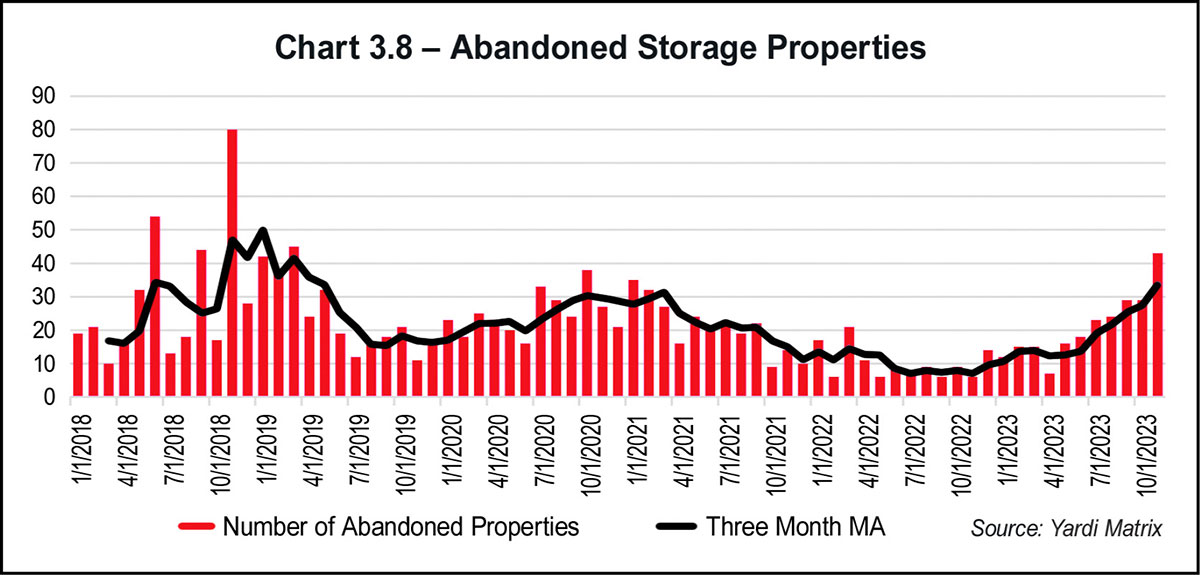
The number of abandoned storage properties increased throughout 2023. On average, eight properties per month entered abandoned status during the latter half of 2022; in November 2023, 44 properties entered abandoned status. For full year 2023, 245 properties have been categorized as abandoned, a 104.2 percent increase over the level recorded in 2022. See Chart 3.8 below right.

he year 2023 began with economic uncertainty and widespread concerns that a recession was looming. Then, in the spring, the failure of three high-profile regional banks caused further apprehension within an already skittish banking industry as well as within the public. By the last quarter, however, anxiety over rising interest rates and mounting inflation was soothed with better-than-expected indicators of an economy on the mend.
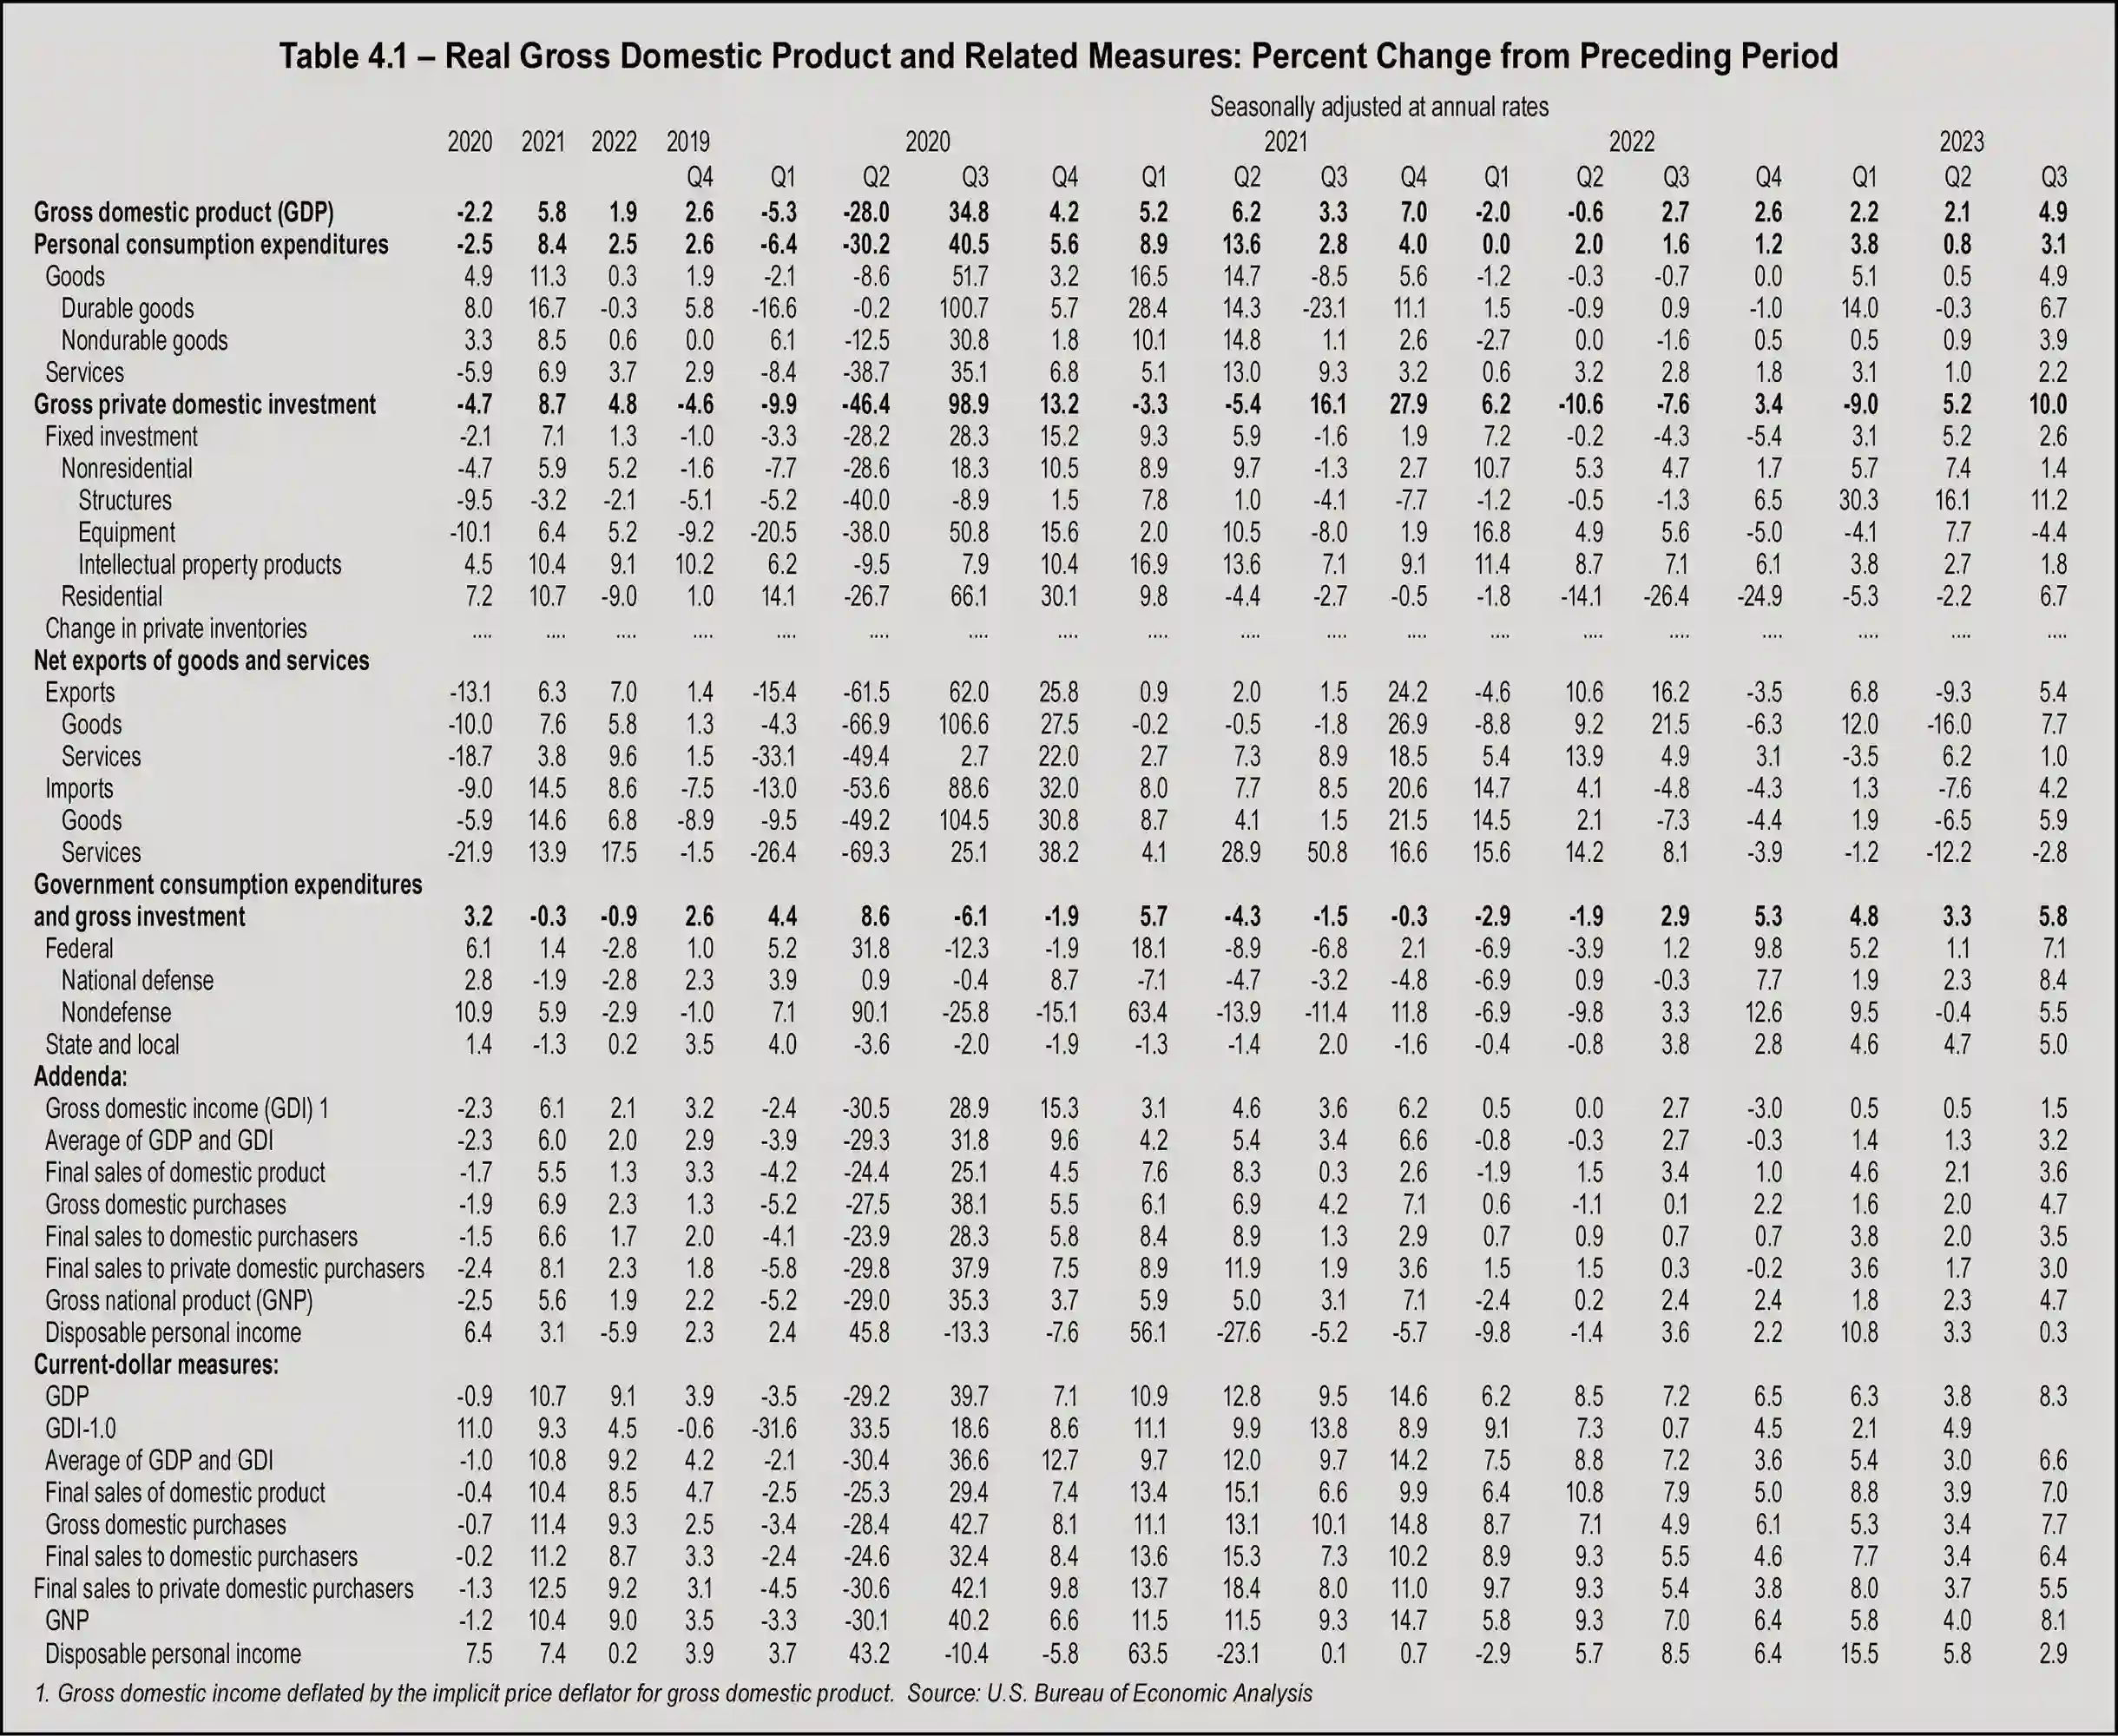
Strong consumer spending, fueled by extra money saved during the pandemic, created a surprising boost in the third quarter Gross Domestic Product (GDP) estimates. The Bureau of Economic Analysis (BEA) estimated that real GDP increased at an annual rate of 5.2 percent in the quarter. The year ended with a 2.8 percent real GDP growth, an impressive outcome considering the dismal forecasts early in the year.
The BEA attributed the increase to increases in consumer spending, private inventory investment, exports, government spending, residential fixed investment, and nonresidential fixed investment. The bureau also reported respectable increases in current-dollar personal income, disposable personal income, and personal savings.
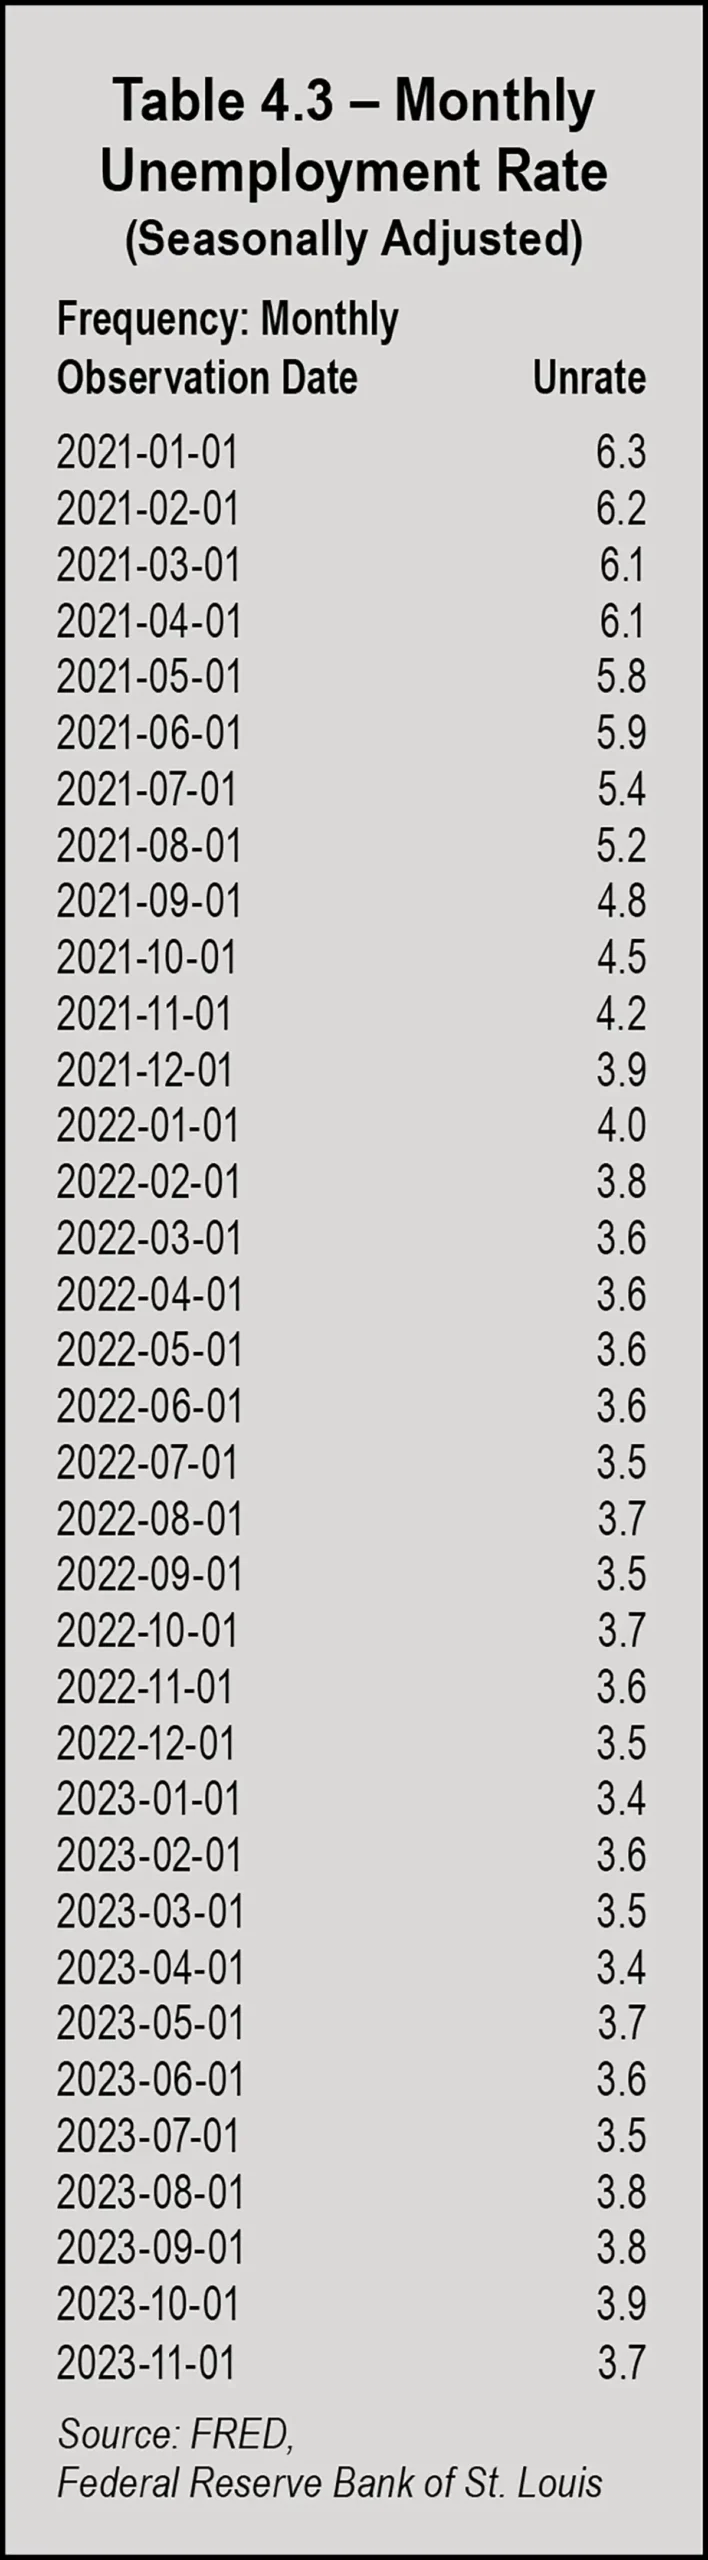
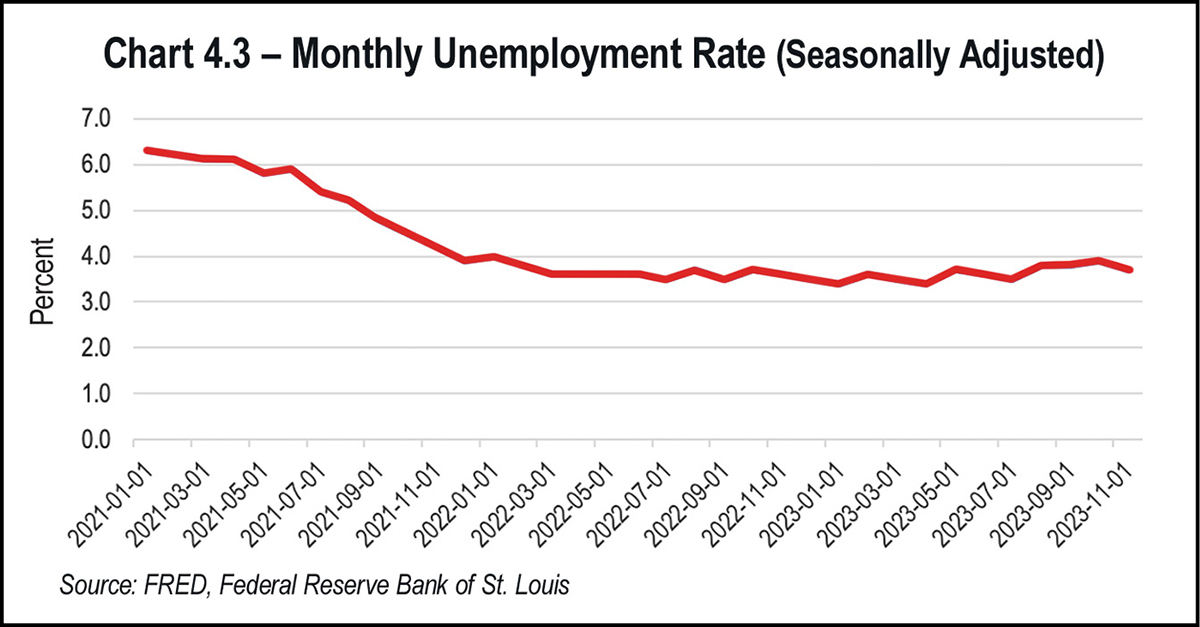
Inflation, which had reached as high as 9.1 percent in June 2022, also began slowing after the Federal Reserve (Fed) took on an aggressive strategy and raised the policy rate/overnight rate by 5.25 percent beginning in March 2022. Hopes that this action would cool down the economy enough to slow down inflation seemed to be realized. In December, the Fed announced that further rate hikes were unlikely, and hinted at the possibility of three rate cuts in 2024. The news provoked a rally in the markets, with the S&P 500 ending the year with a gain of more than 24 percent and the Dow with a 13.7 percent gain and a new record high.
The soft landing in a year that began with gloomy predictions caused many to marvel at the resiliency of the U.S. economy.
Other economic indicators for the third quarter 2023, as reported by the BEA, include a current-dollar GDP increase of 8.3 percent at an annual rate, to a level of $27.61 trillion. The price index for gross domestic purchases increased 2.9 percent.
The personal consumption expenditures (PCE) price index increased 2.6 percent in the third quarter. Current-dollar personal income increased $196.2 billion, disposable personal income increased $143.5 billion (or 2.9 percent), and real disposable personal income increased 0.3 percent. The personal saving rate, which is personal saving as a percentage of disposable personal income, rose by 4.2 percent in the third quarter.
Corporate profits are a critical economic indicator. The BEA reported that profits from current production (corporate profits with inventory valuation and capital consumption adjustments) increased $108.7 billion in the third quarter of 2023. Profits of domestic financial corporations increased $9.0 billion in the third quarter, and profits of domestic nonfinancial corporations increased $90.8 billion. These numbers suggest that U.S. companies were able to adjust to the new reality of higher wages and higher borrowing costs.
However, the year ended with mixed signals. The Conference Board Leading Economic Index® (LEI) for the U.S. declined by 0.5 percent in November 2023 to 103.0 percent, following a decline of 1.0 percent in October. In a press release, The Conference Board announced that the LEI contracted by 3.5 percent over the six-month period between May and November 2023, a smaller decrease than its 4.3 percent contraction over the previous six months from November 2022 to May 2023.
The release further stated that stock prices made virtually the only positive contribution to the index in the month. In the fourth-quarter rally, REITs outperformed the broader market when the Dow Jones Equity All REIT Index closed with a 17.9 percent total return, while the S&P 500 closed with an 11.7 percent return. The strong fourth quarter allowed U.S. real estate investment trust stocks an 11.3 percent return for 2023 overall. The sector underperformed the S&P 500’s 26.3 percent return in 2023.
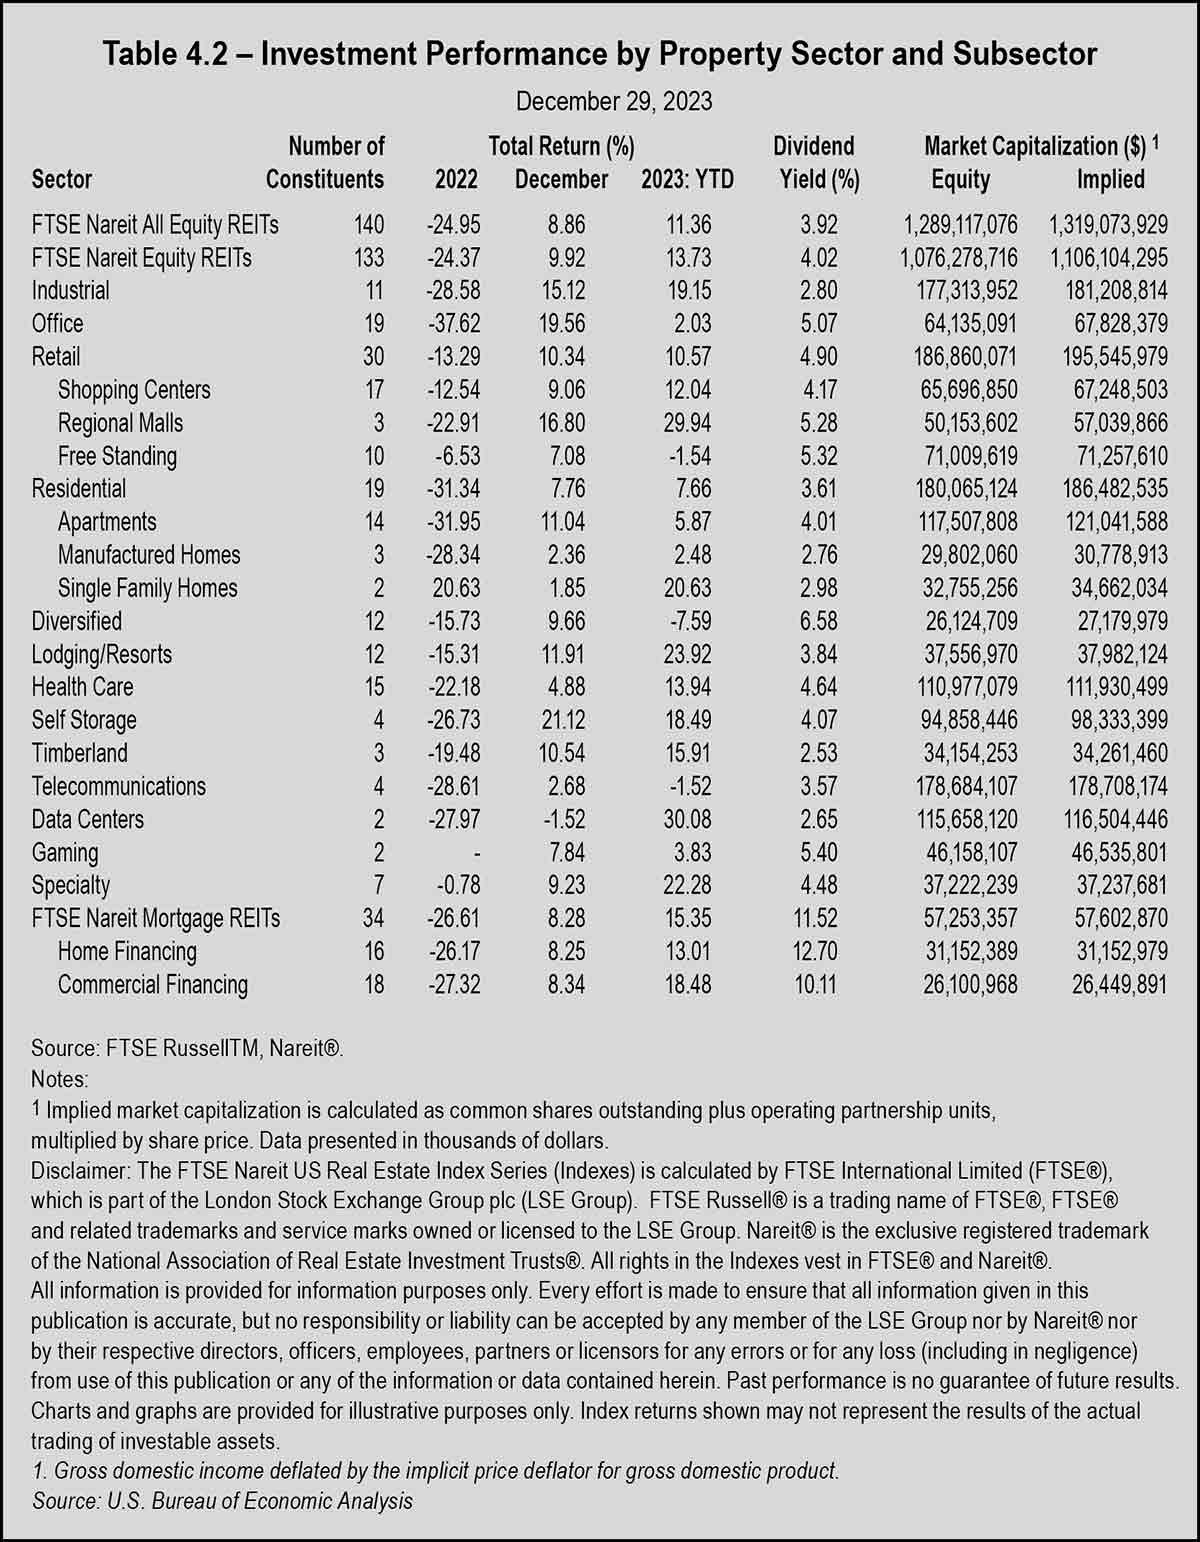
Topping the fourth-quarter REIT returns was The Dow Jones US Real Estate Regional Malls Index, closing at 34.3 percent. The self-storage REIT index was the second-best performer of the quarter with a 22.6 percent return, and the office REIT index came in third with a 22.4 percent return.
Among the self-storage REITs, Extra Space Storage Inc. recorded a return of 33.3 percent, with National Storage Affiliates close behind at 32.5 percent. CubeSmart logged a 22.9 percent return, and Public Storage closed the fourth quarter with a 17 percent return. The one-year return for Extra Space was 13.8 percent, while National Storage closed the year with an annual return of 21.8 percent.
The situation reached a climax in 2022, when the all items index increased 9.1 percent for the 12-month period ending June 2022—the largest 12-month increase since November 1981. The pressure put on consumers and business owners who had to pay higher prices for just about everything created widespread dissatisfaction with the economy and a dismal outlook. This, in turn, affected consumer spending, business hiring practices, and several other aspects of corporate and consumer behavior.
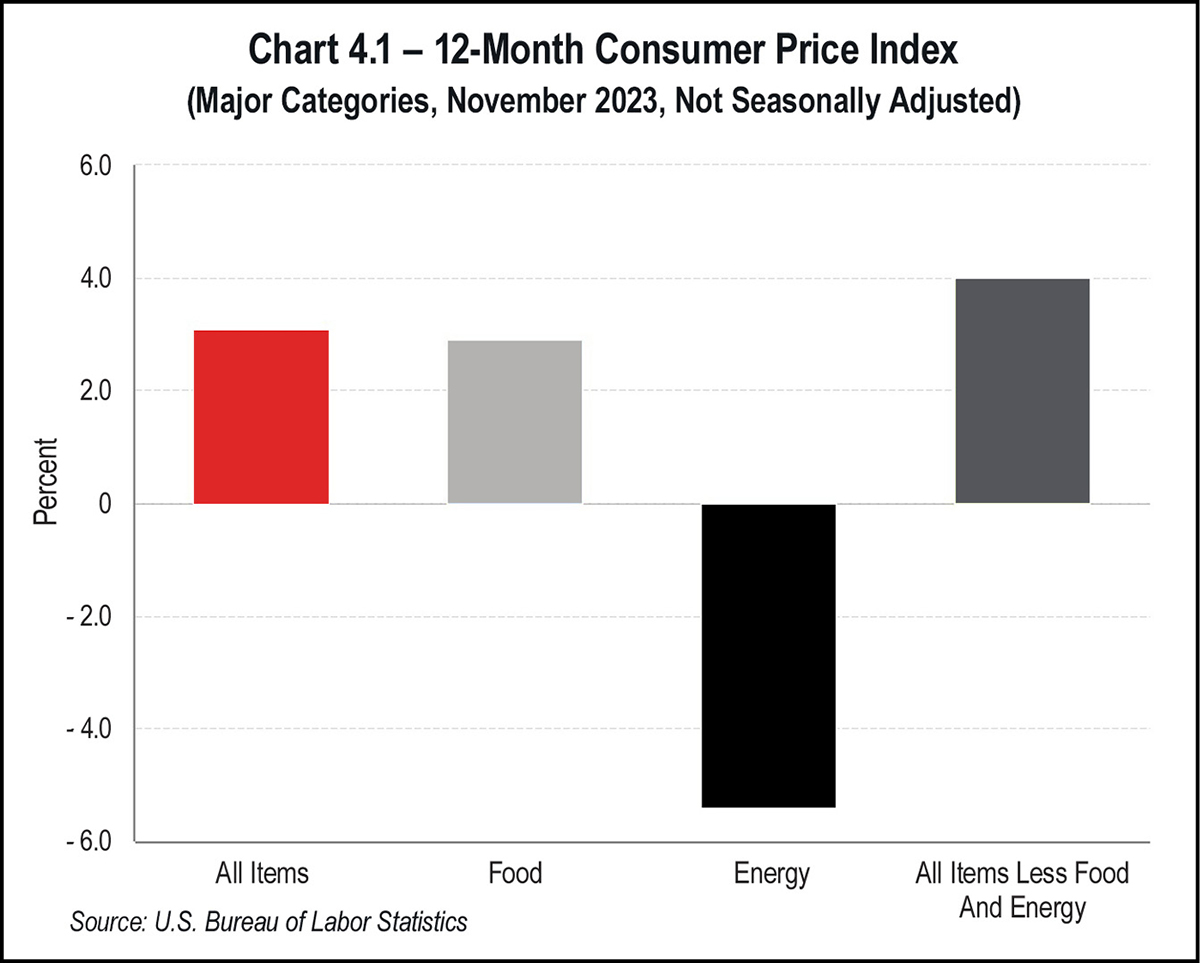
In December, the U.S. Bureau of Labor Statistics (BLS) released 12-month percentage change numbers for the Consumer Price Index through November 2023. The Consumer Price Index for All Urban Consumers (CPI-U) increased 0.1 percent in November on a seasonally adjusted basis. Prices for all items less food and energy rose 4.0 percent over the 12-month period. Energy prices decreased 5.4 percent for the period, while food prices increased 2.9 percent over the previous year.
Prices for energy commodities fell 9.8 percent over the year, led by an 8.9 percent decrease in gasoline and a 24.8 percent decrease in fuel oil. In commodities less food and energy commodities, prices for new vehicles rose 1.3 percent, while prices for used cars and trucks fell 3.8 percent. In services less energy services, prices for shelter rose 6.5 percent, while medical care services prices fell 0.9 percent over the year.
The inflation relief came partly from supply improvements. Although demand for many goods and services increased in the second half of 2020, supply was limited by disruptions in supply chains and by production shortfalls fueled by workforce shortages. Since the demand for goods and services increased at a faster rate than the market could supply, the result was higher prices.
Although the rate of inflation cooled in 2023, it was still higher than the modest 2 percent target rate the Fed prefers. The prices consumers paid for basic goods and services were still higher than in 2019, with no indication that the costs may return to previous levels. This hardship on consumers was a factor in consumer sentiment as the year began; however, the year ended with consumer sentiment on the rise.
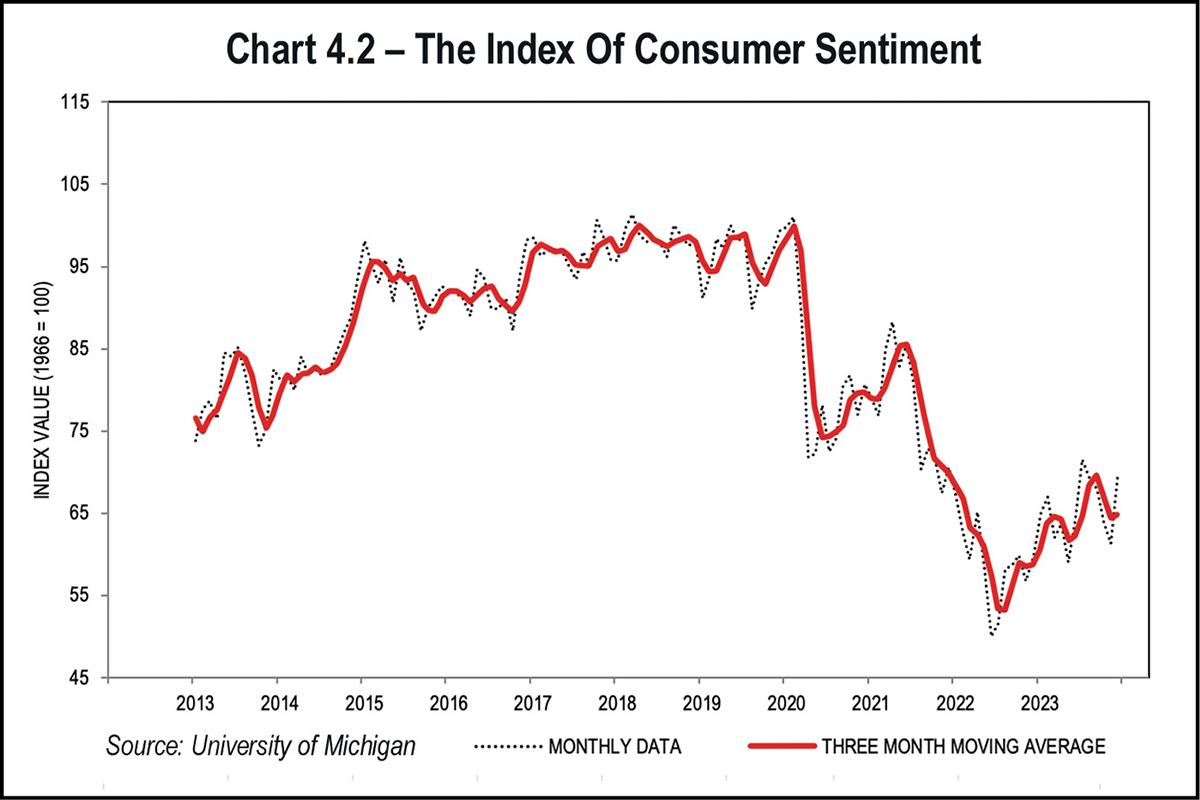
In another measure of consumer sentiment, The Conference Board’s Consumer Confidence Index® increased to 110.7 in December, marking a five-month high as the year ended. The index rose 9.7 points from November—the largest monthly increase in nearly three years. The Present Situation Index, which is based on consumers’ assessment of current business and labor market conditions, rose to 148.5 in December from 136.5 in November. The Expectations Index, which measures consumers’ short-term outlook for income, business, and labor market conditions, climbed to 85.6 in December from 77.4 in November. This was significant because a level of 80 or below for the Expectations Index historically signals a recession within the next year.
Personal income increased by $81.6 billion (0.4 percent at a monthly rate) in November, according to BEA estimates. Disposable personal income (DPI), personal income less personal current taxes, increased by $71.9 billion (0.4 percent). Personal consumption expenditures (PCE) increased $46.7 billion (0.2 percent). The personal saving rate—personal saving as a percentage of disposable personal income—was 4.1 percent for November.
The $46.7 billion increase in current-dollar PCE in November reflected an increase of $58.8 billion in spending for services and a decrease of $12.1 billion in spending for goods. The largest contributors to the increase in services spending were housing and utilities, food services, and accommodations. Within goods, the leading contributor to the decrease was a decrease in the price of gasoline and other energy goods.
Total nonfarm payroll employment increased by 199,000 in November 2023, which was below the average monthly gain of 240,000 over the prior 12 months. Job gains in November reflected increases in health care and government employment, as well as manufacturing.
Health care added 77,000 jobs, which was above the average monthly gain of 54,000 over the prior 12 months. Government employment increased by 49,000 in November, slightly lower than the average monthly gain of 55,000 over the prior 12 months. Employment in manufacturing rose by 28,000 in November, reflecting an increase of 30,000 in motor vehicles and parts as workers returned from a strike. Employment in manufacturing showed little net change over the year.
Retail trade employment declined by 38,000 in November and showed little net change over the year. Employment in transportation and warehousing decreased as a category, but it reflected a gain in air transportation that offset a job loss of 8,000 workers from the warehousing and storage category. In November, employment in transportation and warehousing had declined by 61,000 since a peak in October 2022.
According to ManpowerGroup, 77 percent of employers were struggling to fill job vacancies in 2023. The U.S. labor shortage sat at 75 percent, just under the global average. Data also suggested that 57 percent of employers offered more flexibility at work when it comes to location (hybrid or remote) and hours, offering part-time schedules and flexible hours. Other strategies for dealing with a labor shortage included hiring older workers, training existing employees for higher-level jobs, and outsourcing.
The U.S. Chamber of Commerce conducts research on the trends on job openings, labor force participation, quit rates, and more. In May 2022, the Chamber surveyed unemployed workers who lost their jobs during the pandemic to gain insight on why they had not returned to work. Key findings included:
- Two thirds (66 percent) of Americans who lost their full-time job during the pandemic said they were only somewhat active or not very active at all in searching for a new job.
- About half (49 percent) were not willing to take jobs that do not offer the opportunity for remote work.
- More than one-fourth (26 percent) said it will never again be essential for them to return to work.
- Nearly one in five had altered their livelihood, 17 percent had retired, 19 percent had transitioned to homemaker, and 14 percent were working part time.
- Almost one-fourth (24 percent) said government aid packages during the pandemic had incentivized them to not actively look for work.
- Younger respondents, aged 25 to 34, were prioritizing personal growth over searching for a job at the time; 36 percent said they were more focused on acquiring new skills, education, or training before re-entering the job market.
An aging workforce opting for early retirements has had a significant impact on the labor force. By October 2021, the pandemic had driven more than 3 million adults into retiring before they had originally planned. The number of adults 55 and older no longer in the workforce had reached 50.3 percent by the third quarter of 2021. Because the average age of the population is steadily increasing, this trend will likely continue.
Many workers left jobs in 2023 to find better opportunities. More than 34 million Americans quit their jobs over the year; however, the hiring rate has outpaced the quit rate since November 2020.
By July, the prime rate had risen to 8.5 percent, creating havoc in many industries but hitting commercial real estate particularly hard when the cost of capital reached its highest level in over two decades. The year ended with the prime rate remaining at 8.5 percent. The favorable self-storage lending climate buyers and developers had enjoyed for several years ended at a time when more than $200 billion in fixed-rate CMBS debt was set to mature over the following 18 months.
Industry experts predict that the self-storage industry will go through a tough adjustment period as rates become normalized. The expectation is that in 2024 or 2025, rates will adjust closer to the historical average.
Consumers, too, were hit hard by rising interest rates. The average credit card rate rose from 16.34 percent in March 2022 to nearly 21 percent. Consumers ended the year with $100 billion more in credit card debt. Mortgage rates jumped from around 3 percent to nearly 8 percent, while rates for auto loans reached 7.72 percent and federal student loan rates rose from 3.73 percent to 5.5 percent.
In December, the Fed announced that it didn’t foresee any further rate hikes and hinted at four rate cuts in 2024. The markets rallied as a result of the announcement, and U.S. equities closed not far from all-time highs. The Fed’s median Summary of Economic Projections shows the federal funds rate falling three-quarters of a percentage point to 4.6 percent by the end of 2024 and to 3.6 percent in 2025.
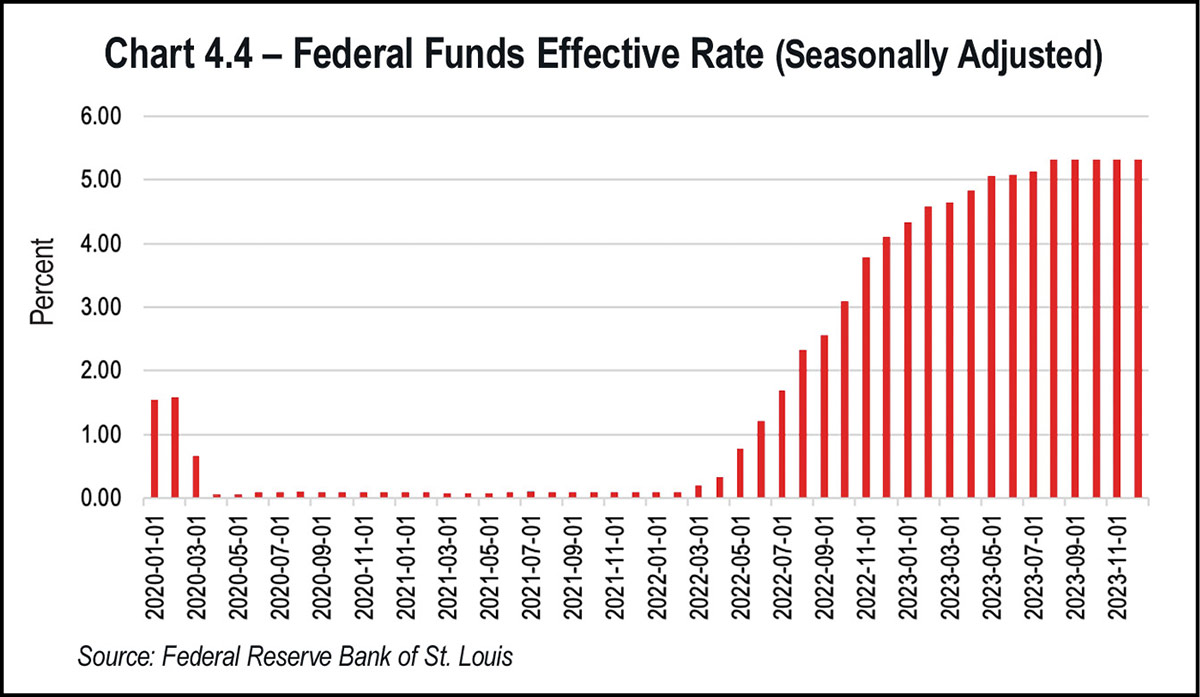
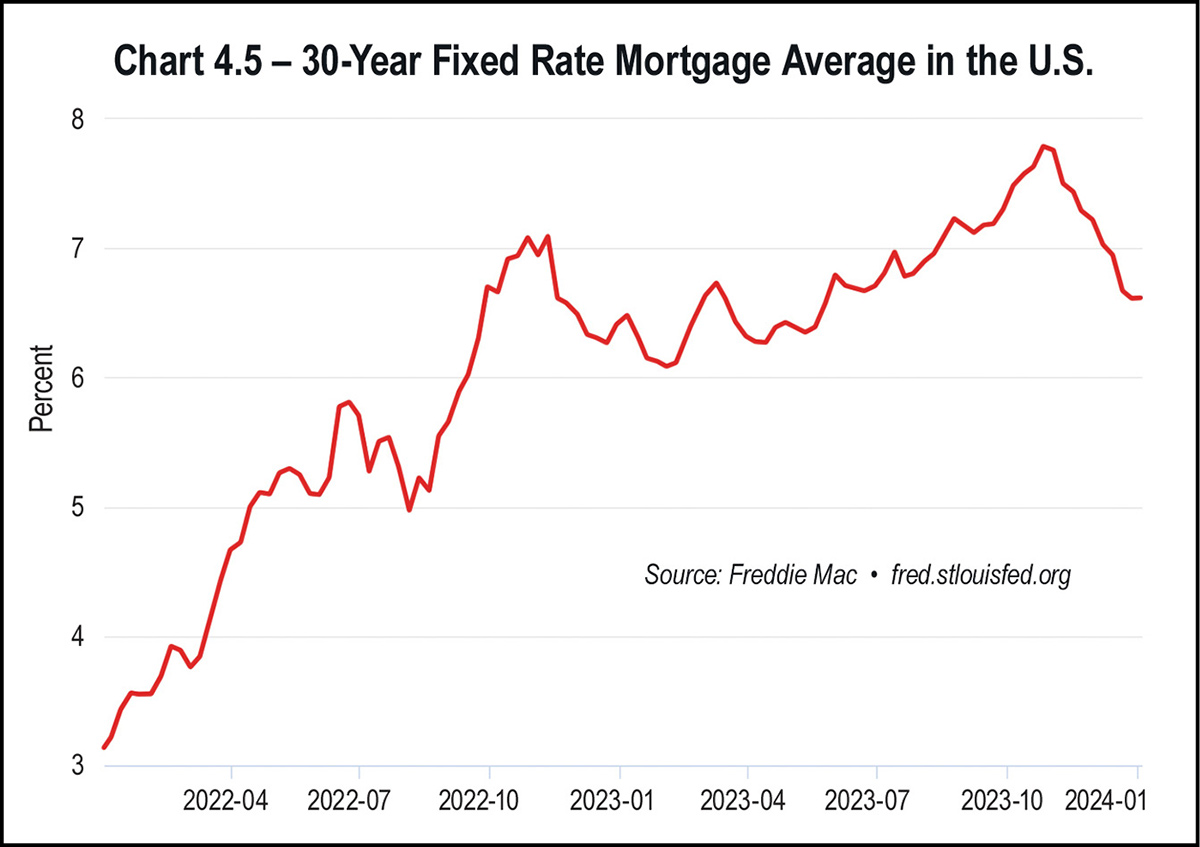
In early January 2022, the 30-year fixed mortgage rate stood at 3.22 percent and escalated until it reached a high of 7.79 percent in October. With median home prices over $400,000, purchasing a home became unfeasible for many would-be buyers. Average monthly mortgage payments reached an all-time high of $2,735 in mid-October.
By August, when rates topped 7 percent, homebuyers needed to earn over $114,000 annually to afford a median-priced home. U.S. families with two people had an annual median income of $75,143 in 2023. In addition to income barriers, banks also tightened lending requirements, forcing first-time buyers out of the market.
Some relief came when the Fed announced the end of its rate cuts and mortgage rates began to fall. By Dec. 28, 2023, the average rate for a 30-year fixed loan was 6.61 percent after reaching a high of 8.45 percent in October. For 15-year fixed-rate loans, December’s rate dropped to 5.95 percent. Mortgage rates, however, are just one hurdle would-be buyers face. As Sam Khater, Freddie Mac’s Chief Economist, noted in a press release, “While lower mortgage rates are welcome news, potential homebuyers are still dealing with the dual challenges of low inventory and high home prices that continue to rise.”
The year began with a median home price of $361,200 in January 2023 and peaked at $410,000 in June, after which median home prices began to fall. At the end of November, the median home price was $387,600, nearly $30,000 higher than the median home price in November 2022 of $358,200, but better than the year’s $410,000 high. The record highest median home price was seen in June 2022 at $413,800.
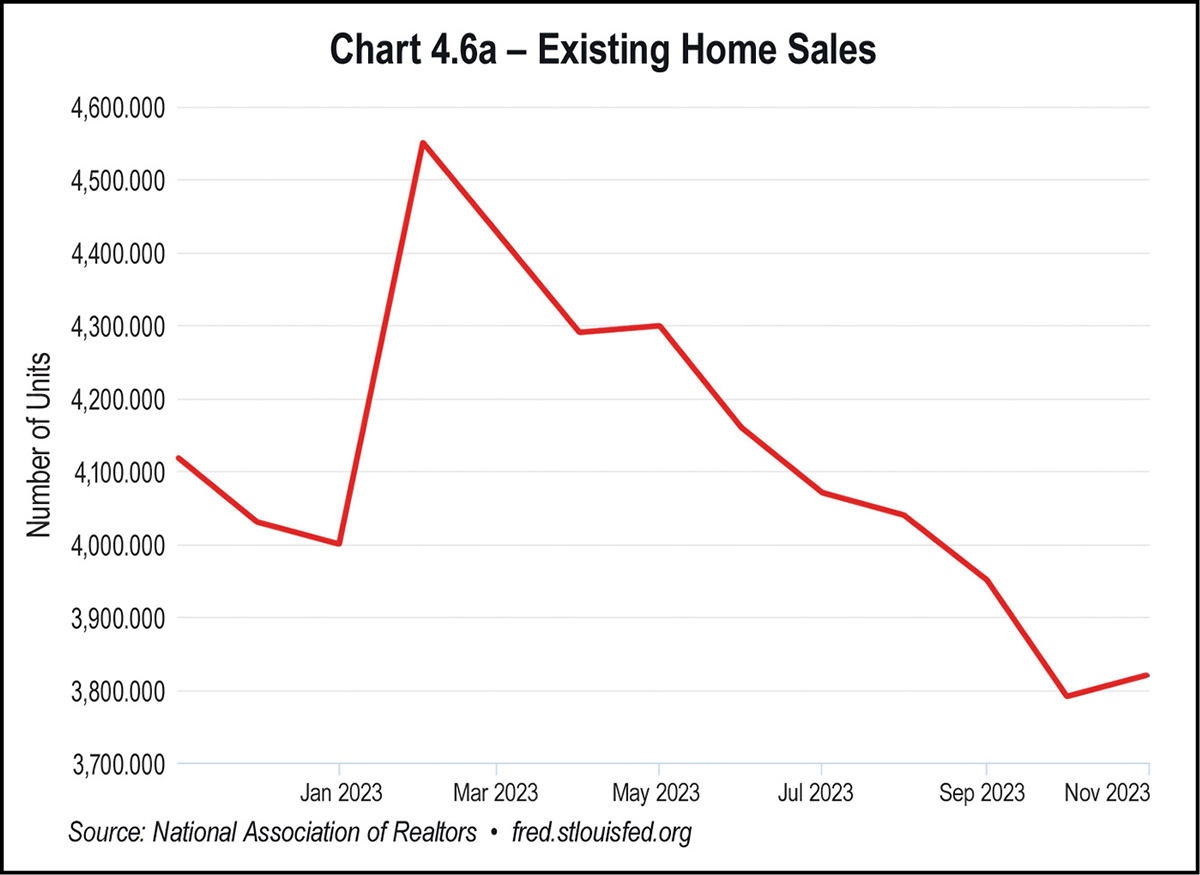
Home prices and other negative factors affecting the market resulted in both new and existing home sales plummeting in 2023, following a previous drop in 2022. In September 2023, total home sales were down 10 percent on a year-over-year basis; the National Association of Realtors (NAR) reported that existing home sales were at their lowest level in 13 years.
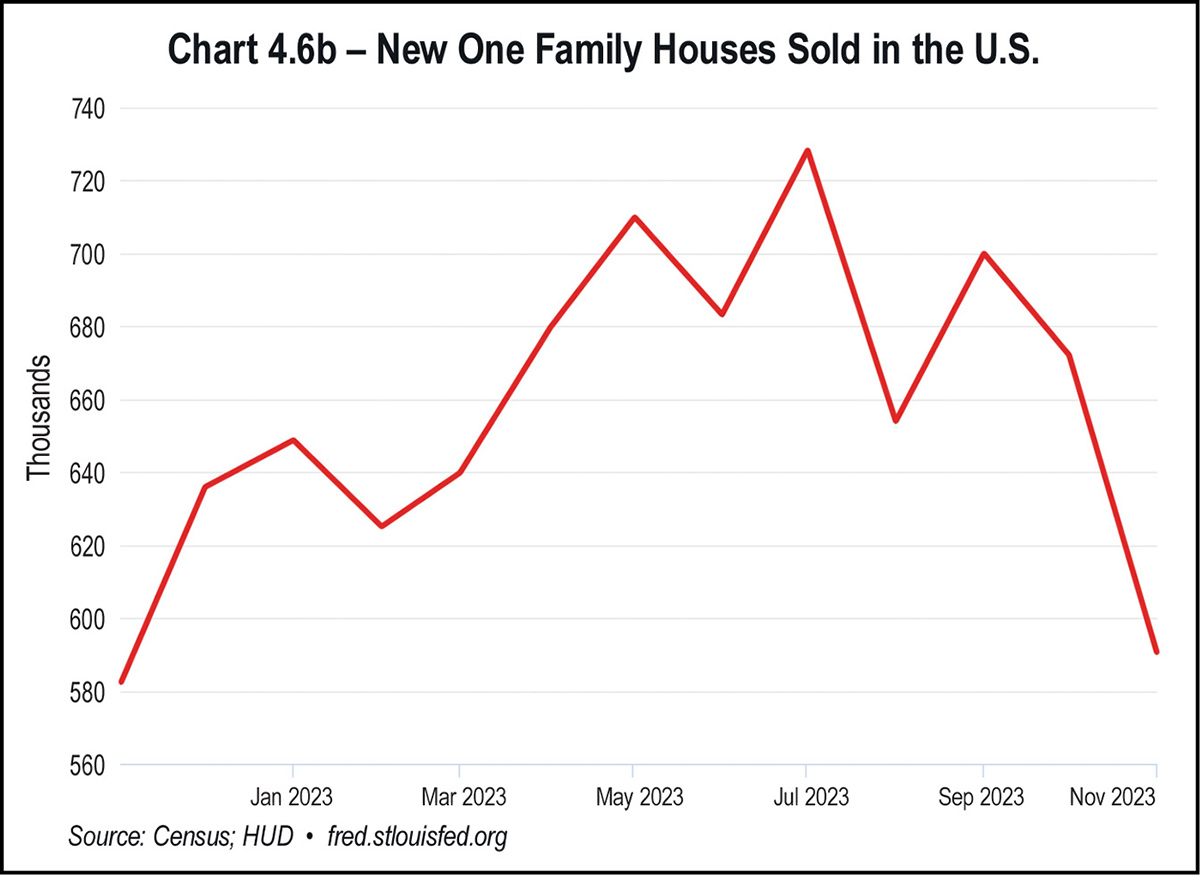
Although the share was larger, selling was a challenge. The National Association of Homebuilders reported that in October, 32 percent of builders cut home prices at an average price discount of 6 percent. Even after price cuts, November sales of new single-family houses were down 12.2 percent from October. With decreased demand, builders have had no incentive to return to previous construction levels.
The numbers of new home sales dropped consistently throughout 2023, with month-over-month decreases ranging from 10 percent to 25 percent. Existing home sales drops were even more precipitous, ranging from 16 percent in August to 33 percent in January. Although down from previous periods, Dallas and Houston remained the top MSAs for new home sales.
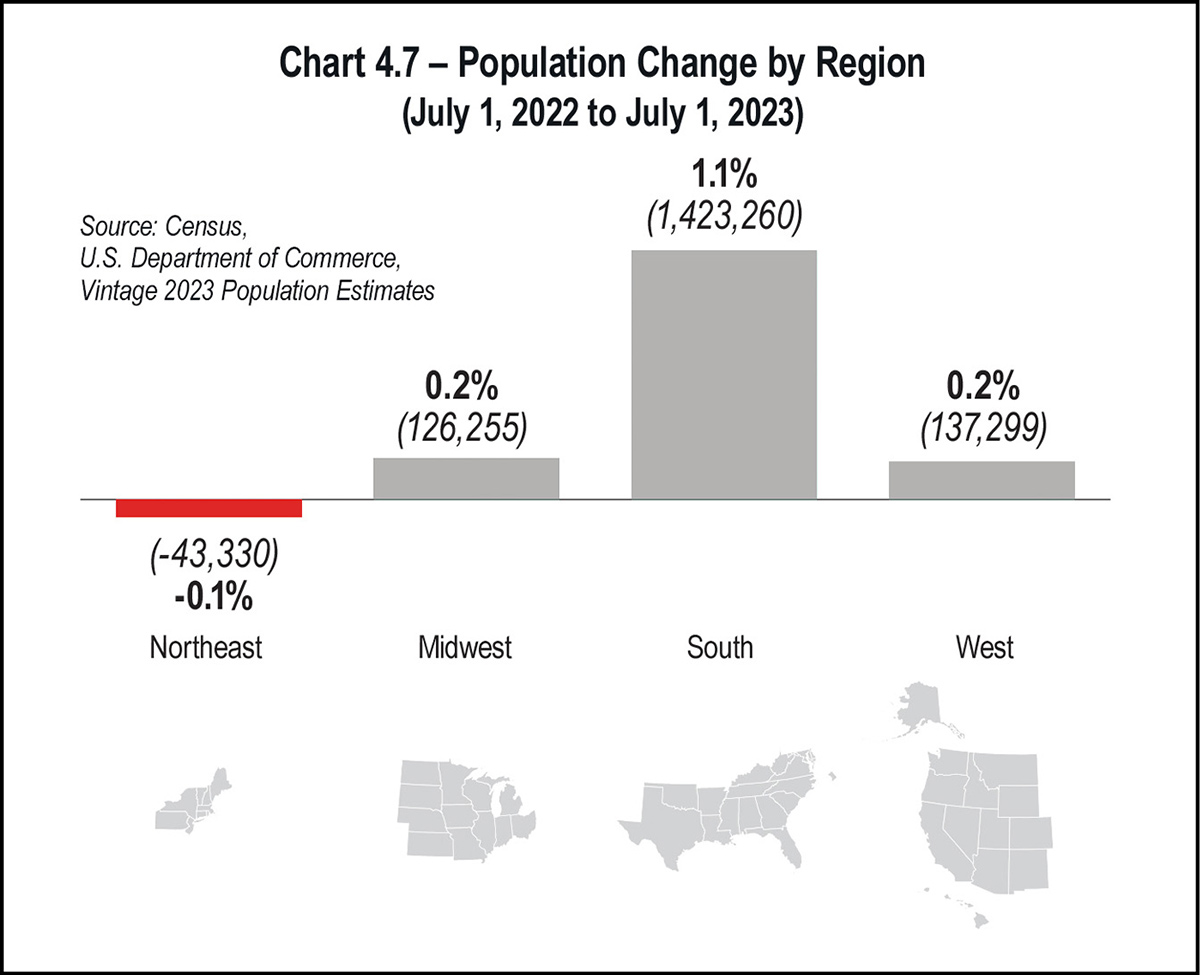
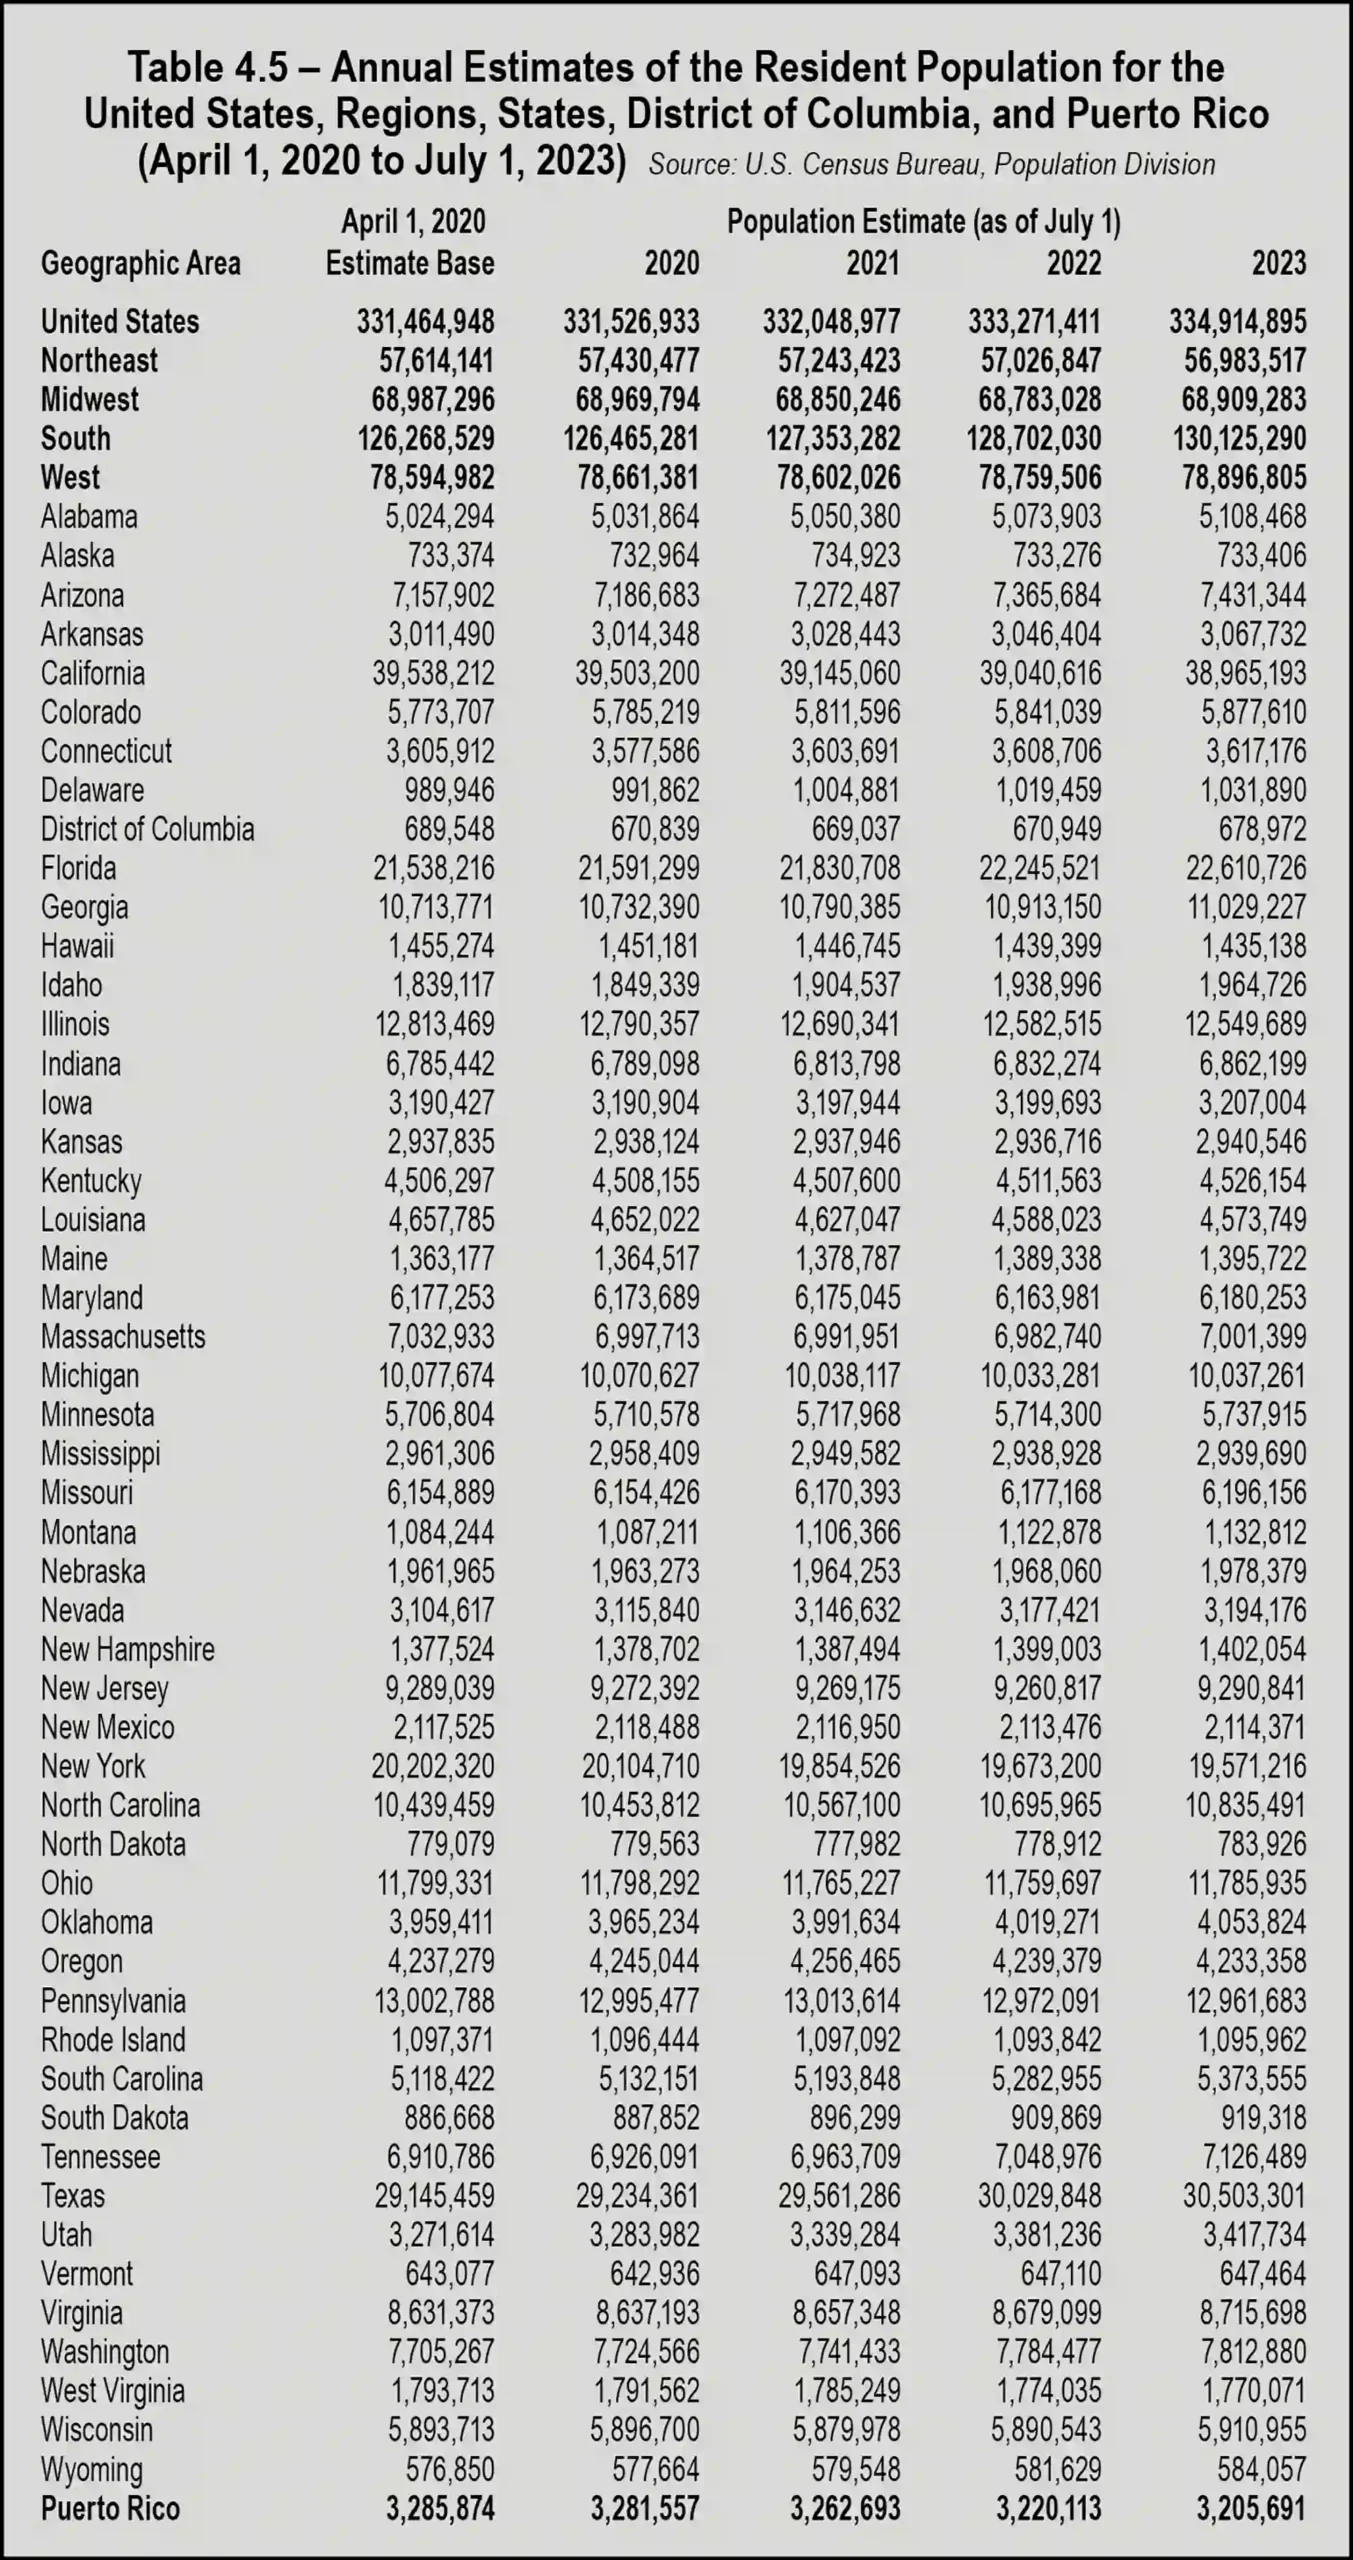
After declining in 2020 and 2022, the population in the Midwest had a slight gain of 0.2 percent, or just over 126,000 residents. The Census Bureau attributed the Midwest’s population rebound to a lower rate of outmigration to other regions, increased international migration, a slowdown in population loss in Illinois, and growth in Indiana, Minnesota, and Ohio.
The West added 137,299 people to the region, following an addition of 157,480 people in 2022. Fewer Western states experienced population loss in 2023, with Alaska and New Mexico gaining population again after losing population the prior year. California, Oregon, and Hawaii continued to lose population.
All population numbers provided by the bureau include only those counted in the Census; the figures don’t account for all of an estimated 17 million undocumented immigrants living in the U.S. The rising number of undocumented immigrants has corresponded with lower numbers of legal immigrants in recent years. The United Nations’s net legal migration rate for the U.S. per 1,000 people fell from 6.48 in 1998 to 2.748 per 1,000 in 2023. This translates to approximately 934,300 net legal migrants entering the U.S. over the year—a drop in legal net immigration of nearly 58 percent.
The significance of lower numbers of legal immigrants is that it can mean higher potential costs to the U.S. economy. For example, funding the Social Security program depends on legal immigration, particularly as the number of U.S.-born workers entering the labor force continues to decline. Traditional Social Security is funded through payroll taxes, through the taxation of benefits, and with interest earned on the program’s asset reserves. The system relies on new workers opting in each year, including legal immigrants.
The Census Bureau’s Current Population Survey showed that the total foreign-born or immigrant population (legal and illegal) had reached 49.5 million in October 2023. The study estimated that 15 percent of the U.S. population is now foreign-born.
Another growing demographic is bringing new challenges for the U.S. economy. With families opting to have fewer children and improved health care leading to longer lifespans, the U.S. population is aging rapidly. U.S. Census Bureau statistics show that between 2000 and 2021, the national median age in the United States increased by 3.4 years from 35.4 years to 38.8 years.
In 2020, approximately 1 in 6 people in the United States were age 65 and over. In 1920, the proportion was less than 1 in 20. The number of Americans age 65 and older is projected to nearly double from 52 million in 2018 to 95 million by 2060, and the 65-and-older age group’s share of the total population will rise from 16 percent to 23 percent.
This means that the portion of the population of prime working age is shrinking, leading to a decline in productivity and creating greater strain on the federal budget. These factors have the potential to add to an already critical labor shortage and to stunt the nation’s economic growth. Moreover, it raises concern regarding a Social Security system that many agree is unsustainable.
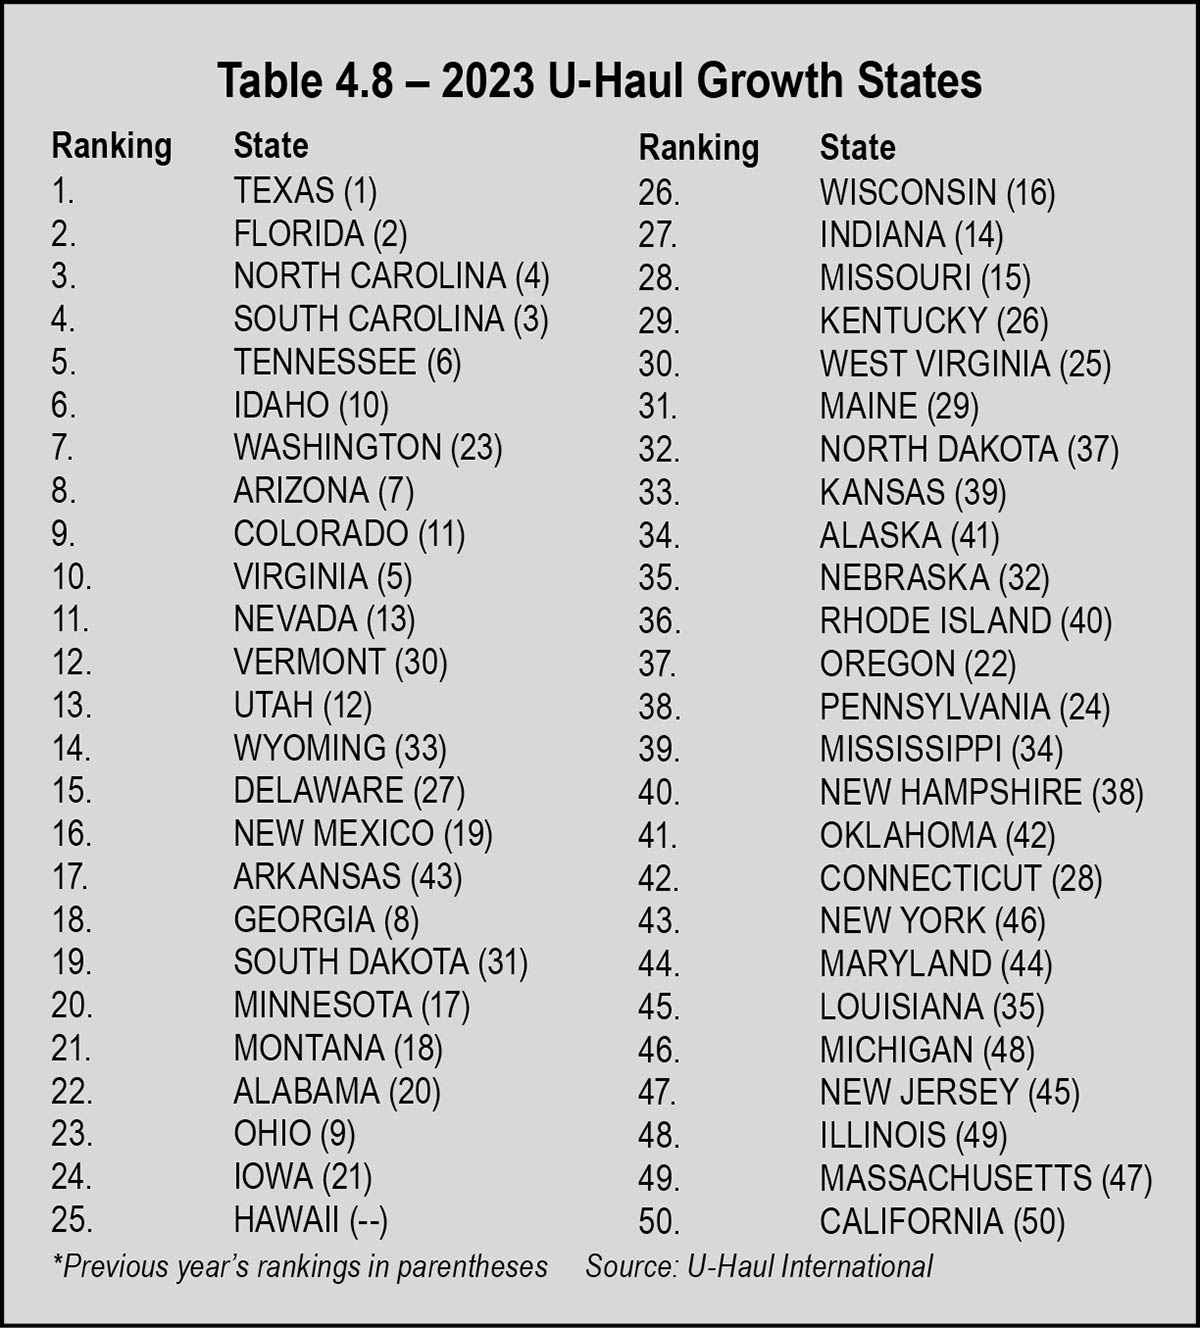
For the fourth year in a row, California showed the largest net loss of one-way movers. Following next in the bottom five states for growth are Michigan, New Jersey, Illinois, and Massachusetts; New York ranked in the bottom 10 at 43rd.
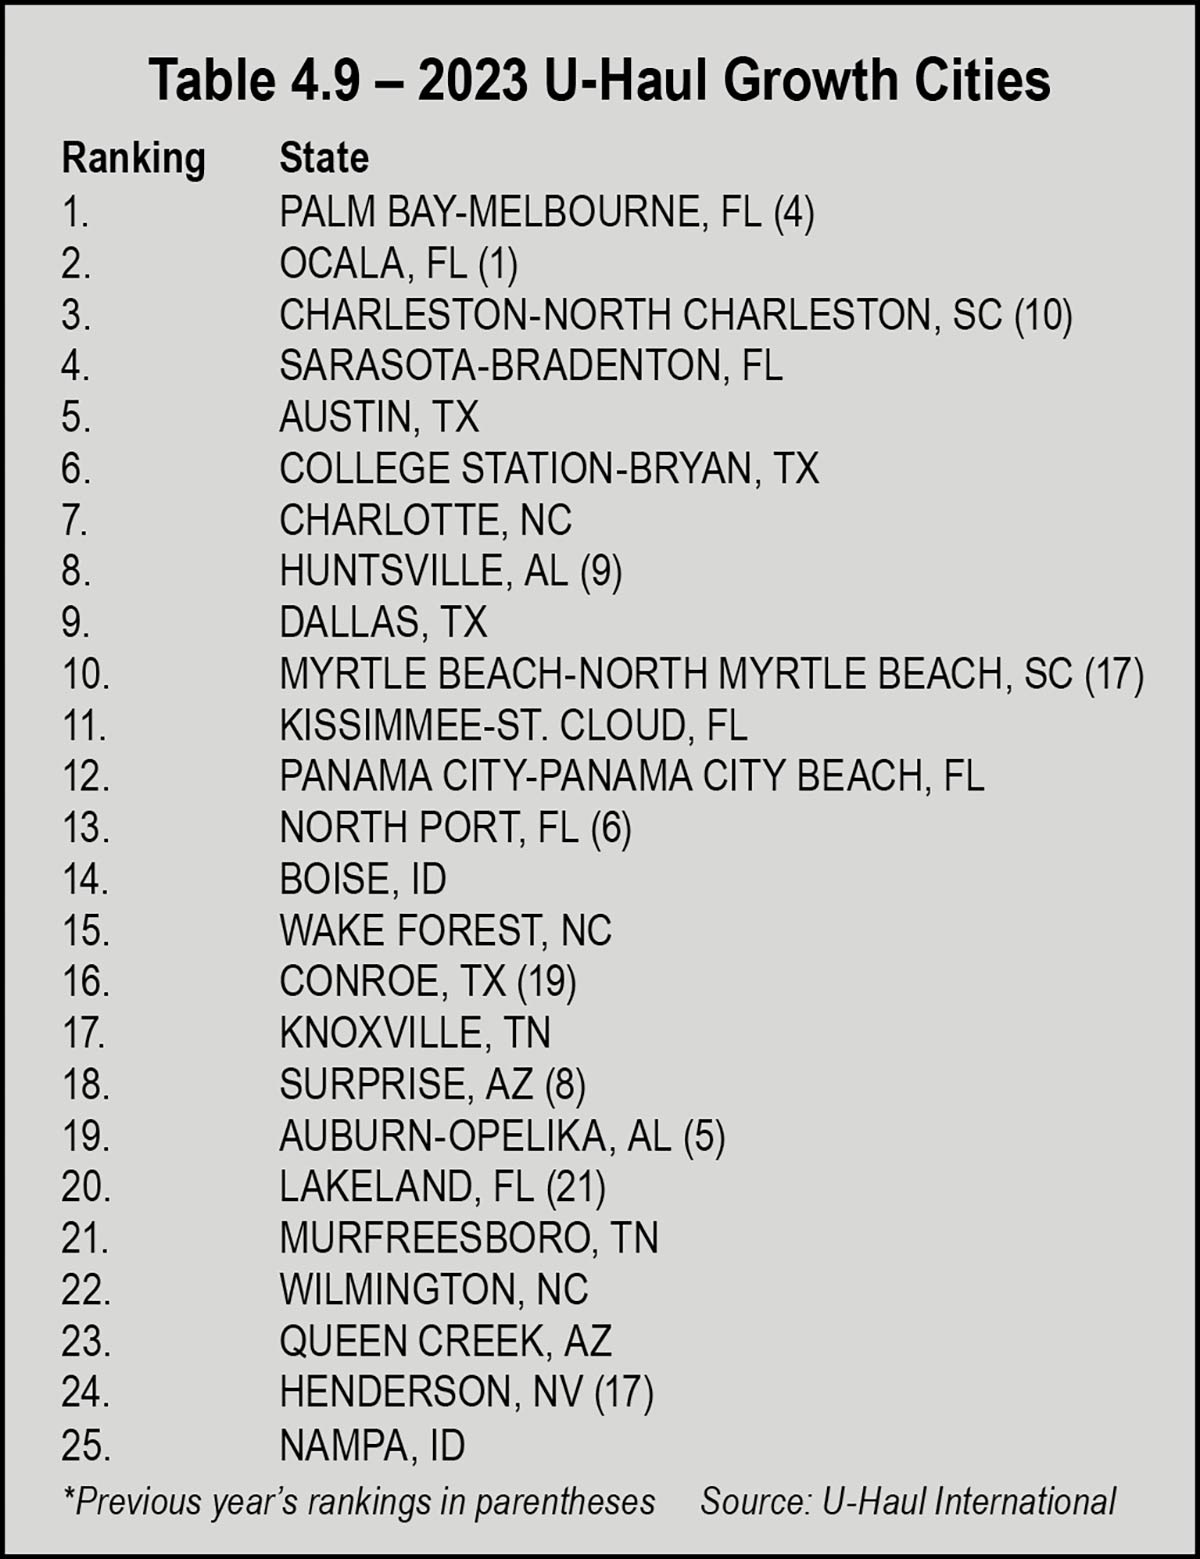
In a January 2024 press release, U-Haul International president John “J.T.” Taylor said the company saw the same geographical trends as in recent years, although not at the record-breaking levels they witnessed immediately following the pandemic.
As for top growth cities, U-Haul reported that Florida destinations dominated the U.S. growth cities list again in 2023, with the Palm Bay-Melbourne market netting the largest number of movers in one-way U-Haul® equipment last year.
The U-Haul Growth Index found seven Florida markets among the top 25 growth cities in 2023. It marked the seventh year in a row the Sunshine State had the most cities represented. Florida had four markets among the top 25 in 2022 and 10 in 2021.
The Sarasota-Bradenton market ranked fourth, just behind Charleston-North Charleston, S.C. Austin was the fifth-ranked growth city, the first of three top-10 Texas destinations along with the College Station-Bryan market and Dallas.
Several factors influenced relocation decisions in 2023. An unprecedented portion of the workforce shifted to remote work during the pandemic, allowing people to seek more desirable locations without the necessity of looking for new work. Others retired and were no longer limited geographically by their jobs.
Affordability of housing and other essentials also prompted relocation from areas with a high cost of living, as did the desire to flee from areas with high state and local taxes. Movers also pursued better climates, better health care, and opportunities for better education. Relocating for better living conditions and lower housing costs accounted for 25.6 percent and 21.4 percent of moves, respectively.
In the November Survey of Professional Forecasters (SPF), conducted by The Federal Reserve Bank of Philadelphia, the consensus was that the outlook for the U.S. economy looked better than it did three months prior. The forecasters who were surveyed expect real GDP to increase modestly by 1.7 percent in 2024.
One economic risk, noted in a November press release by Kevin Kliesen, a business economist and research officer at the Federal Reserve Bank of St. Louis, is upcoming defaults across several loan categories. “Rising defaults and delinquencies could reduce profits in the bank and nonbank lending sector, raising the risk of financial instability,” Kliesen said. “In this vein, the possibility of increasing defaults in the commercial real estate sector in many large cities remains a concern.”
Kliesen predicts that the new year won’t bring the level of economic woes some have feared. “Looking into 2024, economic conditions are expected to deteriorate modestly, though real GDP growth and the pace of job gains are expected to remain positive, and inflation is expected to decline to around 2.5 percent,” Kliesen said in the November 2023 press release. “This outcome, should it occur, would seem to vindicate those who have long believed in the possibility of a soft landing for the economy.”

ust as self-storage technology and business practices are changing, the self-storage customer is evolving as well. You need to know who your customers are to do business with them. Knowing your customer base makes your marketing effective, helps you provide the features and amenities your prospects are willing to pay for, and increases your success in renting space.
The Self Storage Association (SSA) provides a valuable service to the industry by conducting national demand studies. These studies date back to 2014, with the most recent study released in 2023. This is the main source of data referenced throughout this section.
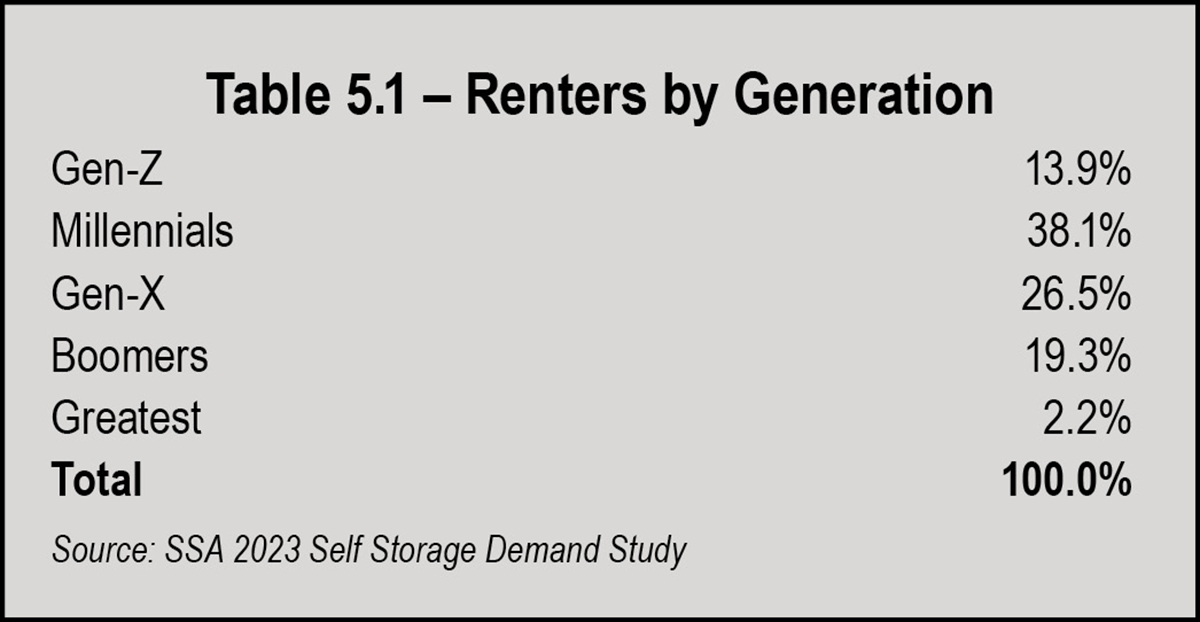
Comparing the SSA’s 2023 Self-Storage Demand Study to the pre-pandemic study of 2019 shows that some national trends continue moving in the same direction, like overall tenant mix. However, there are some very important changes, such as the profile of storage customers by generation.
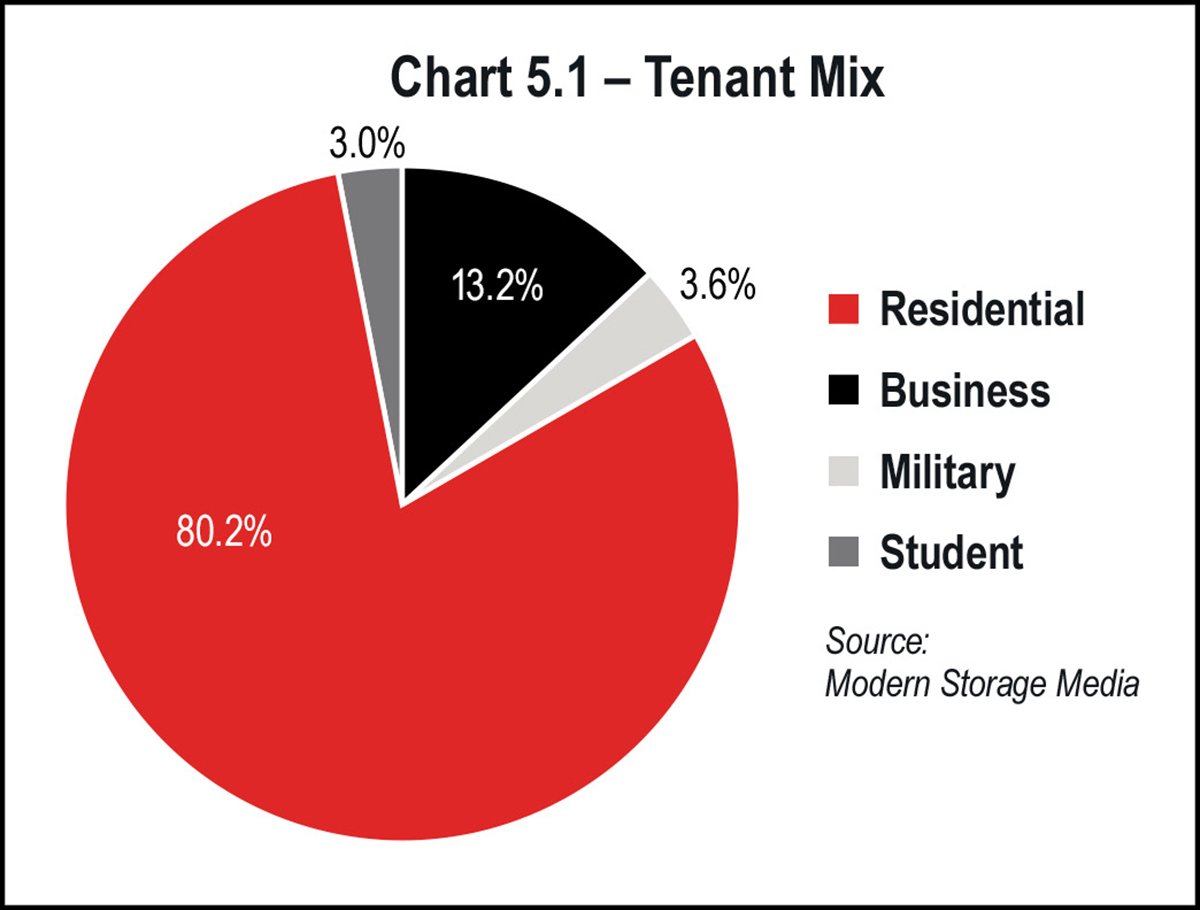
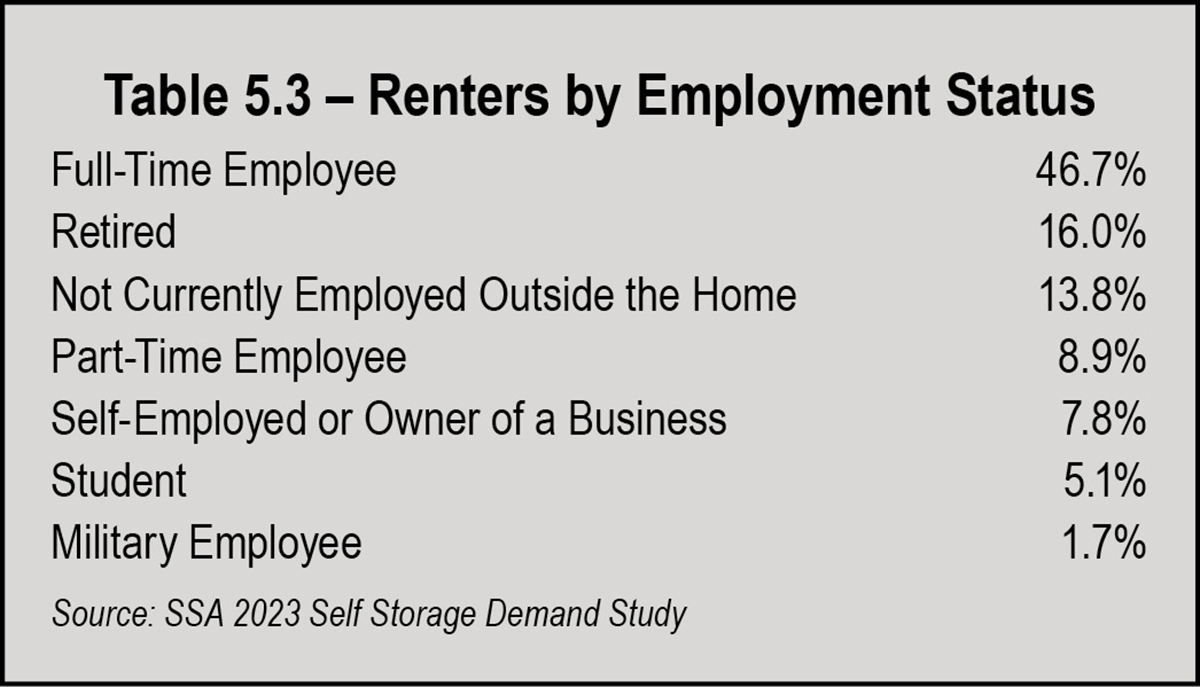
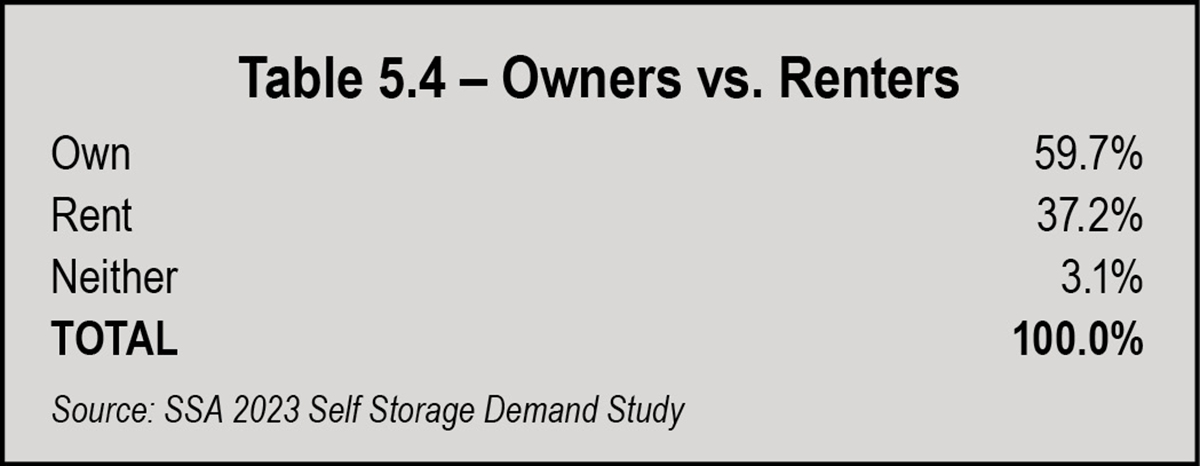
Between 2019 and 2023, there was very little change in any of these categories. Businesses renting space decreased slightly, but so did the overall number of businesses in operation in the U.S.
Of course, tenant mix varies by facility. Those near military bases or universities will have higher percentages of military or student renters.
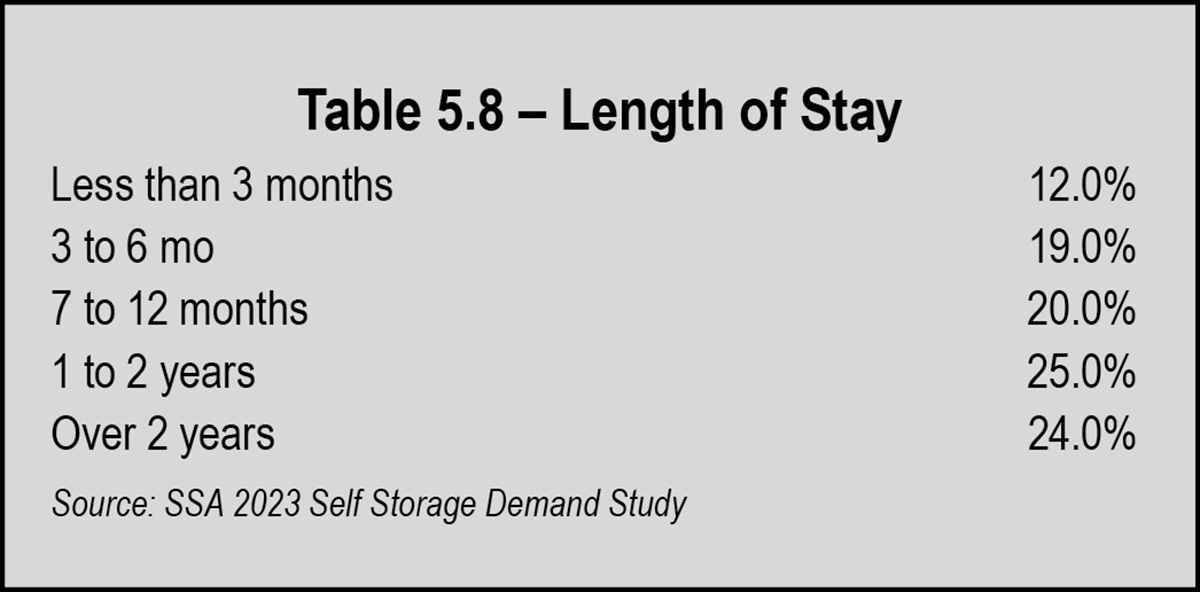
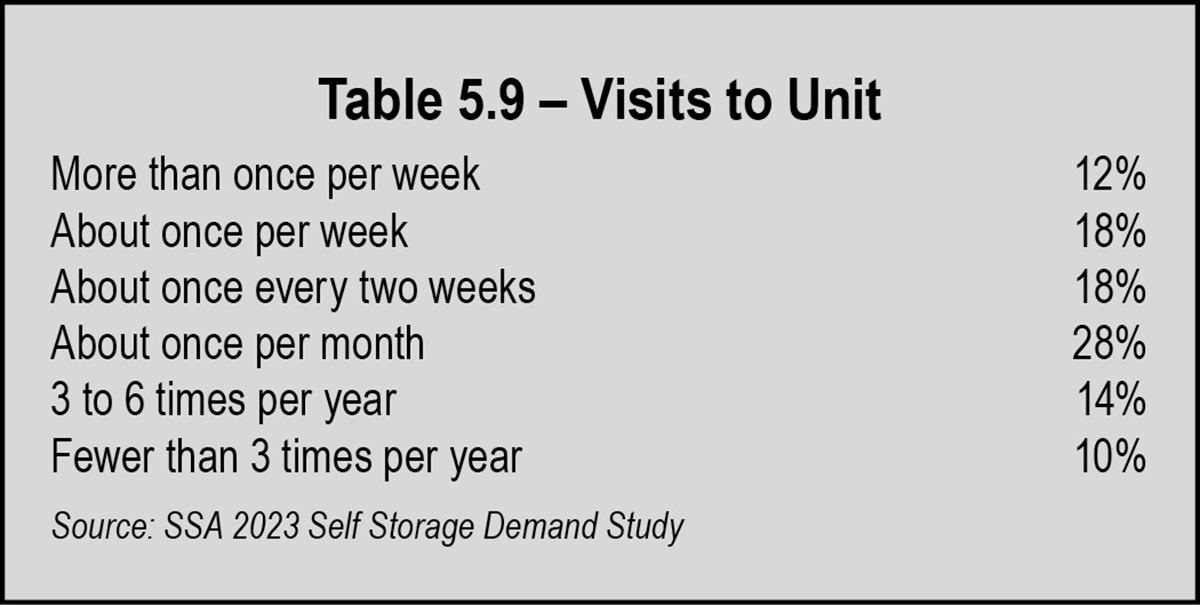
Younger generations use storage differently than older generations. For millennials and Gen-Zs, it is an extension of their home, to accommodate their lifestyle and provide extra space as residences become smaller. Because it’s an extra closet, or a lifestyle extension, these customers go to their storage unit more frequently. Whereas boomers rarely “visited” their boxes of memories from generations gone by and kitchenware, millennials and Gen-Xers pick up and return their kayaks or snowboarding equipment several times a month and/or swap out furniture, clothing, and even children’s toys between residences and storage.
Overall, younger renters are more likely to be:
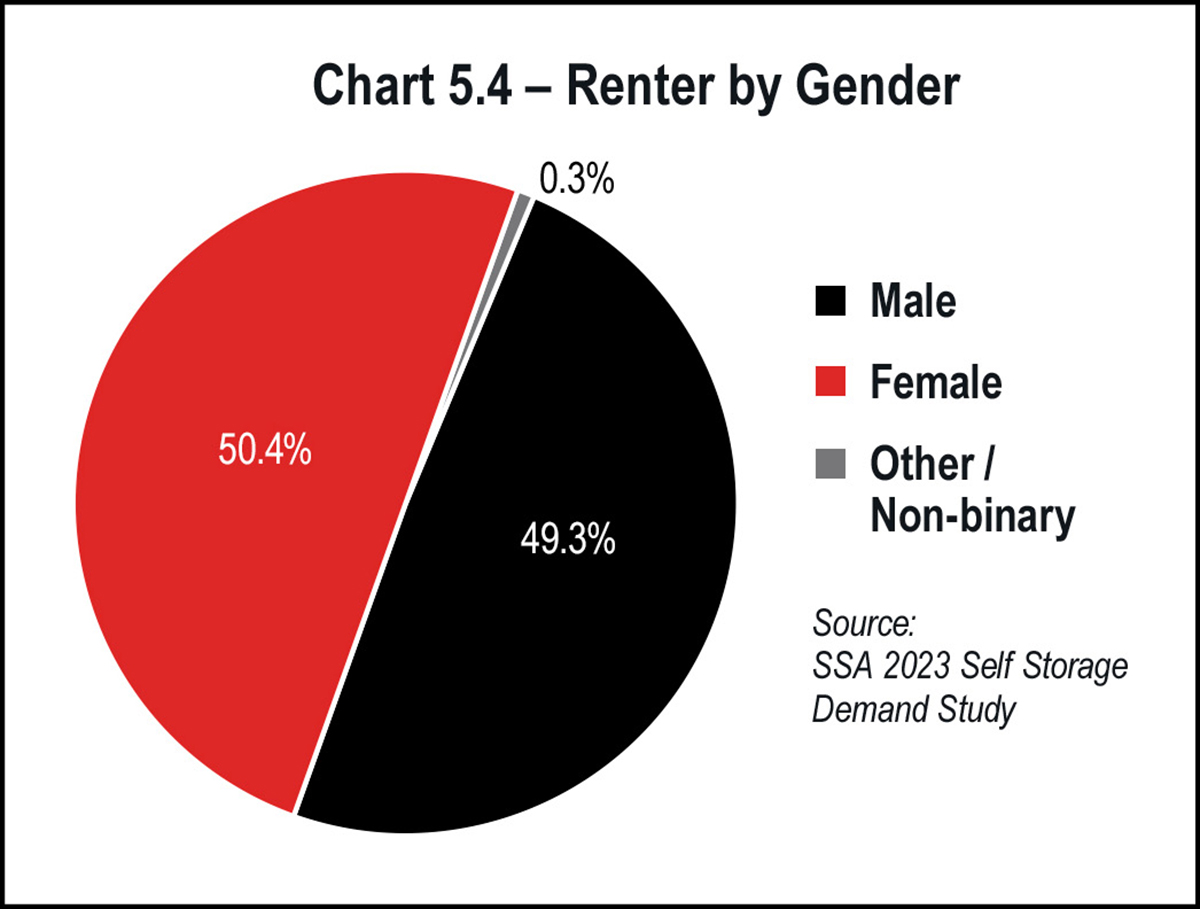
- Female
- Racially diverse, particularly Hispanic
- Living in rental properties
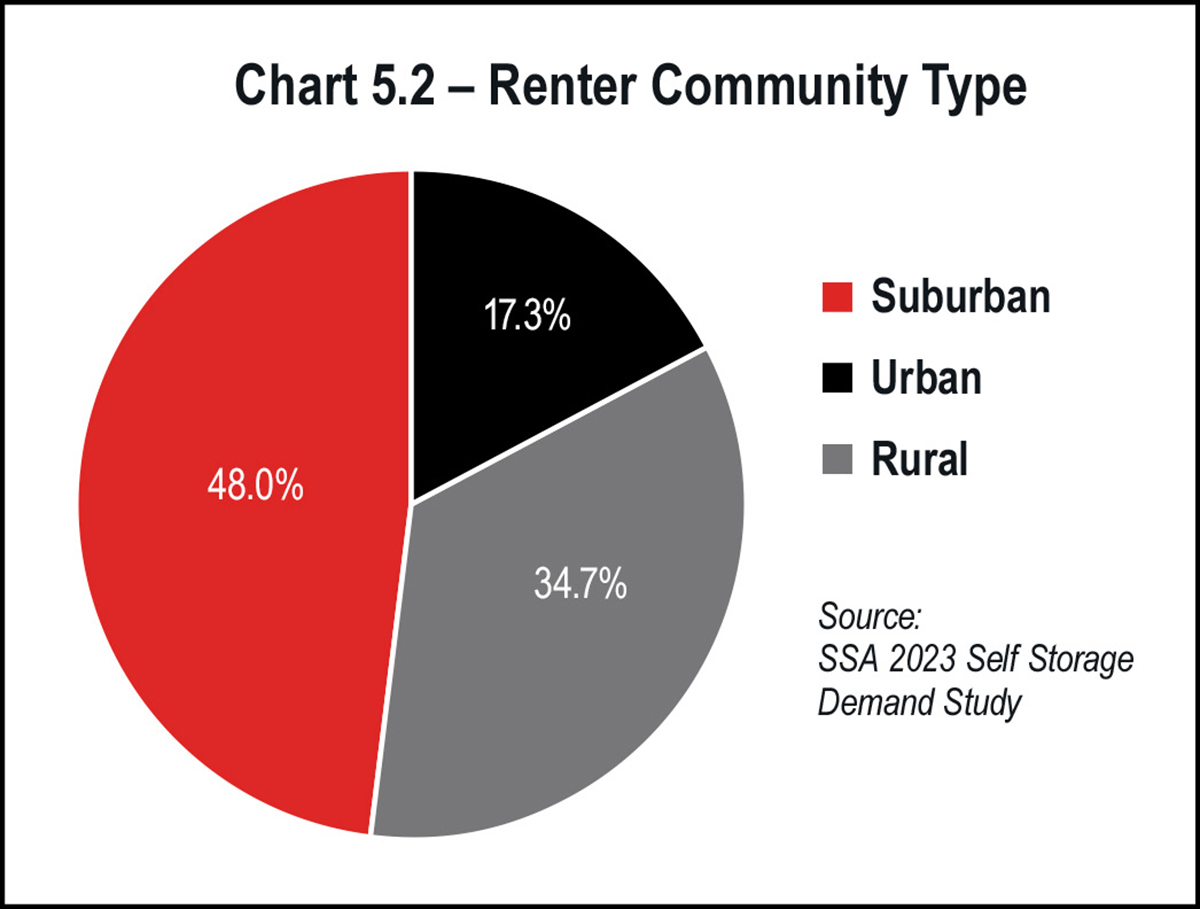
- Living in urban areas, though more renters overall live in the suburbs
They tend to:
- Rent smaller units (10-by-10 or smaller) that cost less
- Buy merchandise such as boxes and packing equipment and rent a truck
- Be unwilling to travel farther distances to their storage units
- Be more likely to walk, bike, or take public transit to their units
- Visit their units more than older generations
- Be short-term renters, compared to older generations, but they still account for a significant portion of long-term renters because they store items they don’t have room for at their primary residence
Overall, younger generations tend to be more demanding in terms of the features and amenities they say they want; however, the important caveat is that pricing remains the most significant consideration across all generations. After price, the top five most important features have remained constant since 2020: anytime access to unit, drive-up access, electronic gates at entrance, pest control, and close to residence.
Across all generations, renters still tend to rent from the first facility the contact, though this trend is softening as the consumer becomes more price sensitive and is therefore willing to shop around.
Automations and conveniences such as automatic and online payment by credit card continue to rise as features desired by renters.
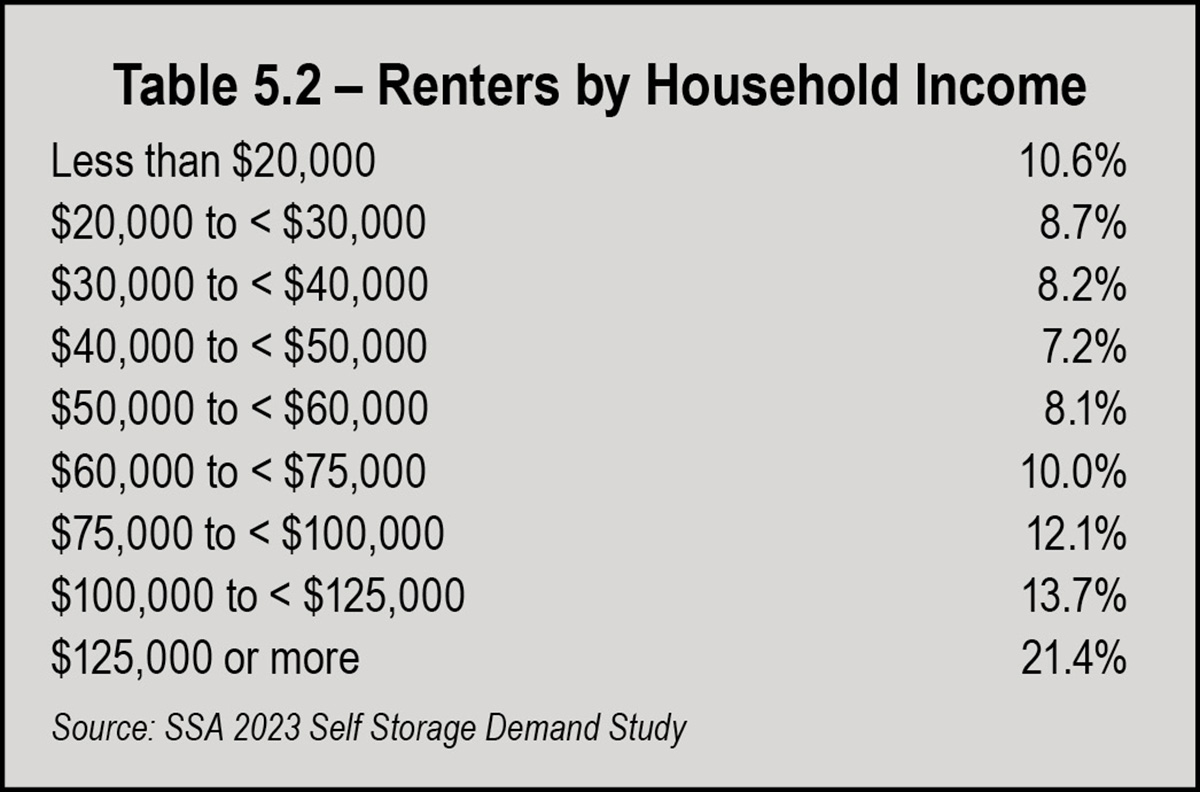
On the other end of the income spectrum, approximately 10.6 percent of renters have household incomes of less than $20,000. This segment falls within the U.S. poverty level (a family of three is $23,030, or $13,590 for an individual, according to the most recent Census data).
Approximately 42 percent of renters fall between the poverty level and the median U.S. income, with household incomes of $20,000 to $75,000. Renters below the median U.S. income will be more sensitive to rate increases.


the rapidly evolving landscape of the self-storage industry, the integration of technology has become paramount to success. Embracing smart, integrated technology is not merely a trend but a strategic imperative that empowers self-storage businesses to optimize operations, enhance customer experiences, and stay competitive in an ever-changing market.
- Can a customer move into your property without someone manually contacting them?
- Can that same customer move in without someone needing to remove a lock from their unit door? If so, that’s half the equation. The other half is how much visibility and control you have over your property remotely.
- Have they left their door open?
- Can you see if the customer has shared their access?
- How many times have they opened their unit?
- Are they a business customer?
- Has someone else opened their unit?
- Has there been any motion or other activity in their unit?
- Is your delinquency and auction process automated?
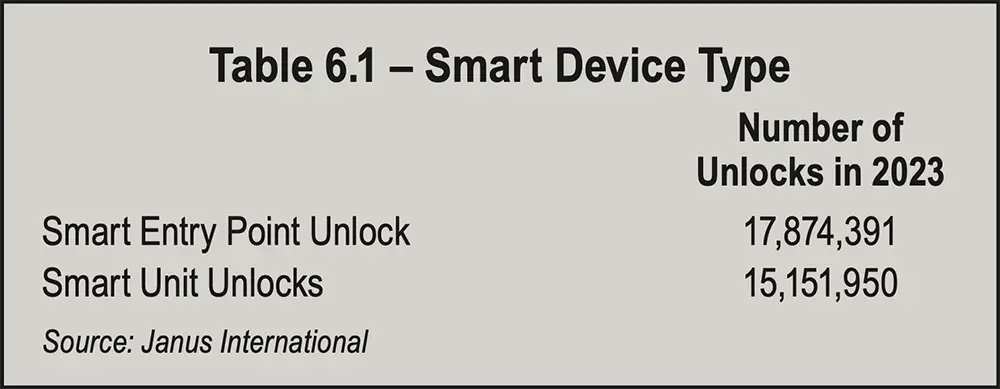
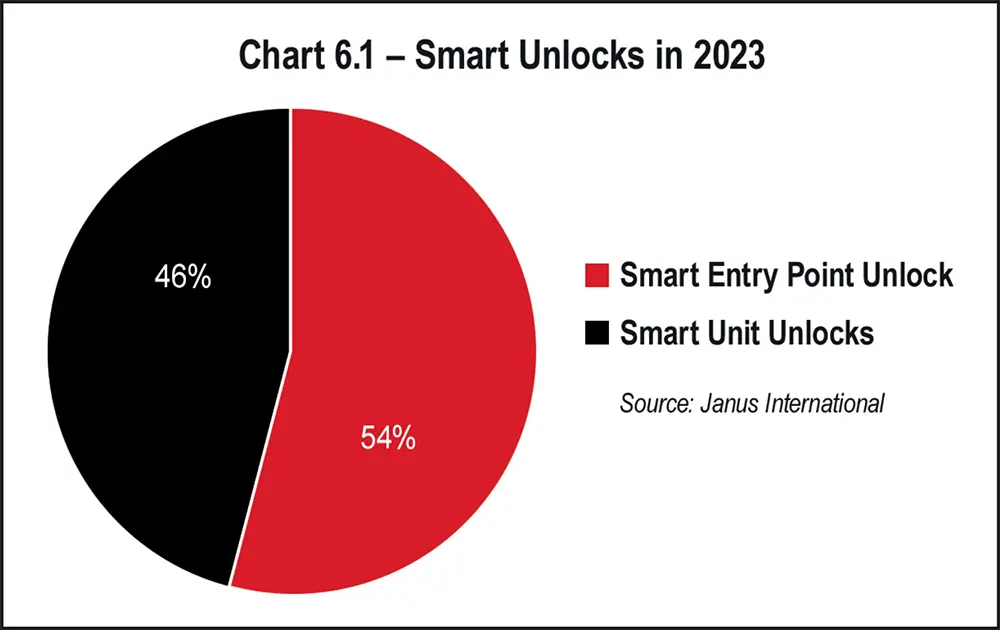
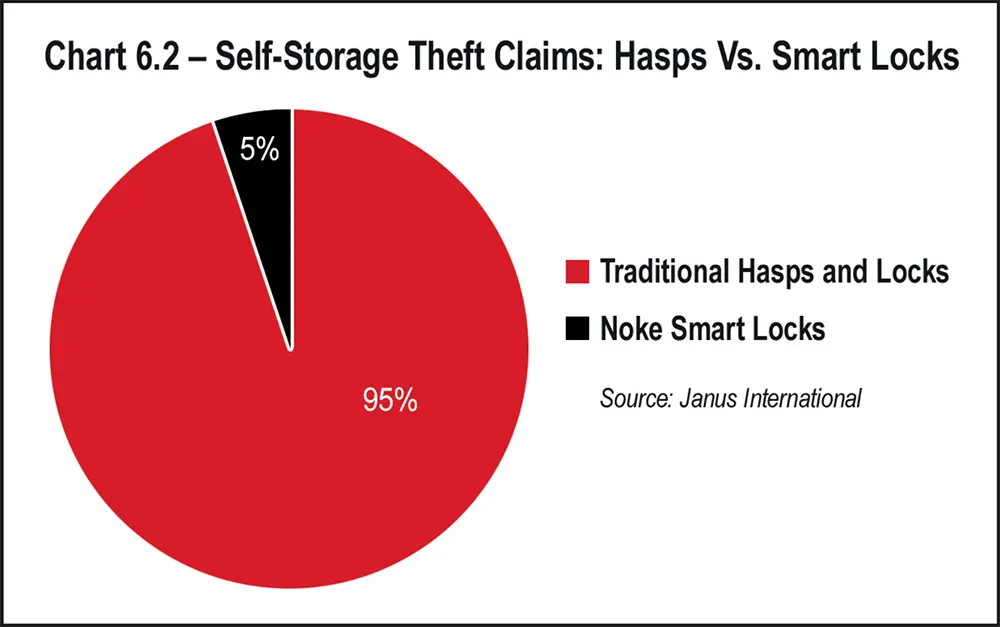
Smart technology enables us to gain valuable insights that have previously been unavailable to self-storage owner-operators. For instance, in Table 6.1 and Chart 6.1, smart technology allows us to see not only when entry points are accessed but also how frequently individual units are being unlocked. Smart technology also provides an enhanced level of security and can reduce the number of theft claims by as much as 95 percent.
- Smart locks and IoT sensors
- Tenant-facing, smart mobile apps
- Smart facility access, cameras, and monitoring
- E-leases
- AI and chat
- Autopay
- Website
- Property management systems
- Revenue management systems
- Online auctions and collections
Smart Locks
It seems smart locks and smart access products are dominating more and more industries. Self-storage is no different. Today, you can give your babysitter access to your front door for a number of hours, allow a delivery driver to open your garage door to put your packages inside, and even skip check-in at the front desk of a hotel by getting access to your room through your phone. While use of smart locks in storage is much the same as these scenarios in other industries, the financial implications are larger. Just think of how much your staff could get done without manual lock checks, overlocking and overlock removal, cutting locks, dealing with lost keys, and prepping units for online rentals. Without the burden of these manual tasks, your staff can keep up with your facility’s social media, sell vacant units, provide customer service to your tenants, maintain the facility, and respond to any inquiries. There are many benefits to smart locks in relation to operational efficiency and tenant convenience, but data could be the largest benefit of smart locks on your property. With some smart lock products available in self-storage, you can see not only how many times a tenant has accessed their unit but also who gained access (a tenant or their shared users), how long units were opened, and what units were left open. This data can tell you a lot about your tenants and the security of your property.

Mobile Apps
From airlines and hotels to retail stores, almost every industry is utilizing mobile apps. Mobile apps allow you to engage with customers in a way most people didn’t think possible 15 years ago. Taking airlines as an example, a person booking a flight can control the entire process from a mobile app. They can book the flight, select seats, check in, and even get a boarding pass in their app. Mobile apps can help storage tenants have a similar experience as well. When a tenant rents a unit online, they can download an app to gain immediate access to the facility and even their smart lock if a facility has deployed that technology. Some mobile apps available to operators can even link to a payment portal which allows tenants to enroll in autopay, change card details, and make a payment on a delinquent unit. Some mobile apps even allow tenants to transfer to a different unit or rent an additional unit. Being in the palm of your tenant’s hand helps your operation become stickier to that person. Using other industries as an example, if you have a hotel’s app on your phone, you are more likely to book with that hotel over a competitor. The same idea applies to storage tenants.
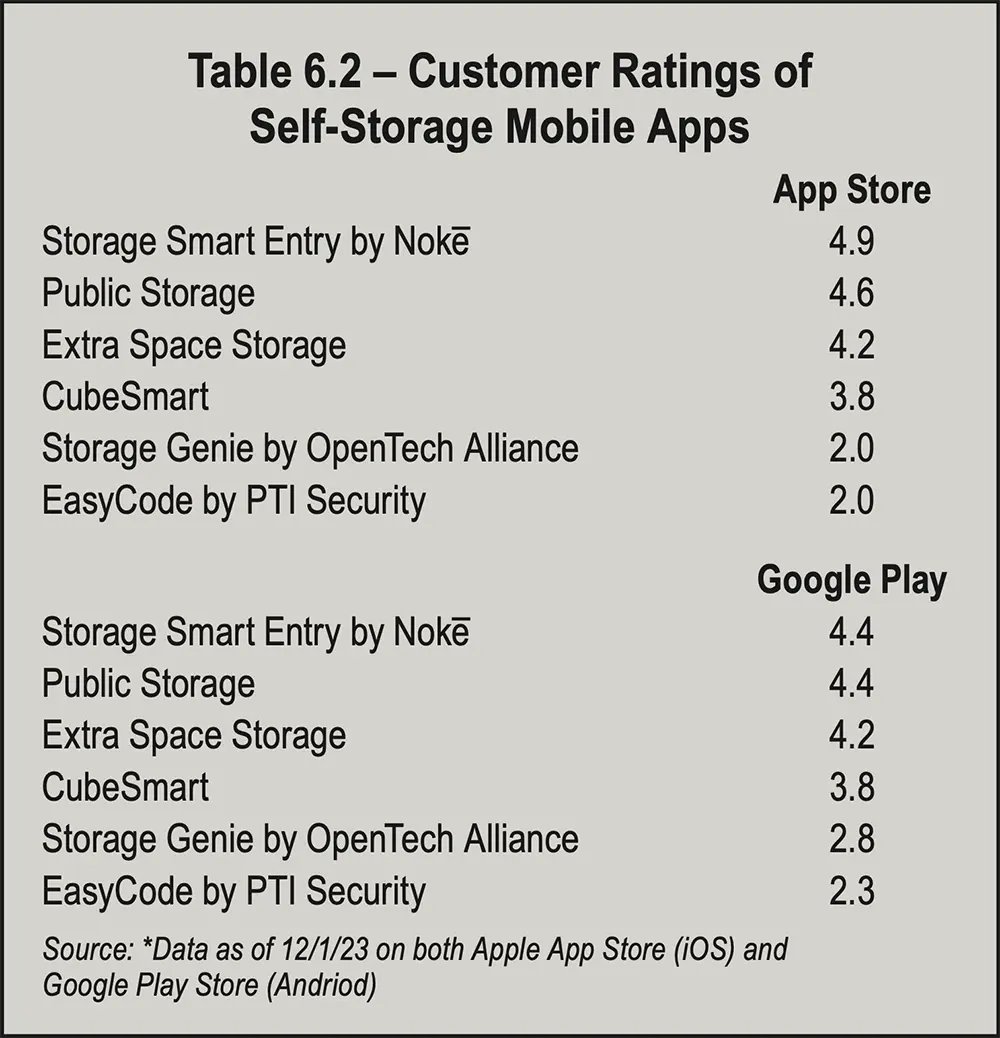
In Table 6.2 above, you can see that self-storage tenants are quickly adopting mobile technology. In fact, in a recent tenant survey, we found that 89 percent of tenants found the Nokē Smart Entry app easy or very easy to use. It’s no wonder that we’ve seen such growth in storage operators adopting mobile app controlled smart locking and security technology. Over the past year, the number of tenants using the Nokē system increased 133 percent, from 780,000 to 1,825,000 tenant users. Additionally, self-storage tenants used smart technology to access smart devices more than 33 million times in 2023.
Sensors
Proactively monitoring the state of your facility and individual units is now possible for self-storage operators. Different sensors can help you monitor temperature, humidity, unit intrusion, and even open entry points. For climate-controlled facilities, it is important to know about temperature and humidity anomalies before your tenants discover them on their own. Armed with this information, you can remotely take action or deploy maintenance personnel to your facility to address the issue. Armed with intrusion detection sensors, you can stay ahead of theft claims and be aware if someone is trying to live in their unit, which is one of the biggest liabilities in our industry. Tenants living on site can be a major threat to your facility’s security. Being able to see motion inside of a locked unit can not only alert you to theft but also point out attempts to live on site. Many industry-leading smart locks incorporate thermal motion sensors to provide an even more robust level of security and motoring than electronic smart locks alone.
Facility Access
Providing access control for your facility is a baseline security expectation of your customers. Facilities without controlled access to gates, elevators, and other access doors are immediately at a competitive disadvantage. With most property management systems, the code generated to send to your access control system can be set to be a certain number of digits. With too short of a code requirement, potential thieves can guess a random code and gain access to the property. It is best practice to make your code requirement at least six digits. With some access control providers, you can provide exclusive digital access to your facility’s entry points, which ensures that a person accessing your facility indeed has the proper access to enter. Additionally, you can see exactly who is entering the property since shared users must be registered. With coded access, there is no way to tell if a tenant is entering, or if they have shared their code with another person. Access control tells you who is coming at what times and allows you to control who comes to your facility and when.
Website
Your website can be considered your best salesperson, and it is increasingly becoming the first interaction your customers have with your business. In fact, today, more than ever, it is the only touch point a customer will have before renting a unit. In 2023, online revenue in the United States has continued to experience unprecedented growth, with projections for 2023 exceeding $1.1 trillion, as e-commerce remains a driving force in the nation’s economy. The increasing prevalence of e-commerce platforms, coupled with a surge in digital services and the ongoing digital transformation across industries, has contributed to the increase in online revenue. Businesses have adapted to changing consumer behaviors, with a heightened emphasis on digital marketing strategies, personalized online experiences, and seamless transaction processes. The adoption of advanced technologies such as artificial intelligence, augmented reality, and virtual reality has further enhanced the online shopping and user experience, driving higher conversion rates. A robust, customer-friendly, mobile-responsive website with online rental capabilities and click-to-live chat or click-to-call options for customer service are as critical for modern storage customers. As consumers increasingly rely on the internet for their purchasing decisions, it has become even more critical for self-storage owner-operators to offer a fully automated online rental paired with a mobile move-in experience.
Autopay
The importance of offering autopay services in the storage industry today cannot be overstated. Autopay, or automatic payment, provides a convenient and efficient way for customers to settle their bills or recurring payments without the hassle of manual transactions. For storage operators, implementing autopay systems streamlines the payment process, ensuring timely and consistent revenue flow. This not only reduces the administrative burden associated with chasing payments but also minimizes the risk of late or missed payments, enhancing overall financial stability. Additionally, offering autopay demonstrates a commitment to customer satisfaction by providing a user-friendly and hassle-free payment option. It fosters loyalty and trust among customers, as they appreciate the convenience and reliability of having their payments automatically deducted. In an era where streamlining efficiency is paramount, businesses that prioritize and integrate autopay options into their payment systems stand to benefit from improved customer relationships and a more robust financial foundation.
E-leases
Embracing electronic leases not only streamlines the leasing process but also caters to the growing demand for efficiency and convenience among both self-storage owner-operators and tenants. Electronic leases eliminate the need for traditional paper documentation, reducing the administrative burden, minimizing errors, and accelerating the overall leasing cycle. Moreover, e-signatures provide a secure and legally binding way for parties to sign agreements remotely, enabling swift transactions without the constraints of physical proximity. This digital approach not only enhances the speed of lease execution but also contributes to a more environmentally friendly and sustainable business practice by reducing paper consumption. Overall, offering electronic leases and e-sign options not only aligns with the pace of the digital age but also demonstrates a commitment to customer satisfaction through a modern, accessible, and efficient leasing process. With electronic leases in place, your customers can select their unit online, electronically execute their lease, and receive an automated text message upon rental that includes a link to your branded mobile app and a one-time activation code. Once they download the app, enter their code, and create a password, they’ll be ready to access the facility and their unit directly from their device within minutes.
AI & Chat
Artificial Intelligence (AI) became an increasingly hot topic in 2023, and self-storage is not immune to these discussions. Generally speaking, AI provides businesses with tools for data analysis, pattern recognition, and decision-making, thereby enhancing operational efficiency and productivity. Through machine learning algorithms, AI enables businesses to extract valuable insights from vast datasets, facilitating data-driven decision-making processes. AI-driven technologies such as chatbots and virtual assistants enhance customer interactions, providing personalized experiences and improving overall customer satisfaction. Self-storage owner-operators can leverage AI to optimize facility management by implementing smart monitoring systems, predictive maintenance, and automated customer service solutions, enhancing operational efficiency and providing a seamless experience for clients.
Revenue Management
To maximize your top line, not only does your facility need to be stabilized but a revenue management practice should be in place. Many operators are uneasy raising rates on tenants (particularly long-time tenants) for fear of a mass exodus. The reality is a revenue management strategy does not need to be sent to all tenants. With the use of revenue management products and analysis of tenant behavior, your strategy can target specific groups of tenants who are less elastic to these pricing changes. Using revenue management technology, you may also see a limited inventory of certain unit sizes in your market. If this is the case, the street rate is likely higher than what your existing tenants are paying for this unit size. If a tenant moves out due to an increase in this scenario, you are likely to replace them quickly at a higher rental rate. Revenue management systems can take many different factors into consideration and help you effectively implement your strategy. Leveraging the data generated by smart locking and smart entry technology fuels revenue management by offering valuable insights about tenant behavior.
Online Auctions
Auctions are not an ideal part of storage. They are, however, a necessity. While we do not like to think about our tenants going so far into delinquency that their property needs to be auctioned to recoup their missing rental revenue, it does inevitably happen. Online auctions are a good way to automate this process while ensuring adherence to all local and state delinquency laws. An error in handling the auction process could cost your operation a lot of time and money. By using an online auction service, your facility is protected from the liability of mishandling the process. An additional benefit comes in the way of moving the process from on premises to remote. Your visiting tenants will not see the sideshow of a live auction occurring. Furthermore, you have less people entering the property for whom your staff needs to grant access. While an online auction is in process, your staff can stay focused on their job instead of monitoring the entry and exit of auction bidders.
Property Management Systems
The most important element of a property management system in self-storage today is its ability to fully integrate with innovative technology, including smart locks and smart facility entry products.
1. Operational efficiency and virtual management
- Labor savings
- Delinquency and auction automation
2. Enhanced security
- Reduction in theft and break-in claims
- Enhanced reporting and visibility
3. Improved and more modern customer experience
- Rental and payment automation
- Fully automated move-ins
4. Data and revenue generation
- More robust revenue management
- Enhanced reporting and data
- Consumer behavior
Operational Efficiency And Virtual Management
The importance of overlocking at the individual unit is paramount. Even though most facilities lock out delinquent tenants at the gate, delinquent tenants can and do get past the entry point and to their unit. According to data gathered by Janus International, over 150,000 attempts were made by delinquent tenants to get into their units from November 2022 to November 2023 at facilities using smart locks. With this in mind, the overlock process remains a large headache to most managers in our industry. If a facility is on first of the month billing, the manager will go out with a bucket of red locks to manually lock each delinquent tenant out of their unit. When tenants pay, the manager has to go out after each payment to remove the overlock. This can happen multiple times a day throughout the rest of the month. If a facility is on anniversary billing, the manager may be going out to overlock units multiple times per week. The same situation exists for removing these overlocks. This overlock and overlock removal process can be completely automated with the use of smart locks. When a customer goes into overlock, their access is automatically revoked electronically. When the tenant pays, their access is then automatically restored. The use of smart locks can completely take manual overlocking and removal out of the equation for storage operations.
Some smart locks in the industry can standardize the way you handle the auction process as well. With these solutions, you can control who manages the auction process so the same person can assign access for managers to take pictures and even set how many times the unit can be unlocked during the auction process. The auction process is a minefield for operators, and the use of smart locks is another way to ensure processes are being followed properly. Combining adoption of online auctions with smart locks can greatly reduce liability in this process.
In addition to streamlining the move-in process and virtually eliminating the manual tasks associated with adding and removing overlocks, smart locks and smart security tools provide valuable, labor-saving data that can help self-storage owner-operators reduce or even eliminate on-site management. This frees up operations teams to run multiple properties remotely from a central hub or focus their time on marketing and other revenue generating initiatives rather than manual tasks like lock checks and overlocking units.
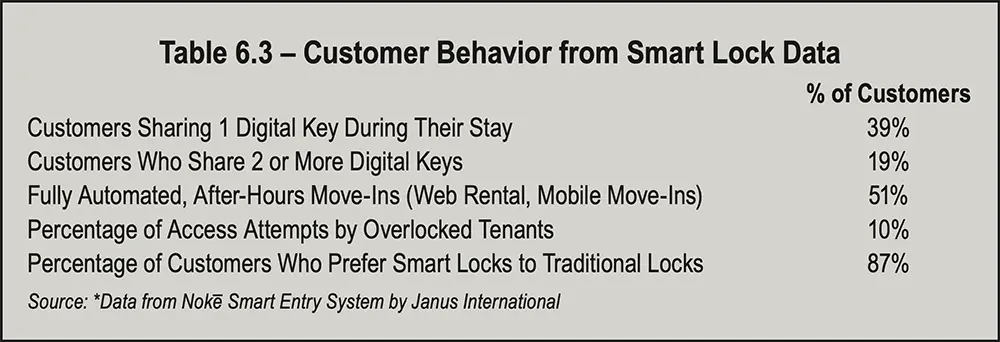
As shown in Table 6.3 above, more than 50 percent of new renters are online renting units after hours, but they’re also onboarding themselves with smart entry and accessing the facility and their unit without going into the office to speak with anyone. In addition, smart locks provide remote management tools that allow virtual managers to open unoccupied units remotely for tenants who want to see their space before they move in. Once on site, tenants can click the “locate my unit” button in their mobile app to visually and audibly receive directions to their space. Finally, in-app links to your mobile friendly payment page allow past-due tenants to pay their bill via their phone and restore their access immediately.
Enhanced Security
One of the most compelling things about smart technology is that it not only eliminates tedious, manual processes for owner-operators but also provides a higher level of security than traditional storage hasps and manual locks. In fact, Chart 6.4 shows that Nokē smart units are 95 percent less likely to have paid theft claims than traditional hasps with manual locks. That dramatic reduction in theft and vandalism often creates valuable revenue share increases for storage owners; it also virtually eliminates the potential black eye of dealing with negative reviews and news coverage associated with theft claims.
Improved Customer Experience
The transition to electronic smart locks has revolutionized the customer experience in self-storage in much the same way as the guest experience was elevated in the hospitality industry. Mobile app-controlled locks offer a frictionless check-in process, eliminating the need for physical keys and gate codes. Tenants can now conveniently access their unit using their smartphones, providing a level of convenience and sophistication that aligns with modern expectations. This streamlined process not only enhances customer satisfaction but also contributes to operational efficiency for staff.
In today’s self-storage landscape, where customers seek secure and flexible storage solutions, electronic smart locks offer unparalleled advantages. Customers can use mobile apps to access their storage units at their convenience, and this flexibility is particularly beneficial for individuals who may need to retrieve or store items outside regular business hours, providing a 24/7 accessibility solution.
Data & Revenue Generation
For self-storage facilities operators, smart locks with mobile app control facilitates efficient management and monitoring of access points and units. Additionally, industry-leading smart locks have thermal motion sensing compatibilities that can help deter break-ins as well as identify tenants living in units. Staff can remotely grant or revoke access, track entry and exit times, and receive real-time alerts for any suspicious activities. This level of visibility also enables owner-operators to leverage unit access data for preventative maintenance as well as generate additional customer behavior based rental increase opportunities. Referring to Table 6.3, 19 percent of smart entry system users have shared digital keys with two or more people this year. Layering unit size, key share, and access history data can help operators identify commercial or heavy-use customers for more targeted rent increases.
What all of this means is simple: Smart technology is here to stay, and it isn’t simply the luxury add-on that it once was. It’s an expected and crucial part of a facility’s success, today and in the future. And as the data shows, it can enhance both an owner-operator’s level of security as well as their bottom line.
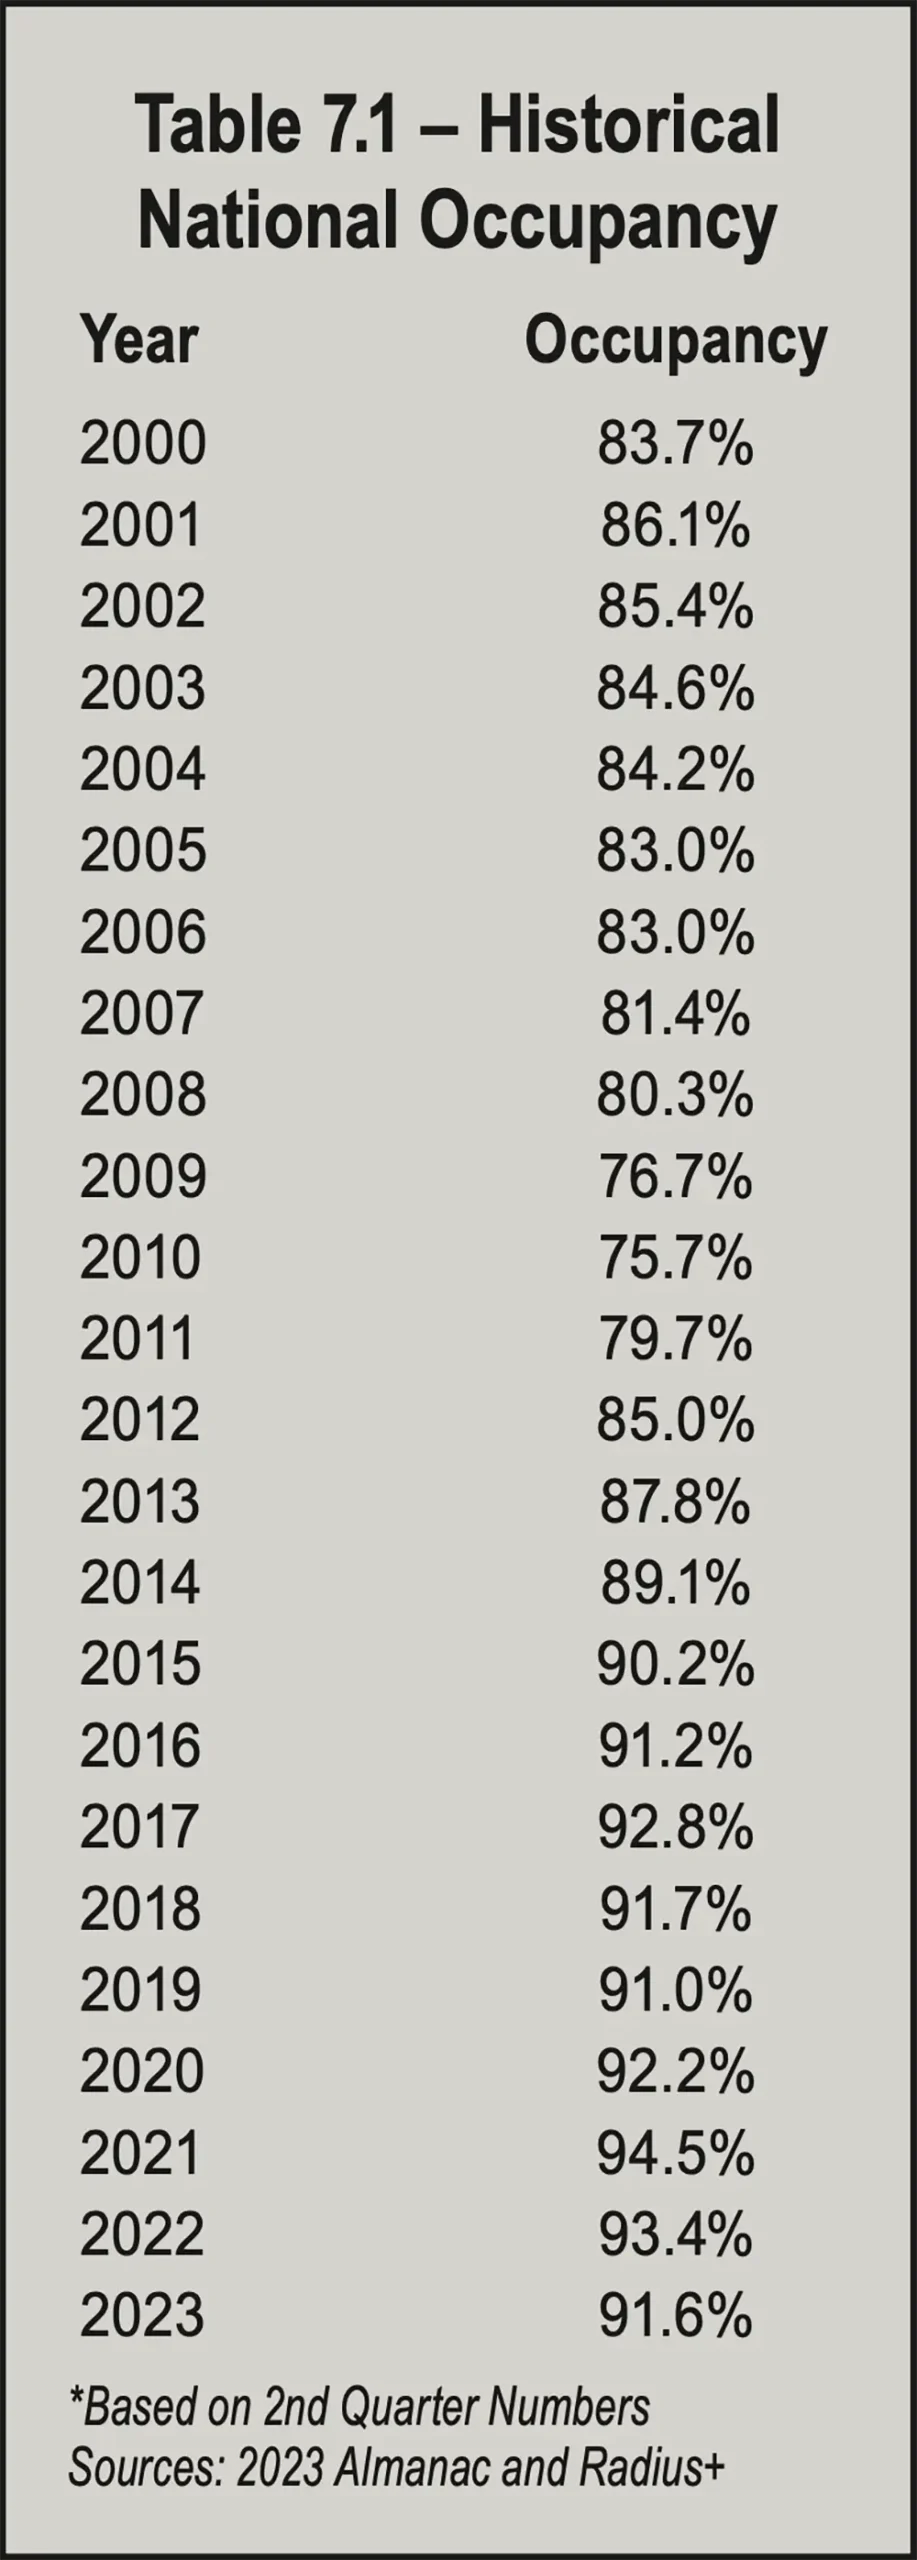
roperly managed self-storage occupancy maximizes an operator’s bottom line, but misconceptions persist about the best occupancy strategy. Most industry operators try to keep occupancy between 90 percent and 95 percent. Some try to maintain 100 percent occupancy. Though it might seem counterintuitive, you are losing money if you keep your facility completely full. This leaves you with two options: add new units or raise rental rates.
How to measure occupancy is as important as maintaining the ideal occupancy. The two main ways to measure it are physical and economic. We report data in the Self-Storage Almanac based on physical occupancy. This measures the number of units rented. For example, if you have 100 units and 90 are occupied, then your facility’s physical occupancy is 90 percent.
By contrast, economic occupancy is based on the gross potential income you are collecting. Gross potential income factors in any concessions or discounts you give your customers. For example, if you have a 100-unit facility with 90 units rented and you give customers a one-month-free concession on the remaining 10 units, then your facility’s economic occupancy is 80 percent. This is because you collected no rent for one month on those 10 units, which decreased your income accordingly.
Kenneth Nitzberg, chairman and CEO of Devon Self Storage, based in Emeryville, Calif., says 85 percent occupancy is considered stabilized, and 90 percent is better. But too much above 90 percent is undesirable. “Because what that tells me is that we aren’t raising rents often enough or high enough to force a couple of people to move out or pay the higher rents,” Nitzberg says.
“However, some are optimistic that as new home sales eventually find a bottom and new storage development slows, we will begin seeing improvements in storage occupancy and street rates,” according to the report.
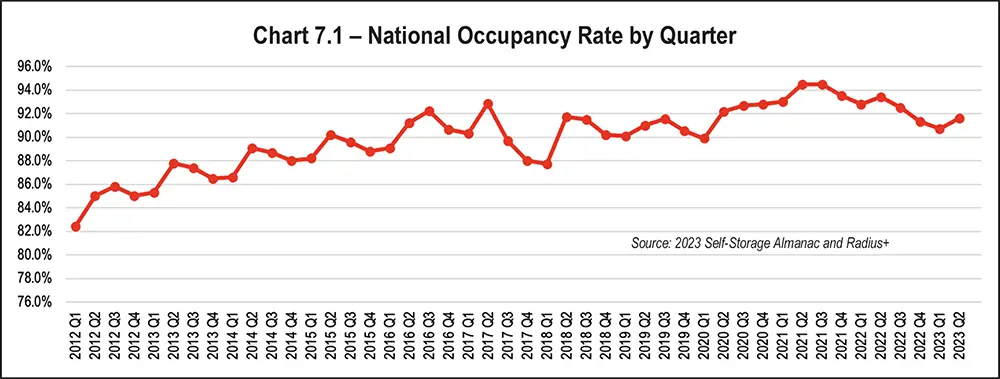
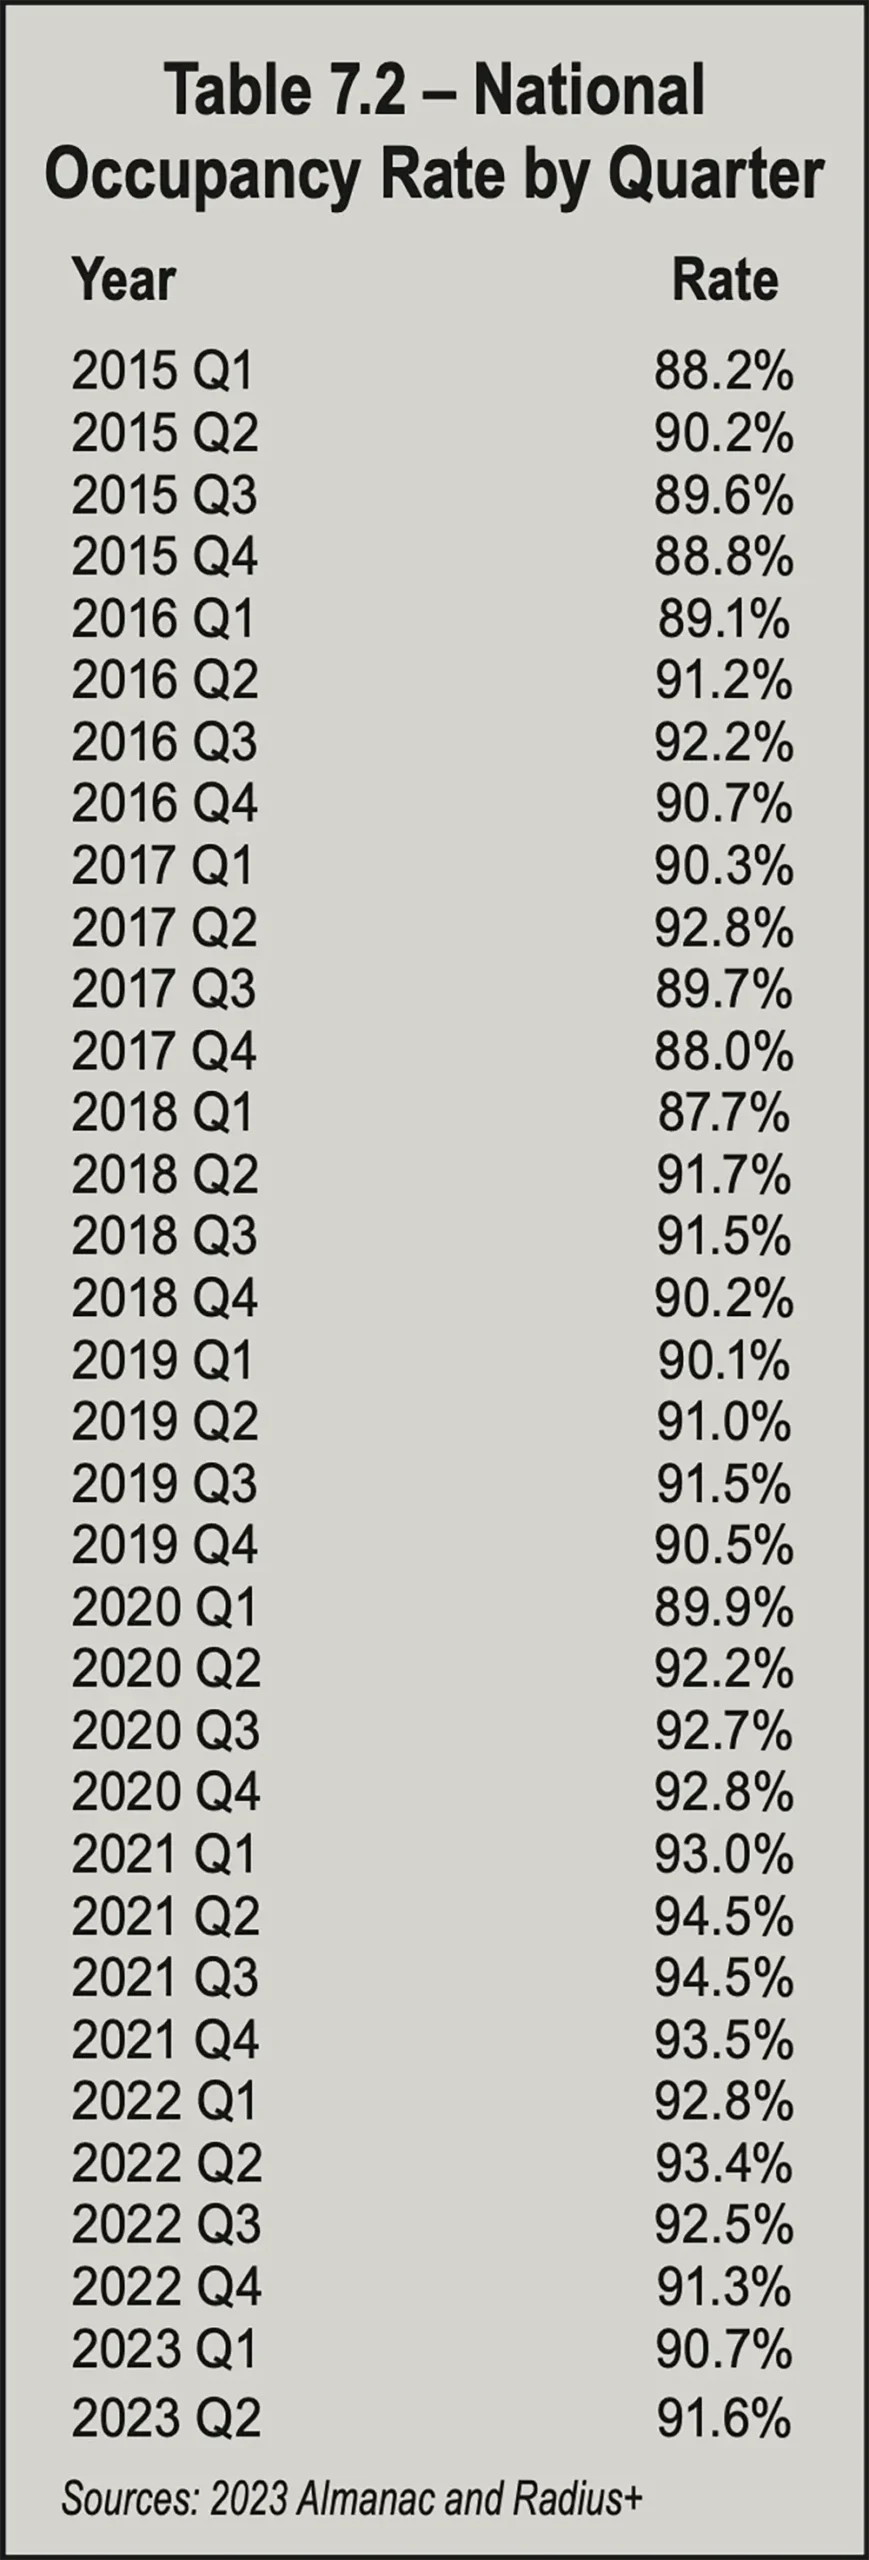
Digging deeper into the quarterly numbers in Table 7.2, which tracks Q1 2015 through Q2 2023, the low mark was 87.7 percent in Q1 2018. The high mark was 94.5 percent, which occurred in both Q2 2021 and Q3 2021. Quarterly rates increased from Q1 to Q2 throughout the period, mostly decreased from Q2 to Q3 and from Q3 to Q4; and showed an even mix of increases and decreases from Q4 to Q1. Overall, occupancy rates stayed mostly in the 80s from Q1 2015 through Q1 2016 and stayed mostly in the 90s from Q2 2016 through Q2 2023 but dipped into the 80s during four quarters of that period.
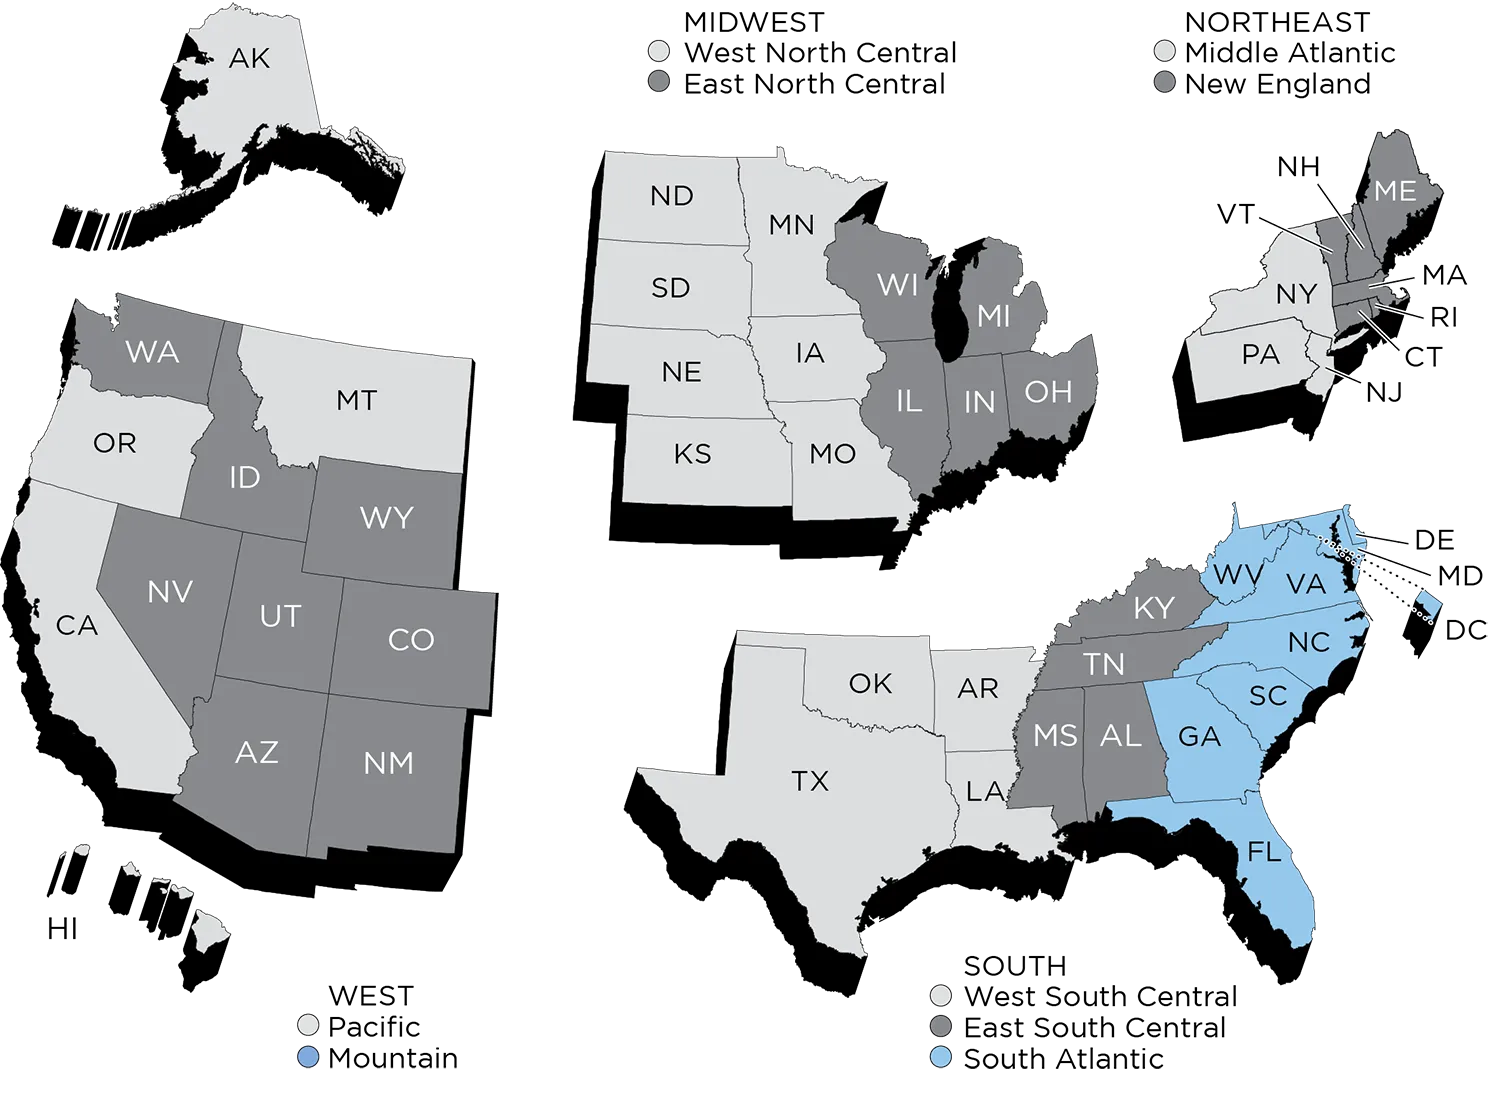
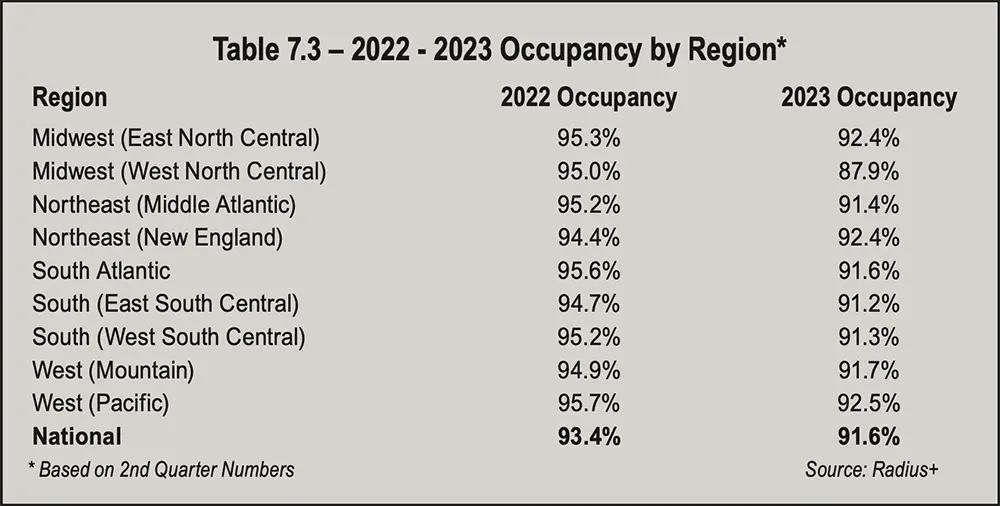
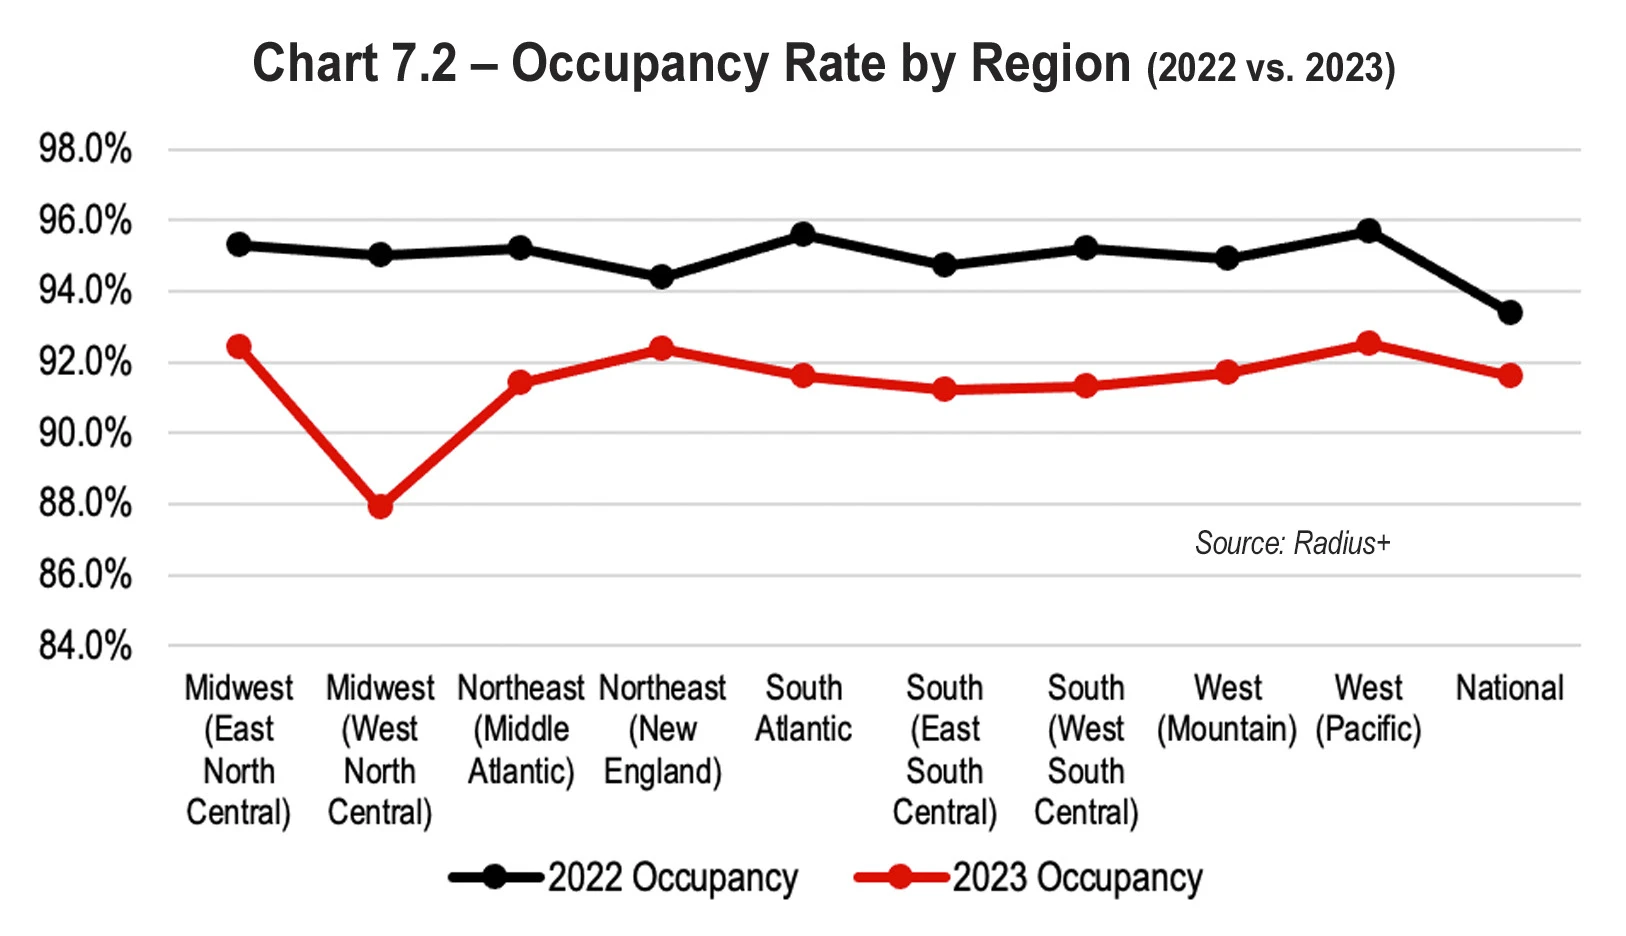
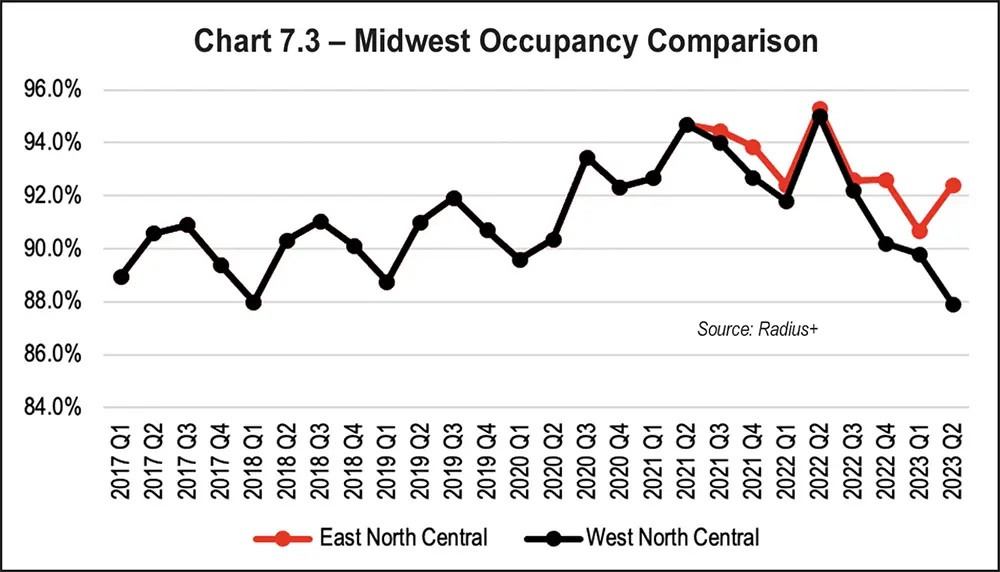
As shown in Table 7.3 and Chart 7.2 on the opposite page, occupancy fell in Q2 2023 to 92.4 percent from 95.3 percent in Q2 2022 in the Midwest region’s East North Central area. It fell to 87.9 percent from 95 percent in the Midwest’s West North Central area. It dropped to 91.4 percent from 95.2 percent in the Northeast region’s Middle Atlantic area and decreased 2.0 percent to 92.4 percent from 94.4 percent in the Northeast region’s New England area. It fell 4.0 percent to 91.6 percent from 95.6 percent in the South Atlantic region, which is not divided into subregions. The rate declined 3.5 percent to 91.2 percent from 94.7 percent in the South region’s East South Central area and fell 3.9 percent to 91.3 percent from 95.2 percent in its West South Central area. Occupancy rates also dropped in the West, with the Mountain area reporting a 3.2 percent decrease (91.7 percent from 94.9 percent) and the Pacific area experiencing a 3.5 percent decrease (92.5 percent from 95.7 percent).
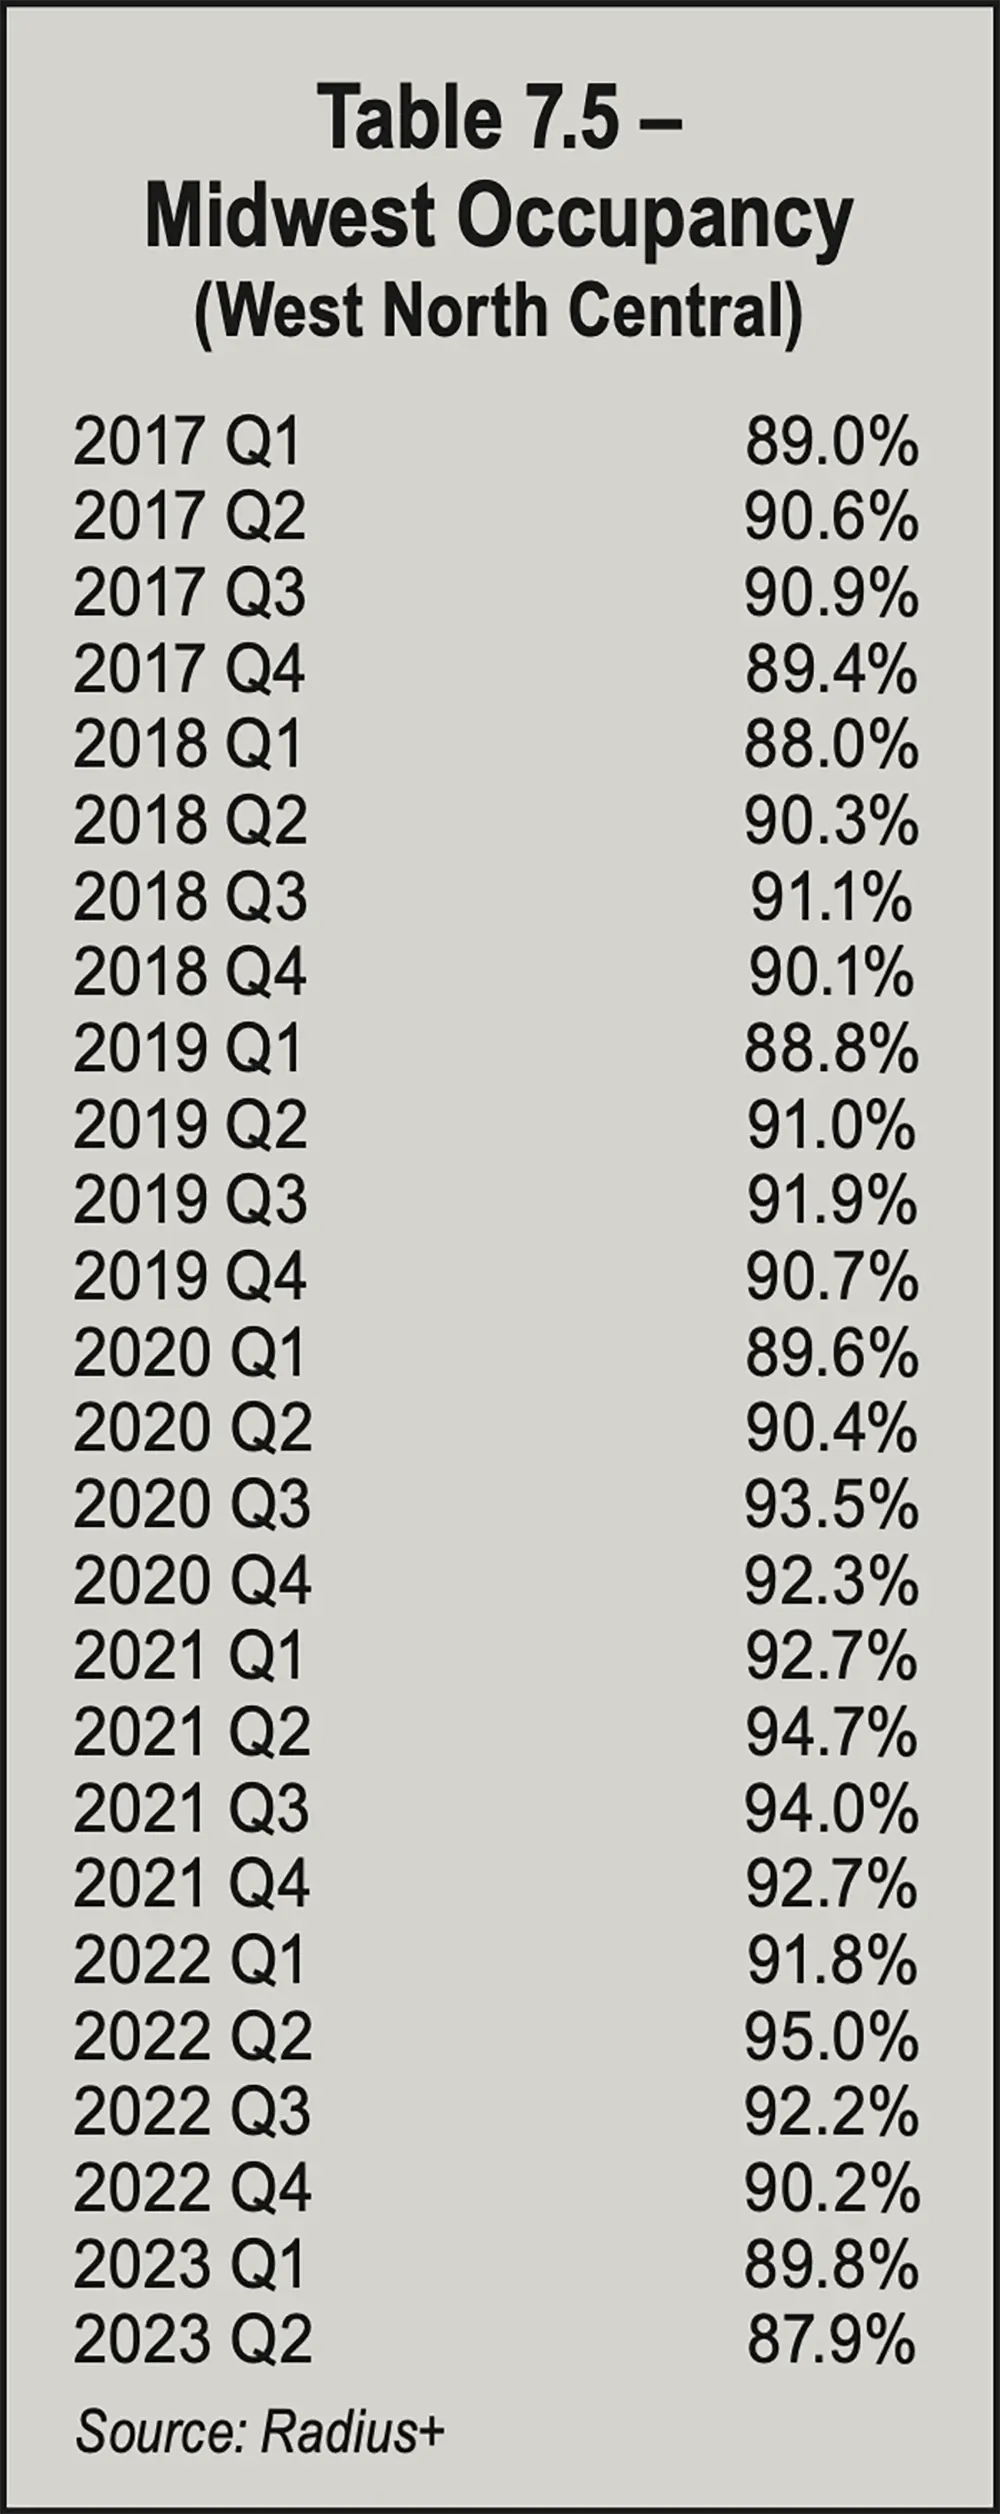
The Midwest’s North Central area’s occupancy rates from Q1 2017 through Q2 2023 were in the 90s for 19 quarters and in the 80s for seven quarters. Q2 2022 showed the highest quarterly increase, at 3.2 percent, from Q1 2022. The greatest quarterly decrease was 2.8 percent from Q2 to Q3 2022. See Table 7.5 on page 65.
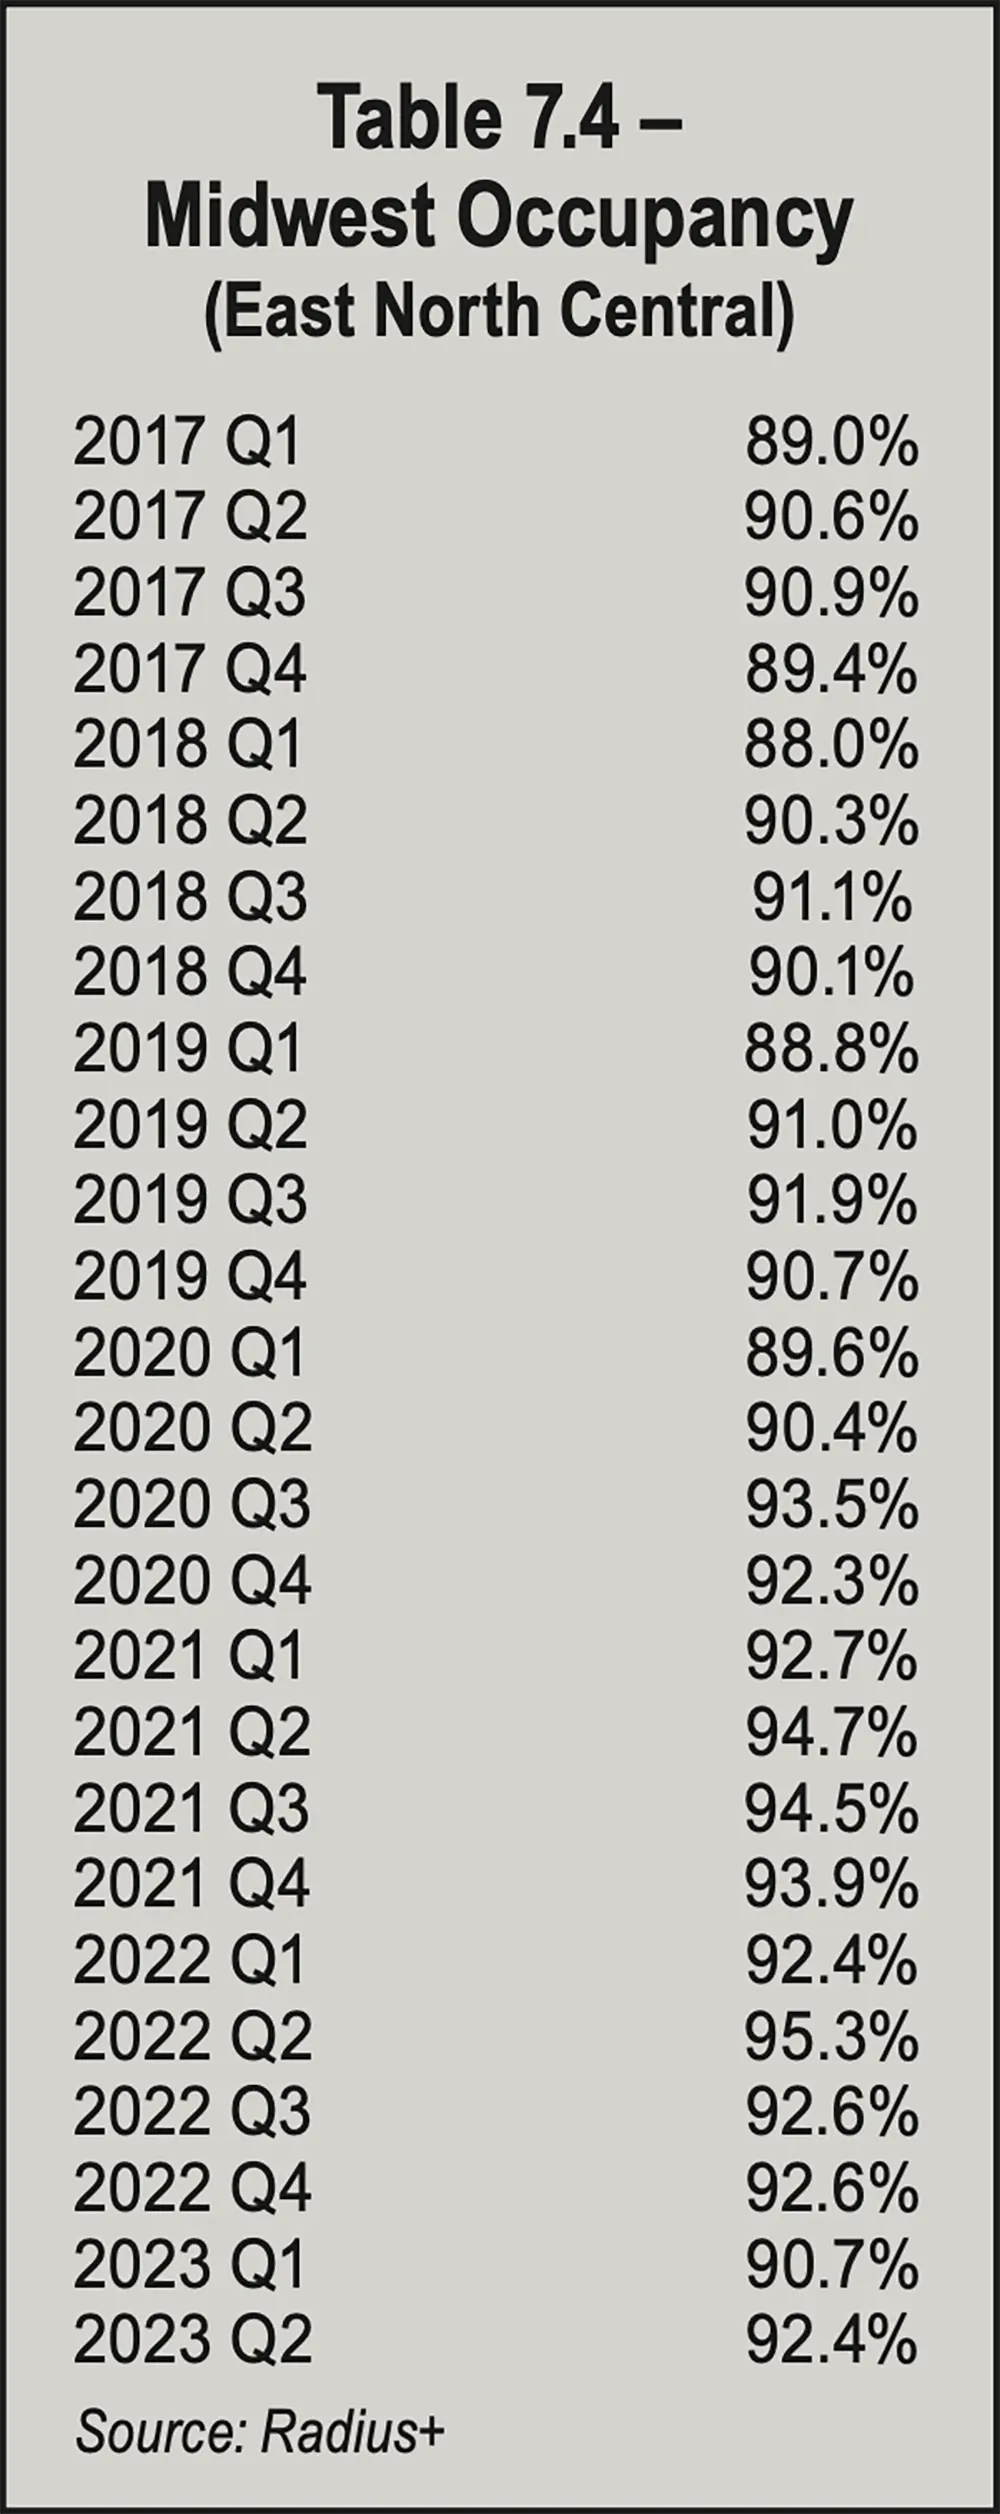
The lowest rate for the period was 89.2 percent in Q4 2019, one of three quarters in the 80s for the period, along with 89.9 percent in Q1 2019 and 89.4 percent in Q1 2020. All other quarters in the period were in the 90s. The greatest quarterly increase, 3.1 percent, was from Q2 to Q3 2020. The greatest quarterly decrease, 2.6 percent, was from Q2 to Q3 2022.
From Q1 2017 through Q2 2023, occupancy rates rose from Q1 to Q2 and Q2 to Q3 (except when it fell from Q2 2022 to Q3 2022) and fell from Q3 to Q4.
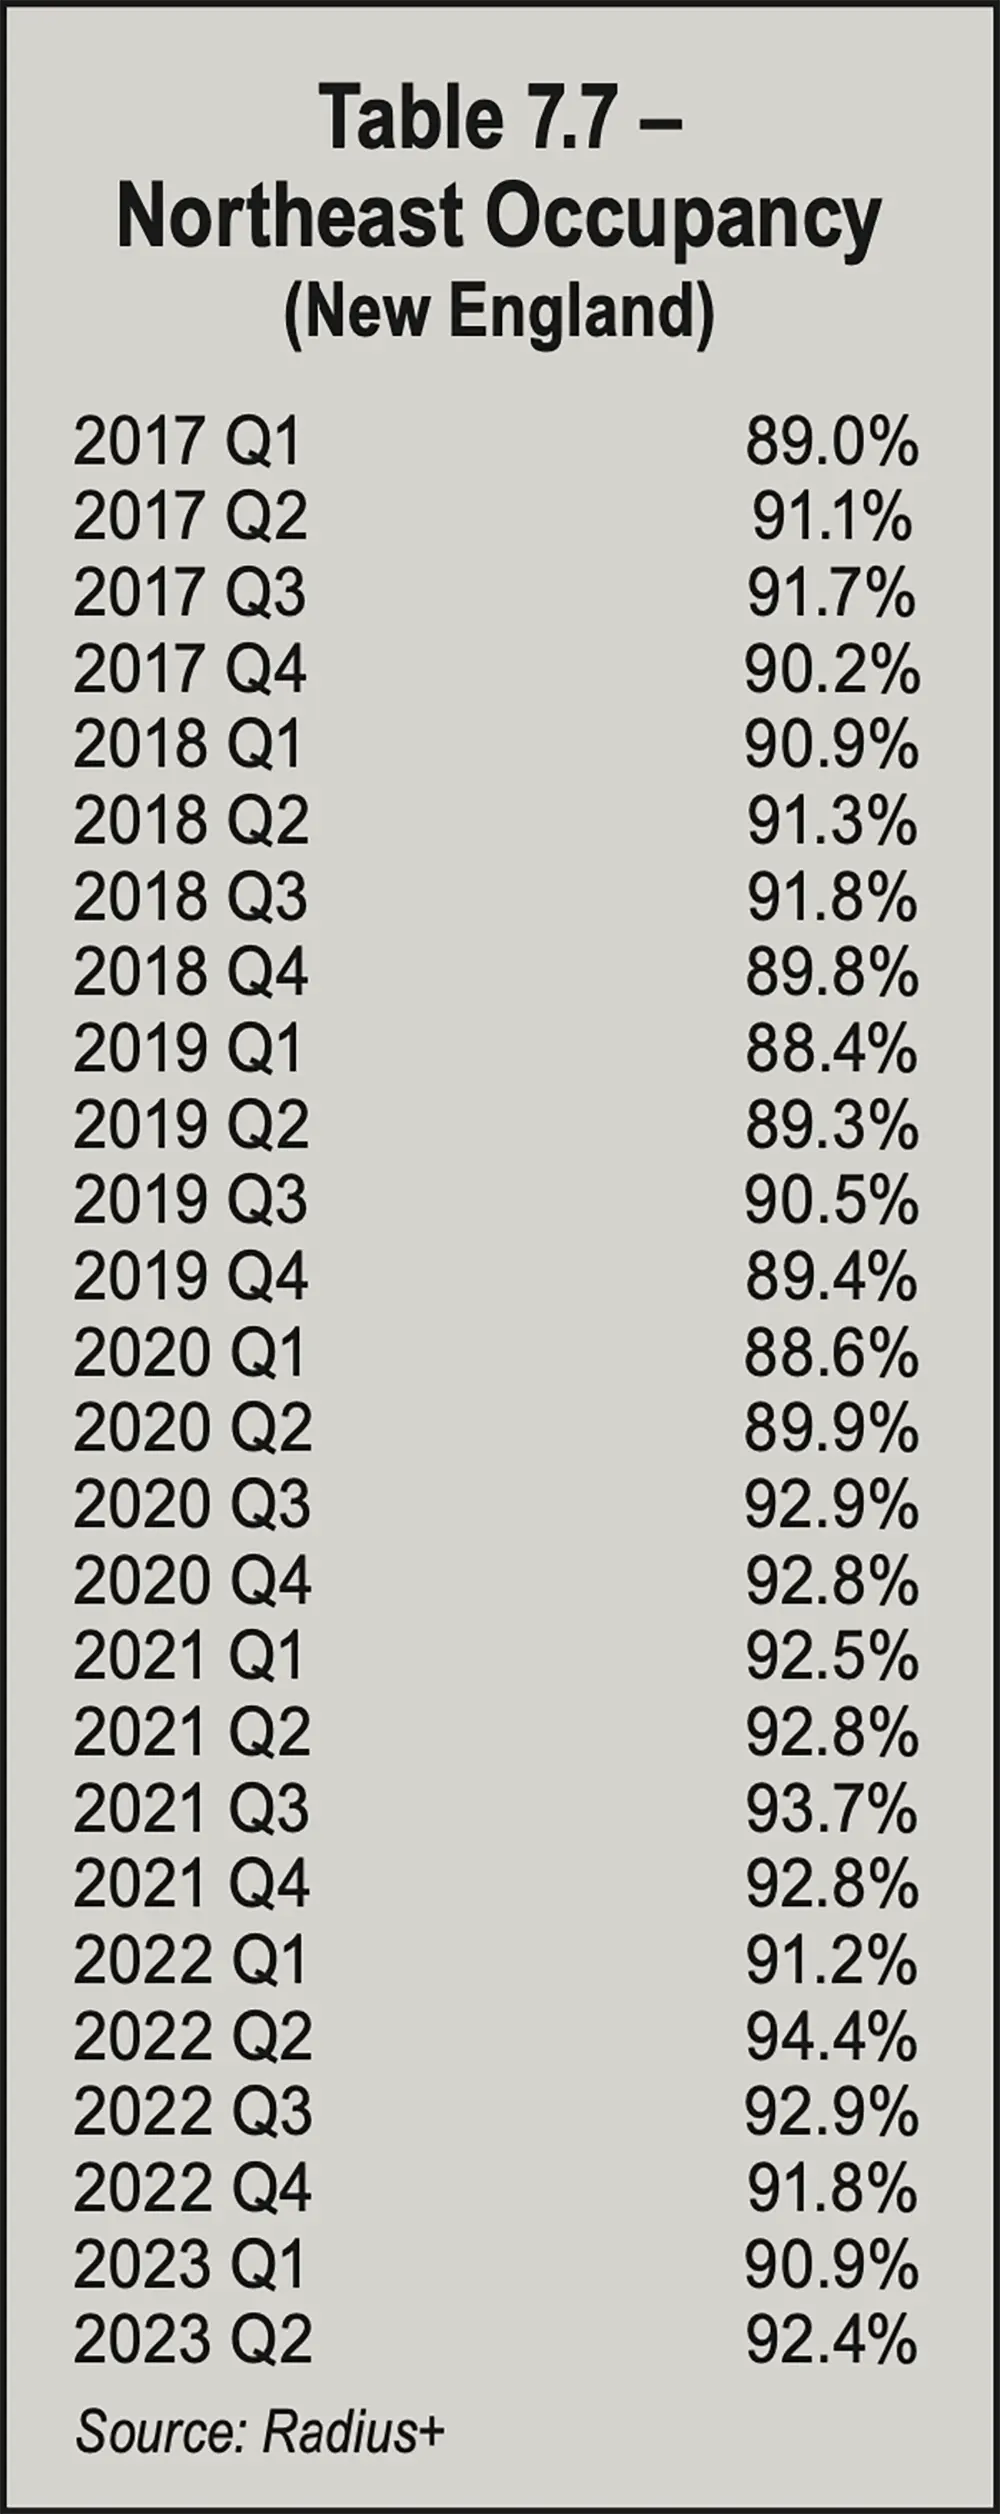
Table 7.7 on page 66 shows the Northeast’s New England area’s high rate for the period was 94.4 percent in Q2 2022. The low rate was 88.4 percent in Q1 2019. Q2 2023 rose 1.5 percent from 90.9 percent the prior quarter and rose 1.1 percent from 91.8 percent in Q4 2022. Occupancy rates rose from Q1 to Q2 and from Q2 to Q3 (except in 2022) and decreased from Q3 to Q4 throughout the period. Q1 fell from Q4 five times and rose once. Occupancy rates were in the 80s for seven quarters and in the 90s for 19 quarters.
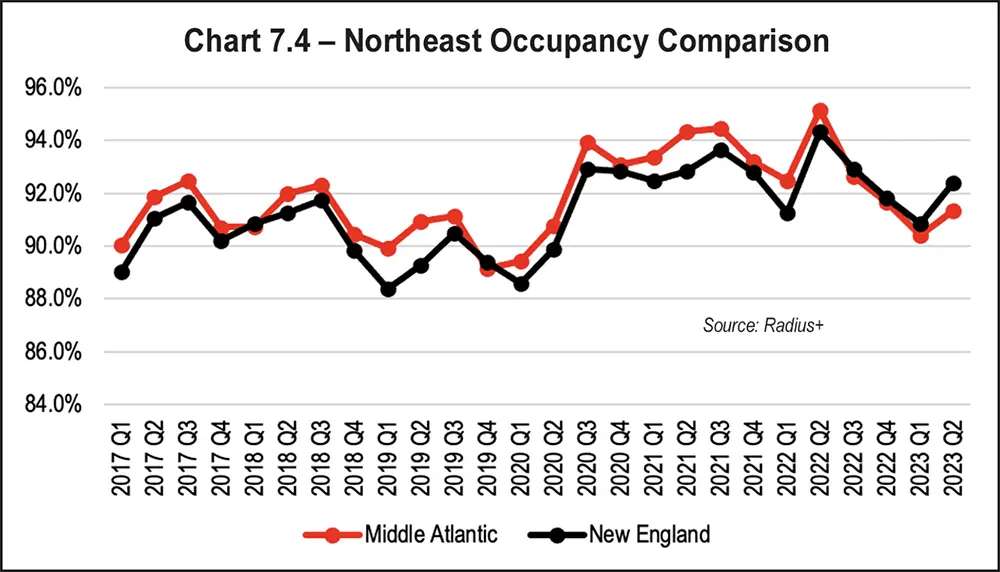
As Chart 7.4 on page 66 shows, occupancy rates in the Middle Atlantic were higher than in New England in 20 quarters and lower in six quarters (Q1 2018, Q4 2019, and Q3 2022 through Q2 2023).
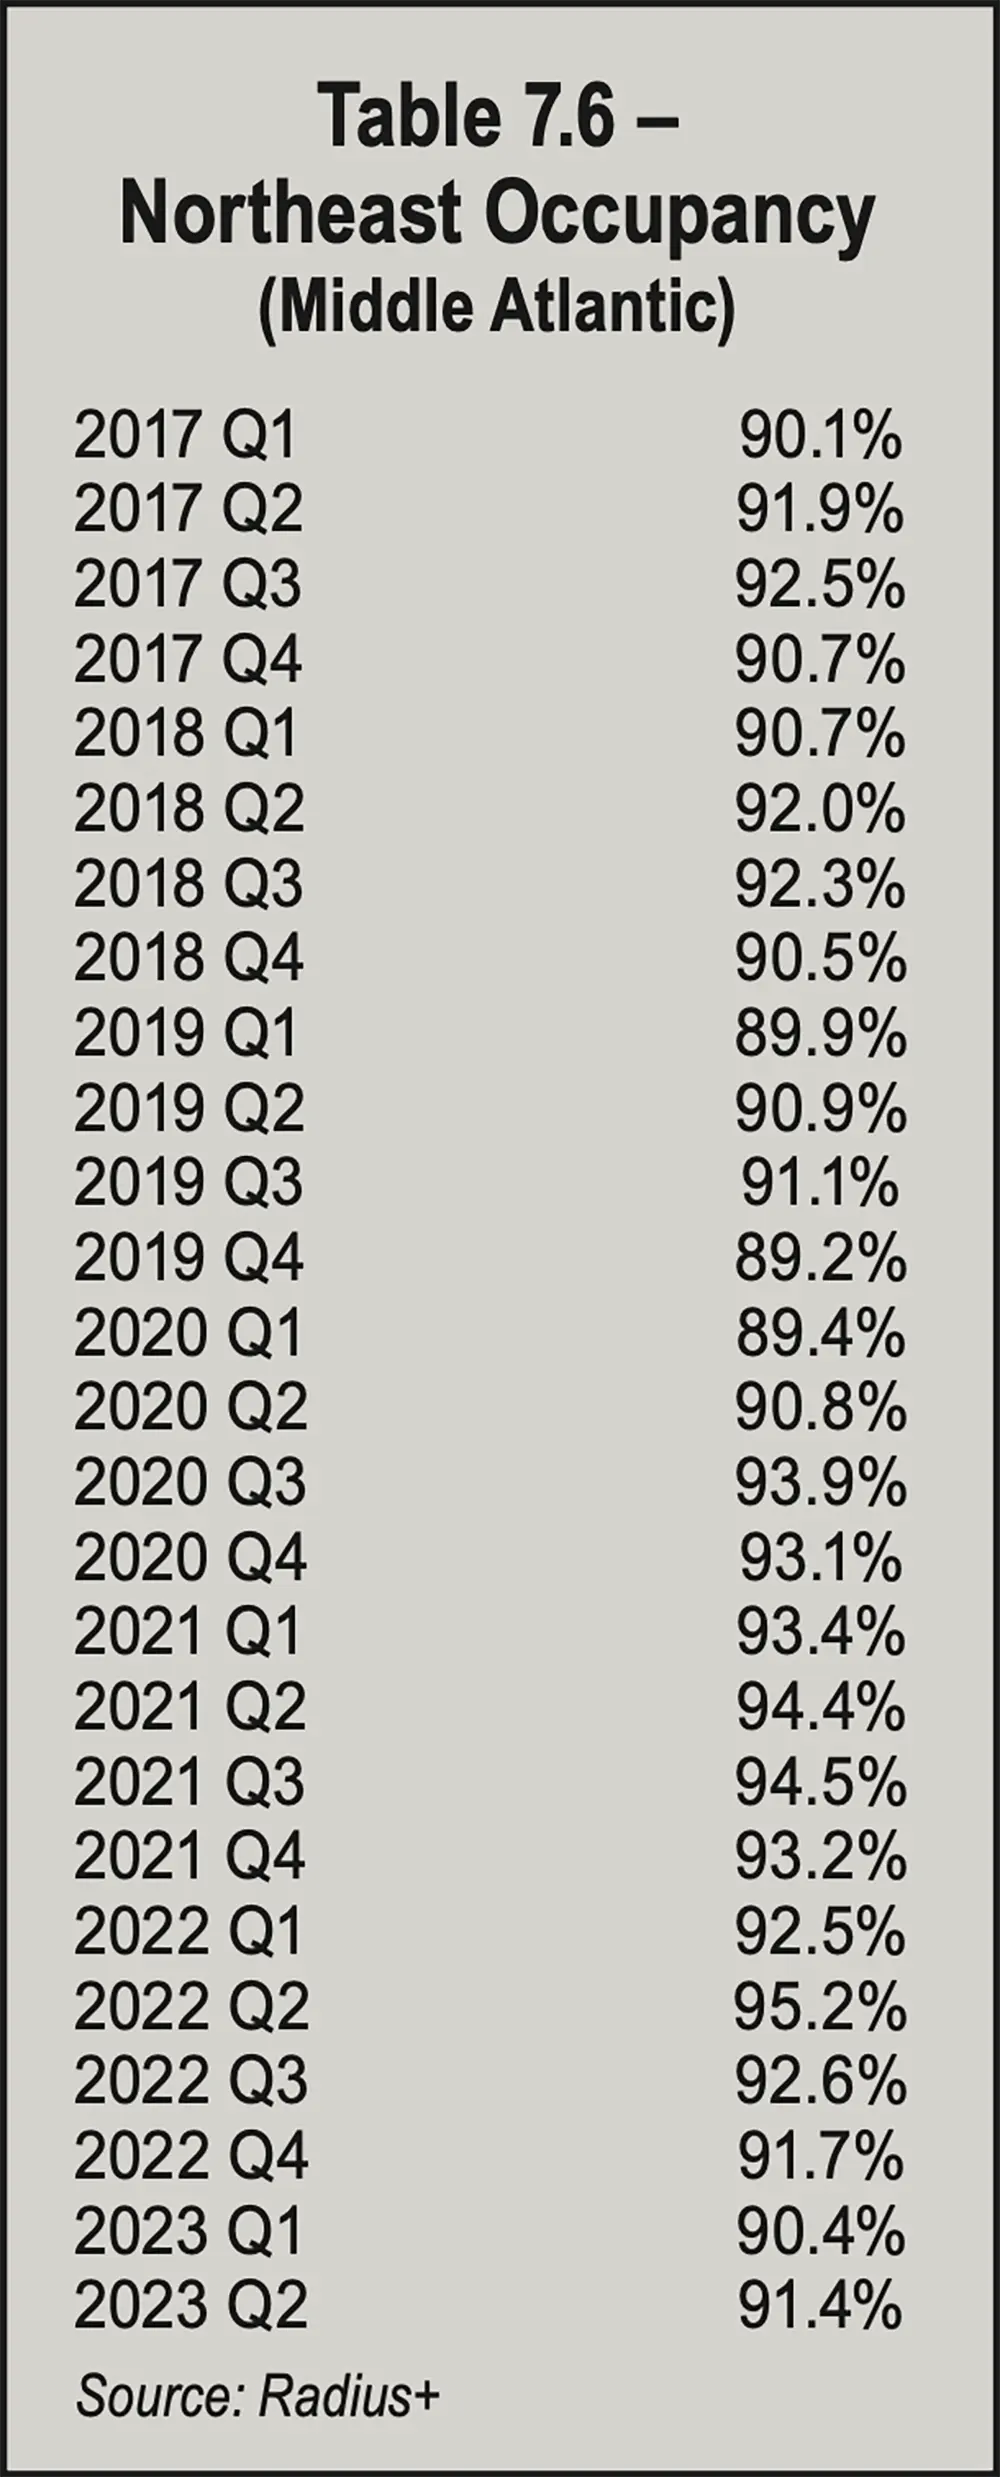
Occupancy rates increased throughout the period from Q1 to Q2. Rates rose from Q2 to Q3 three times (2017, 2019, and 2020) and fell three times (2018, 2021, and 2022). Rates fell from Q3 to Q4 except in 2020, when they rose. From Q4 to Q1, the rate fell four times, rose once, and was unchanged once. Occupancy was in the 90s for 19 quarters and in the 80s for seven quarters.
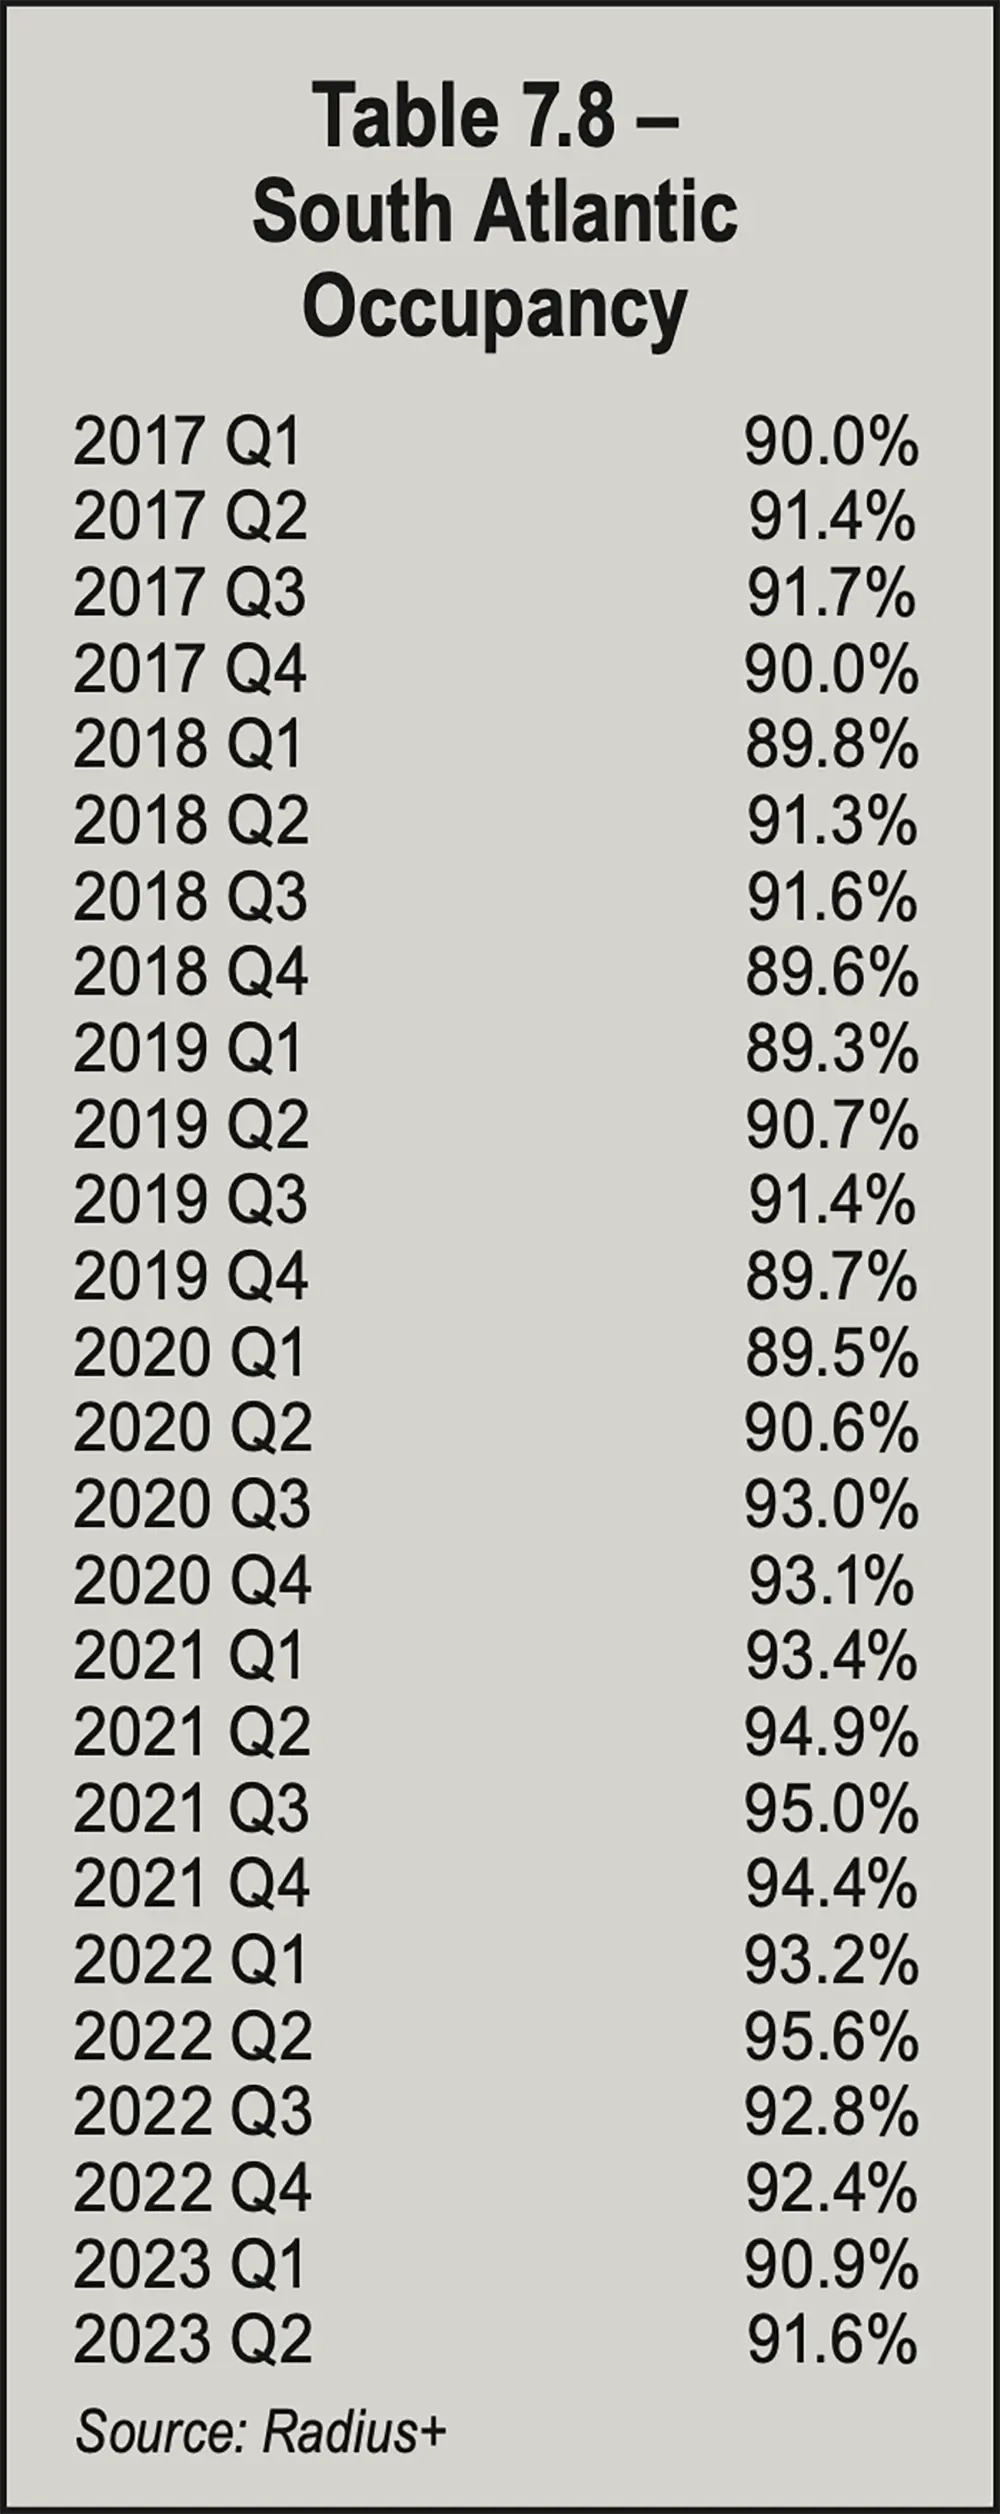
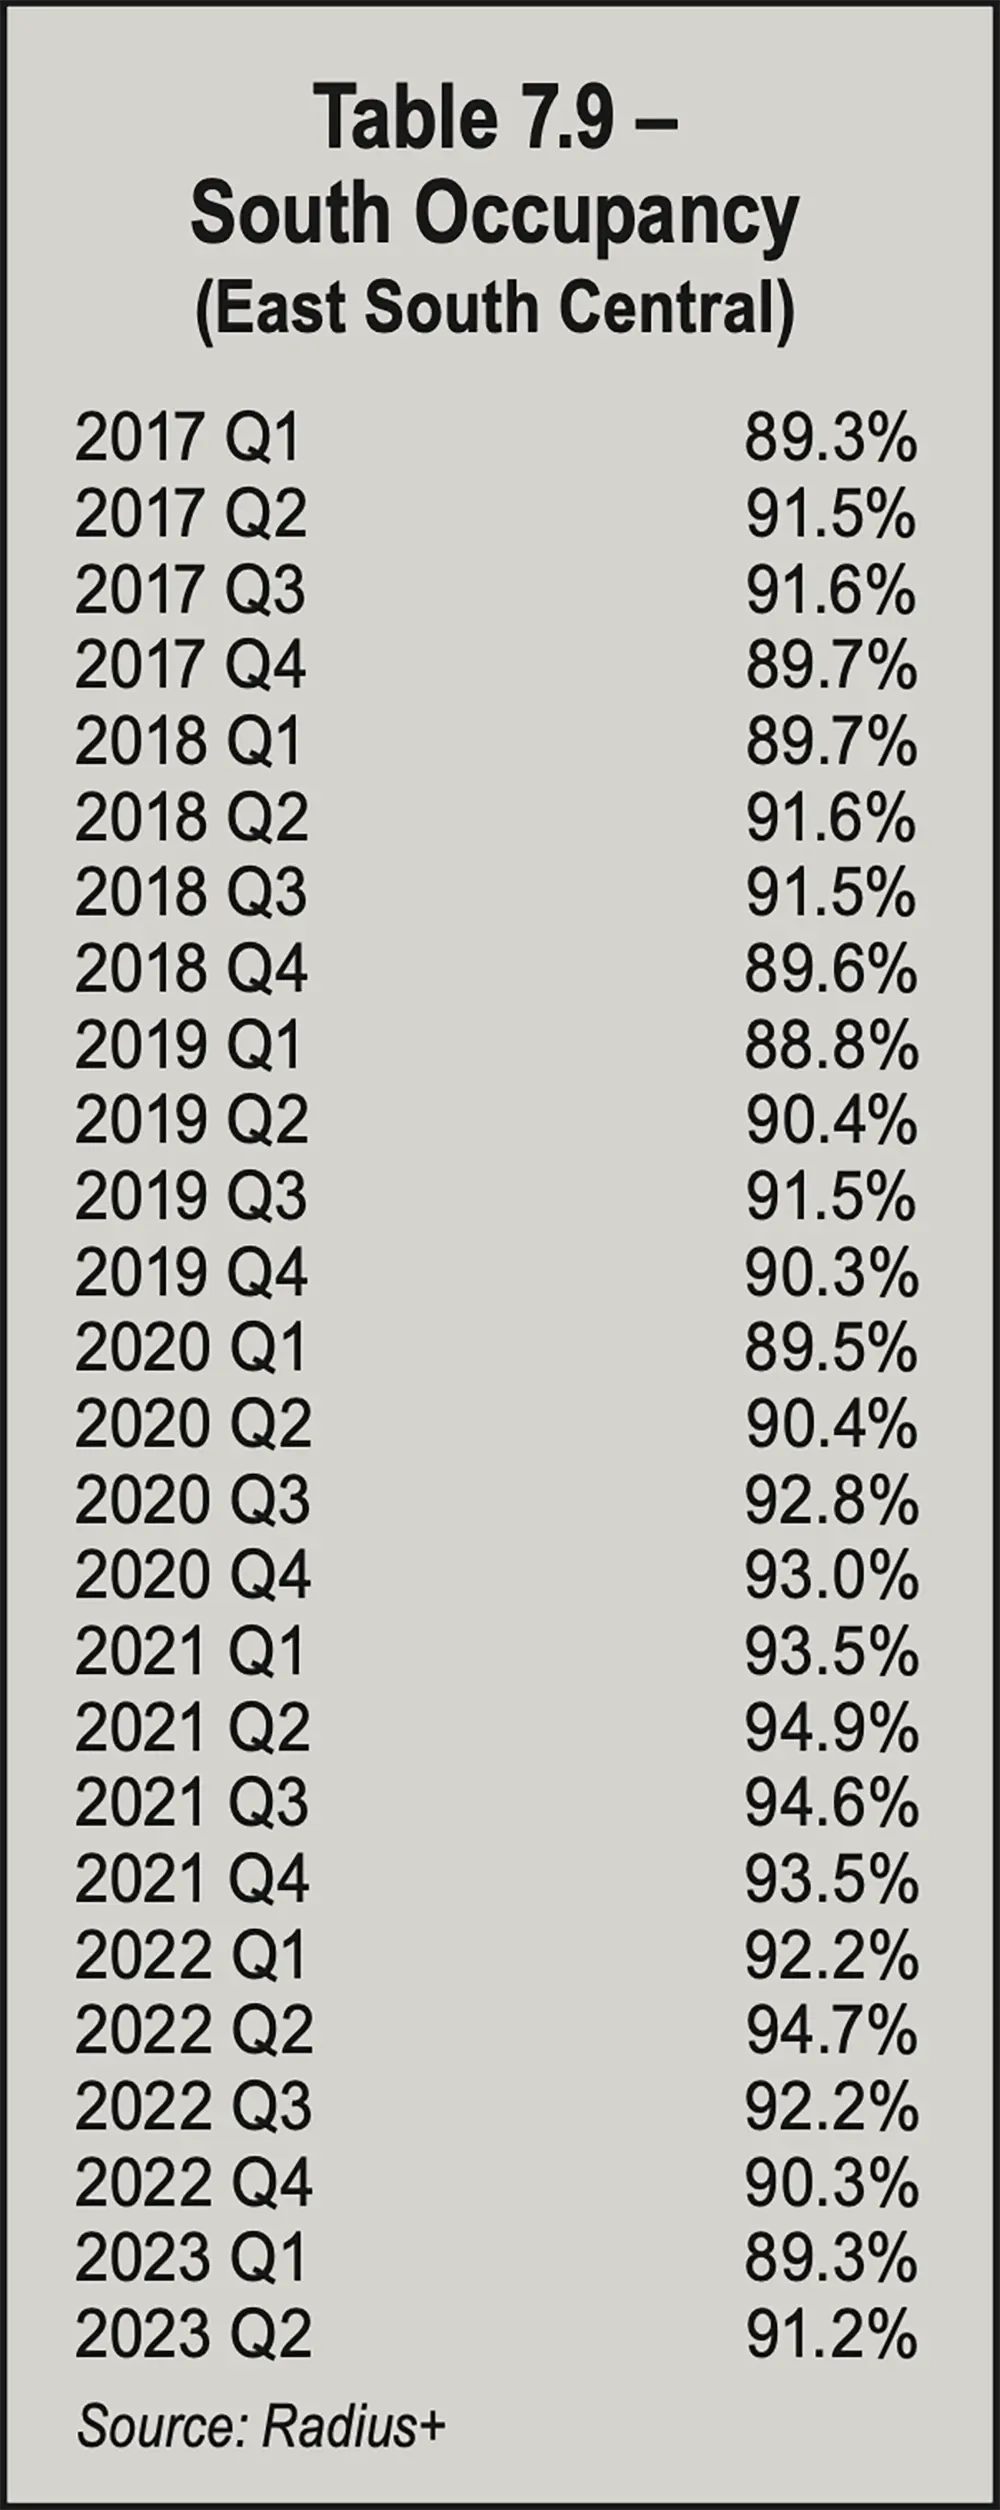
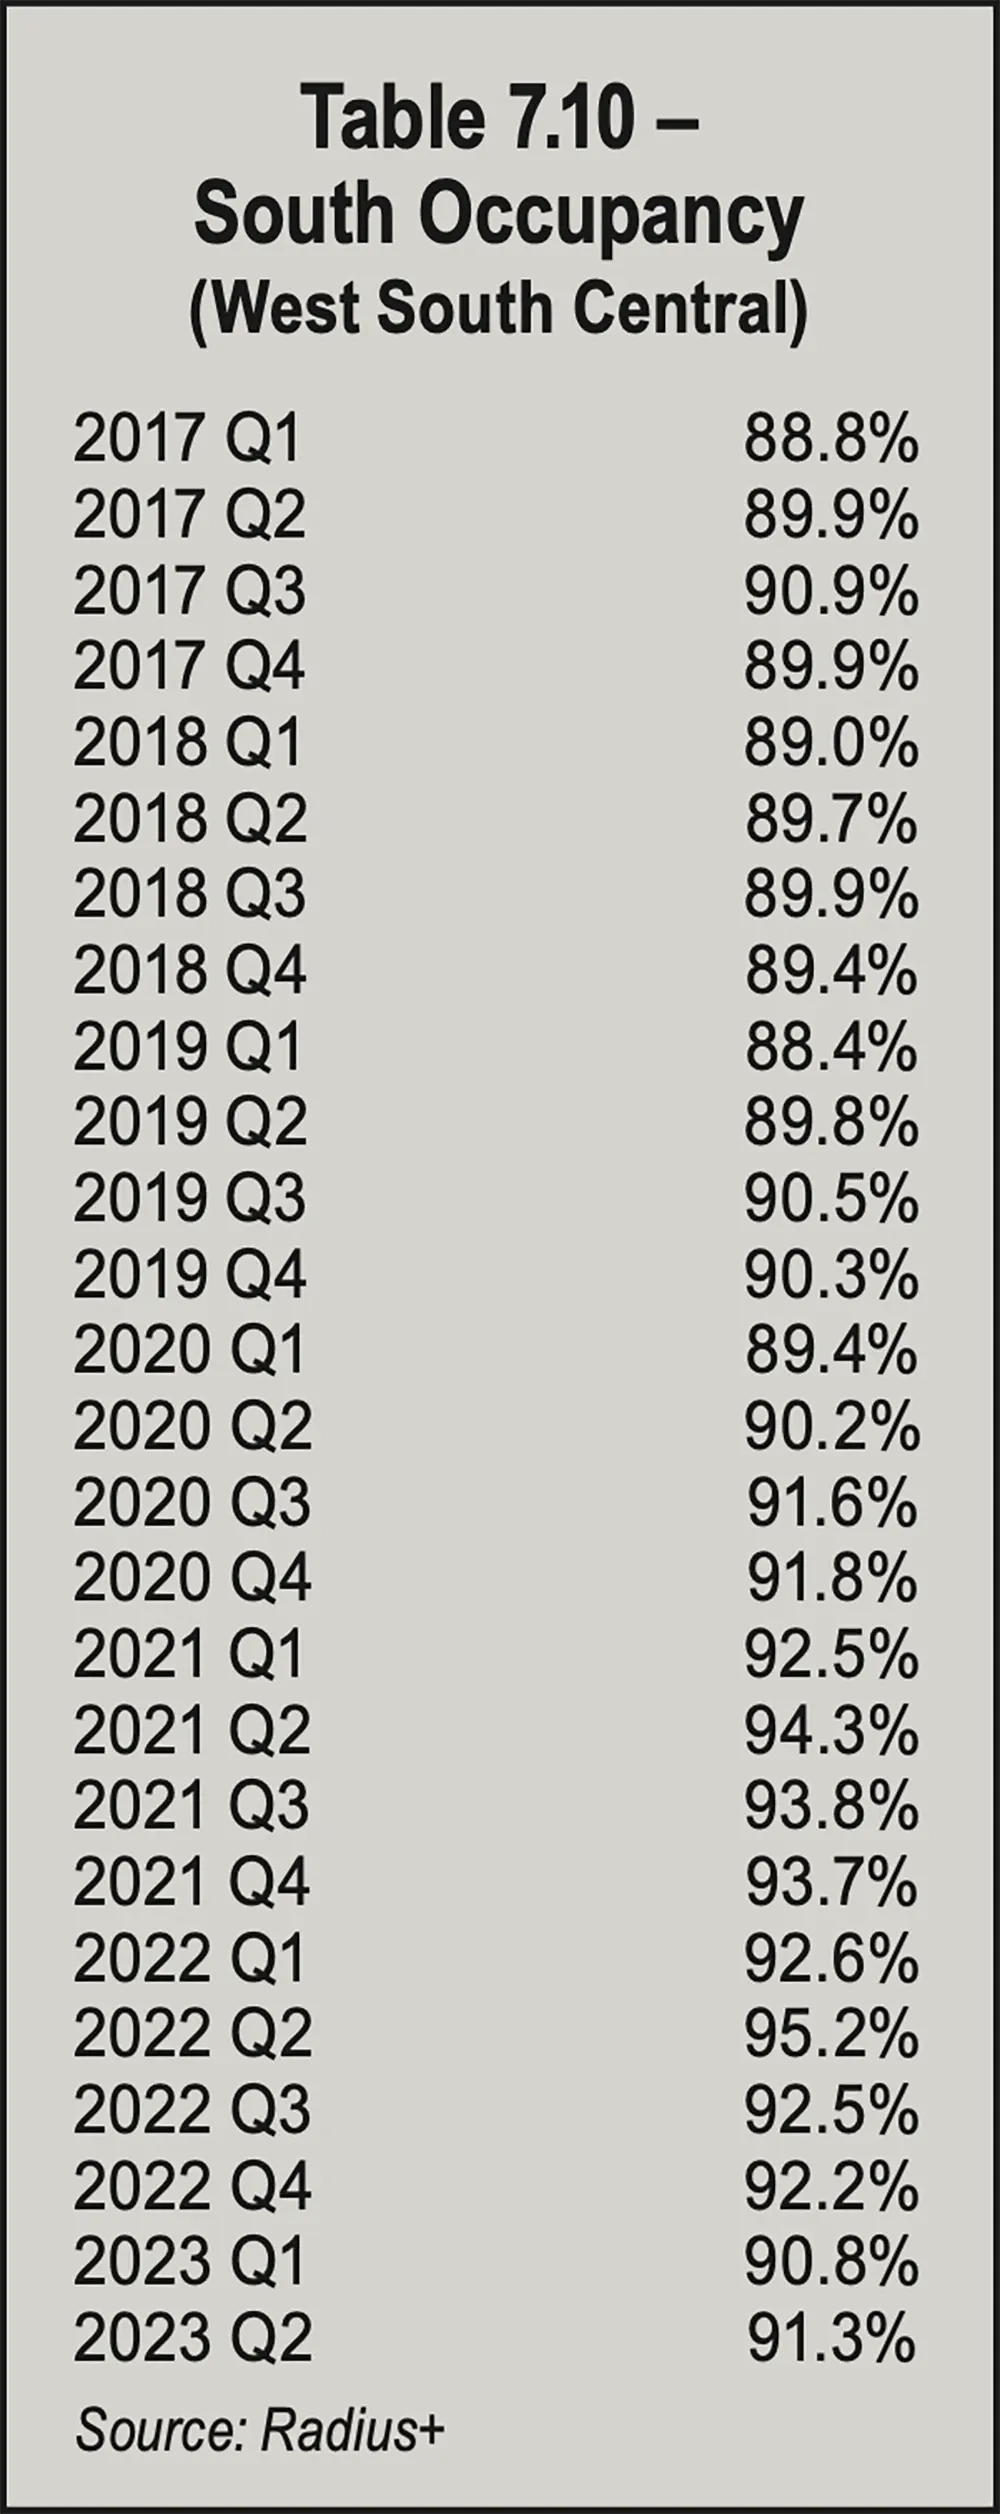
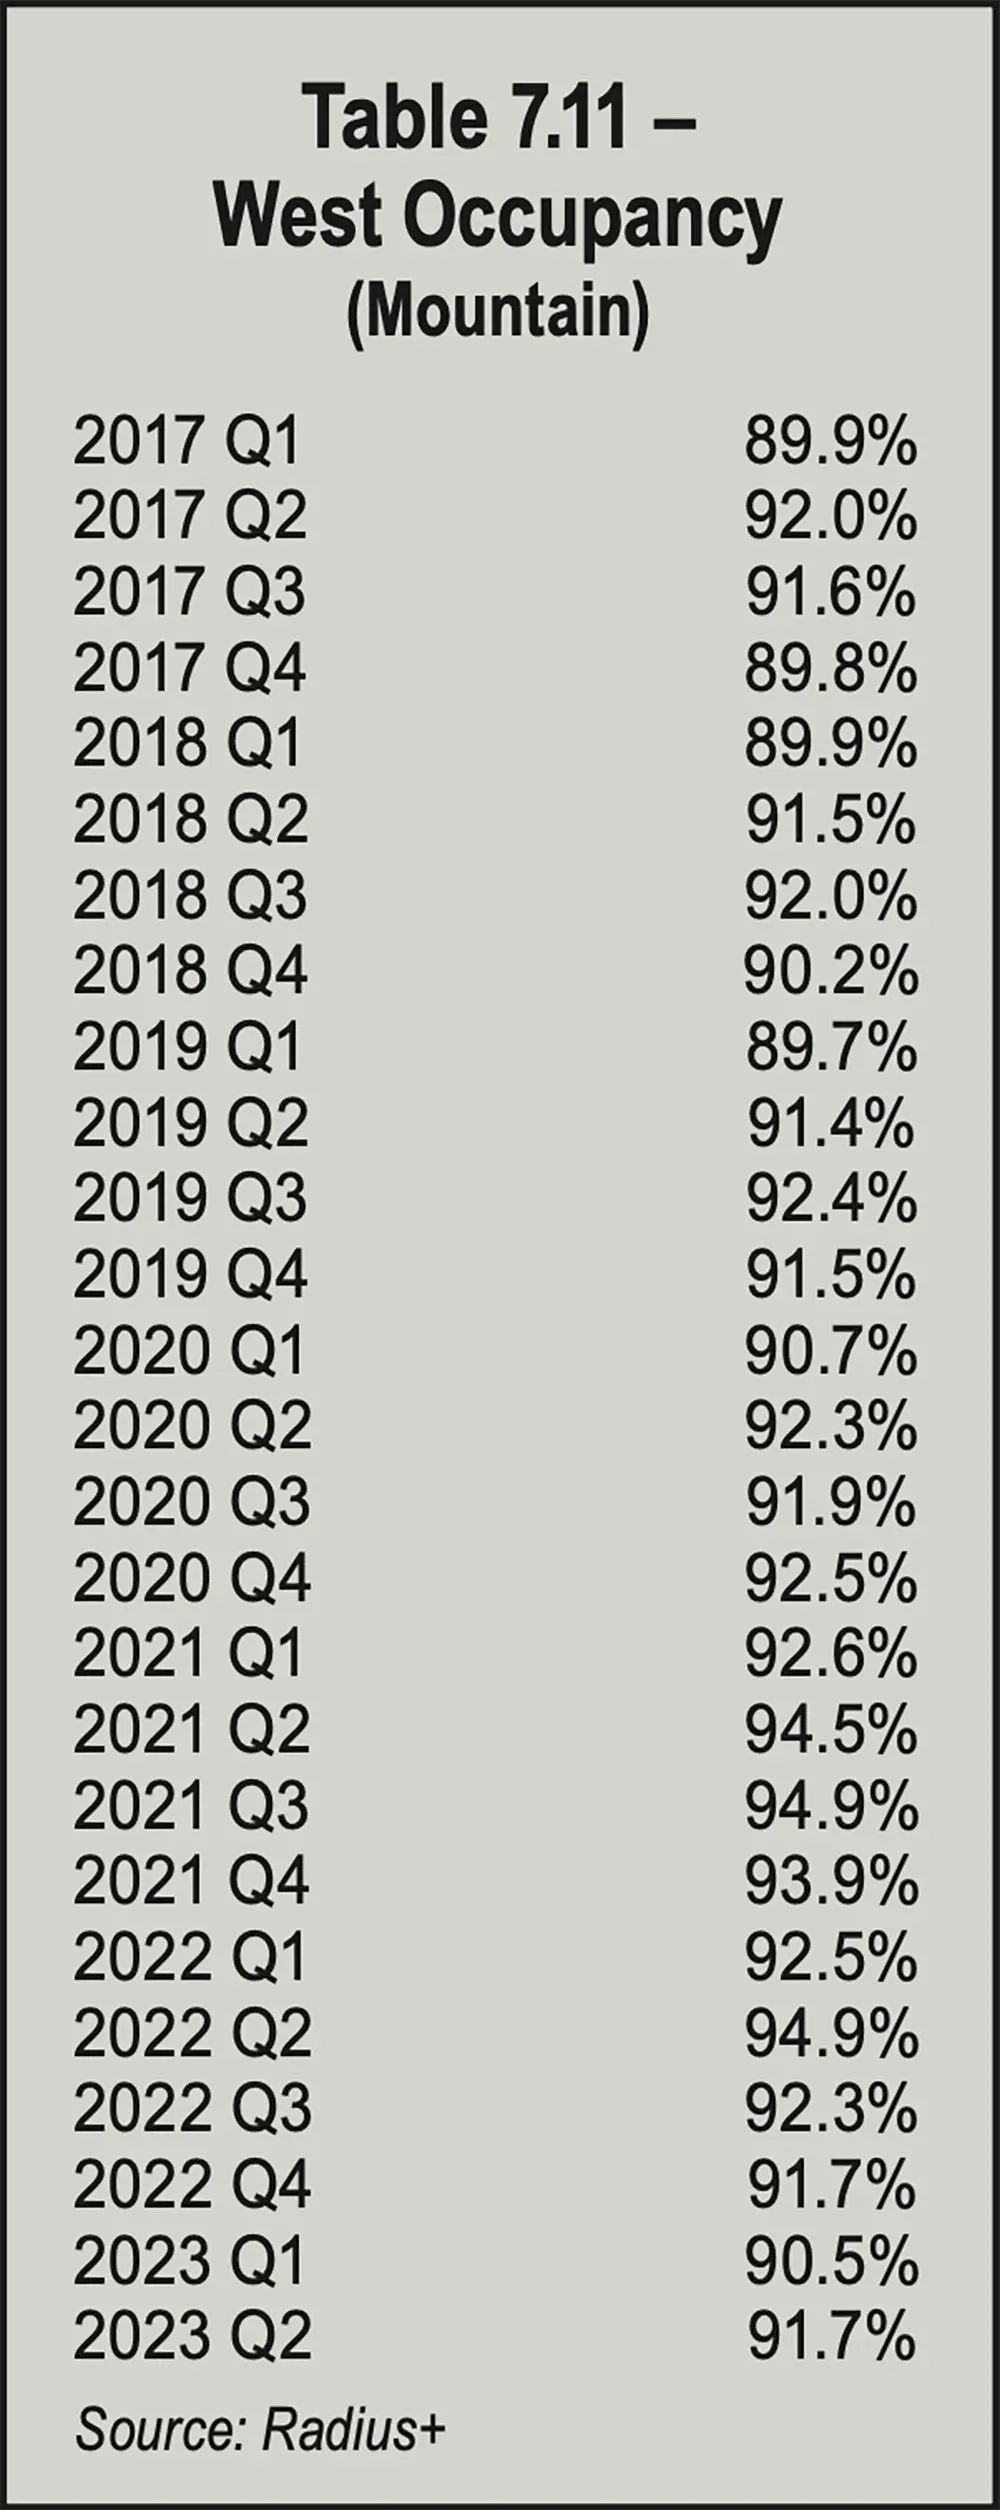
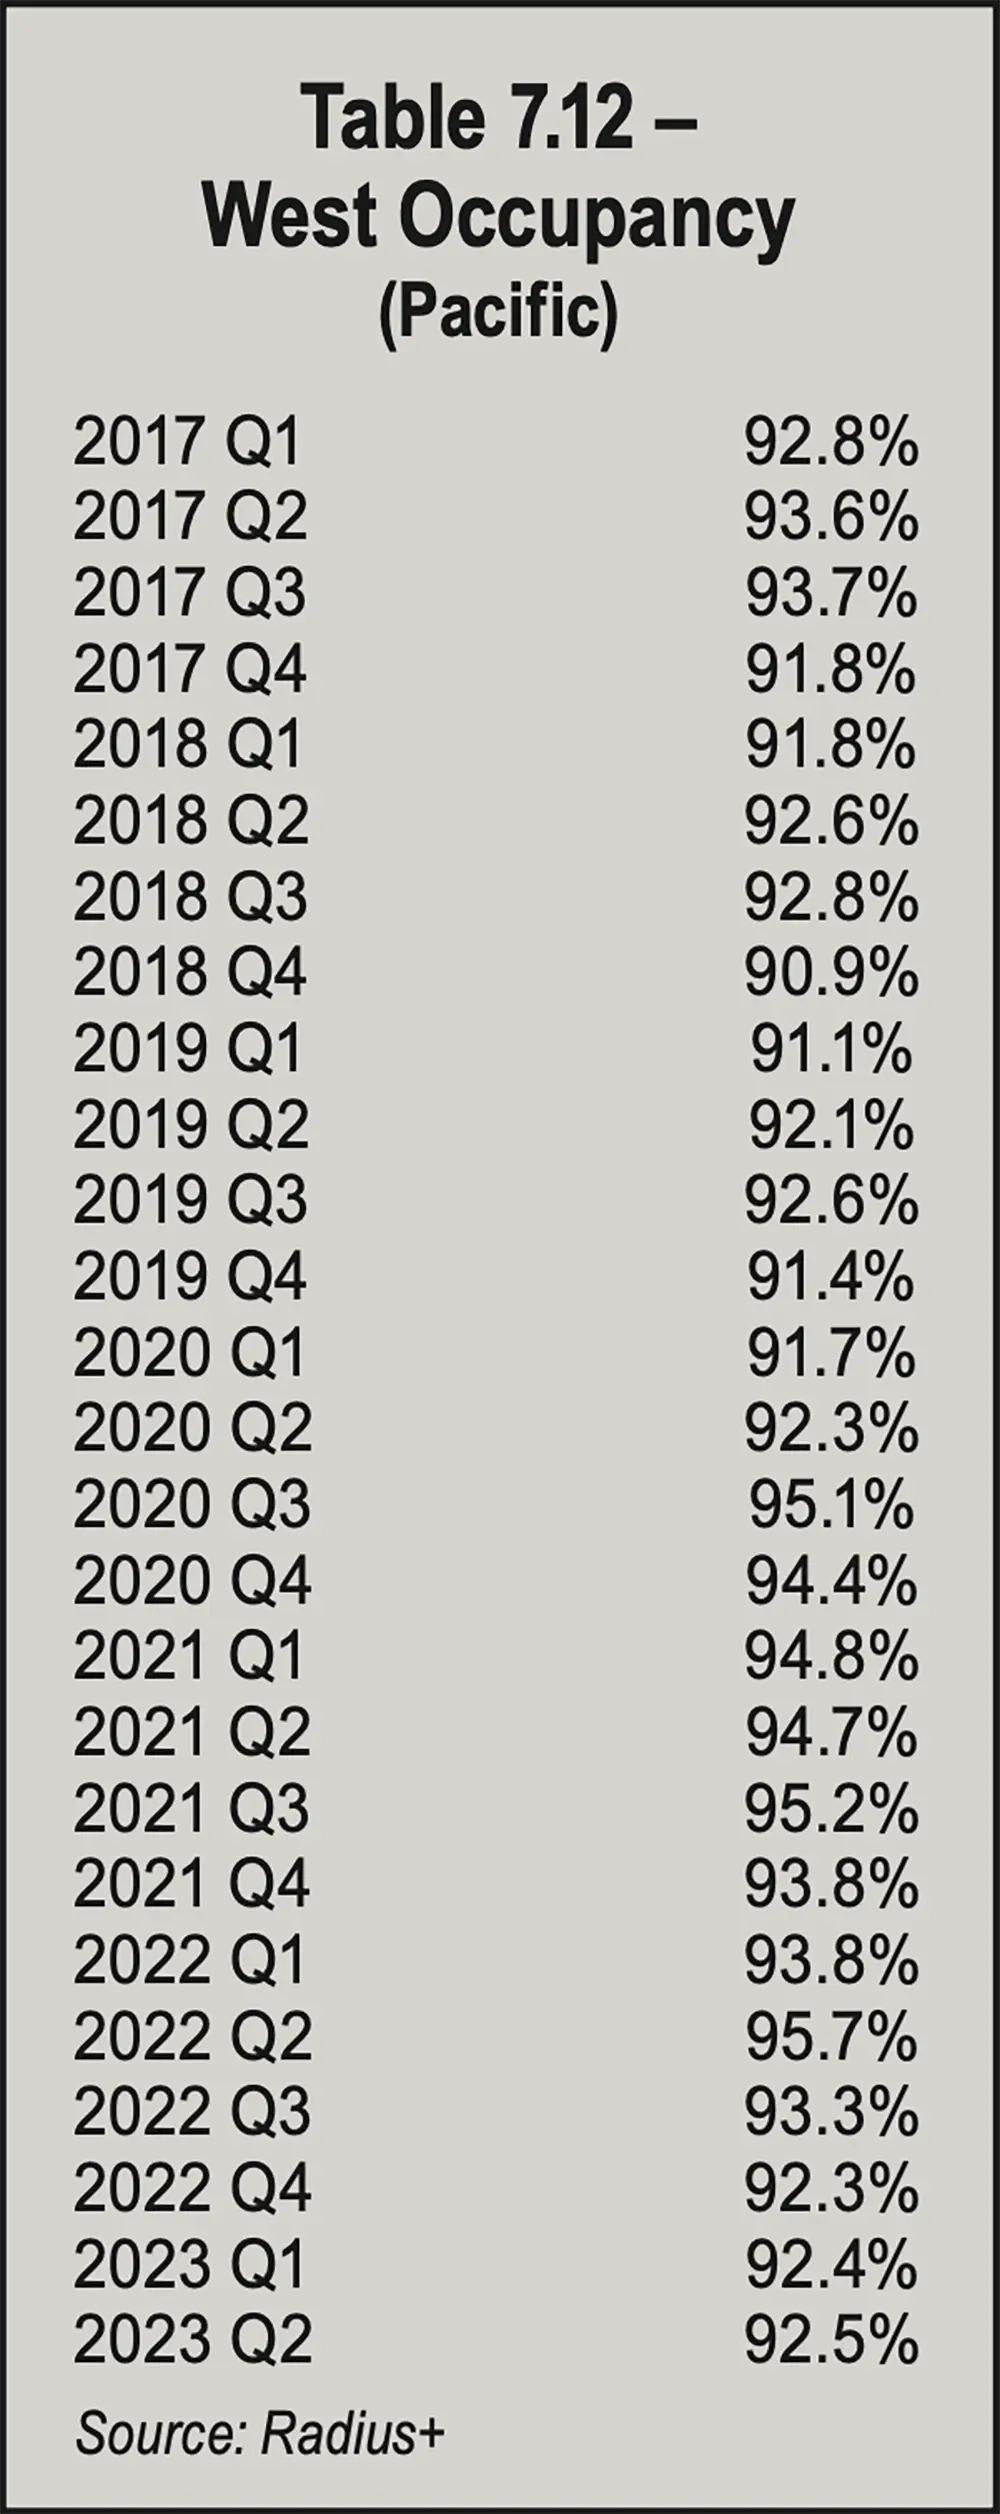
Chart 7.5 on page 67 shows that for the period from Q1 2017 through Q2 2023, the East South Central area had higher occupancy rates than the West South Central 17 quarters and lower rates in eight quarters. The rates were the same (90.3 percent) in Q4 2019.
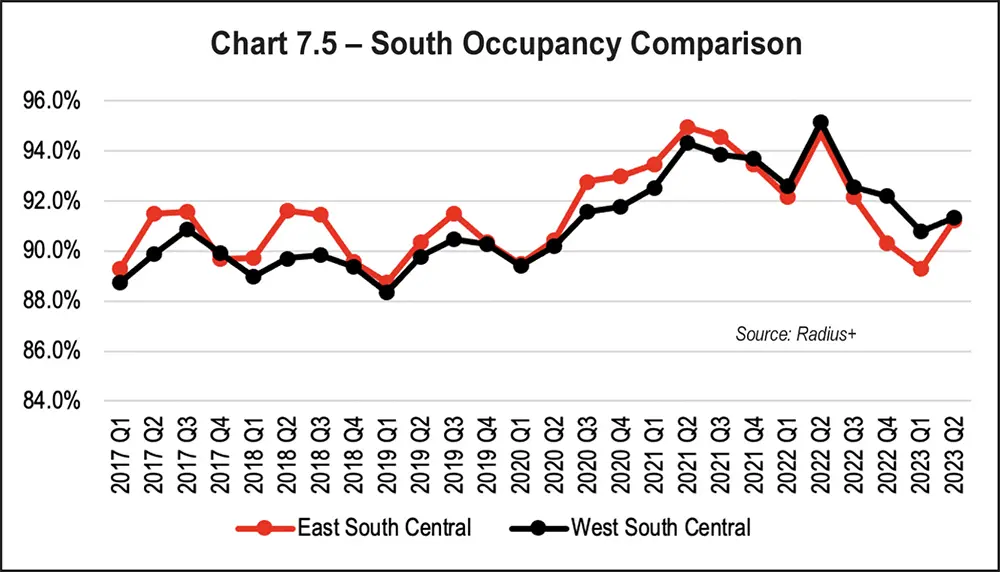
For the entire period, rates increased from Q1 to Q2, increased three times and decreased three times from Q2 to Q3, decreased five times and increased once from Q3 to Q4, and decreased three times and increased three times from Q4 to Q1. For the whole period, occupancy rates were in the 80s in four quarters and the 90s in 22 quarters.
Occupancy rates from Q1 2017 through Q2 2023 in the West region’s Pacific area, shown in Table 7.12, peaked in Q2 2022 at 95.7 percent. The lowest rate was 90.9 percent in Q4 2018. Q1 2017 had a 92.8 percent rate. Q2 2023’s 92.5 percent rate was the result of two quarterly increases of 0.1 percent (from 92.4 percent in Q1 2023 and 92.3 percent in Q4 2022. The greatest quarterly increase was 2.8 percent from Q2 to Q3 2020. Q2 2022 to Q3 2022 had the greatest quarterly decrease (2.4 percent).
Throughout the period, occupancy rose from Q1 to Q2, except in 2021. Rates rose from Q2 to Q3, except when they fell in 2022. Rates fell from Q3 to Q4 throughout the period. Rates rose from Q4 to Q1 four times; they remained unchanged from Q4 2017 to Q1 2018 (91.8 percent) and Q4 2021 to Q1 2022 (93.8 percent). Occupancy rates were in the 90s in all quarters. See Table 7.12 on the opposite page.
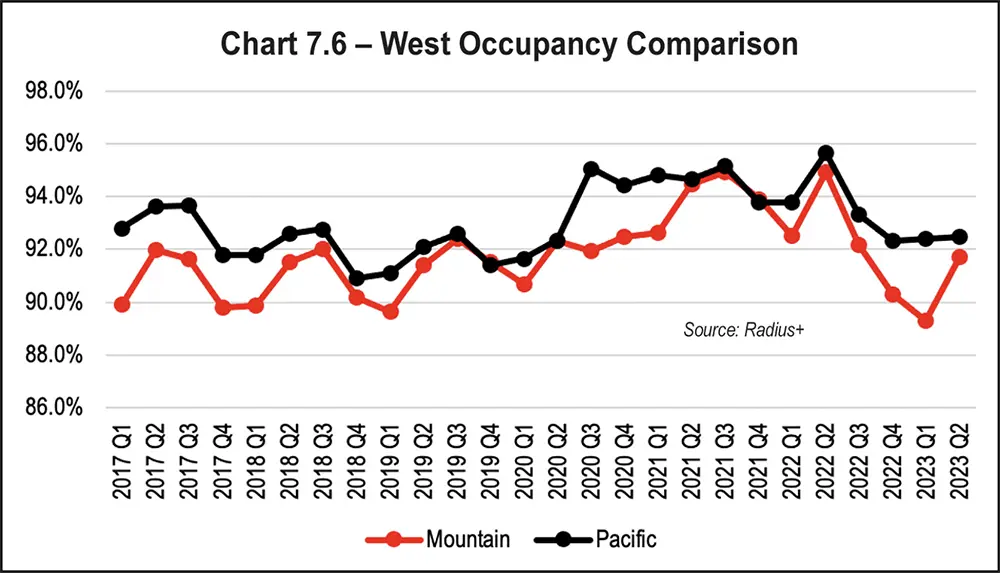
Chart 7.6 on the opposite page compares the Mountain and Pacific areas of the West region. It shows the Pacific area had higher occupancy rates from Q1 2017 through Q2 2023 in every quarter except Q4 2019, Q4 2021, and Q2 2020 (tied at 92.3 percent).
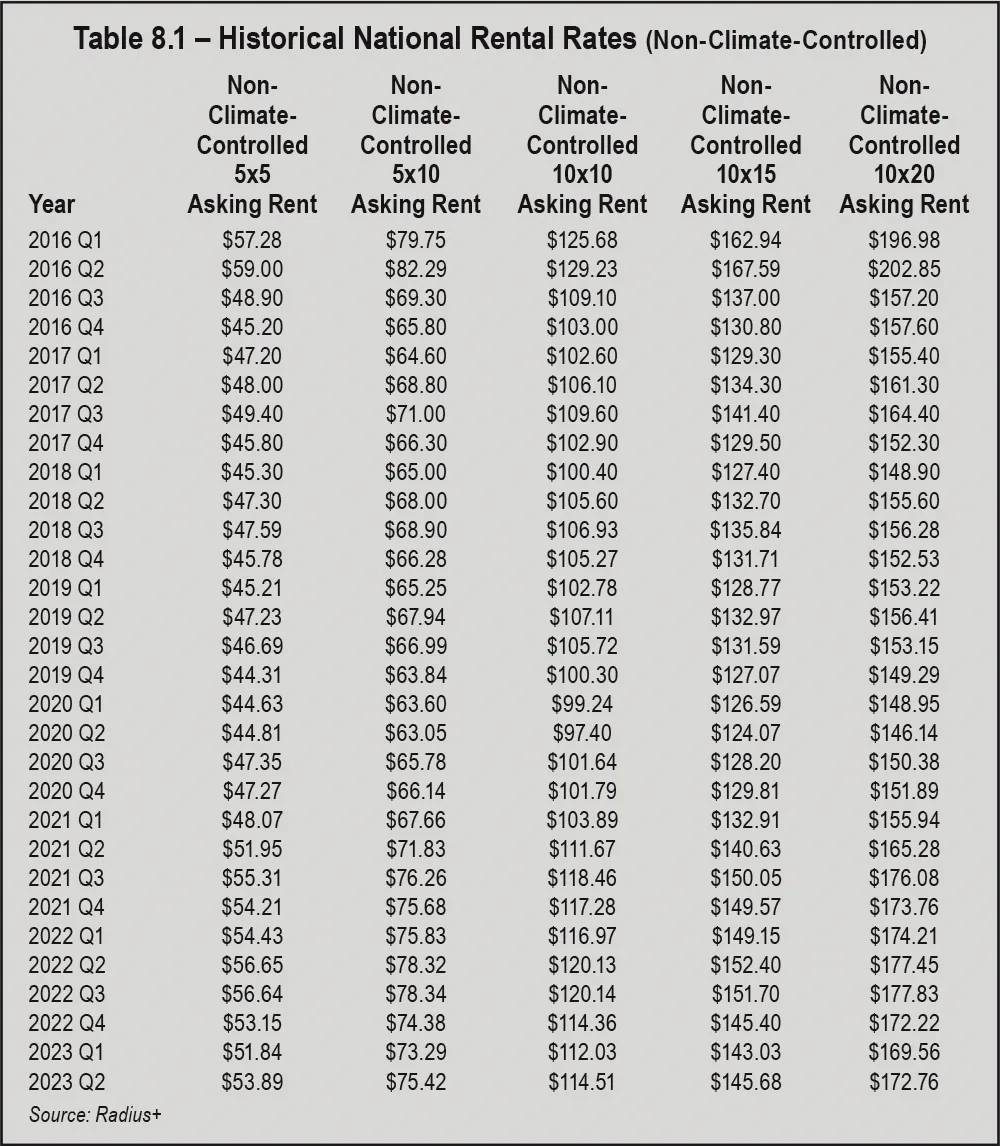
esides charging monthly rates for storage units, self-storage facilities can generate income in several ways, such as selling packing supplies and protection policies, renting moving trucks, offering ancillary services, and charging various administrative fees. However, rental rates remain the primary source of revenue. As such, self-storage operators should be regularly adjusting their street rates based on supply and demand and increasing the rental rates of existing customers on an annual or semi-annual basis. For instance, street rates should be increased when demand for a certain unit size and/or type is high but its supply is limited.
While rate management software helps self-storage operators to improve their net operating income, supply and demand ultimately determine the asking rates. For example, there was a staggering amount of new self-storage development across the country from 2016 to 2019 that diminished demand in some of the major metropolitan statistical areas (MSAs) and secondary markets within the United States into 2020. Afterward, supply chain issues, material shortages, and a lack of labor due to the COVID-19 pandemic caused new development to come to a temporary halt. That brief hiatus, coupled with unprecedented pandemic-related demand for storage space and drawn-out approval processes for development, helped correct the imbalance. To satisfy growing demand from both commercial and residential customers, new development resumed in 2021, albeit at a slightly slower pace, and brought more self-storage space to the market. Since then, higher interest rates, crippling inflation, and a tighter lending market have kept new supply from exceeding demand.
In general, new supply seems to be in check, but it’s believed that the housing market has been putting pressure on demand since the 2023 Self-Storage Almanac was published. Elevated home values, significantly higher interest rates, and insufficient household incomes have created an unaffordable housing market for many Americans. As Arlen Nordhagen, founder and vice chairman of National Storage Affiliates Trust says, “Almost no one today is selling their existing home with a 3 to 4 percent mortgage to move into a nicer home with a 7 to 8 percent mortgage!”
Mike Burnam, CIO and president of StorageMart, has also voiced concern with the housing market. “If people cannot buy homes, they do not move; if they do not move, the demand for storage stagnates.”
Unfortunately, as you will see in the tables within this section, it’s possible that idle demand is to blame for declines in rental rates in the second half of 2022 and into 2023. Another possible contributing factor of the lower rental rates is the fact that some self-storage businesses have been experiencing push back from displeased customers who felt they were misled by extremely low introductory rental rates after receiving substantial price hikes a few months into their tenancy—a revenue management tactic that a few REITs began using in the second half of 2023. Some of these disgruntled customers even contacted news outlets and city officials to voice their concerns over these exorbitant practices, which initiated discussions about potential caps on self-storage rental rate increases. While no caps on rental rate increases have been implemented in the U.S. so far, there’s no guarantee that rent control ordinances won’t be passed in the future if these extreme rental rate increases continue to distress customers and make headlines.
Normally, the second quarter of each year is marked by modest gains compared to its previous quarter, and then followed by even greater increases in the third quarter. Though that was not the case for 2020, when rates dropped in the second quarter, steady increases were reported afterward. The typical seasonality of rental rates returned after the first quarter of 2021, with all sizes of non-climate-controlled units experiencing rental rate increases in the second and third quarters of 2021 and decreases in the fourth quarter. This is typical. However, the first quarter of 2022 broke the usual pattern, with three of the five sizes of non-climate-controlled units posting modest increases. All five unit sizes in Table 8.1 reported increases in the second quarter of 2022, which falls in line with the normal spring upswing for rental rates. When looking at the newest data in Table 8.1, one can see that minimal changes were reported for rental rates in the third quarter of 2022—an abnormality compared to the typically higher summer rates; instead, the rate increases and decreases reported ranged from 1 cent to 70 cents. Rates for all non-climate-controlled units declined in Q4 2022 and Q1 2023 before gradually increasing in Q2 2023, but those rental rates remained lower than Q2 2022’s rates by approximately $3 to $7.
According to Table 8.2, rental rates for all five climate-controlled units stuck to the seasonal pattern in 2021 and the first half of 2022. However, only two of the five unit sizes reported increased rates in Q3 2022, which is usually the busiest time of the year; rental rates decreased for climate-controlled 10-by-10s, 10-by-15s, and 10-by-20s that quarter, and only modest gains were noted for 5-by-5s and 5-by-10s (15 cents and 9 cents, respectively). All climate-controlled unit sizes experienced rental rate declines in Q4 2022 and Q1 2023. Despite increasing in Q2 2023, the rental rates remained lower than Q2 2022’s rates. The most significant year-over-year (Q2 2022 to Q2 2023) rental rate decrease reported in Table 8.2 was $20.72 (climate-controlled 10-by-20s).
Tables 8.3 and 8.4 detail the national rental rate data for non-climate-controlled and climate-controlled units by square foot by month. The newest 12 months listed within these tables (July 2022 to June 2023) show gradual changes to rates, with all rates in June 2023 down several cents from the highs of June 2022. As seen in Table 8.3, all non-climate-controlled unit sizes had the highest rates in June or July of 2022. Rates for 5-by-5s experienced a double-digit decrease from June 2022 to June 2023 ($0.13), while rates for the other four unit sizes were nudged downward by 7 cents, 5 cents, or 3 cents per square foot. Table 8.4 shows that July 2021 was the best month for climate-controlled units of all sizes. The second-best month was July 2022 for all sizes except 10-by-20s, which had its second highest rate in June 2022 ($1.37 per square foot). However, like non-climate-controlled units, all sizes of climate-controlled units posted double-digit year-over-year rental rate declines from June 2022 to June 2023 of 11 cents to 14 cents per square foot.
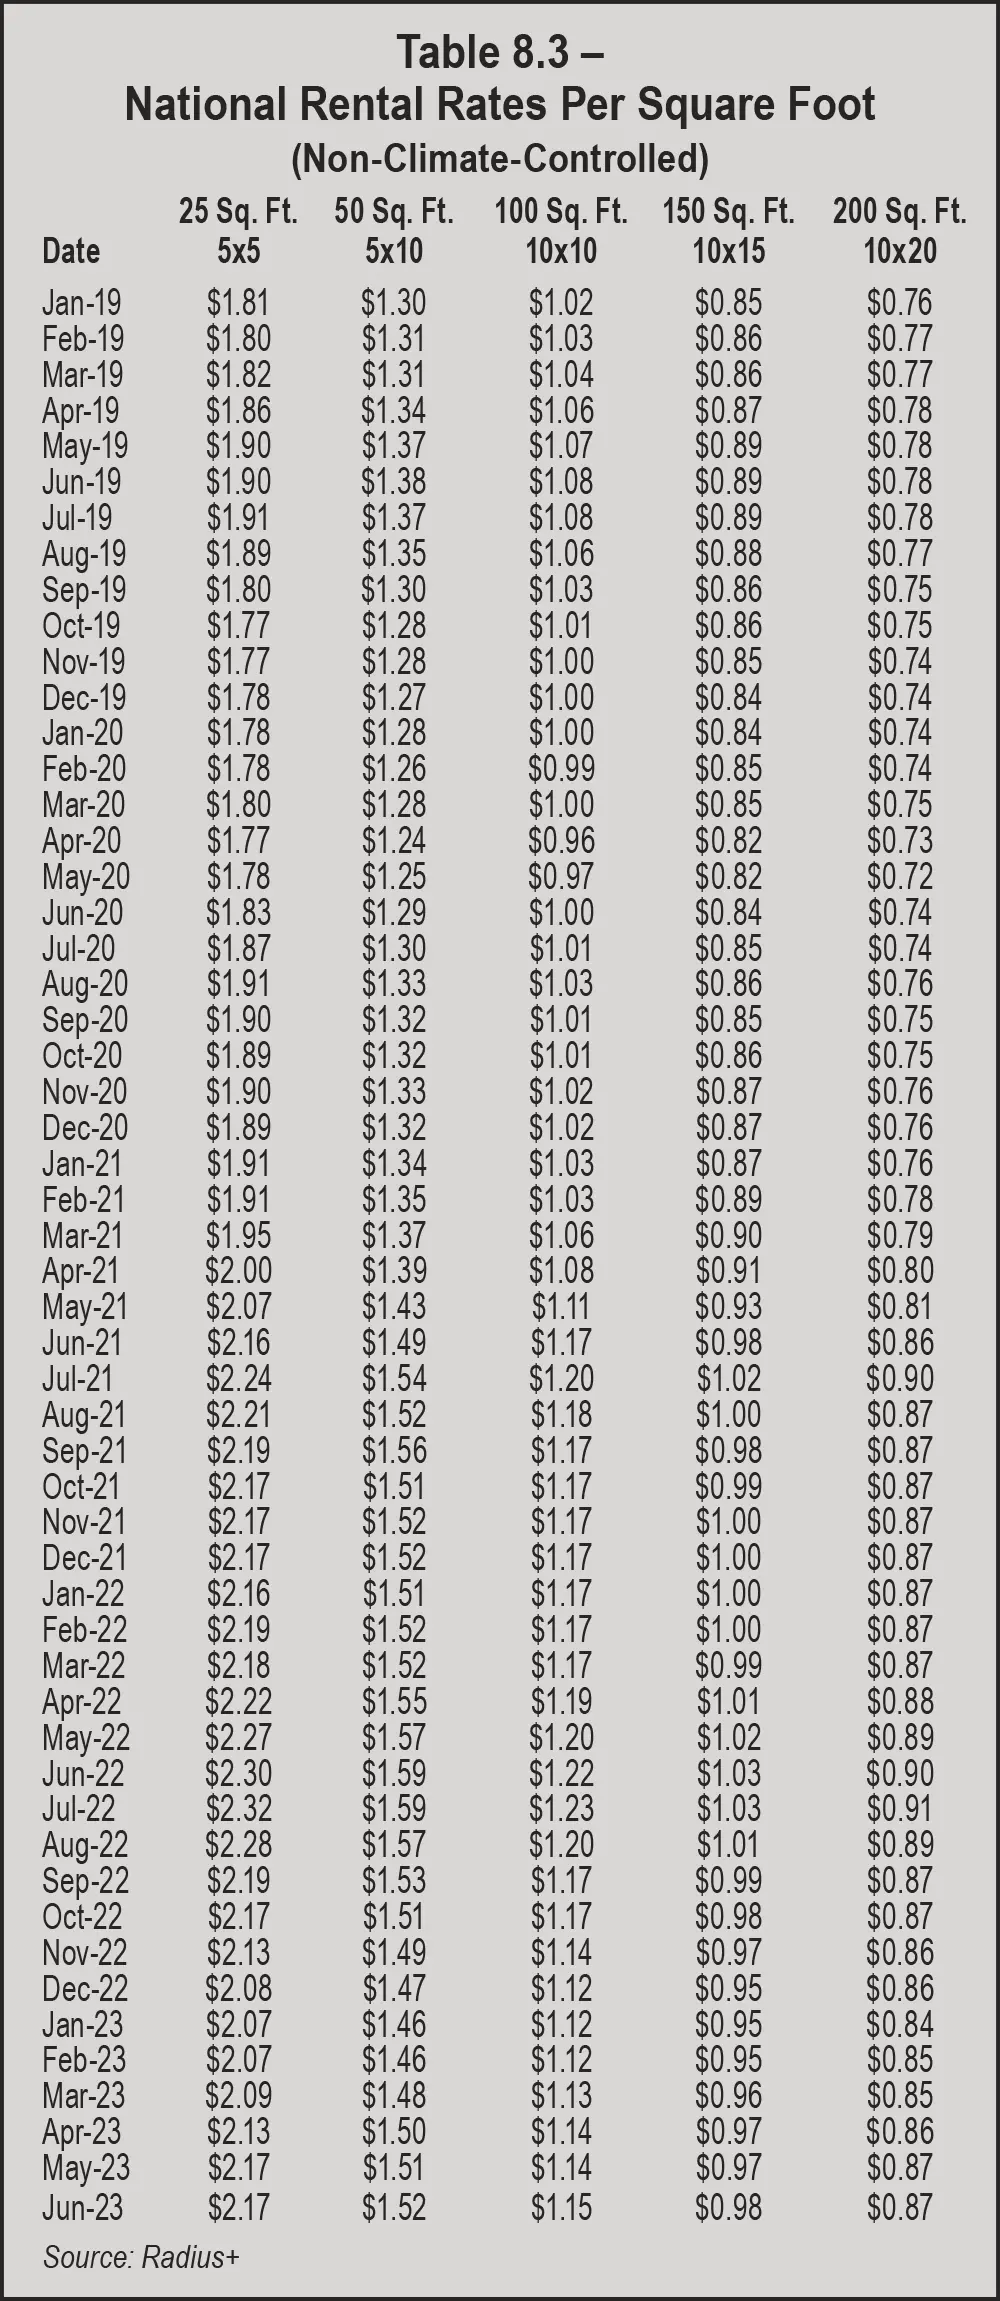
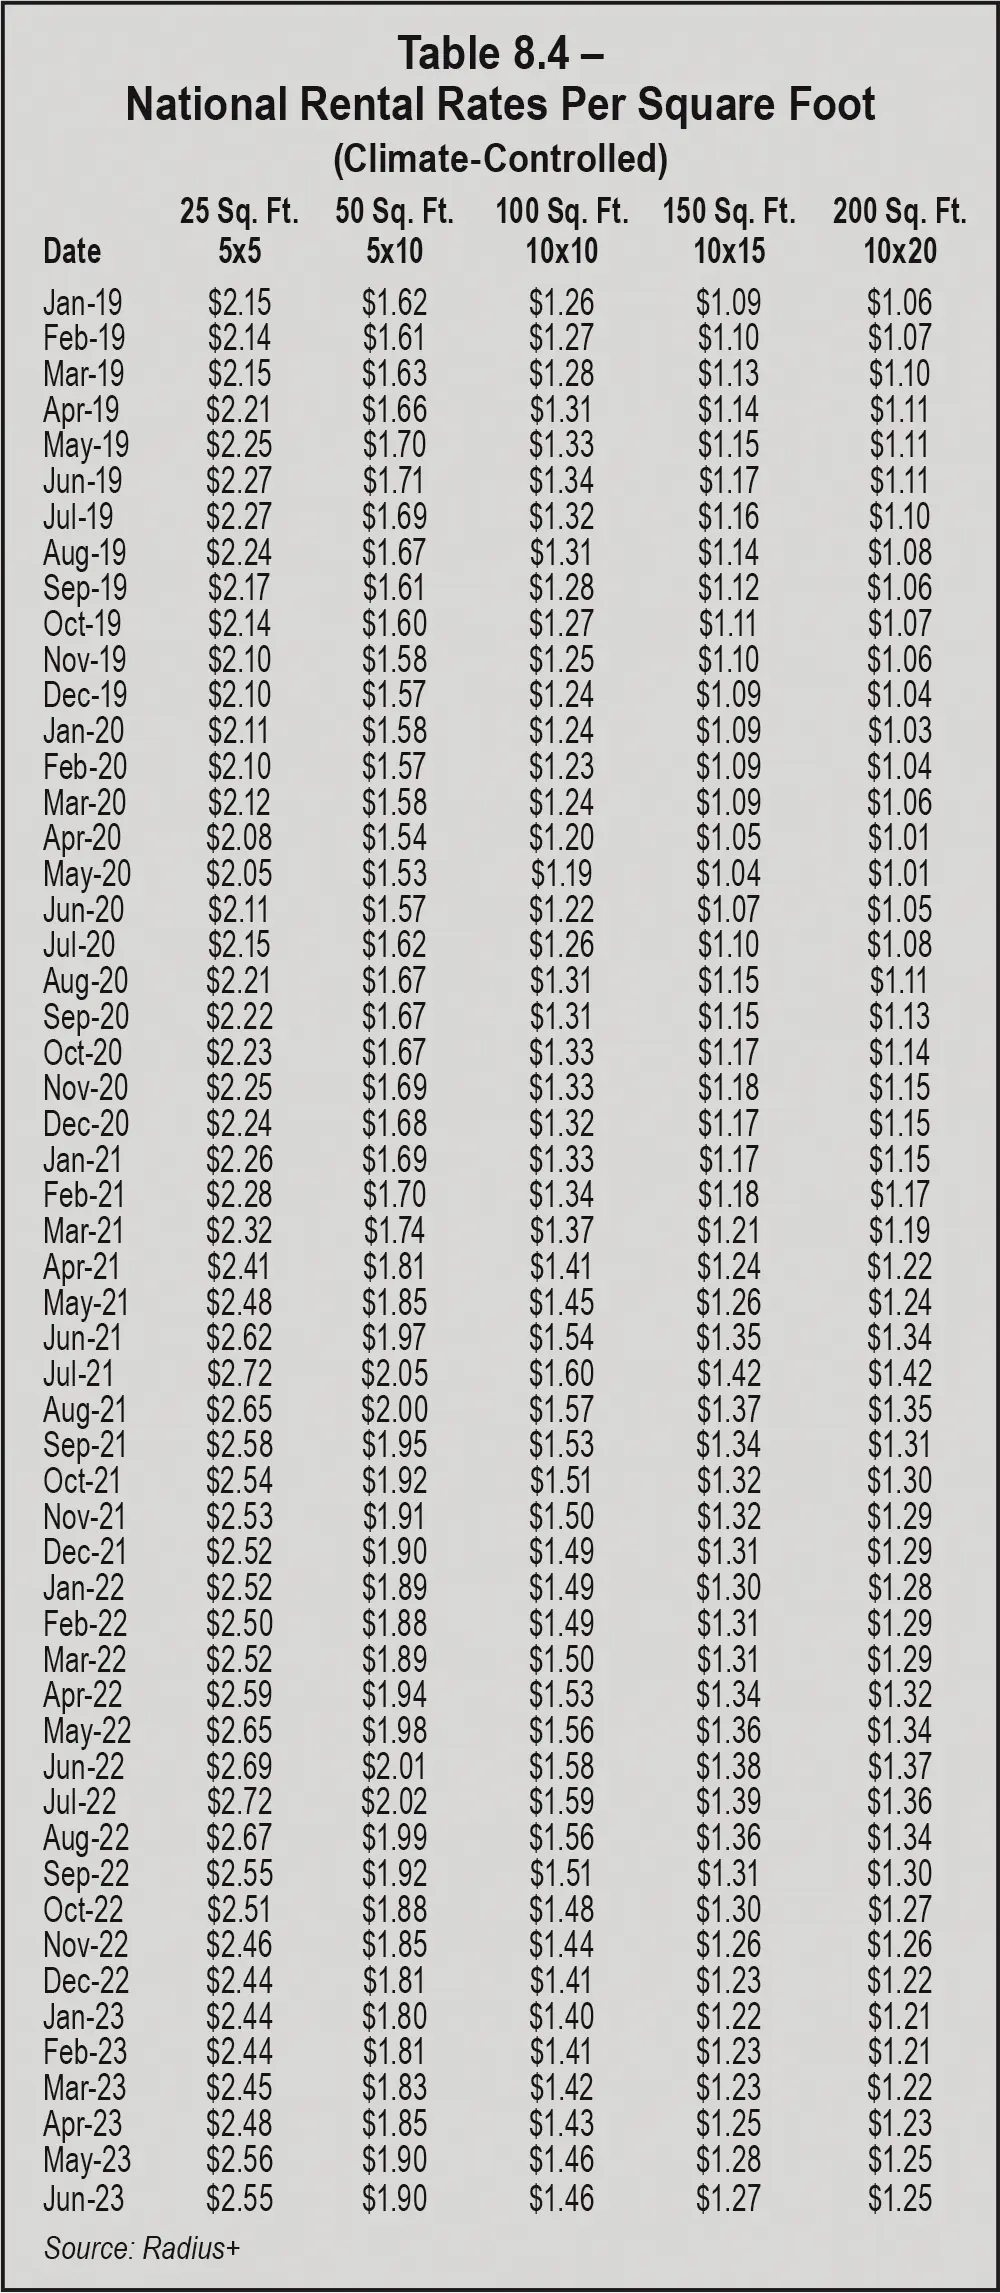
Charts 8.1, 8.2, 8.3, 8.4, and 8.5 provide side-by-side comparisons of rental rates for climate-controlled units and non-climate-controlled units by size. It is immediately obvious that climate-controlled units fetch higher rental rates. Since operators provide climate-control features to protect tenants’ stored goods from damage, they can charge more for the same amount of space. Climate-controlled units also produce an additional expense for the facility, so operators must charge higher rates to offset those costs.
As shown in Chart 8.1, there is a nearly $10 difference between rates for climate-controlled and non-climate-controlled 5-by-5 units most quarters. That gap shrunk by about two dollars in the fourth quarter of 2022, when non-climate-controlled 5-by-5s were at $53.15 and climate-controlled 5-by-5s were $61.70. Chart 8.2 reports an approximately $20 difference in quarterly rates for 5-by-10s of both unit types, but that variance lessened slightly in Q4 2022 and Q1 2023 ($17.98 and $17.19, respectively). Most quarters, there’s a nearly $30 price gap for rental rates of climate-controlled and non-climate-controlled 10-by-10s, according to data in Chart 8.3. However, the difference was widened to $35.05 in Q3 2022. For the last four quarters within Chart 8.4, climate-controlled 10-by-15s commanded rental rates that were $40.74 to $51.40 higher than non-climate-controlled 10-by-15s. There’s an even larger price gap when it comes to 10-by-20s. Chart 8.5 shows that climate-controlled 10-by-20s collected $73.24 to $88.77 more than non-climate-controlled 10-by-20s from Q3 2022 to Q2 2023, even though the year-over-year (Q2 2022 to Q2 2023) rental rates for climate-controlled 10-by-20s dropped by $20.72.
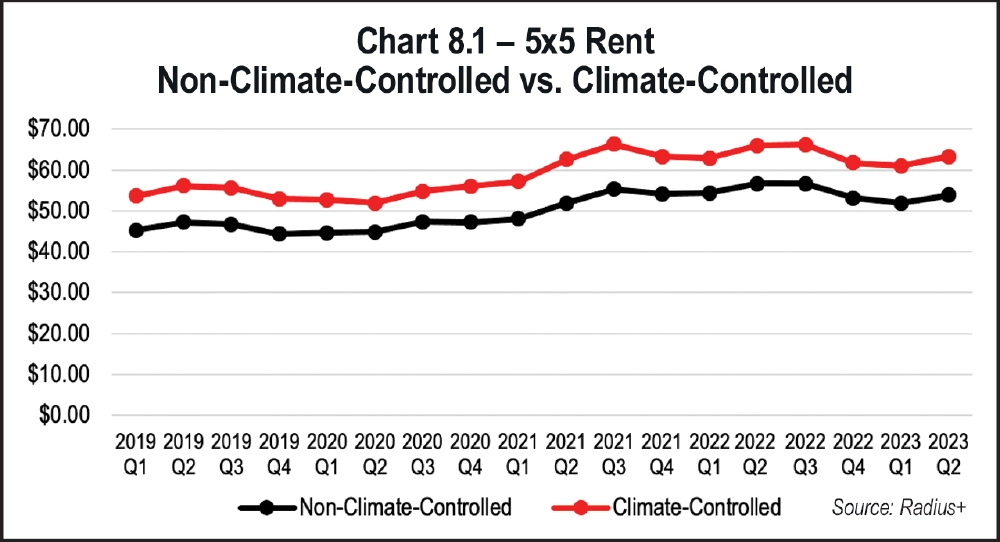
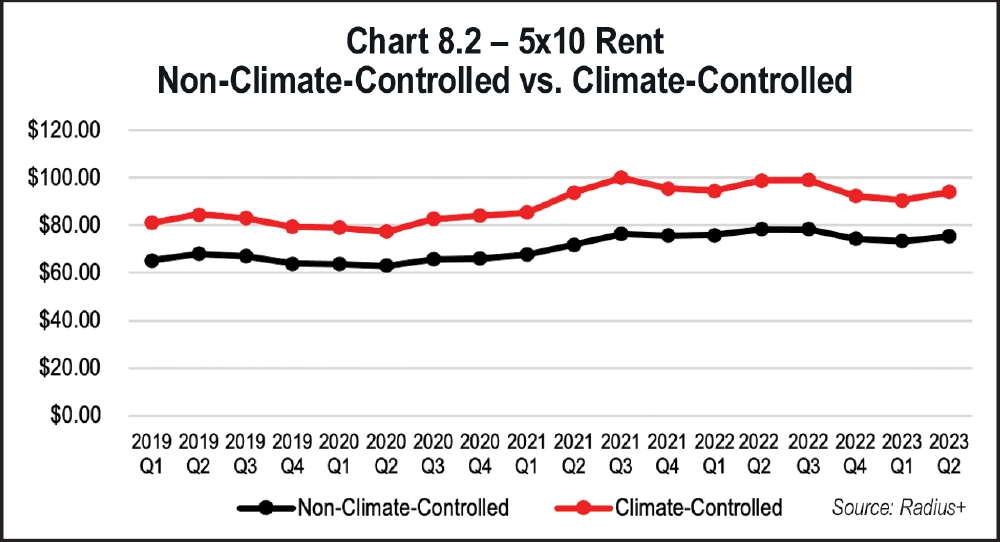
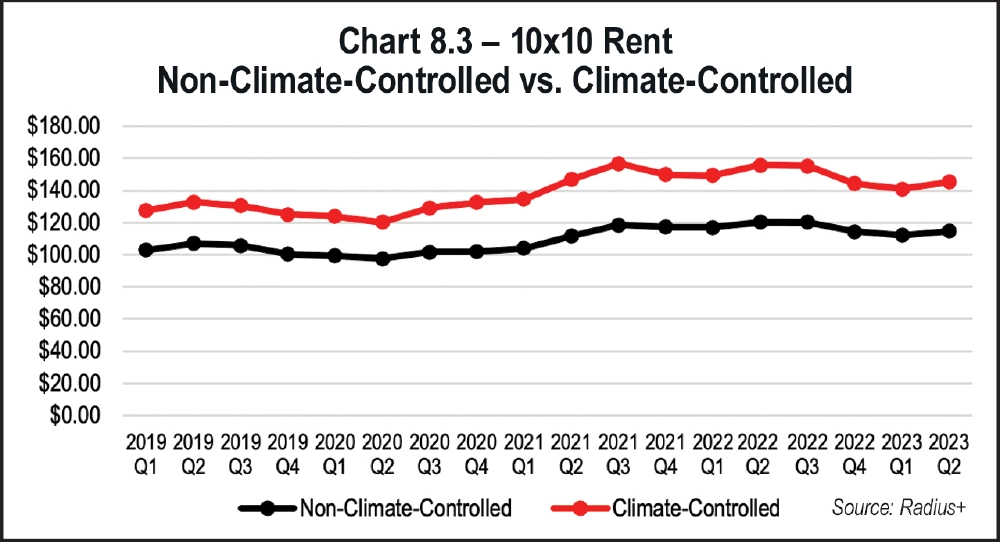
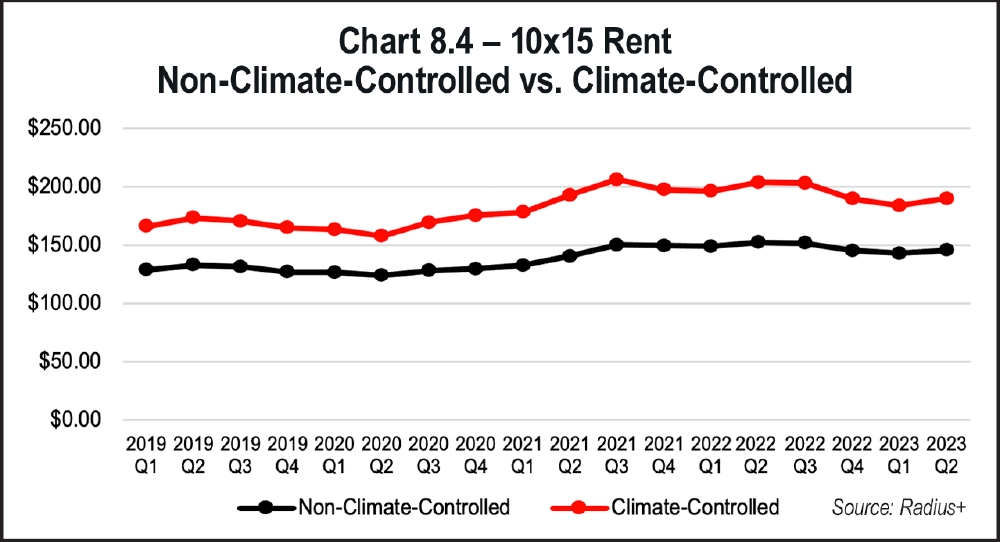
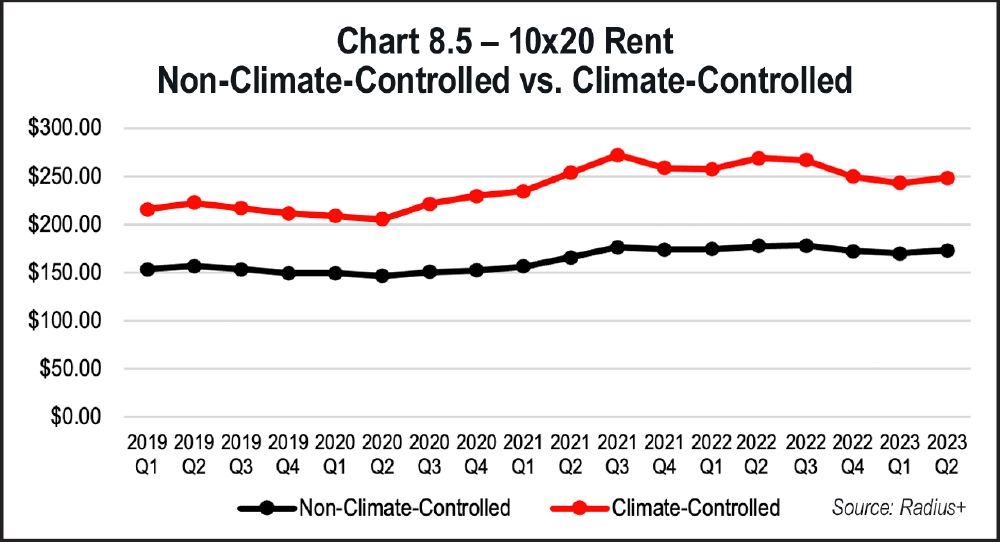
As we delve into data by region, keep in mind that some municipalities across the country have been enacting moratoriums on new self-storage development. Though some are temporary, moratoriums impact self-storage supply and can create an imbalance within market areas. When no new supply is permitted, demand will eventually surpass supply, and rental rates should always keep pace with demand.
Table 8.5 shows that new highs for all five non-climate-controlled unit sizes were posted in July 2022 (the first month of the third quarter), but those top rates were eroded by six consecutive months of declines. Rates experienced upward movement from March 2023 through June 2023, yet never managed to return to the highs of July 2022. Like non-climate-controlled units, year-over-year (June 2022 to June 2023) rental rate declines were reported for all climate-controlled units in the Midwest (East North Central) region. One difference noted between the unit types is that rates fell in June 2023 for all climate-controlled units, whereas all non-climate-controlled units posted rental rate increases that month.
Tables 8.6 and 8.7 show rates per square foot for all unit sizes and types in the Midwest (East North Central) region. Non-climate-controlled units posted the highest rates in the Q3 2022, and 10-by-10s managed to reach $1.00 per square foot that quarter for the first and only time. Alternatively, topmost rates for four climate-controlled unit sizes were reported in the third quarter of 2021; 5-by-5s had their highest rates ($2.42 per square foot) in Q3 2022. From Q2 2022 to Q2 2023, both climate-controlled and non-climate-controlled 5-by-5s had the most substantial year-over-year losses per square foot (21 cents and 19 cents, respectively). For the same period, all other unit sizes and types also reported rental rate declines, but they were greater for climate-controlled units, which experienced 11 cent to 21 cent losses; rates dropped for non-climate-controlled by 2 cents to 19 cents.
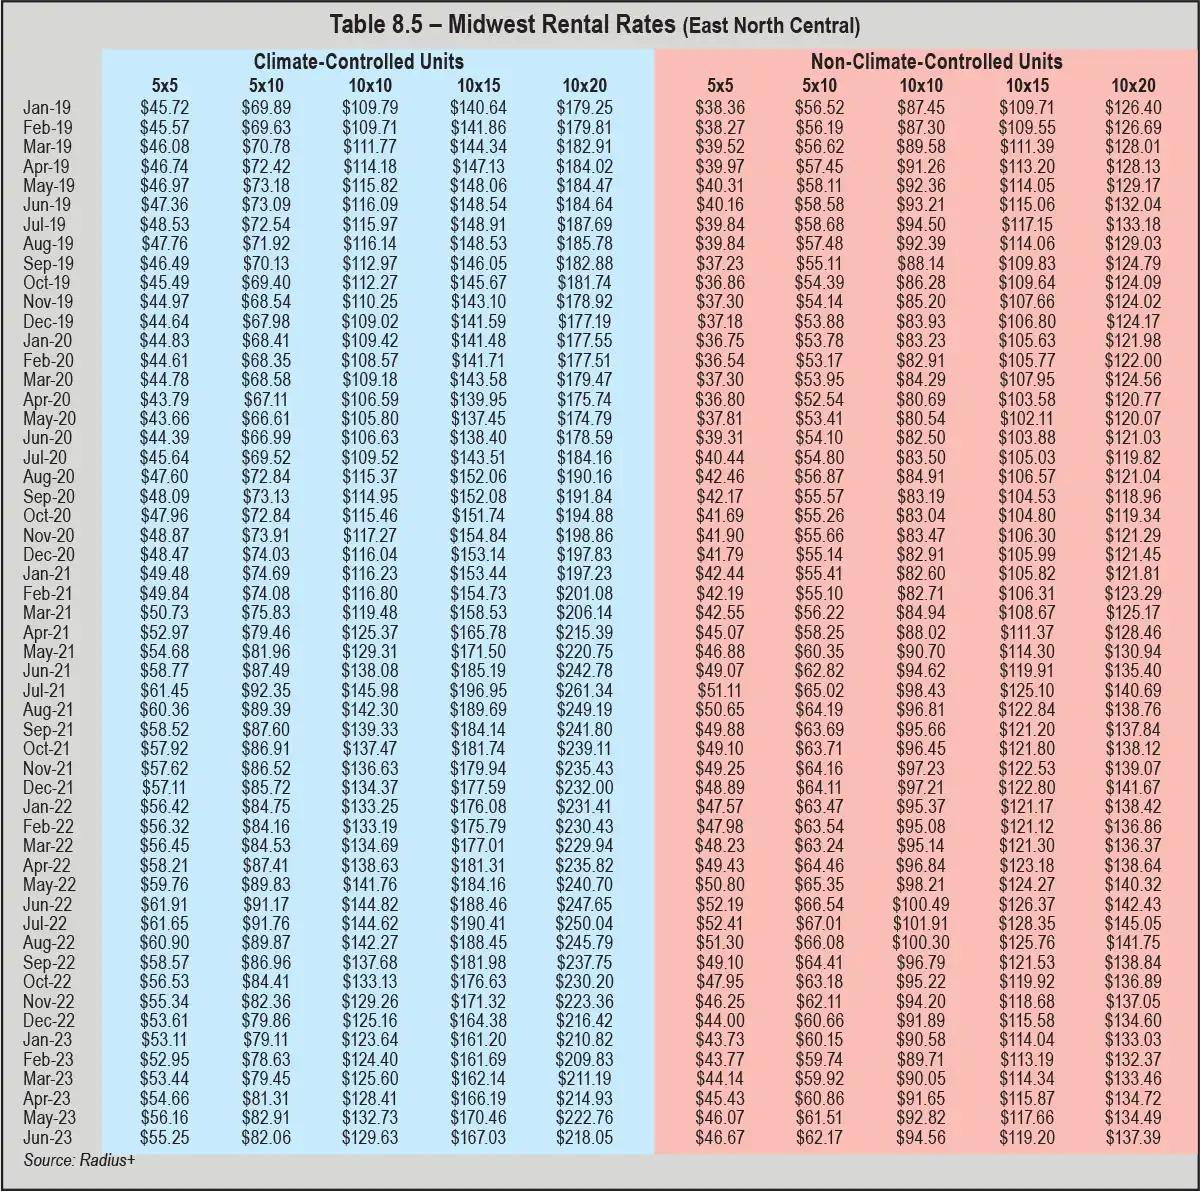
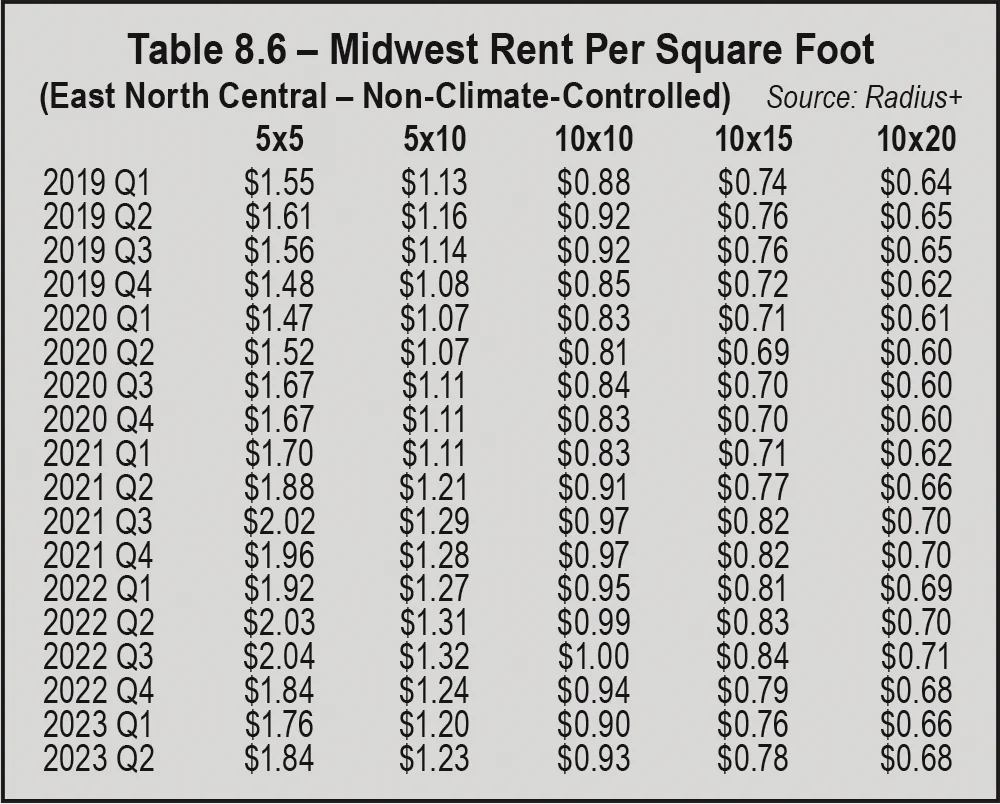
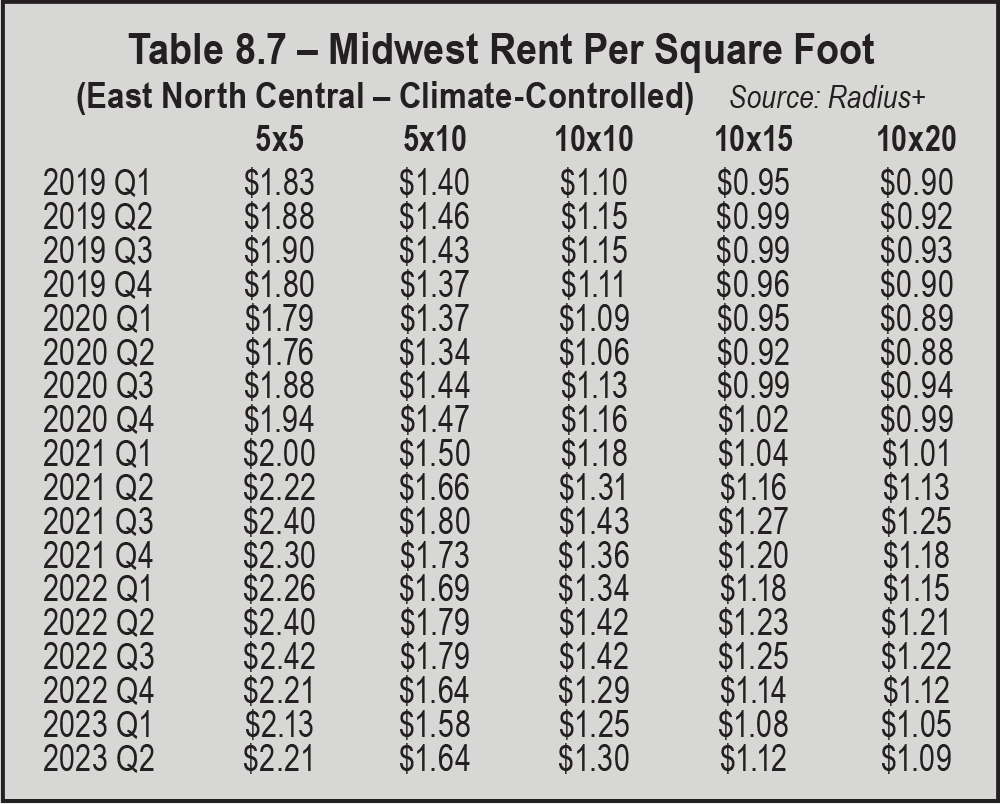
In the West North Central region of the Midwest, four of five climate-controlled unit sizes reported increases to rental rates in July 2022. Table 8.8 shows that rates for climate-controlled 10-by-20s fell by 56 cents that month, whereas the other four unit sizes had rate increases of a few dollars. The highest rates for climate-controlled 10-by-10s and 10-by-15s were in July 2022, and the other three sizes posted topmost rates in August of 2022. Rental rates for climate-controlled 5-by-5s, 5-by-10s, and 10-by-20s were slightly higher in June 2023 than June 2022. As for non-climate-controlled units in this region, only 10-by-15s and 10-by-20s had better rates in June 2023 than June 2022; rental rates declined by $2.65 (5-by-5s) or less during that same period. However, rates for all non-climate-controlled unit sizes increased increases from March 2023 through June 2023, except for 10-by-20s in May 2023, which dipped by 62 cents before rising $3.41 to $122.77 the next month.
Table 8.9 shows that every non-climate-controlled unit size had topmost rates per square foot in Q3 2022. Within Q3 2022, two firsts are visible: 5-by-5s (25 square feet) reached $2.04 and 10-by-10s (100 square feet) hit $1.00. Those highs were short lived, however, as rental rates per square foot for all non-climate-controlled units dropped in Q4 2022 and Q1 2023. Rates did rebound in Q2 2023, and four of the five unit sizes managed to post higher rates in Q2 2023 than Q2 2022; only 5-by-5s experienced a year-over-year rate decline (4 cents per square foot).
As for climate-controlled units, all sizes in Table 8.10 reported peak rental rates per square foot in Q3 2022, with gains of 24 cents or more from Q2 2022. Seasonal rate declines occurred in Q4 2022 and Q1 2023, followed by marginal increases of 4 cents to 8 cents per square foot in Q2 2023.
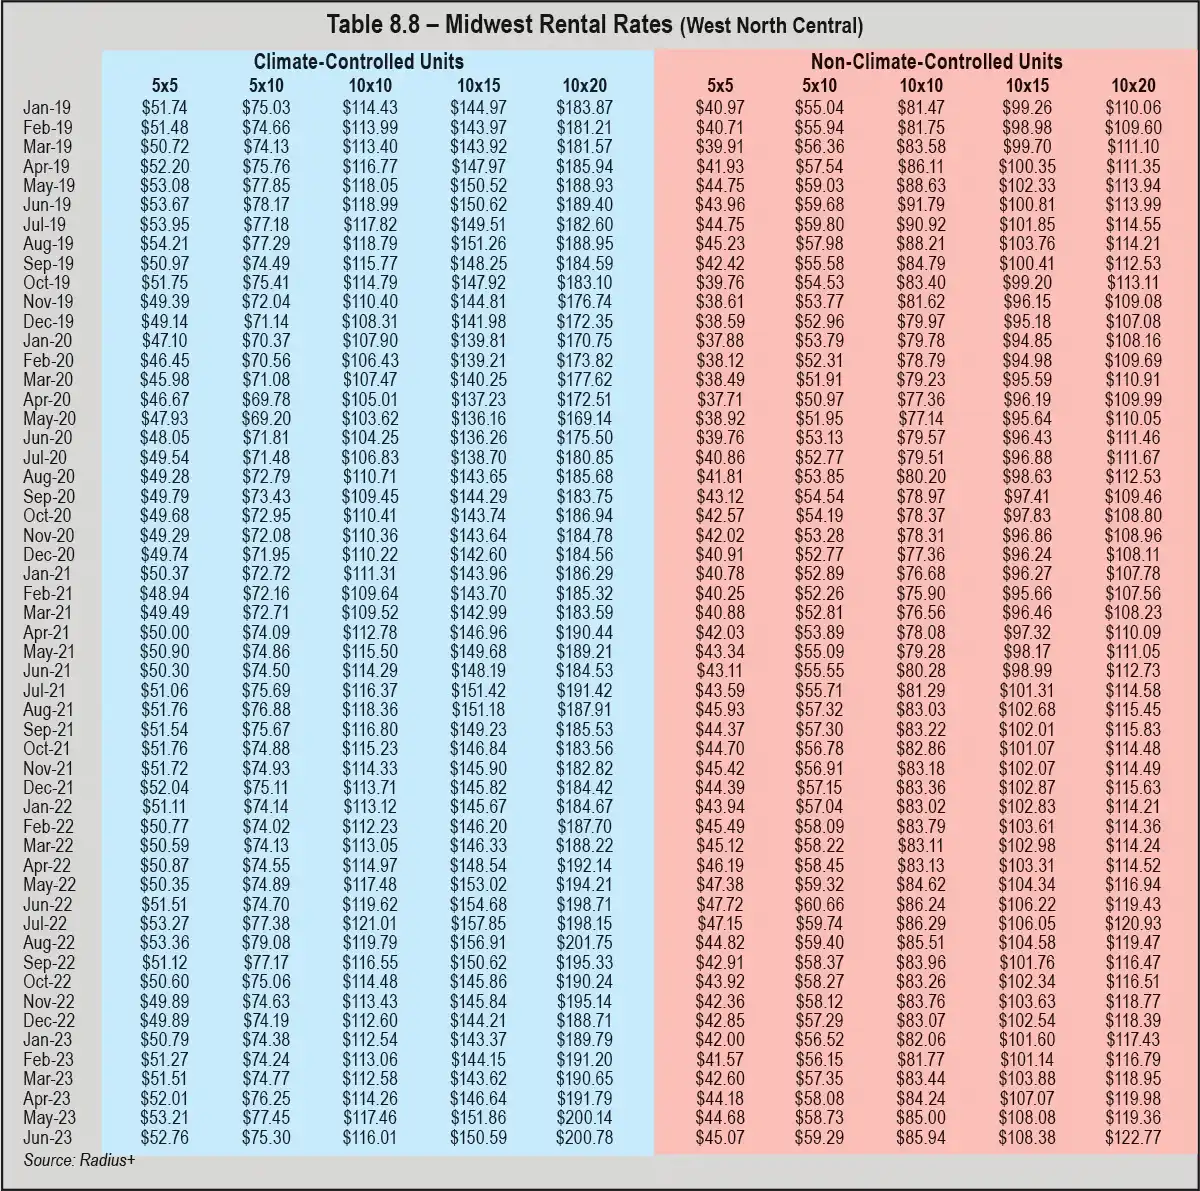
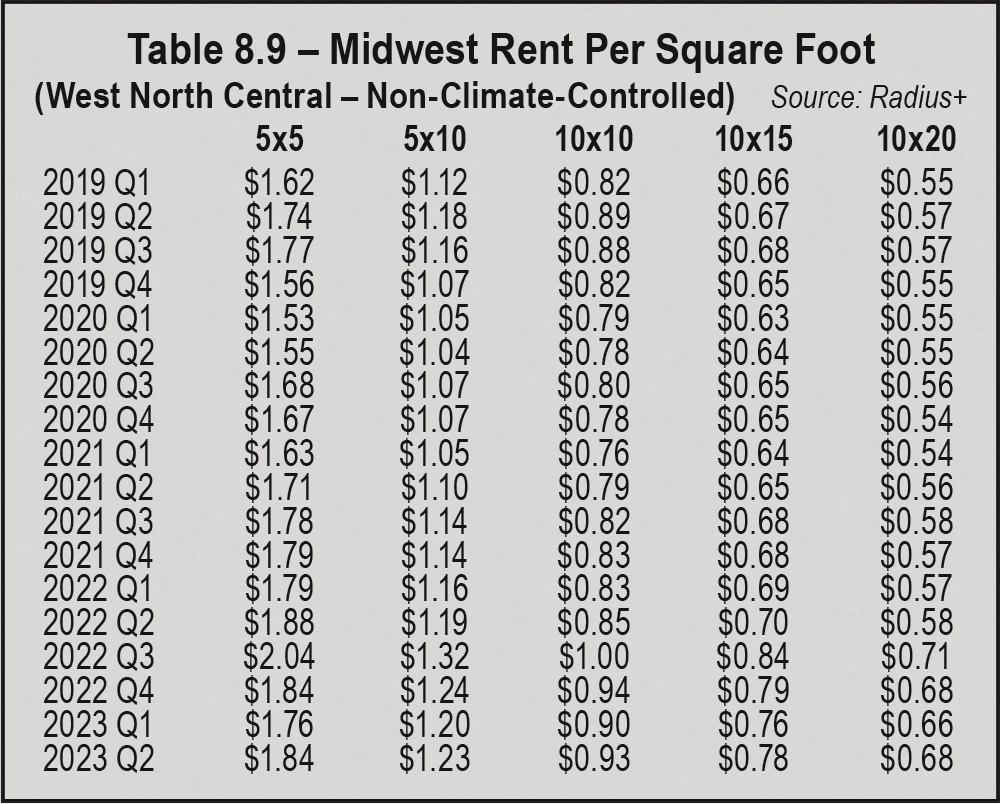
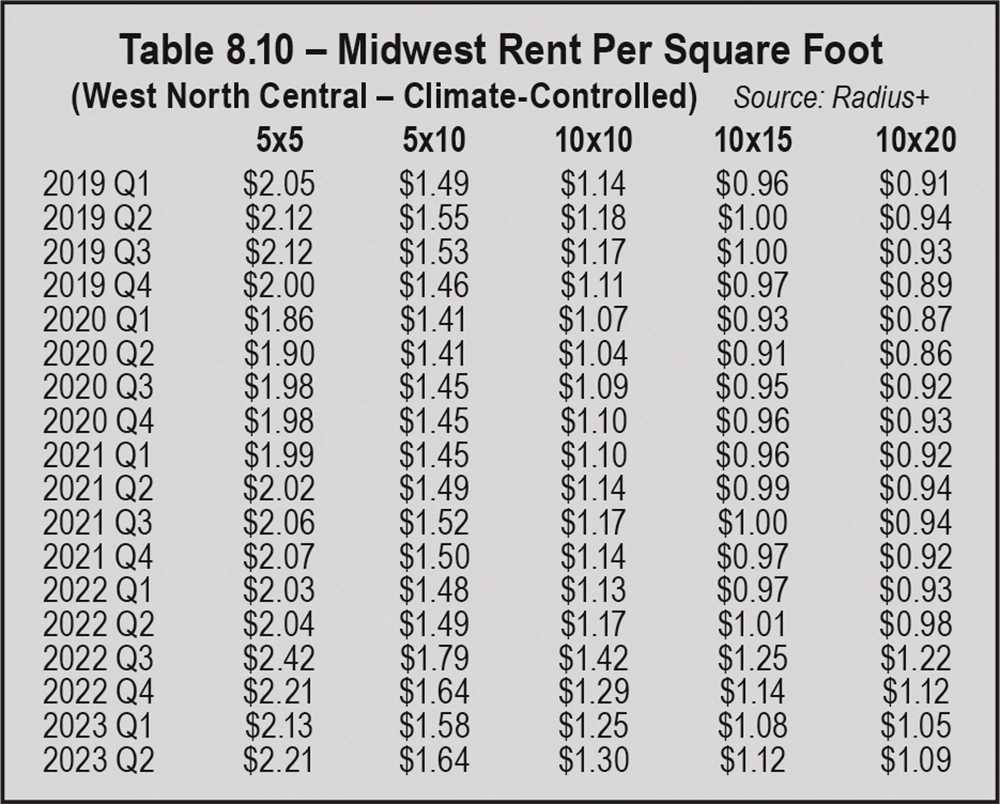
In the Middle Atlantic area of the U.S., all unit sizes and types reported the highest rates in July 2021, according to Table 8.13. Unfortunately, nine of 10 units have experienced double-digit rental rates decreases since those highs. Non-climate-controlled 5-by-5s had the smallest decline ($7.90) from July 2021 to June 2023, whereas rates for climate-controlled 10-by-20s were hit hardest, dropping nearly $100 (from $425.47 to $328.09).
Year-over-year (June 2022 to June 2023) rental rate declines were reported for each unit size and type; during that same time, rates for climate-controlled 10-by-20s fell $46.24 and six others posted double-digit declines. Although there were several months of across-the-board increases, mostly from March 2023 to June 2023, those gains didn’t outweigh the losses that occurred from August 2022 through January 2023.
When looking at the most recent data (Q3 2022 to Q2 2023) for rental rates by square foot in Tables 8.11 and 8.12, declines are visible for three consecutive quarters (Q3 2022 through Q1 2023). Throughout that period, the rate for non-climate-controlled 5-by-5s (25-square-foot units) remained at $2.73 per square foot in Q3 2022; all other unit sizes and types experienced rental rate declines. Conversely, rates increases were posted in Q2 2023 for climate-controlled and non-climate-controlled units of all sizes, but those rental rates were still significantly lower than the previous year (Q2 2022). In fact, double-digit rate decreases can be calculated for nine of the 10 unit sizes from Q2 2022 to Q2 2023; the largest was 35 cents for climate-controlled 5-by-5s and the smallest was 8 cents for non-climate-controlled 10-by-20s. Both non-climate-controlled and climate-controlled 5-by-5s had topmost rates per square foot in Q3 2021 ($2.78 and $3.39, respectively).
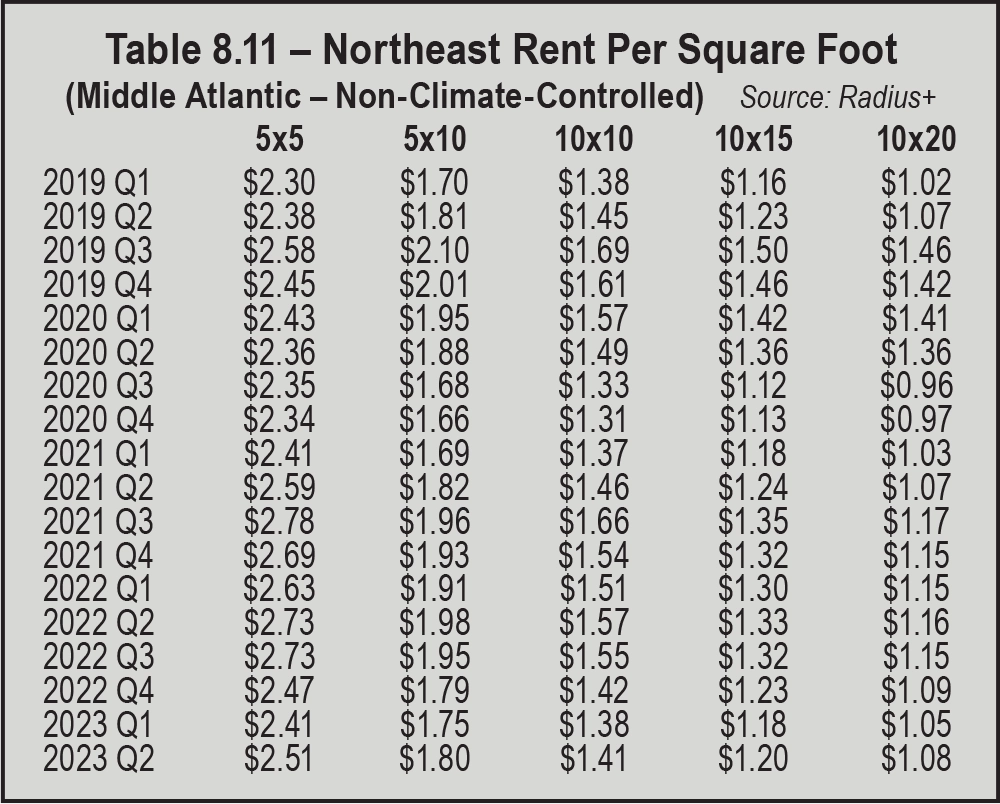
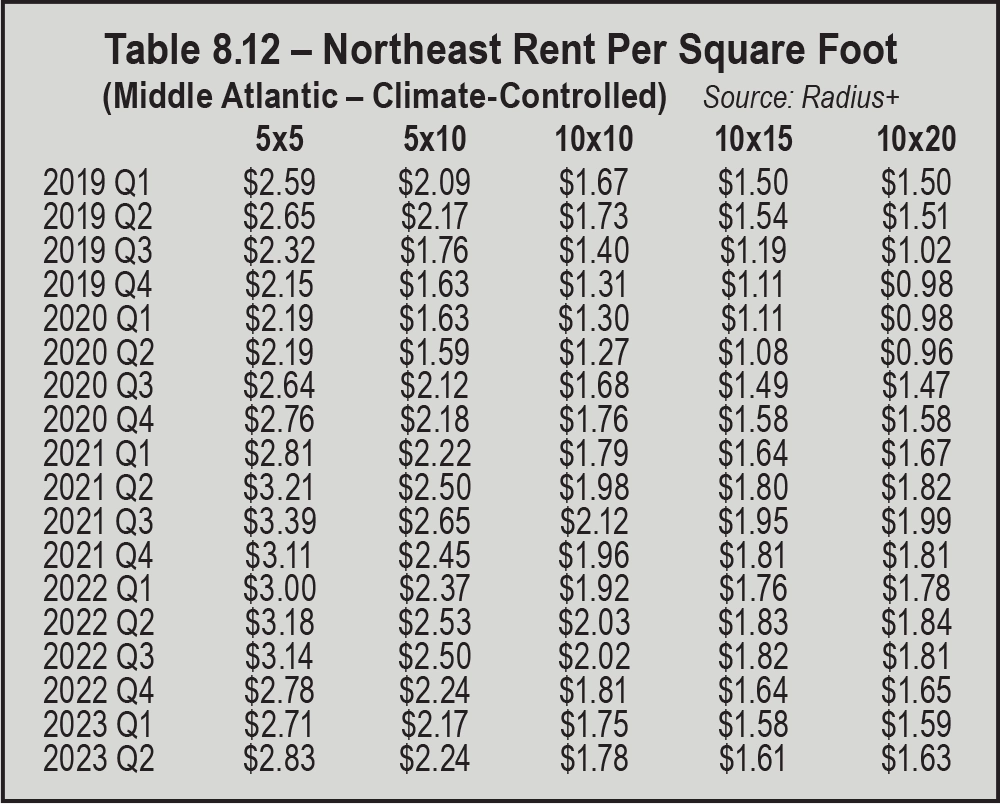
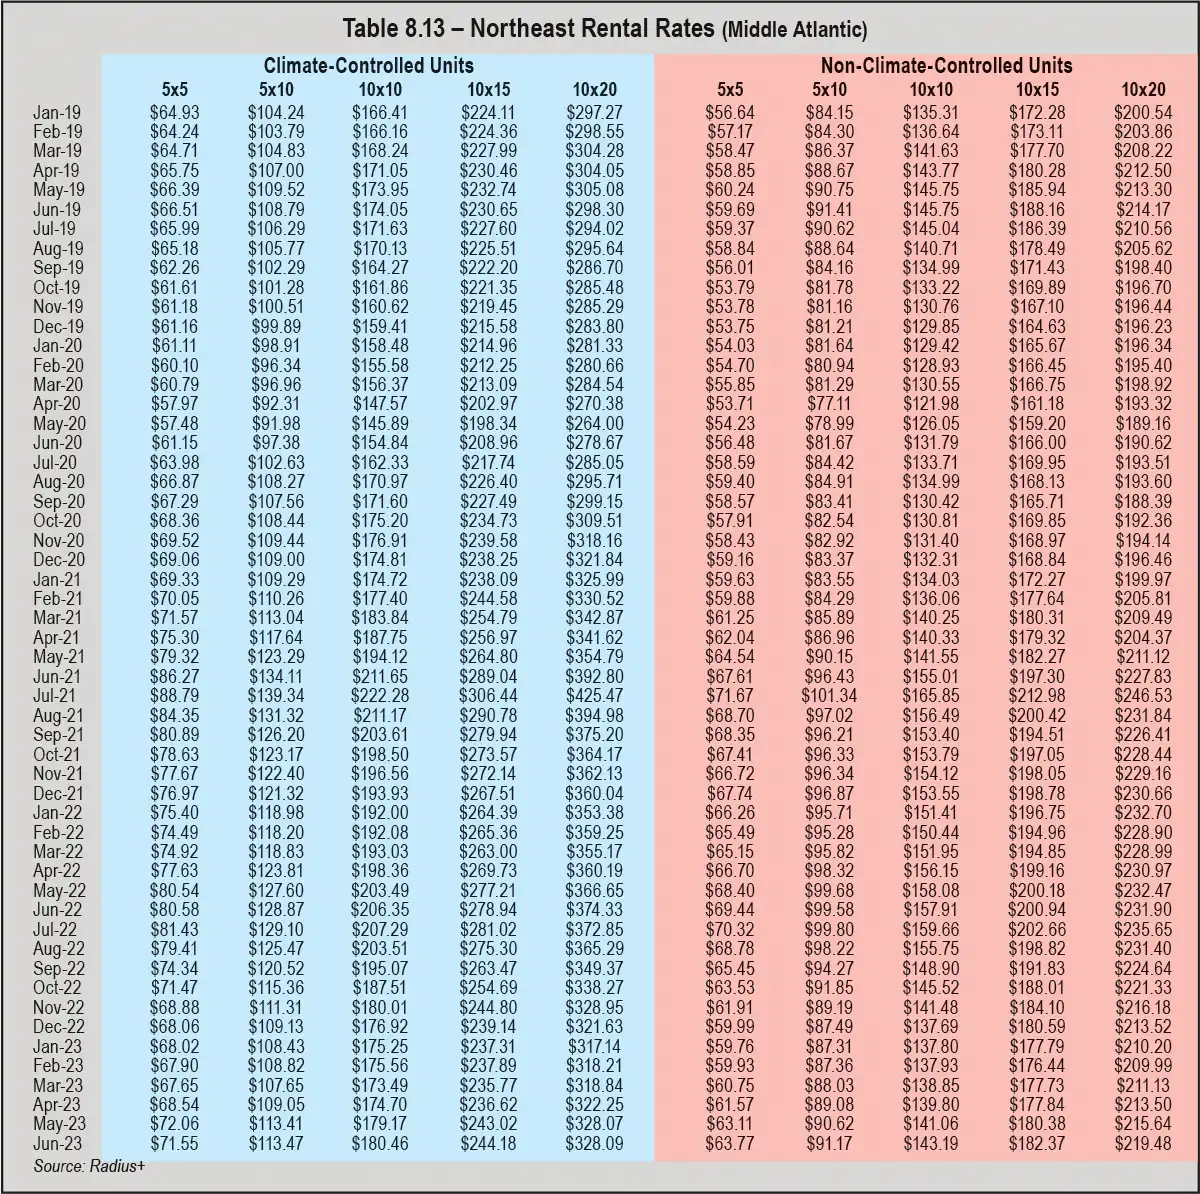
Data in Table 8.14 shows that all sizes of climate-controlled and non-climate-controlled units posted uppermost rates in July 2021. July 2022 was another good month, with all 10 units reporting rental rate increases. However, those gains were lost in August and September 2022 with across-the-board declines. Rates continued to drop for most unit sizes in the fourth quarter of 2022 and into the first quarter of 2023: October (eight of 10), November (nine of 10), December (eight of 10), and January (all 10). All 10 units’ rates increased in May 2023, but dipped again in June 2023 for six sizes. From June 2022 to June 2023, year-over-year rental rate declines are seen for all sizes of climate-controlled and non-climate-controlled unit sizes.
Tables 8.15 and 8.16 show rental rates per square foot by quarter for non-climate-controlled and climate-controlled units in New England. The highest rates for non-climate-controlled 5-by-5s ($2.81 per square foot) were posted in Q2 2022, whereas all other unit sizes of that type had top rates in Q3 2021. For all non-climate-controlled and climate-controlled unit sizes, rental rates declined in Q4 2022 and Q1 2023 and increased in Q2 2023 (except for climate-controlled 10-by-20s’ rates, which stayed at $1.49). Year over year (June 2022 to June 2023), rates for all units dropped by 3 cents to 30 cents.
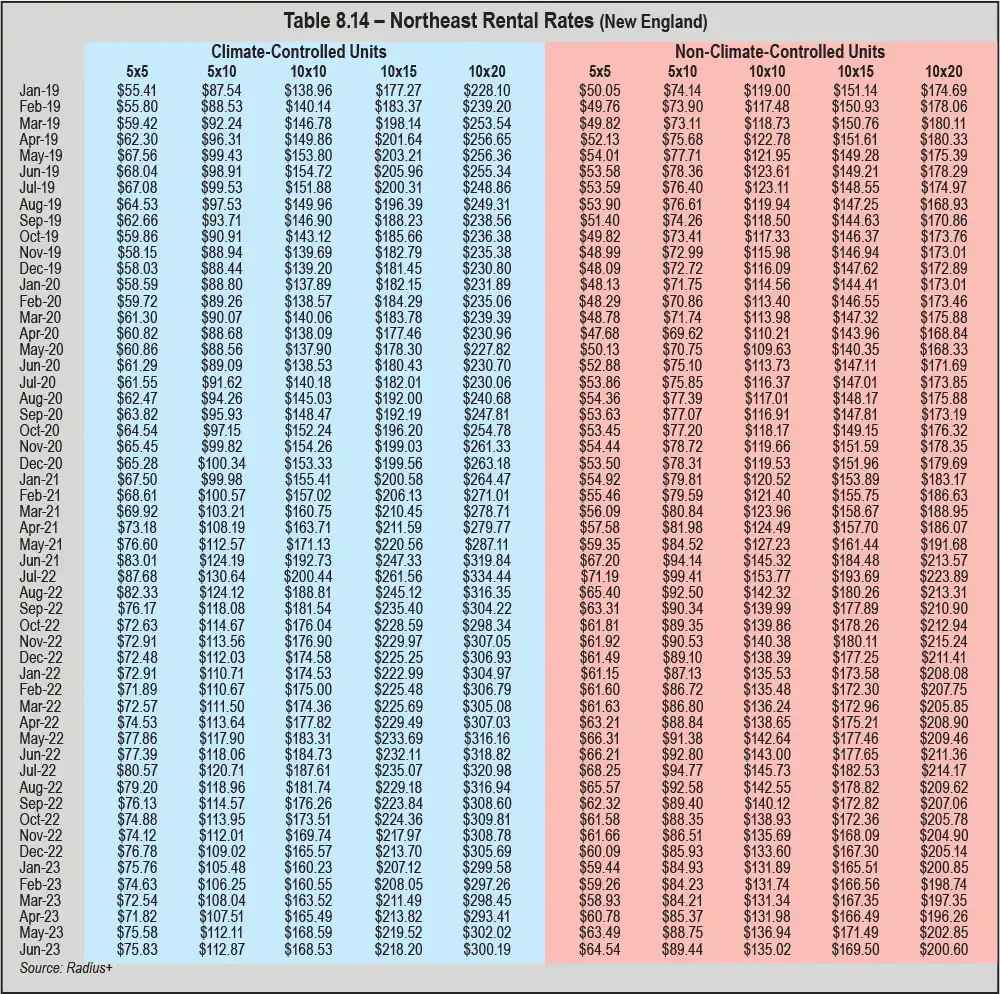
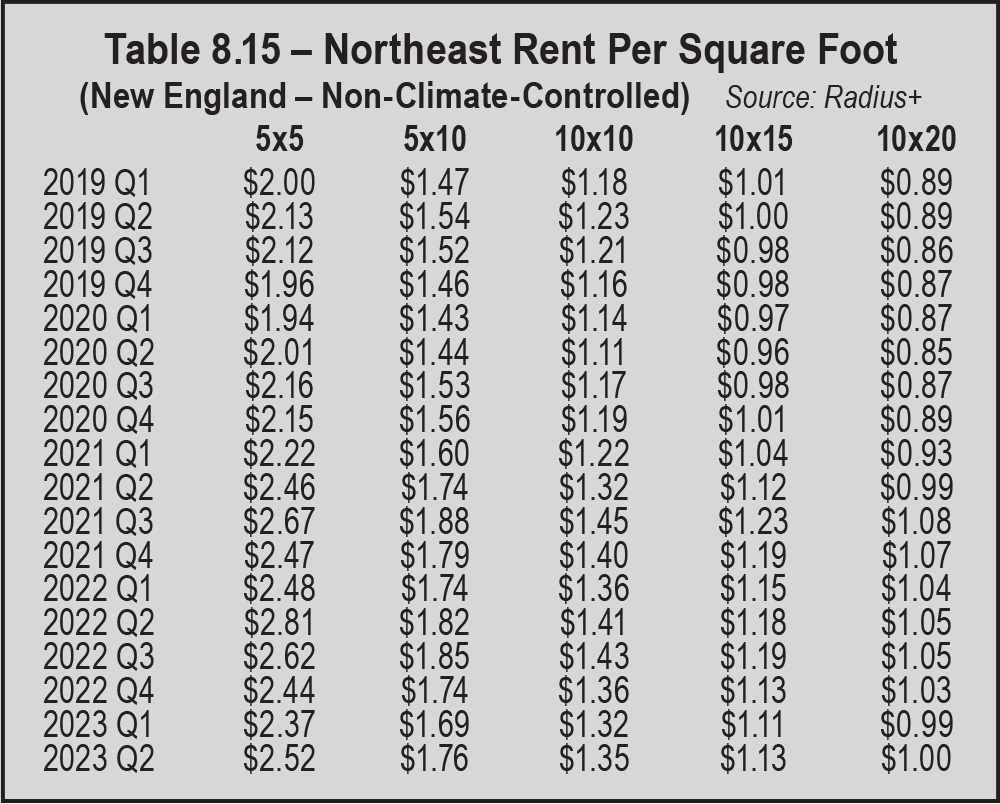
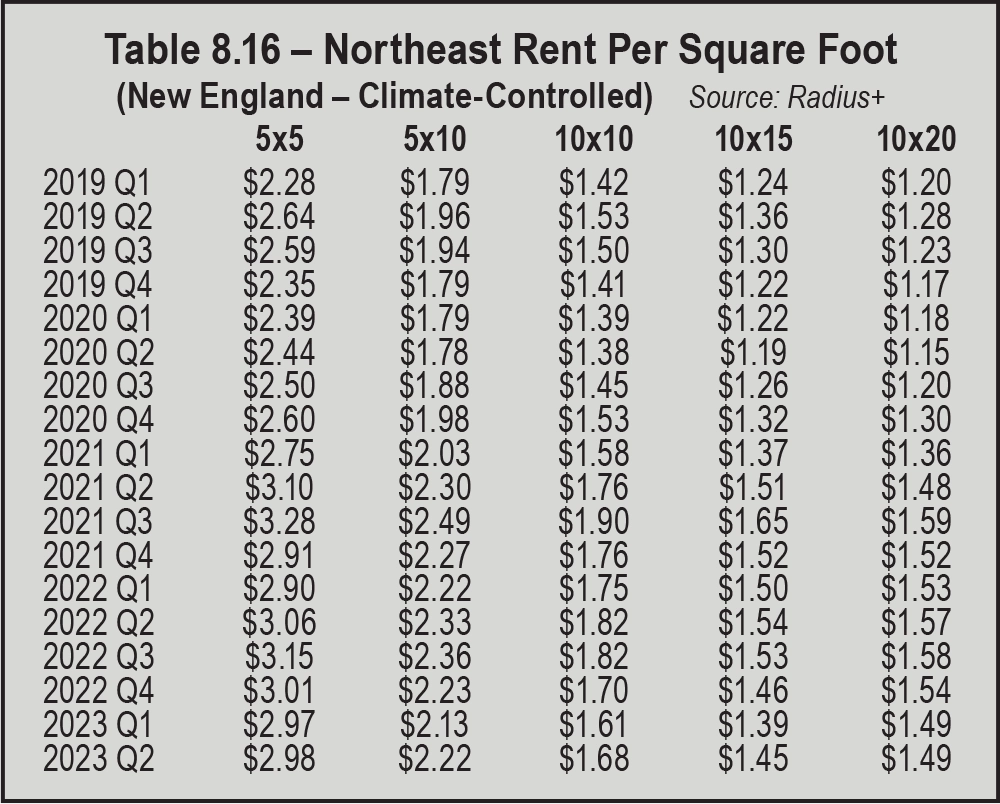
For the South Atlantic, data in Table 8.17 shows a few across-the-board trends. Similar to other regions of the United States, rental rates for all unit sizes and types in this area increased in July 2022 before declining in August and September of 2022, but three more consecutive months of decreases were reported as well (making up Q4 2022). Eight of 10 units posted rental rate declines in January 2023; non-climate-controlled 5-by-10s and 10-by-10s had minimal rate increases that month. In February 2023, rates dipped a small amount for non-climate-controlled 5-by-5s and 5-by-10s, whereas eight units reported rate increases; rental rates ticked up marginally for all units in March and April of 2023. Only non-climate-controlled 10-by-20s experienced a drop in rental rates during May 2023, but four climate-controlled units did in June 2023. Year-over-year (June 2022 to June 2023) rental rate declines are seen for all 10 unit sizes, ranging from $4.47 (non-climate-controlled 5-by-10s) up to $31.60 (climate-controlled 10-by-20s).
Table 8.18 provides insights into the South Atlantic’s rents per square foot for non-climate-controlled units. Topmost rates were reported for Q3 2022 for all unit sizes, however rates for three of those (5-by-10s, 10-by-15s, and 10-by-20s) remained the same from the previous quarter. All five unit sizes posted rental rate declines in Q4 2022 and Q1 2023, dropping by 27 cents for 5-by-5s, 13 cents for 5-by-10s, 10 cents for 10-by-10s, 7 cents for 10-by-15s, and 6 cents for 10-by-20s. Then, in Q2 2023, rates increased minimally for all five unit sizes, but those upticks weren’t enough to match the highs of Q3 2022 or Q2 2022. The year-over-year (Q2 2022 to Q2 2023) rate declines ranged from 4 cents (10-by-20s) to 14 cents (5-by-5s). Rates for both 10-by-10s and 10-by-15s dropped by 7 cents per square foot from Q2 2022 to Q2 2023.
As for climate-controlled units in the South Atlantic, shown in Table 8.19, rental rates per square foot mostly followed the same pattern, decreasing in Q4 2022 and Q1 2023 and increasing in Q2 2023. Compared to non-climate-controlled units, Q3 2022 was different for climate-controlled units: three unit sizes had rental rate declines of one or two cents (5-by-5s, 10-by-10s, and 10-by-15s), one size had a one cent rental rate increase (10-by-20s), and one size’s rate was unchanged from the previous quarter (5-by-10s at $2.04). Year over year, the greatest rental rate decrease was for 5-by-5s, which dropped 21 cents per square foot; the other four sizes’ rates declined by 13, 14, or 15 cents.
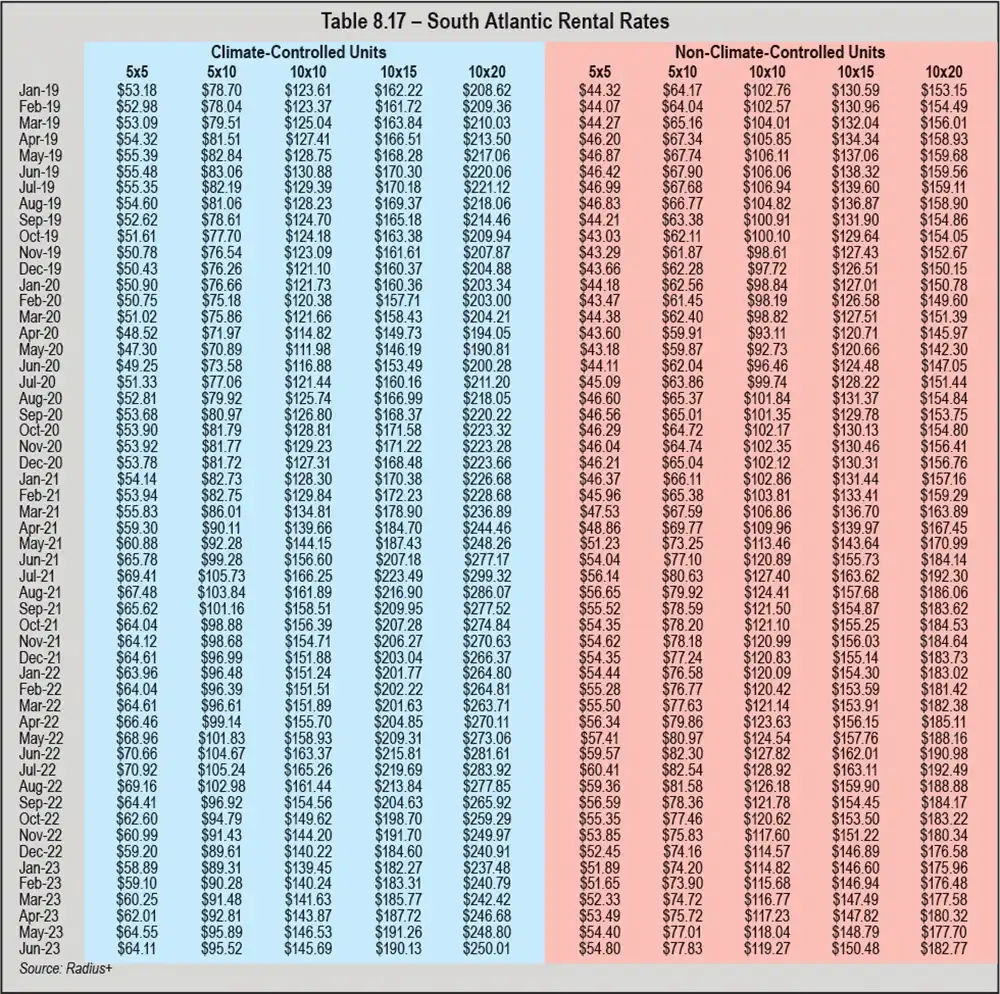
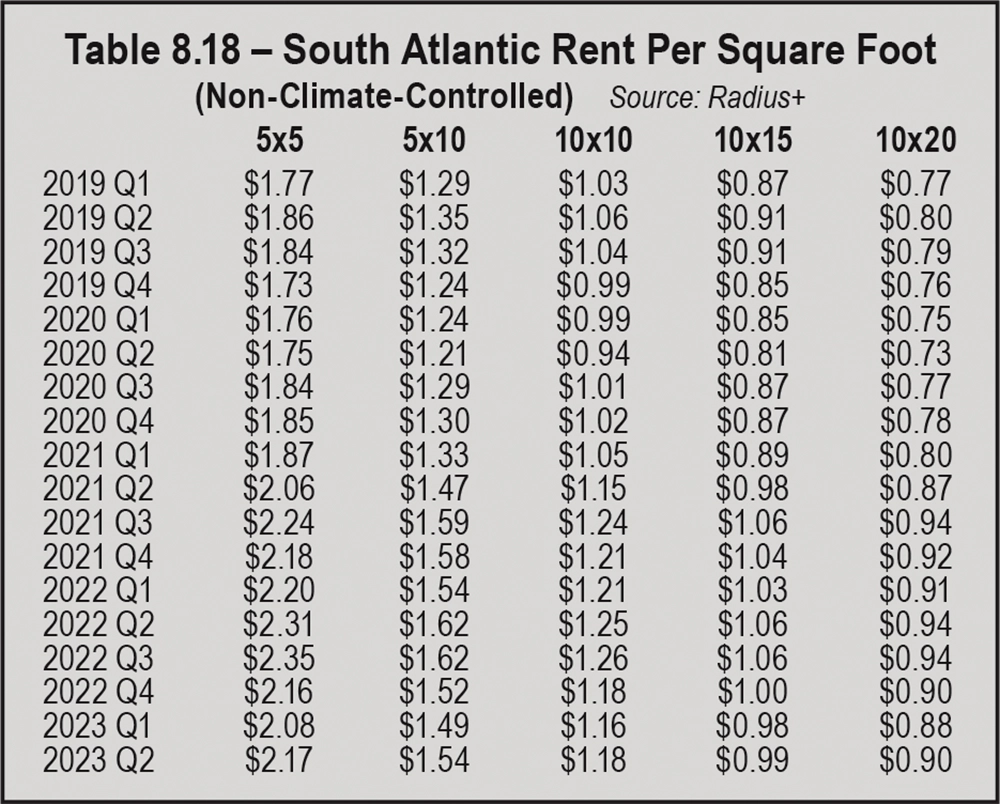
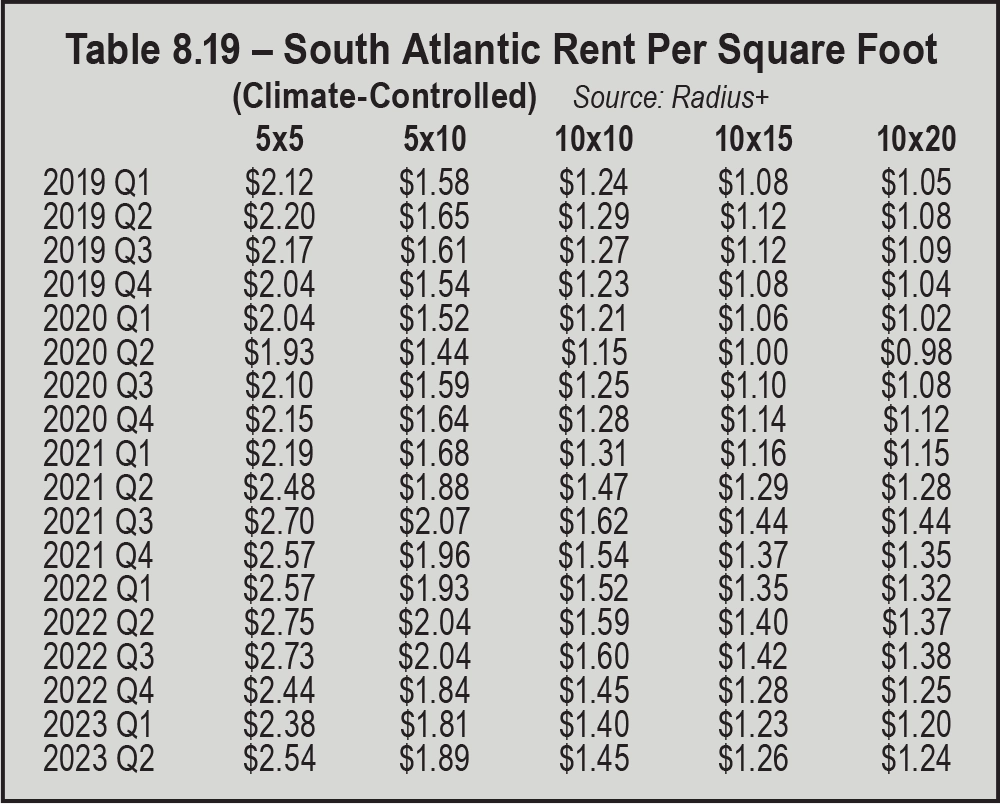
When looking at Table 8.20, one can see that there was much more variation in the South (East South Central) than other regions. However, there are a handful of consistencies to point out: All 10 unit sizes reported rental rate decreases in August 2022 and November 2022, and all 10 posted increased rates in April 2023. In addition, year-over-year (June 2022 to June 2023) rental rate drops were calculated for all unit sizes, ranging from less than a dollar (84 cents for non-climate-controlled 5-by-10s) to $21.74 for climate-controlled 10-by-20s. In July 2022, the two largest unit sizes of both unit types had rate declines, whereas the other six units had topmost rates that month. For climate-controlled 10-by-15s and 10-by-20s, the best month was June 2022. Climate-controlled units had more across-the-board trends than non-climate-controlled units: All five sizes had rental rate declines in September 2022, October 2022, December 2022, and January 2023, as well as increases in March 2023, May 2023, and June 2023. In February of 2023, only climate-controlled 10-by-20s and non-climate-controlled 10-by-15s posted rental rate decreases.
Tables 8.21 and 8.22 offer a quarterly look at rents per square foot. Compared to other regions, the year-over-year rental rate decreases in the South (East South Central) area were much less. As a matter of fact, one unit size (climate-controlled 5-by-10s) actually managed to post a one cent increase, from $1.83 in Q2 2022 to $1.84 in Q2 2023. The uniformity in rental rates for climate-controlled units seen in Table 8.20 is also present in Table 8.22, with rates for all sizes dropping in Q4 2022 and Q1 2023 and increasing in Q2 2023. Only climate-controlled 10-by-20s reported a rate decrease in Q3 2022; for the other four sizes, that was the most profitable quarter. For non-climate-controlled 5-by-5s, rates per square foot remained at $2.03 for three consecutive quarters (Q4 2022 to Q2 2023); that size had the most substantial year-over-year (Q2 2022 to Q2 2023) rate decline at 12 cents per square foot.
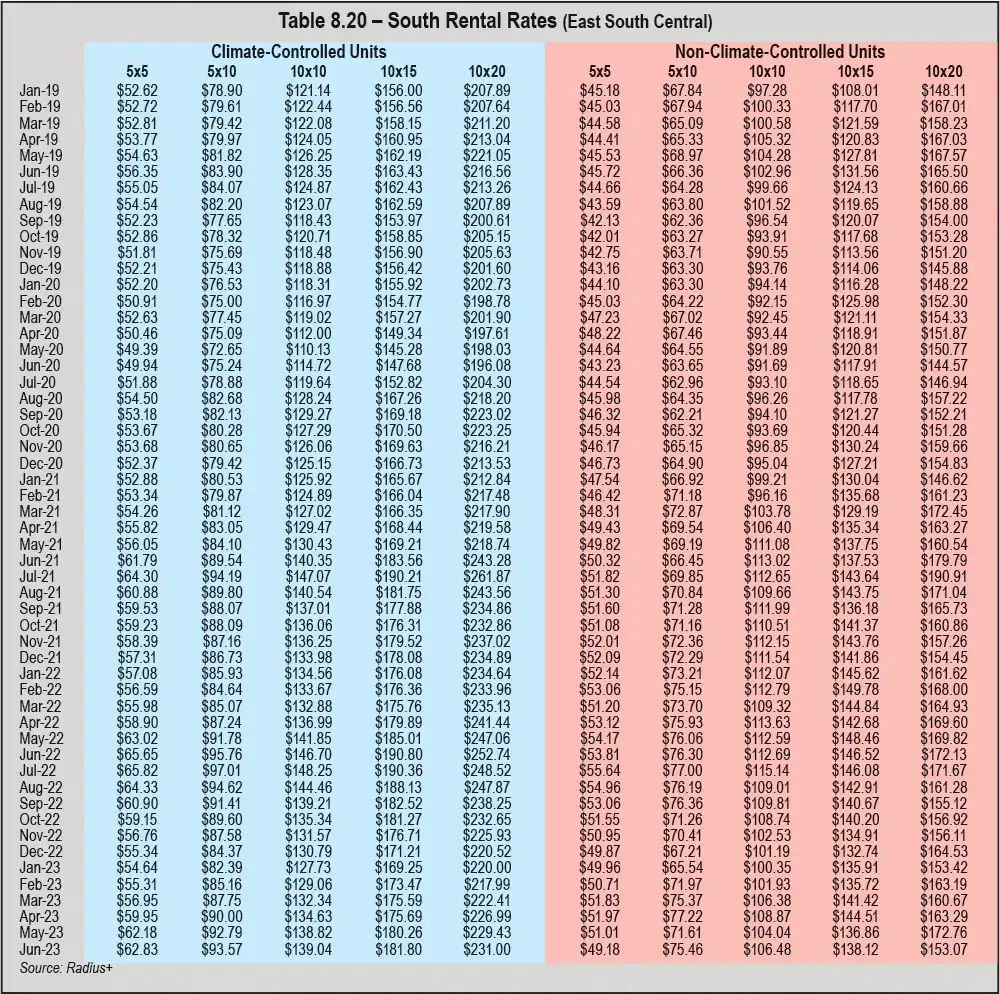
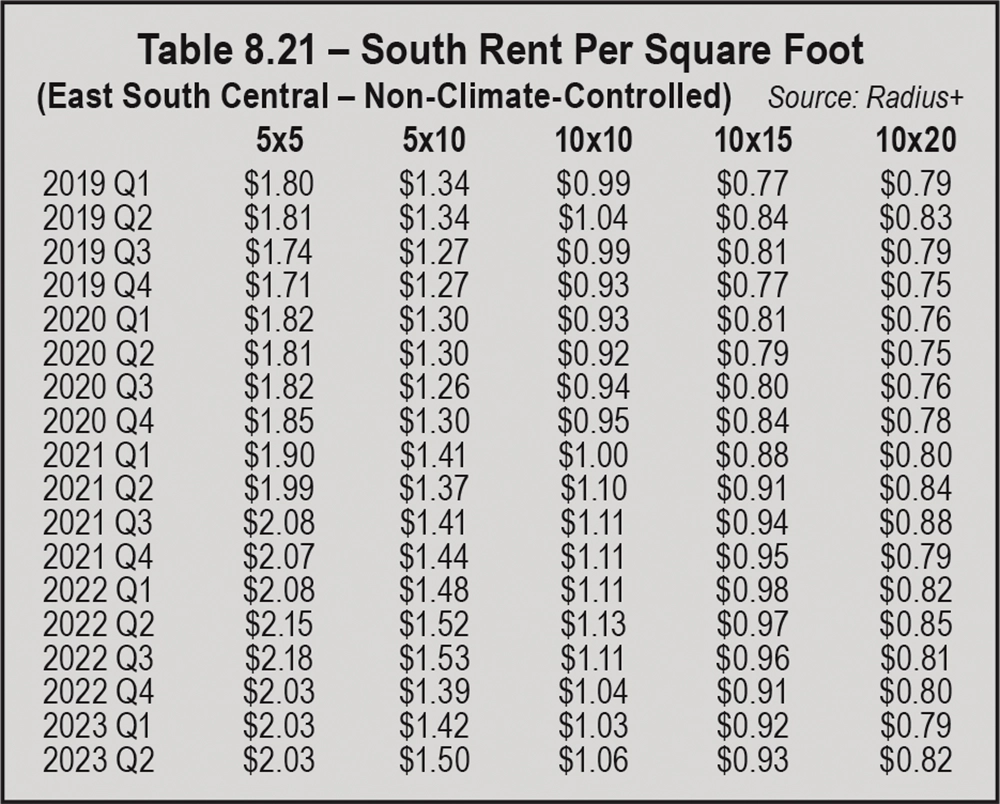
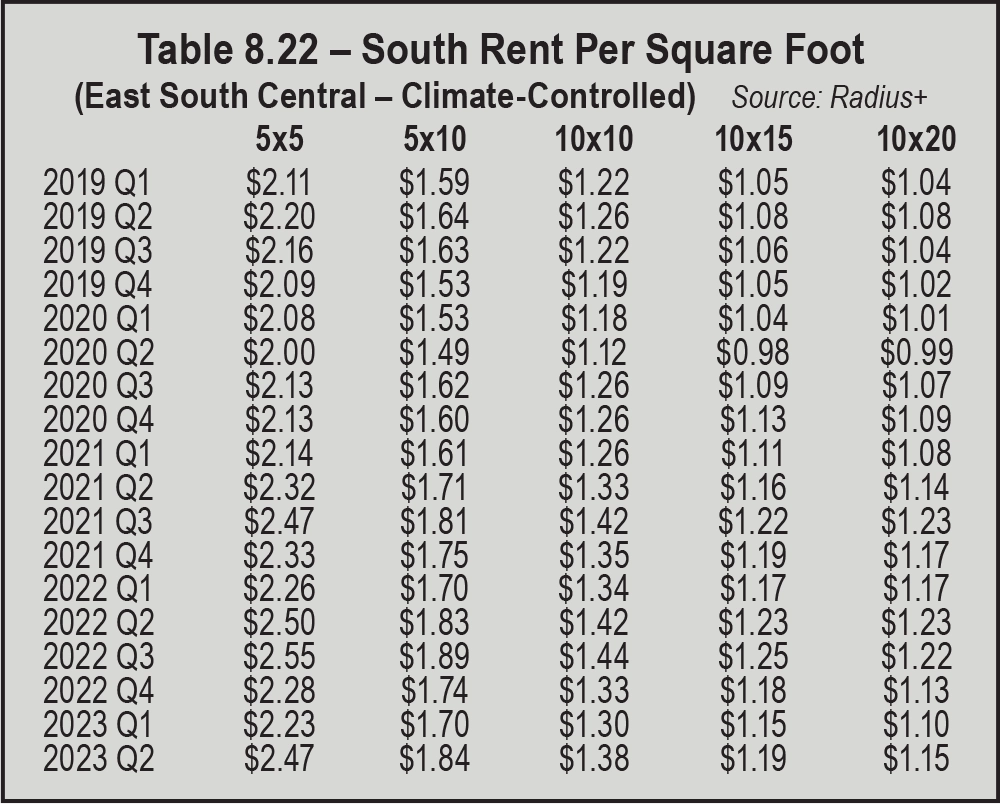
For the South (West South Central) region, Table 8.25 shows that rental rates were at their highest in June 2022 for all climate-controlled and non-climate-controlled unit sizes except climate-controlled 10-by-10s and non-climate-controlled 10-by-20s; those two units posted topmost rates in July 2022. Unlike units in other regions, rental rate decreases were reported for the majority (eight of 10) of units in the South (West South Central) region in July 2022; once again, climate-controlled 10-by-10s and non-climate-controlled 10-by-20s were the exception. From August 2022 through January 2023, across-the-board rate declines were posted by all units each month, minus two minimal rent increases: non-climate-controlled 5-by-10s in October 2022 and non-climate-controlled 5-by-5s in November 2022. Rental rates had marginal monthly increases from February 2023 through May 2023 for most unit sizes; there were several exceptions, however, mostly for non-climate-controlled units. Breaking the trend witnessed in other regions, more than half of the unit sizes listed in Table 8.23 reported decreased rents in June 2023. Compared to June 2022, all 10 units experienced year-over-year rental rate declines in June 2023; those losses ranged from approximately $3 to about $22.
Table 8.23 shows the same data by rent per square foot on a quarterly basis for non-climate-controlled units. The best rates were posted in Q2 and Q3 2022; rental rates were unchanged for 5-by-5s and 10-by-10s at $1.82 and $0.91, respectively. From Q2 to Q3 2022, the other four unit sizes had minimal rental rate increases or decreases of 1 cent. All unit sizes reported rental rate declines of 1 cent to 6 cents in both Q4 2022 and Q1 2023. Then, in Q2 2023, only 5-by-5s managed to raise rents by 5 cents per square foot; rates for the other unit sizes were flat from the previous quarter. By square foot, the year-over-year (Q2 2022 to Q2 2023) rental rate decreases ranged from 2 cents to 6 cents.
As for climate-controlled units, shown in Table 8.24, there are a few similarities to non-climate-controlled units in that region: All climate-controlled unit sizes had rental rate drops in Q4 2022 and Q1 2023 and from Q2 2022 to Q2 2023, but more substantial year-over-year losses (7 cents to 18 cents) were reported, even though all unit sizes posted increased rental rates in Q2 2023. In Q1 2023, rates for 10-by-20s dipped below $1.00 to $0.98 after six consecutive quarters above the $1 mark. Another oddity: Rates for 5-by-5s decreased 4 cents in Q3 2022; it was the only unit size to report a drop that quarter.
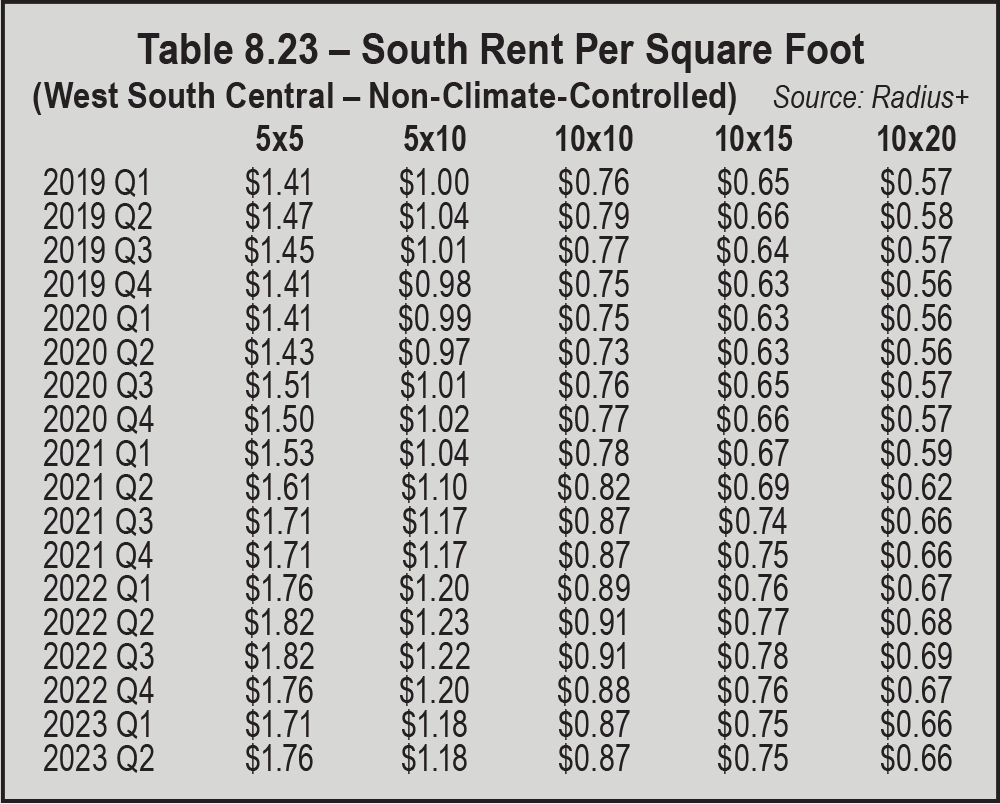
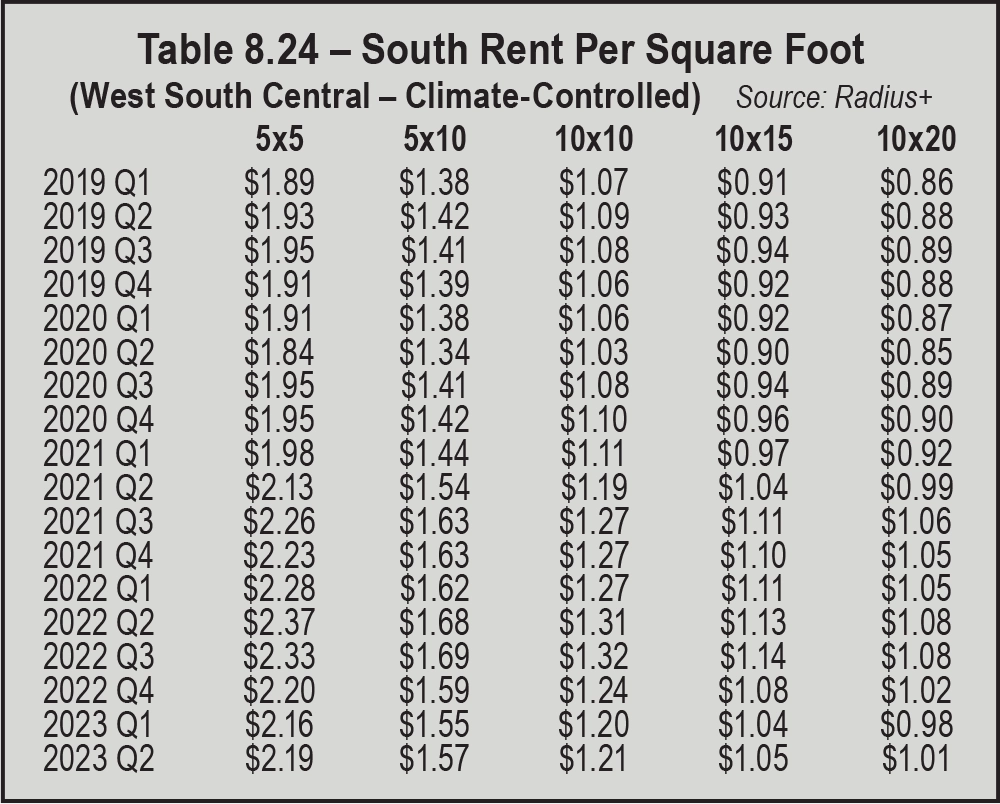
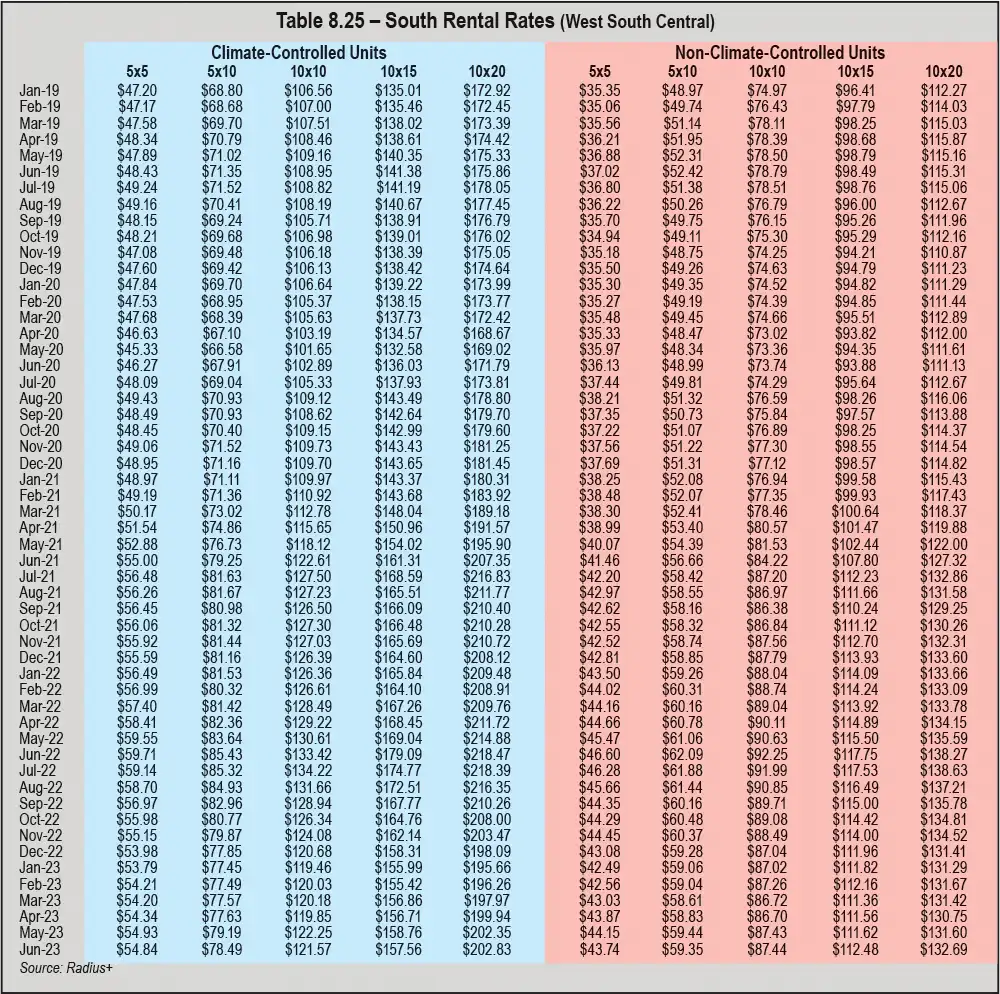
Within the West (Mountain) region, rental rate data in Table 8.26 shows that half of the units had topmost rates in June 2022, whereas rents for two non-climate-controlled units (5-by-5s and 5-by-10s) were highest in July 2022 and rates for two climate-controlled units (10-by-15s and 10-by-20s) were highest in July 2021. Besides non-climate-controlled 5-by-5s and 5-by-10s, all other units posted rental rate declines in July 2022. August, September, November, and December 2022 brought declines for all 10 unit sizes represented in the table. Conversely, all 10 unit sizes reported increased rates in May 2023. The months that make up Q1 2023 have less uniform rental rate movement. In January 2023, six unit sizes had declining rates while four had increasing rates. Then, in February 2023, rates were moving upward for seven of the 10 units. Only two climate-controlled units (10-by-10s and 10-by-20s) had rental rate declines in Marcy 2023. Rates dipped for climate-controlled 10-by-20s again in April 2023; that same month, non-climate-controlled 10-by-15s reported no change to its rental rate of $132.64. Although eight of the 10 unit sizes reported rental rate increases in June 2023, year-over-year decreases are shown for all unit sizes; those losses ranged from about $2 to $32.32 (climate-controlled 10-by-20s).
Tables 8.27 and 8.28, which detail rent per square foot for units within the West (Mountain) region, show that Q2 2022 was the best quarter for all sizes of climate-controlled and non-climate-controlled units. Additionally, rates either declined or remained flat for all climate-controlled and non-climate-controlled units in Q3 2022, Q4 2022, and Q1 2023. In Q2 2023, rates for all units were on the mend. Despite the Q2 2023 gains, all climate-controlled and non-climate-controlled units reported year-over-year rental rate declines. Of the two unit types, climate-controlled units had more substantial drops in rates from Q2 2022 to Q2 2023 (5 cents to 15 cents per square foot); rent losses for non-climate-controlled units ranged from 2 cents to 8 cents.
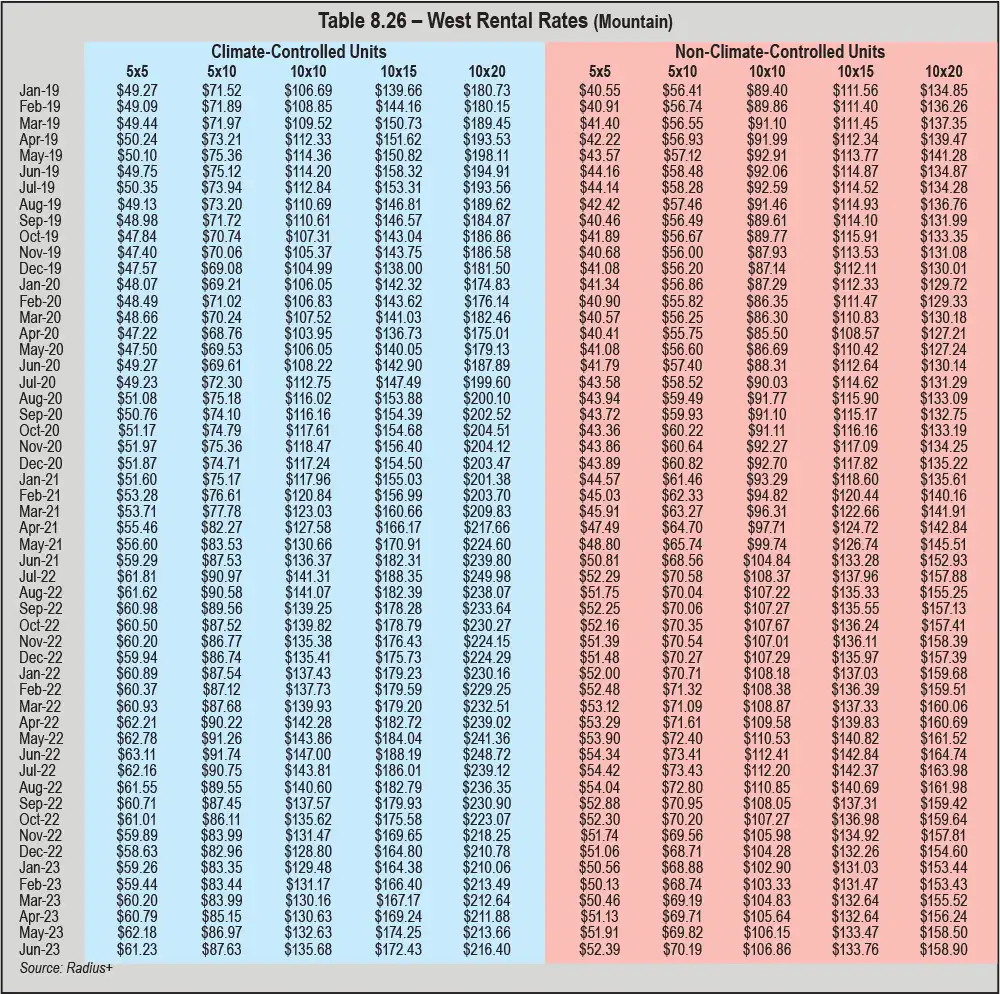
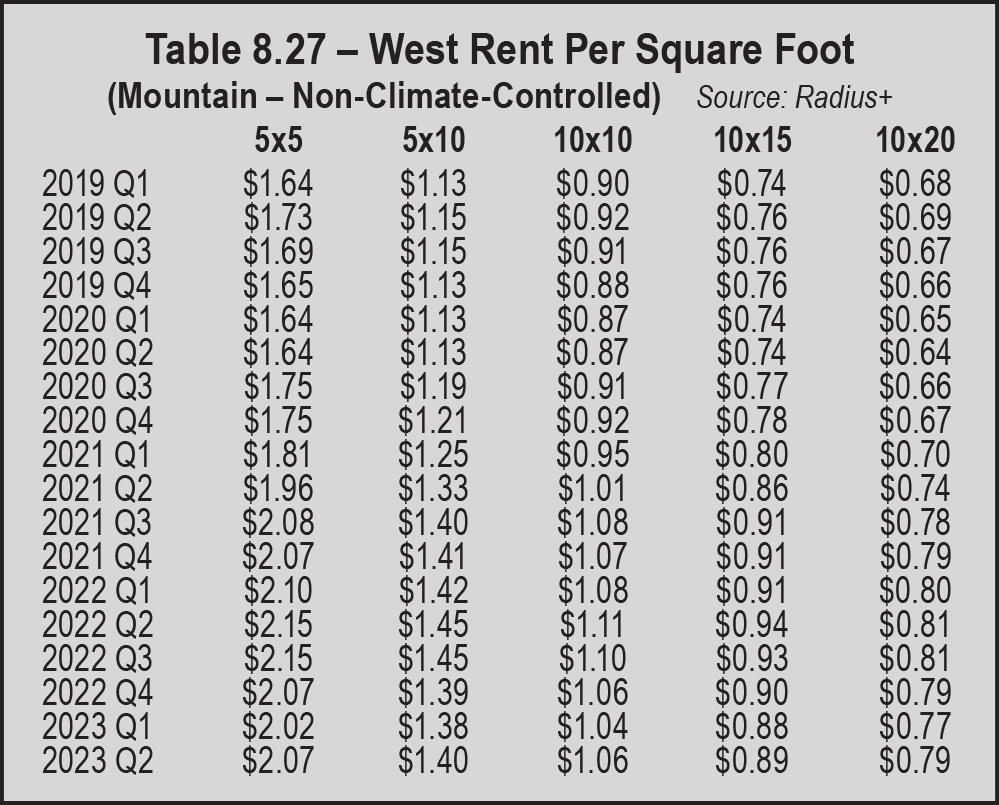
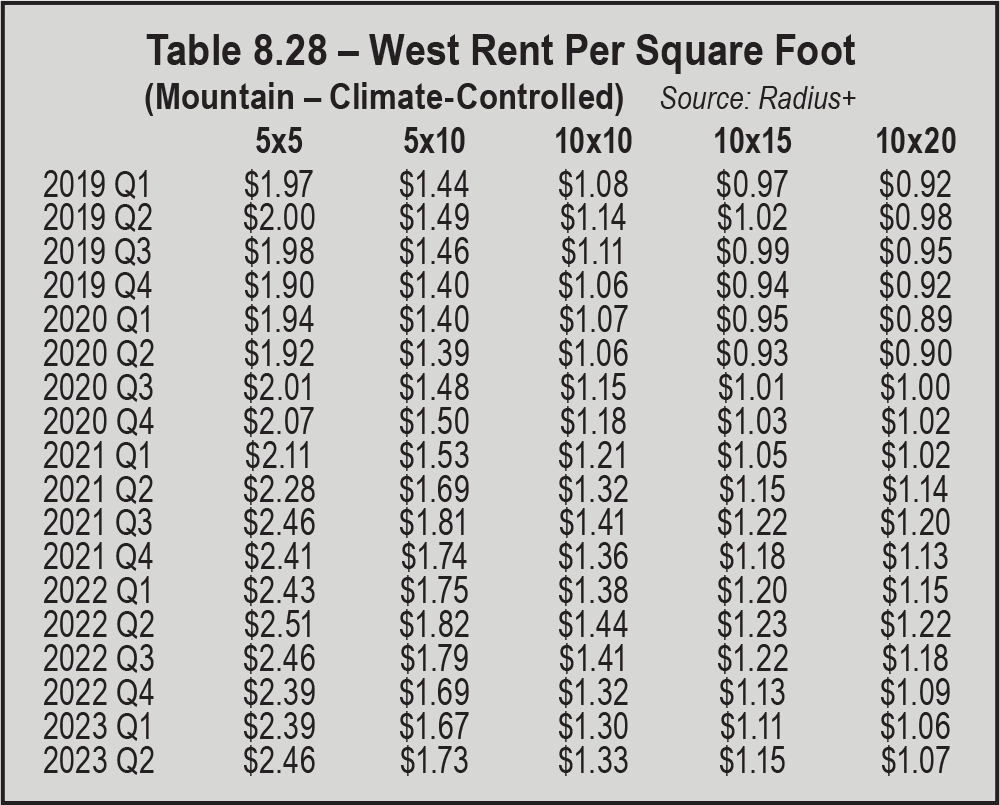
Unlike other regions, there are much fewer across-the-board trends for rental rates in the West (Pacific) region, as shown in Table 8.31. However, all 10 unit sizes did report rental rate declines in August 2022 and increases in April 2023. For non-climate-controlled units of all sizes, topmost rates were posted in July 2022. From June 2022 to June 2023, all 10 units experienced year-over-year rental rate declines. Though most were minimal (less than $2), two climate-controlled unit sizes had double-digit drops: 10-by-15s ($13.79) and 10-by-20s ($28.21).
Tables 8.29 and 8.30 look at rent per square foot in the Pacific West. For all climate-controlled units, rents were highest in Q2 2022, whereas topmost rates for non-climate-controlled units were reported in either Q2 or Q3 2022. All non-climate-controlled and climate-controlled units experienced rental rate declines in Q4 2022. Only non-climate-controlled 10-by-20s and climate-controlled 5-by-5s posted marginal increases in Q1 2023 (1 cent and 2 cents, respectively); that same quarter, no change was reported for climate-controlled 10-by-20s. Rates increased for all units in the Pacific West during Q2 2023, but only non-climate-controlled 10-by-20s experienced a year-over-year (Q2 2022 to Q2 2023) rental rate increase (up 1 cent to $1.39 per square foot). Over that 12-month period, rates for all other units dropped by 2 cents to 15 cents per square foot.
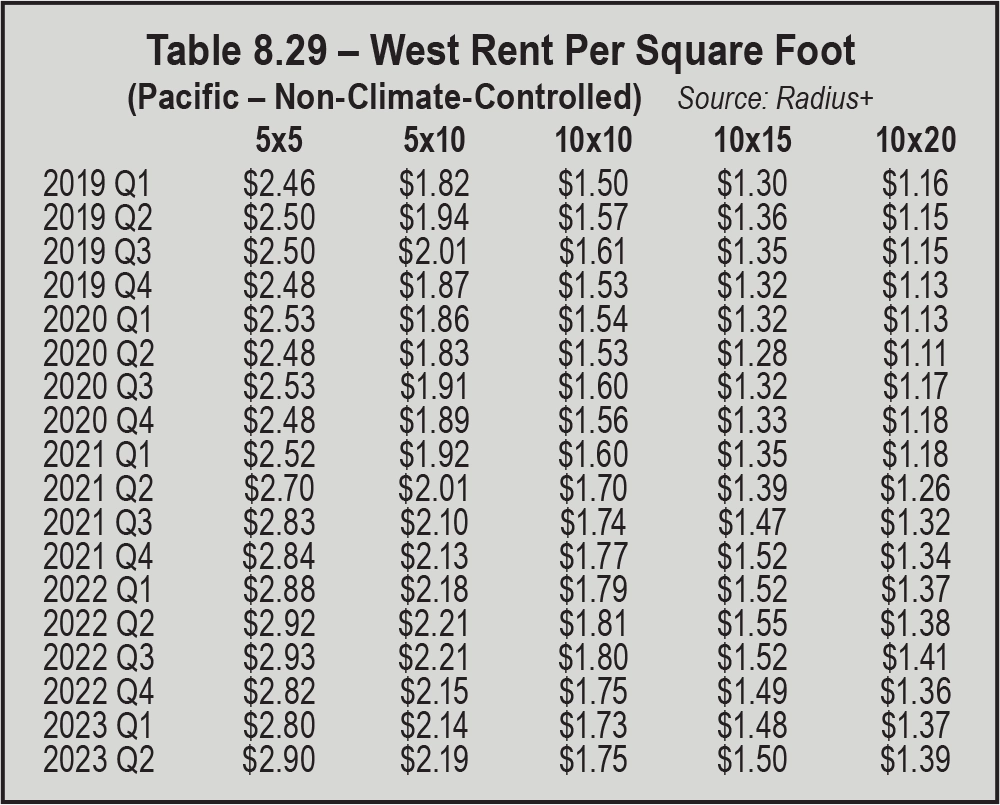
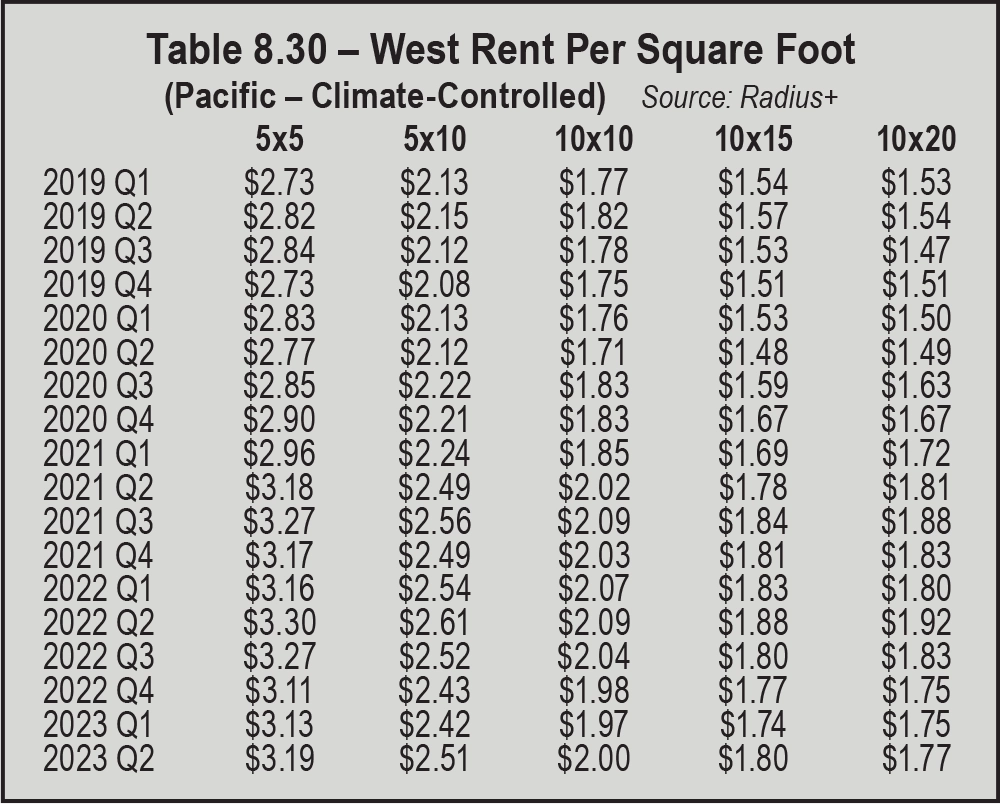
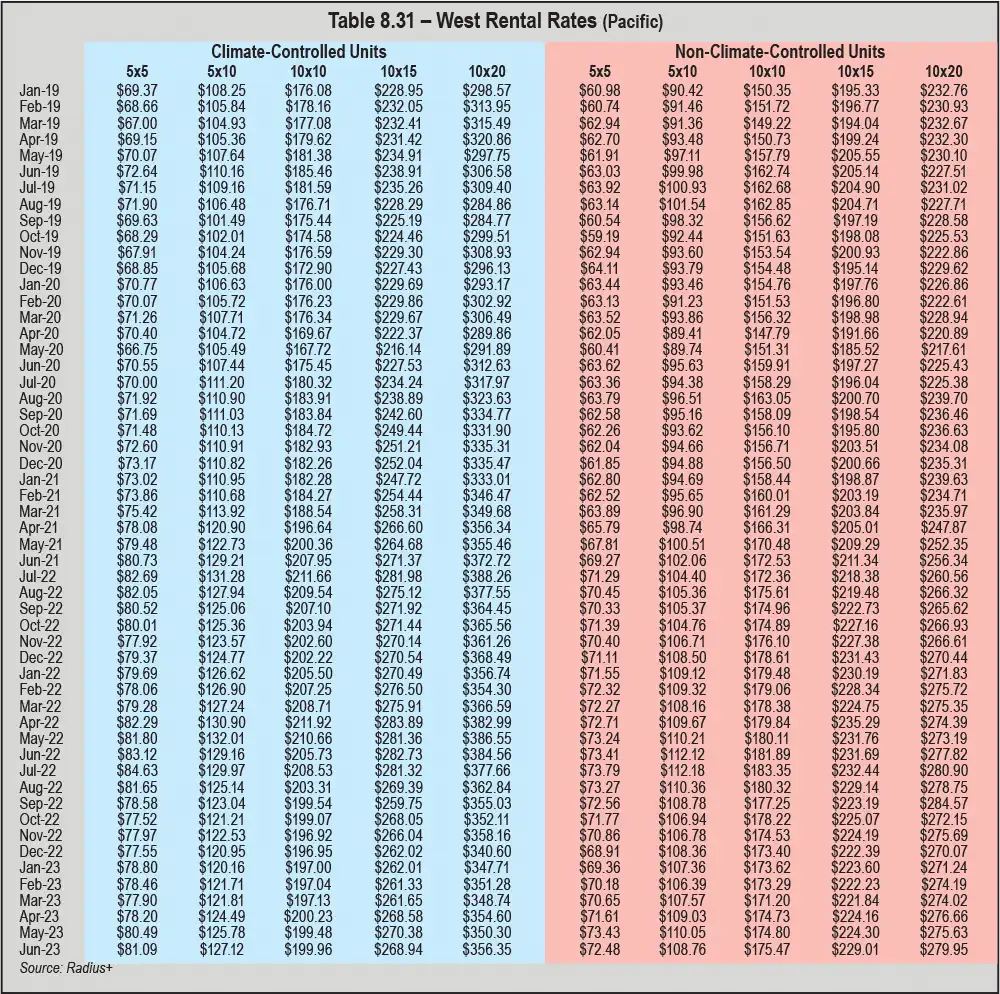
Remember: Supply and demand impact rental rates. Your rates should reflect your facility’s available supply and demand within your local market. And while it may be tempting to lower your rates to attract new customers and/or match the competition, most industry veterans recommend that owner-operators sell value not price.

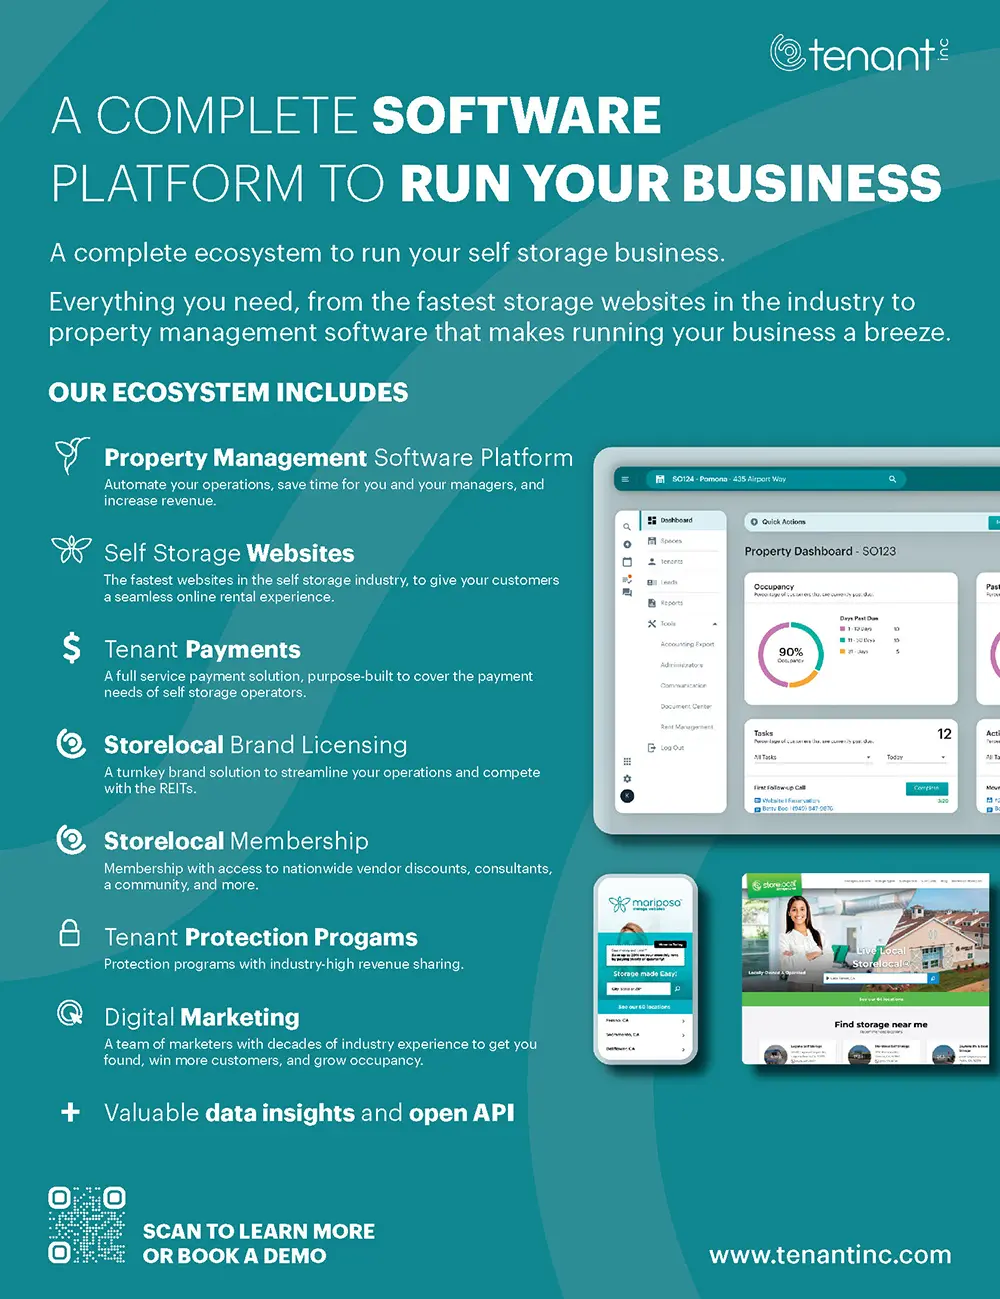


ength of stay by customer type and region; type, size, and number of units rented; and the journey customers take to find and rent from you are relevant factors in operating your self-storage business. Understanding these dynamics informs operational decisions such as marketing, staffing, and use of technology and services.
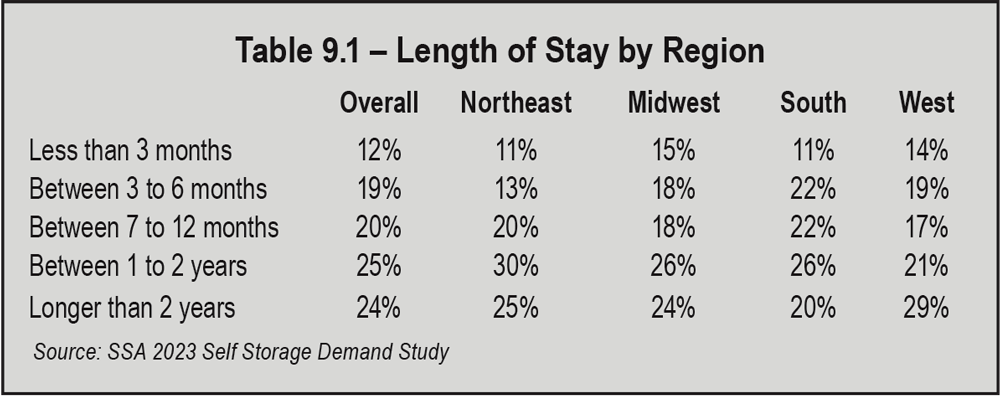
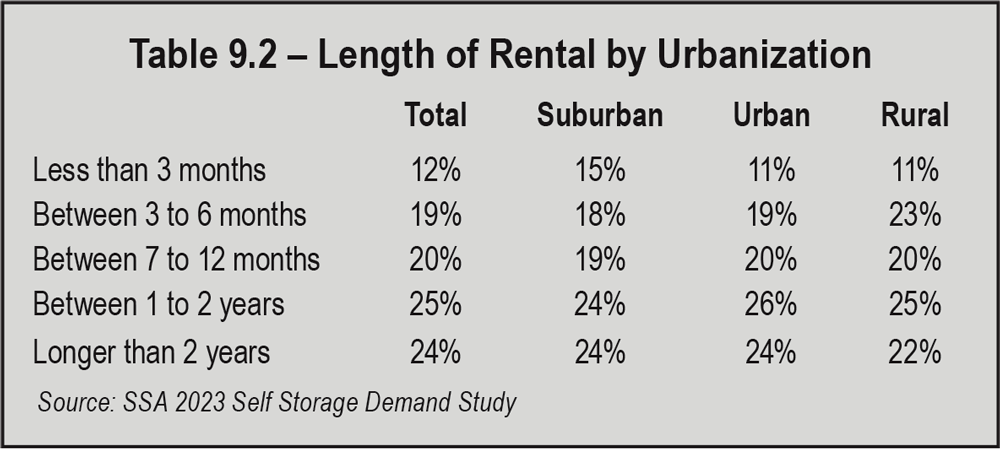
Length of stay for businesses renting space is significantly longer than other types of renters. As Chart 9.2 shows, 47.5 percent of businesses stay longer than two years, vs. 24 percent of all renters. The longer a renter stays, the fewer new renters you have to acquire, so your overall cost of acquisition goes down. Combine that with the facts that business customers are more likely to pay on time, on autopay, and not enter into foreclosure, and it is easy to see why this market segment is very attractive to self-storage operators.
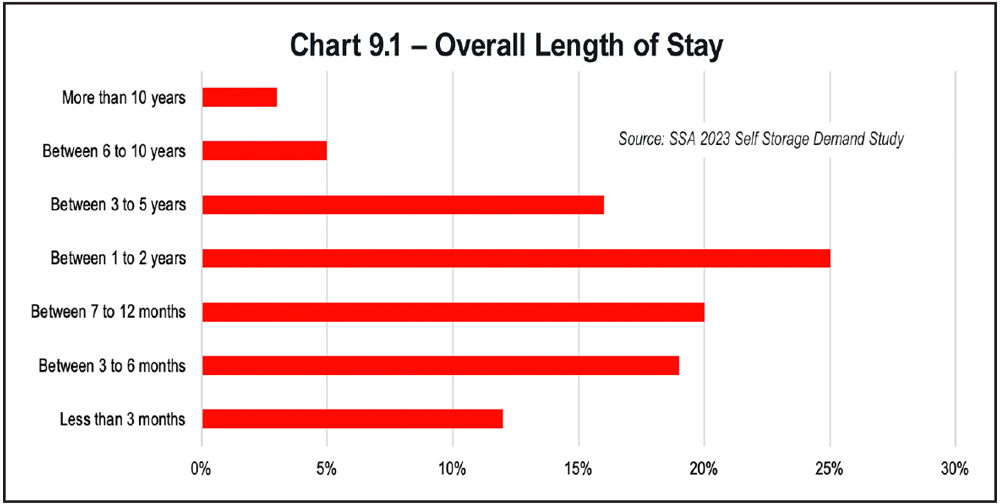
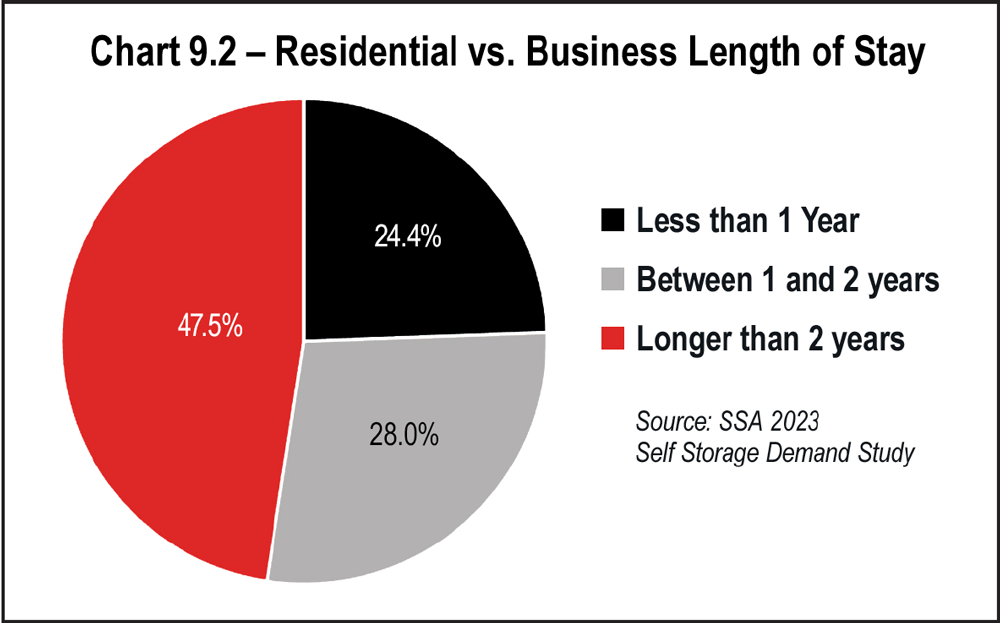
Table 9.2 evaluates length of stay by urbanization. Urban, suburban, and rural markets all mirror the national statistics, although slightly more urban renters (15 percent) stay for less than three months, as compared to the national average of 12 percent.
Like the SSA’s 2019 Self Storage Demand Study, the 2023 Demand Study shows that the most popular unit size was still 10-by-10; the next most popular size is 5-by-10. However, more recently, both data and operators indicate that larger unit sizes are in greater demand. This trend is visible as you go further down the list of sizes. In 2023, third and fourth place go to larger units (10-by-20s and 10-by-15s). By comparison, 5-by-5 was the third most popular in 2019. See Chart 9.4.
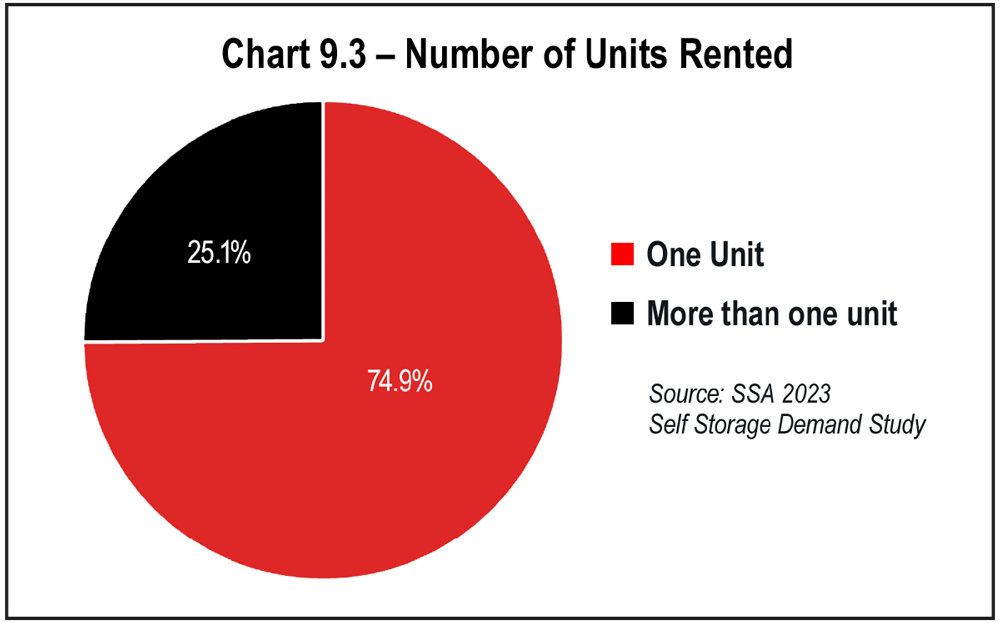
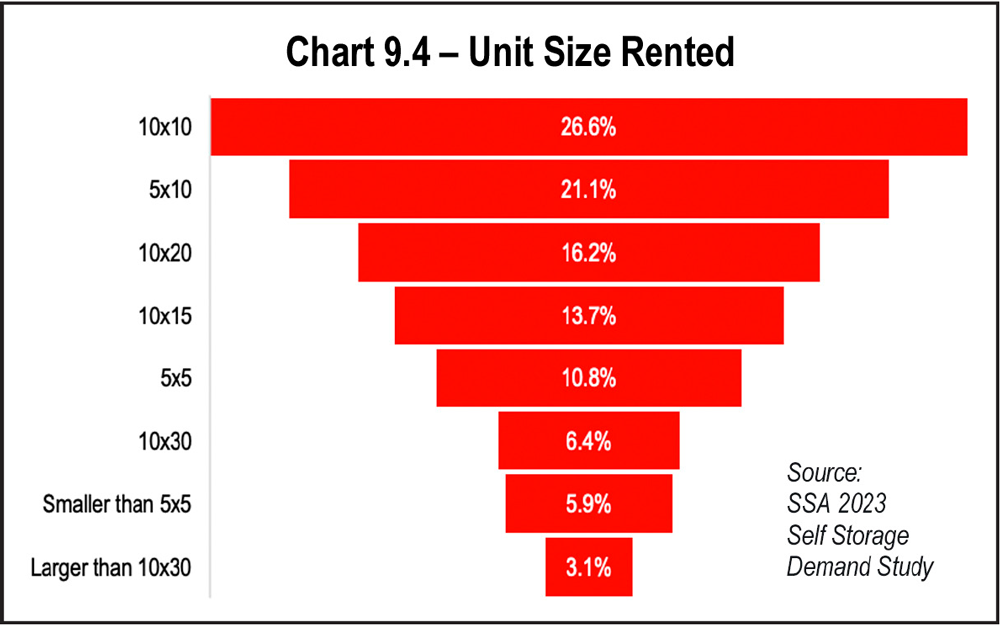
The number of different unit types have expanded over time. In the early days of self-storage, virtually all spaces were exterior, drive-up units. As the asset class matured, the consumer was provided more options. Many new, Class-A facilities are multistory buildings with climate-control space.
The most popular unit type is constant over time: exterior units with drive-up access, accounting for 55.7 percent of rentals. There are not significant changes in unit type rented when comparing pre-pandemic to post-pandemic data.
Breaking down rentals by region, while exterior units with drive-up parking are the most popular in every region, interior units with elevator access are more popular in the West than other regions. Overall, there is more interior space rented in the West than in any other region. In fact, the West has the most interior space and the least exterior space rented than any other region, while the Midwest is the opposite, with the least amount of interior space and the most amount of exterior space rented.
As more new supply is added to the market, much of which will be multistory, interior access, climate-control space, interior units are likely to account for a greater percentage of rentals.
Comparing type of unit rented by urbanization, exterior space rented exceeds interior space across the board in urban, suburban, and rural areas. Urban areas have the most interior space and the least exterior space rented, and rural areas are the opposite.
Self-storage has two fundamental characteristics that are worth considering. First, it is a commodity. Self-storage is not something people shop for “for fun.” They find it when the need it. Being top of mind when people need space is your challenge.
A second important facet of the self-storage business is that is, at its core, real estate. It’s real estate with a transactional business operating on it. That’s a mix that makes the asset particularly valuable as a cash producing, appreciating asset with a book of business.
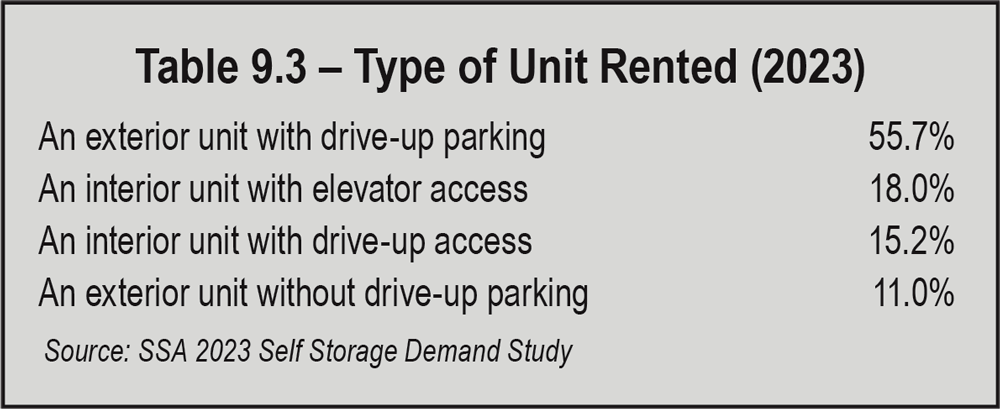
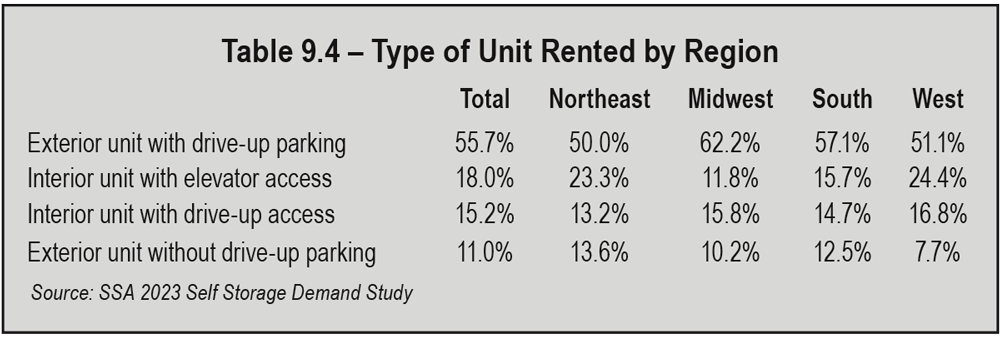
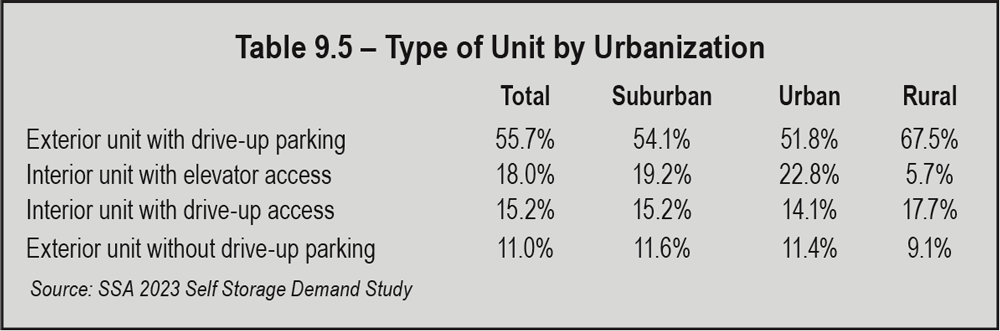
In real estate, everyone knows what the three most important factors are: location, location, location. That holds true for self-storage because drive-bys are the No. 1 source of rentals. People see your self-storage facility while driving to or from work or home.
This underscores the importance of having a location with a high traffic count. The greater the number of cars driving by every day, the more visibility you have, and the more you are on the mind of the prospect when they develop a need for space. Remember, self-storage is a commodity. People “discover” your facility when they need storage, even if they have driven by your store hundreds of times.
The newest data on how renters find self-storage facilities reveals something interesting: the second most likely way to be found by prospective renters is now online search (Google, Bing, other search engines). Throughout the history of the industry, word-of-mouth referrals has been second to drive-bys as a source of leads. Referrals have now been overtaken by online searches. See Chart 9.5.
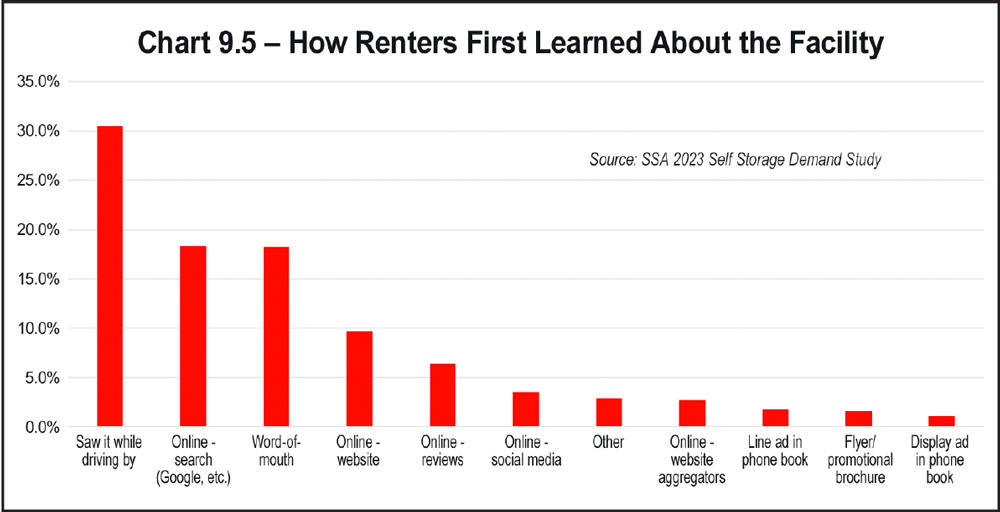
- “Saw it while driving by” refers to the consumers’ most common routes: driving to and from work and home.
- “Word-of-mouth” means referrals from family, friends, and co-workers.
- “Online – search” connotates the use of search engines: Google, Bing, and others.
- “Online – website” refers to your facility’s website or a related website, but not an aggregator like SpareFoot, which is the next category.
- “Online – website aggregators” refers to sites that pull together multiple sources of rental information.
- “Online – social media” is Facebook, Pinterest, YouTube, etc.
And as you can see, there are still two categories for the phone book, which refer to display ads and simple listings, or line ads. Believe it or not, in some markets, the Yellow Pages and mailers are still successful marketing tactics.
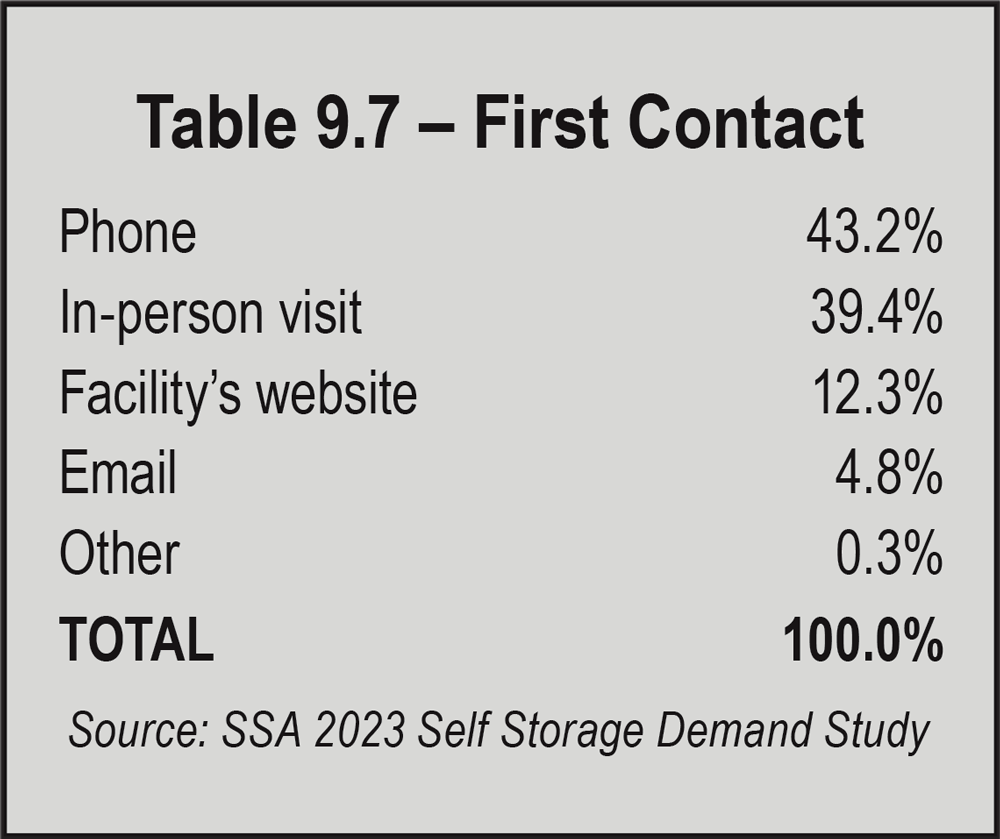
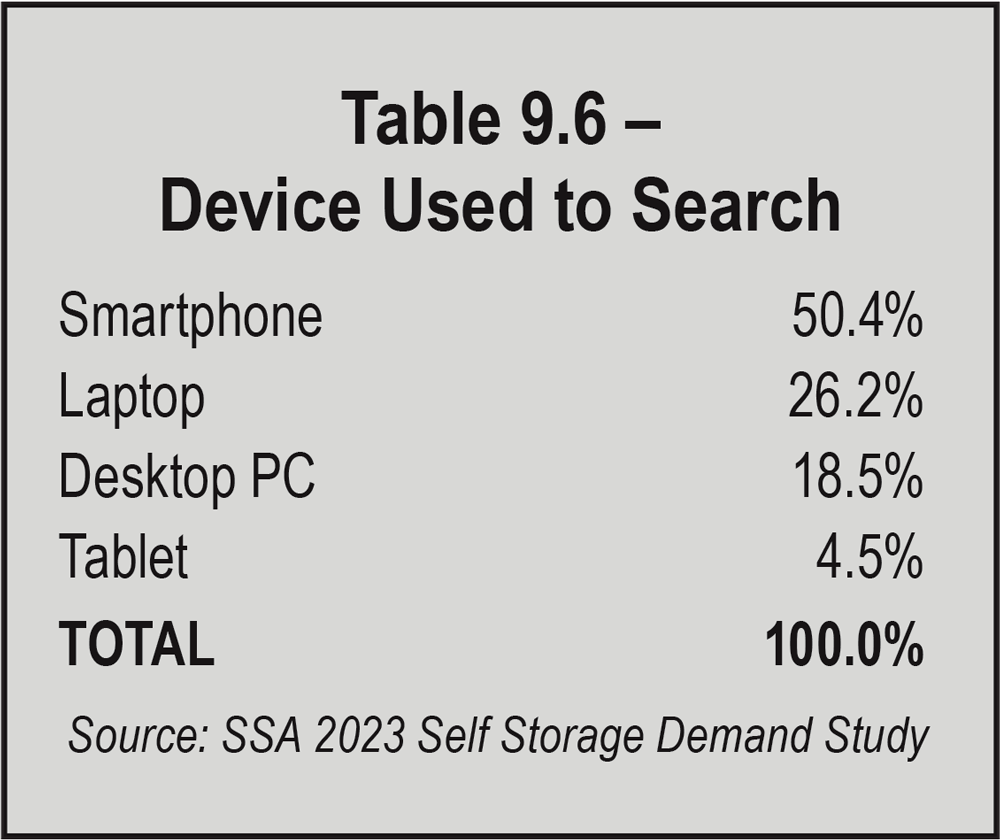
When they search online, over half of renters do so on their smartphones, especially Gen-Zs, millennials, and Gen-Xs. Laptops and desktops come in at 26 percent and 19 percent, and these searchers are more likely to be boomers. See Table 9.6.
Now the consumer contacts you. How they reach out to you tells you a lot about how to run your facility. Even today, when fewer and fewer people actually want to talk to you, the phone is still the most popular channel of communication. As Table 9.7 shows, a phone call is the leading way consumers contact a facility. This holds true for all generations, even Gen-Z.
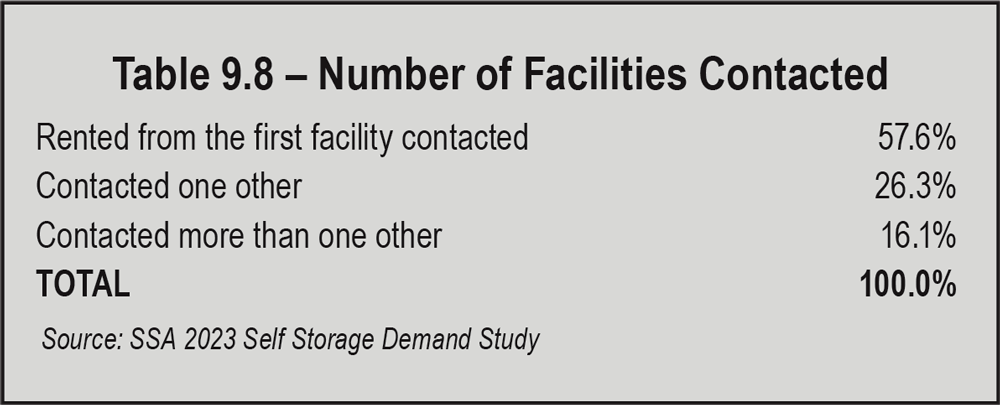
A fun fact about first contact: Prior to the 2023 Self Storage Demand Study, in-person visits were the No. 1 form of first contact. Falling four percentage points, it is now No. 2.
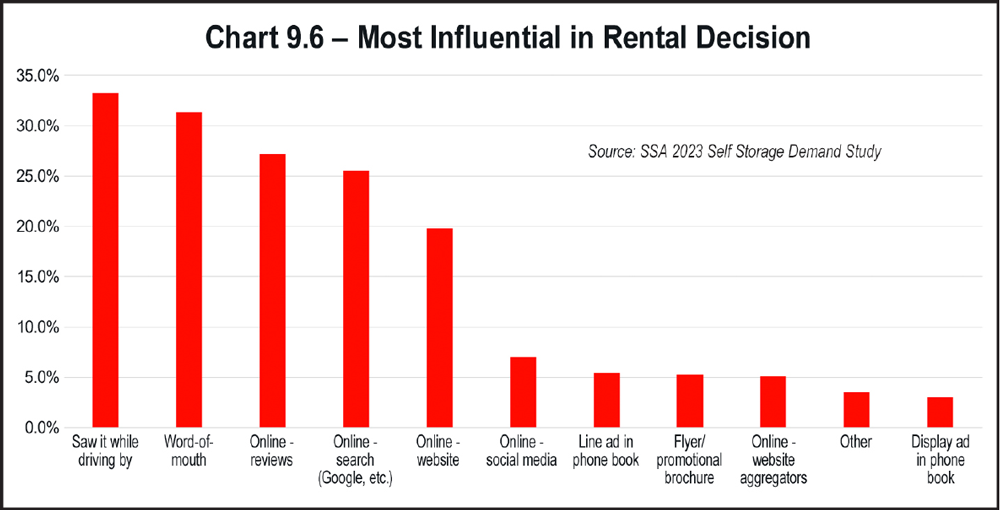
What do consumers want to know when they contact you? Price comes first, followed by unit size and availability. Clearly, you have an advantage if your website shows this information prominently. The team answering your phone needs to master this information, as well as being skilled at phone sales. See Table 9.9.
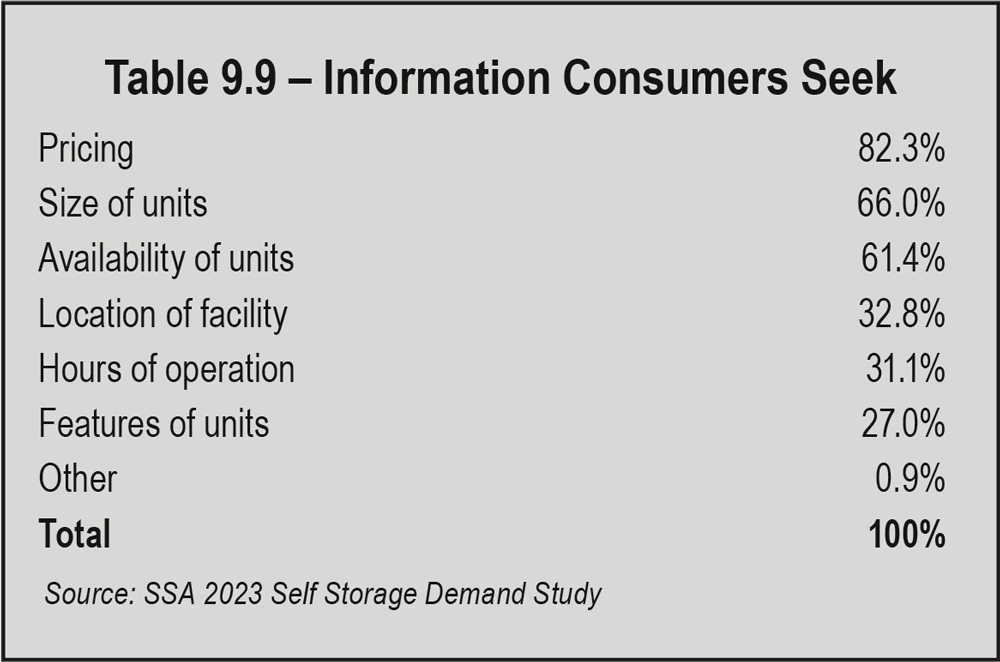
Of course, features and amenities are very important, and we’ll discuss that shortly. But first, we will focus on promotional efforts, advertising, and circle back around to your location. Of these factors, which are the most influential in the rental decision?
According to the 2023 Self Storage Demand Study and all the previous studies, driving by the facility has the greatest influence on a consumer’s decision to rent space. This emphasizes once again the age-old adage in real estate: It’s all about location. Being conveniently located and visible to drive-by traffic are critical to the success of your business. People rent space because they see the self-storage facility while driving to or from home or work.
Chart 9.6 answers the question, “What are the most influential factors in a consumer’s rental decision?” First place goes to location, as we just discussed. Second place goes to word-of-mouth, and third place goes to online reviews.
But remember, if you ask, “How did the renter first learn about your facility,” first place again goes to location, but second place goes to online search, and word-of-mouth comes in third, as shown previously in Chart 9.5. All this information is important to understand how people find you and how they decide you are the best place to rent.
If you are buying an existing facility, understanding consumer expectations will help you bring your new acquisition up to consumer standards with a capital expenditure (CapEx) project as soon as you close the transaction. Doing all CapEx improvements up front means putting them in your financial package (including your proforma and your loan) and doing the projects as soon as you close, so you can immediately add value to your new asset and raise rates.
If you already own the asset, you can still add new features consumers desire in a CapEx project, adding value to your asset. CapEx projects should already be included in your facility budget over time. Falling behind consumer expectations will cause your rental rates to decline beyond market pressures as facilities in your vicinity modernize and offer valued features and amenities you do not have. Keeping up with the Joneses is a time-tested business strategy when it comes to meeting consumer expectations.
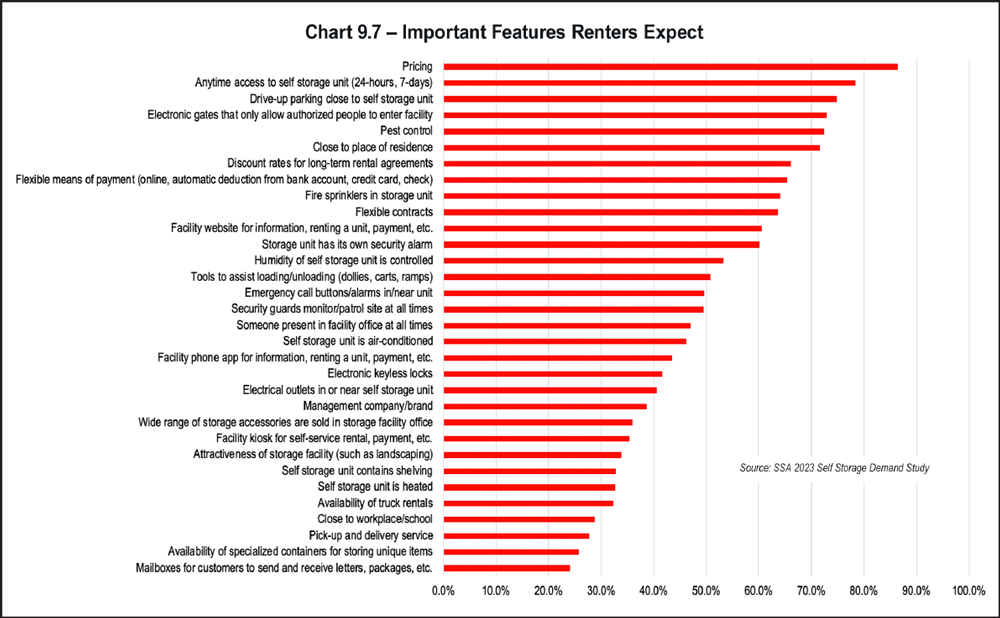
In terms of features expected, price is at the top of this list. Price has been and remains the most important decision-making factor for self-storage renters. Next in consumer expectations are anytime access, drive-up access, electronic gates, pest control, and proximity to residence.
Chart 9.7 tells you what consumers expect, but let’s take a different perspective on this list. What are renters willing to pay extra for? That is shown in Chart 9.8.
The features high on this list are opportunities for you to up-charge, adding revenue to your bottom line, like the way airlines charge more to board early and check baggage. With the introduction of dynamic pricing to the self-storage industry, operators are able to differentiate price based on which features are in greatest demand. Units close to the elevator are more popular than ones that are a long walk away. Some renters prefer not to use the elevator at all. Hence, good-better-best pricing means units close to the elevator and on the first floor garner higher rent.
Differentiated pricing adds revenue to your business without additional cost of customer acquisition. The features high on the list in Chart 9.8 are worth considering. Determining the feasibility of each one for your facility and calculating the return on investment (ROI) can be used to determine your next CapEx project, as well as where to beef up your operating expenditures (OpEx).
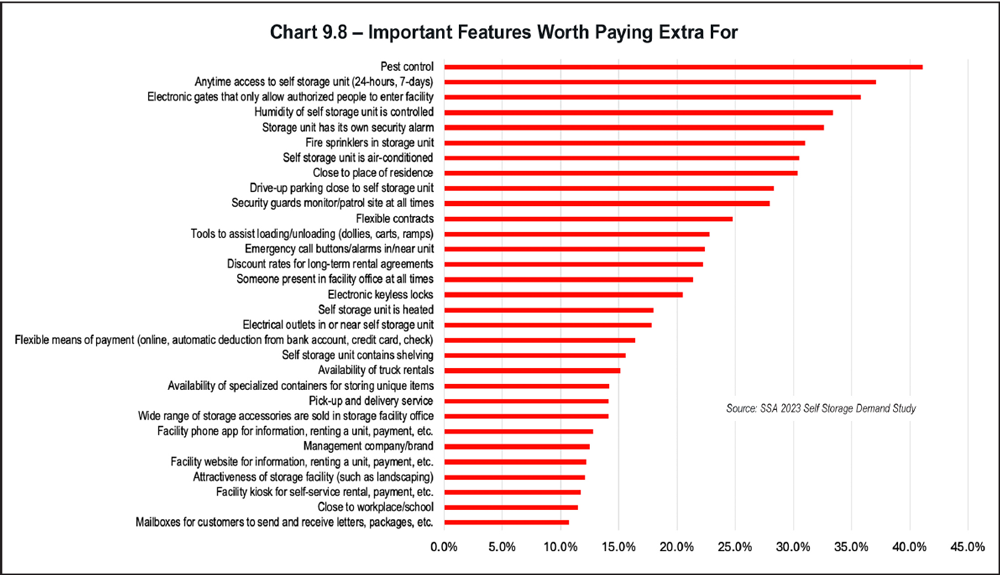
Second on consumers’ list of what they are willing to pay extra for is anytime access. That means they will pay a fee to access their unit before or after regular access hours, up to 24 hours a day, 7 days a week. This is a fee that can be added to rent every month, without generating additional cost. You can even have a graduated fee schedule that goes up as access hours and days increase. Bakers need to access their trucks at 5:00 a.m. Builders need access to equipment by 6:00 a.m. Residential renters who don’t want to plan visits to their unit to bring and retrieve stored items want access at any hour of the day or night. All of these levels of access can have a different fee.
How often renters visit their units is another factor that underscores the value of being close to where your customers live. The most common number of storage unit visits is once a month, followed by every two weeks. Notably, the number of renters visiting their units more than once a week decreased 5 percent between the pre- and post-pandemic demand studies. Currently, about 12.5 percent of renters visit their units more than once a week, and they are most likely to be in the younger generations. See Table 9.10.
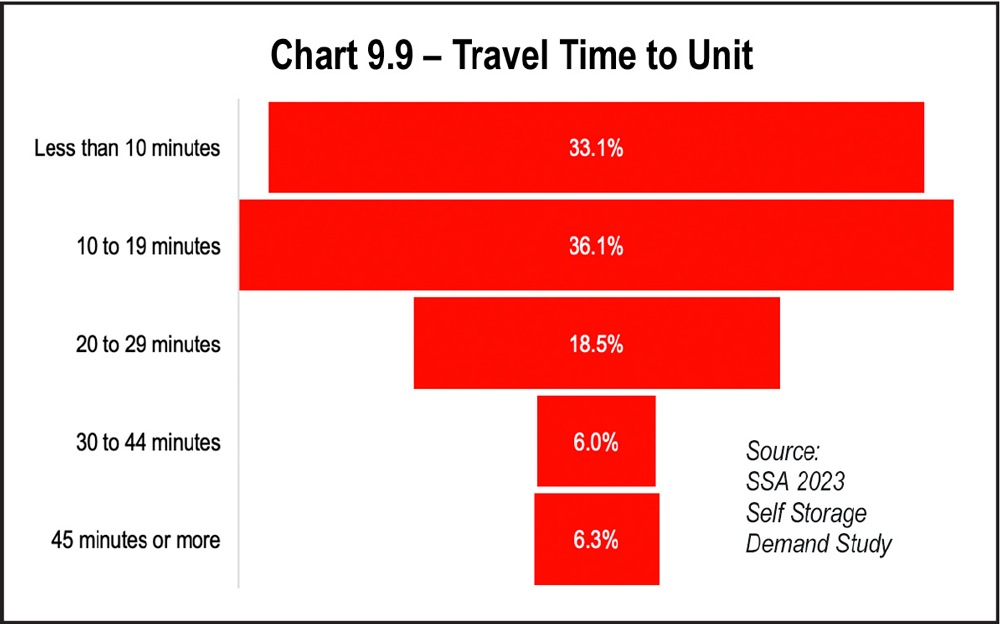
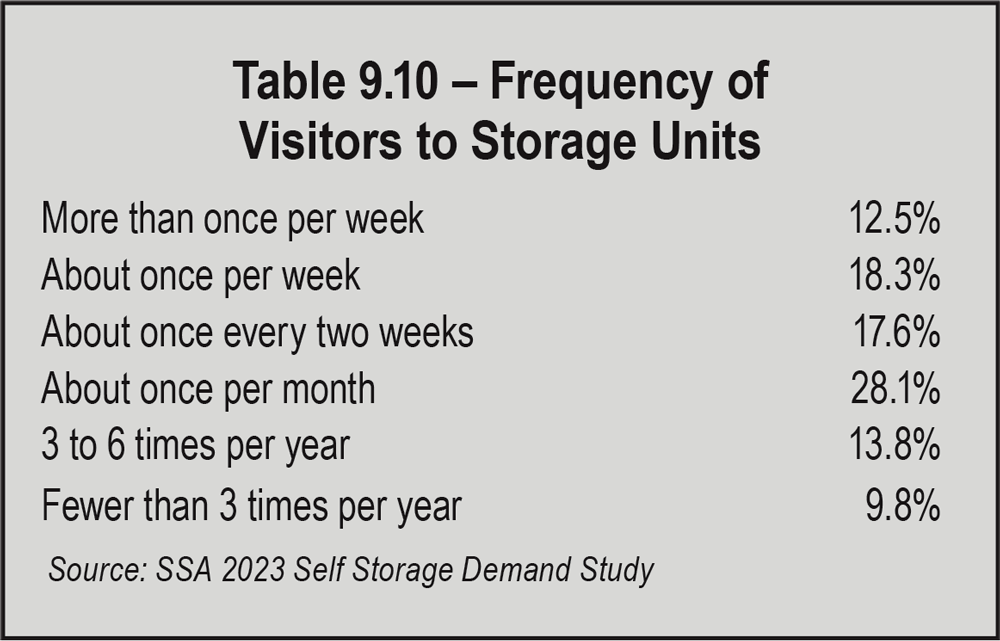
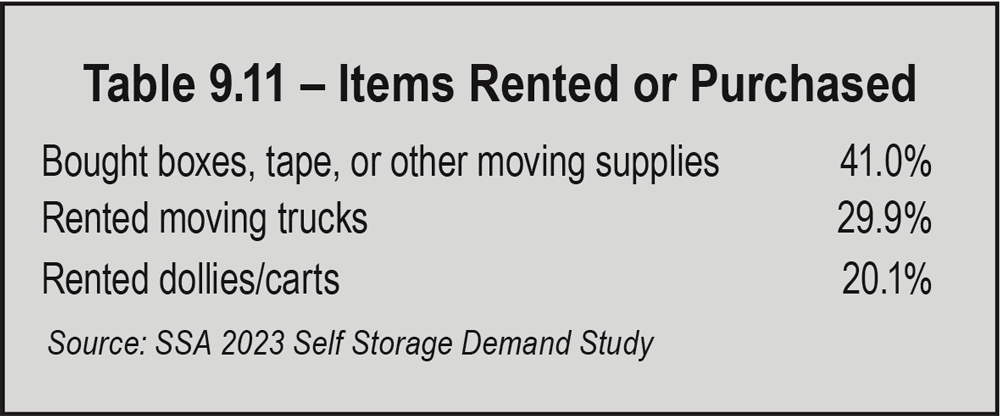
In Table 9.11, note that renting moving trucks comes with payroll costs. If you are in lease-up and have on-site staff, the ancillary income generated could be sufficient to cover payroll, but this calculation must be done carefully to be sure it is a profitable option for your business.
How does your customer want to pay? The preferred method of payment is automatic payment with credit card, followed by consumers who prefer to call or visit every month to pay with a credit or debit card.
Automatic deduction from bank account rose six percent since 2020, showing the largest growth. Autopayment makes renters’ lives easier, and autopayment directly from a bank account is the least costly method.
Shown in Table 9.13, renters want flexibility in payment type, especially true for Gen-X or millennials. All of these options are valuable choices to offer your renters because they make it easier to collect monies due.
When it comes to site information, there is a plethora of detail. Mastering the details of the customer journey and consumer demand will improve your operational decisions from marketing to staffing, including selection of technology and services. All of this adds to your bottom line, helping you serve up what your customers want at prices they are willing to pay.
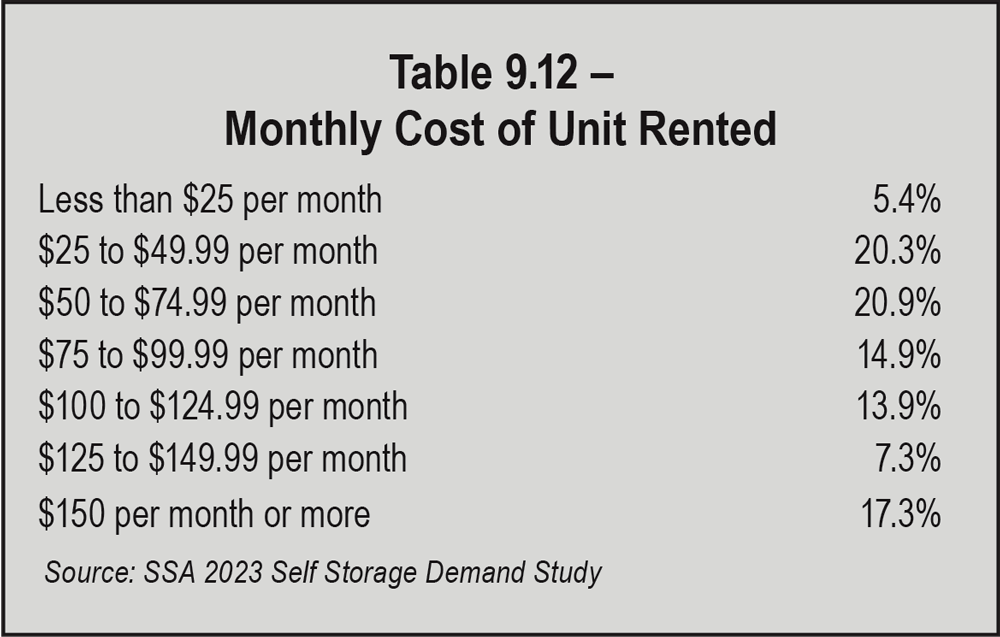
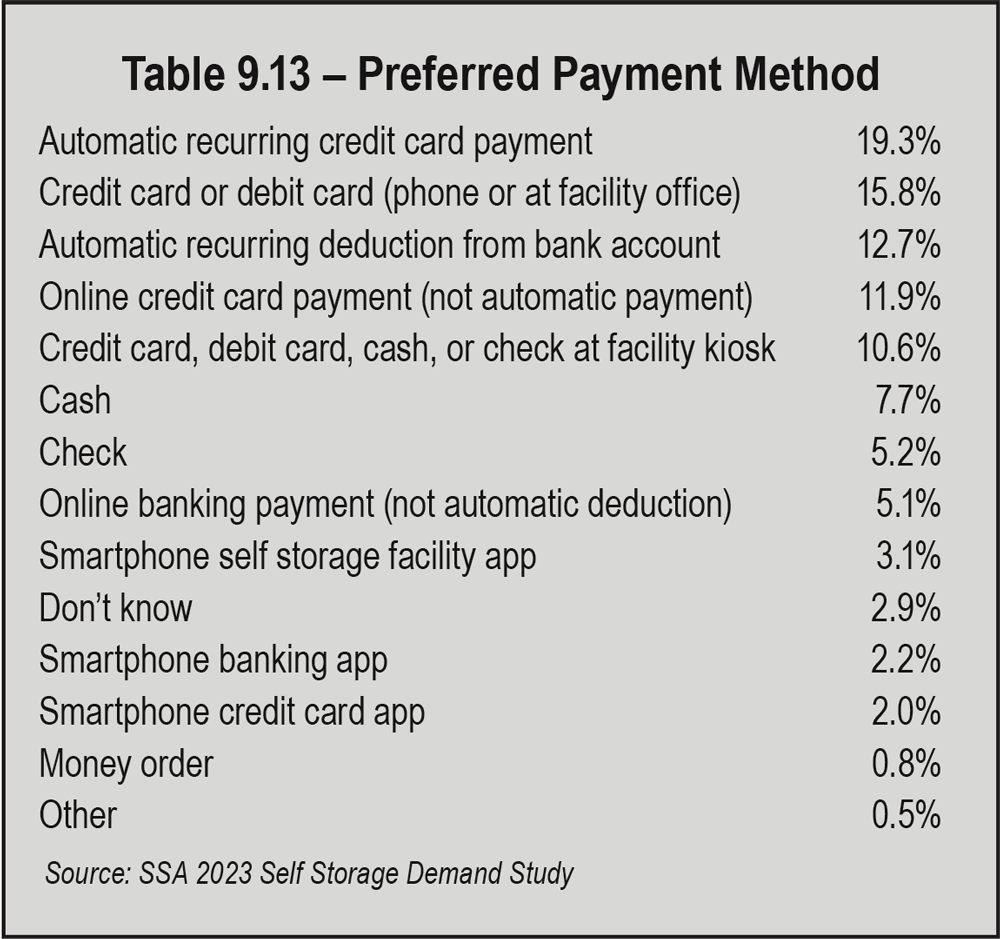

arketing is all the activities, promotions, service programs, and advertising, both traditional and digital, we undertake to create awareness of our storage property and to bring in qualified prospects to rent our spaces.
Planning for the right mix of advertising and store originated marketing activities that will produce the needed results can be challenging at best; no one wants to spend any more money than necessary to have the desired occupancy shown in the proforma. Making sure we pay attention to the source for each customer, watching industry trends, and observing which programs are effective for other storage operators can be instrumental in the success of the store. Today we are seeing numerous operators turn their focus to digital marketing due to the benefits of its low cost, ease of use, and ability to locate targeted groups easily online. Most self-storage operators have high-speed internet access at their facilities and webcams and speakers on the store computers, as well as smartphones that can capture high-quality photos and videos with the touch of a button. With these valuable tools, we can reach out into the world and clearly define to whom we market and what our specialized offer will be for each of the special groups.
Large or small, brand-new or older properties, we are all in need of a constant stream of inquiries to grow or maintain occupancy and keep rates as high as possible. Community events and grassroots marketing in your neighborhood can do just that while lowering your cost per lease (CPL). In 2023, Universal Storage Group’s (USG) managers made an average of 49,462 marketing messages per store per year, or 4,122 per month average.
Marketing strategies encompass a range of actions: outgoing calls, emails, visits, on-site events, social media posts, club meetings, expos, off-site networking, social media reach, and referrals. Despite 2023 results remaining below USG’s pre-COVID benchmarks, USG has seen notable year-over-year improvements. By the end of 2022, USG’s average cost per lease across the entire portfolio stood at $81.45, which USG observes as significantly outperforming CPLs of other top operators.
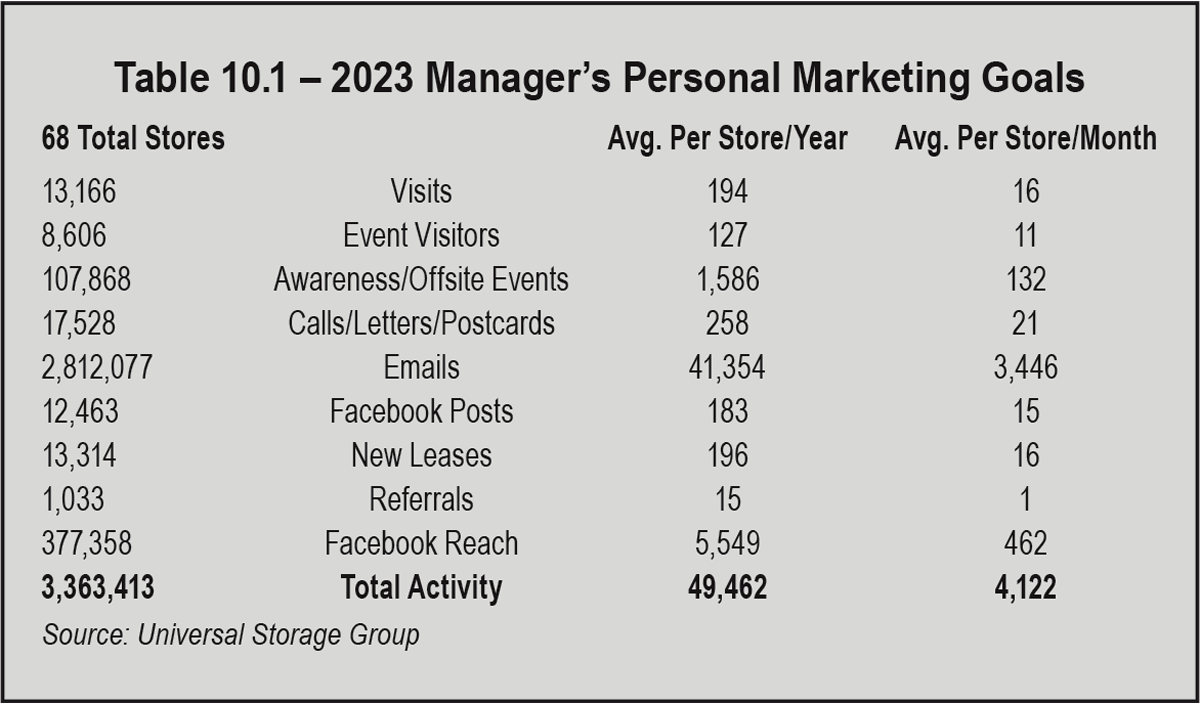
As experts guiding the public in storage solutions, we’re witnessing abundant opportunities everywhere. Engaging with the community doesn’t just enhance operational profitability but also elevates personal satisfaction when involving family, friends, and neighbors. This isn’t the moment to scale back on sharing your narrative; it’s time to ensure that everyone in your community is acquainted with you and your self-storage facility. USG’s approach involves Zoom meetings, Constant Contact, emails, Facebook posts, and in-person marketing visits. These multifaceted efforts aim to immerse us deeply on a local level. It’s up to each of us to generate our own on-site traffic from the community to enhance our web presence and online efforts.
USG utilizes these four tools for its grassroots marketing and its managers’ personal marketing goals (PMG):
- Community involvement
- Visits to all local retail and institutions/organizations
- Follow-up and market electronically
- Host events the community is interested in attending
USG sets a goal for each type of activity and then tracks its results.
Here’s a list of more than 20 events/items USG finds to be very successful if planned properly (at least 120 days or more in advance) and executed according to plan:
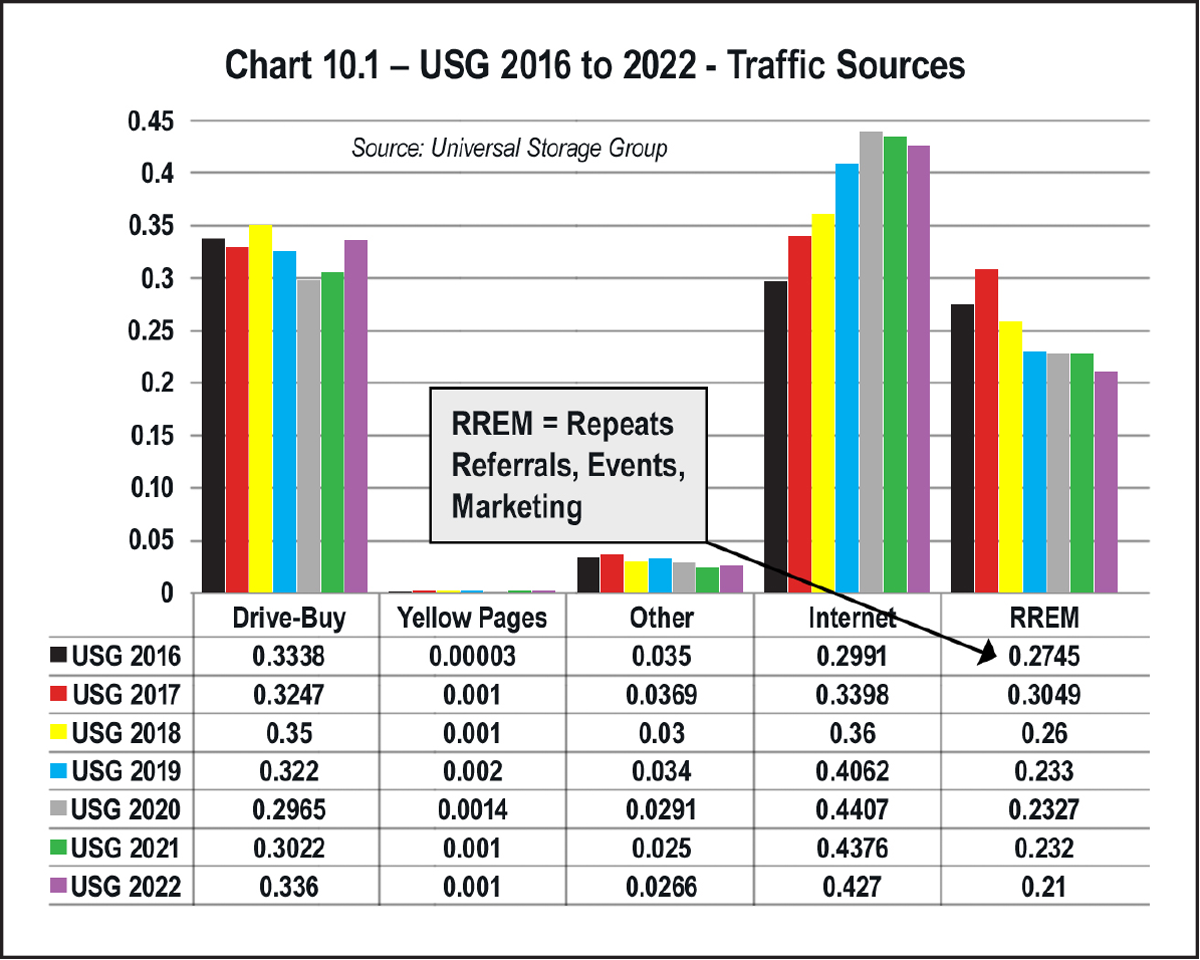
- Customer appreciation week
- Grand opening
- Local media
- Press releases
- Chamber of Commerce
- Business after-hours
- Ribbon cutting
- Yard sale
- Apartment managers drop-in
- Drive-thru haunted house
- Seasonal displays
- Lunch & Learns
- Coffee and donut tours
- Starving artists show
- Car show
- Pumpkin patch
- Green market
- VIP tours and reception
- Wine tasting
- Pet adoption/vaccination events
- Small business presentations
- Blood drive
- Car wash
- Charity event
- Local club(s) meetings
- Community and networking events
Here is the list of those whom you need to visit weekly, doing about 10 to 20 per week, or about two hours per week outside of the office, making quick visits and dropping off some sort of goody to each one along with your referral cards so that you are adding at least 40 to 80 new contacts to your email database each month. Don’t forget to sell to your competitors and share referrals with them when they are full on a particular size and when you have an exclusive size or product type. Groups to target include:
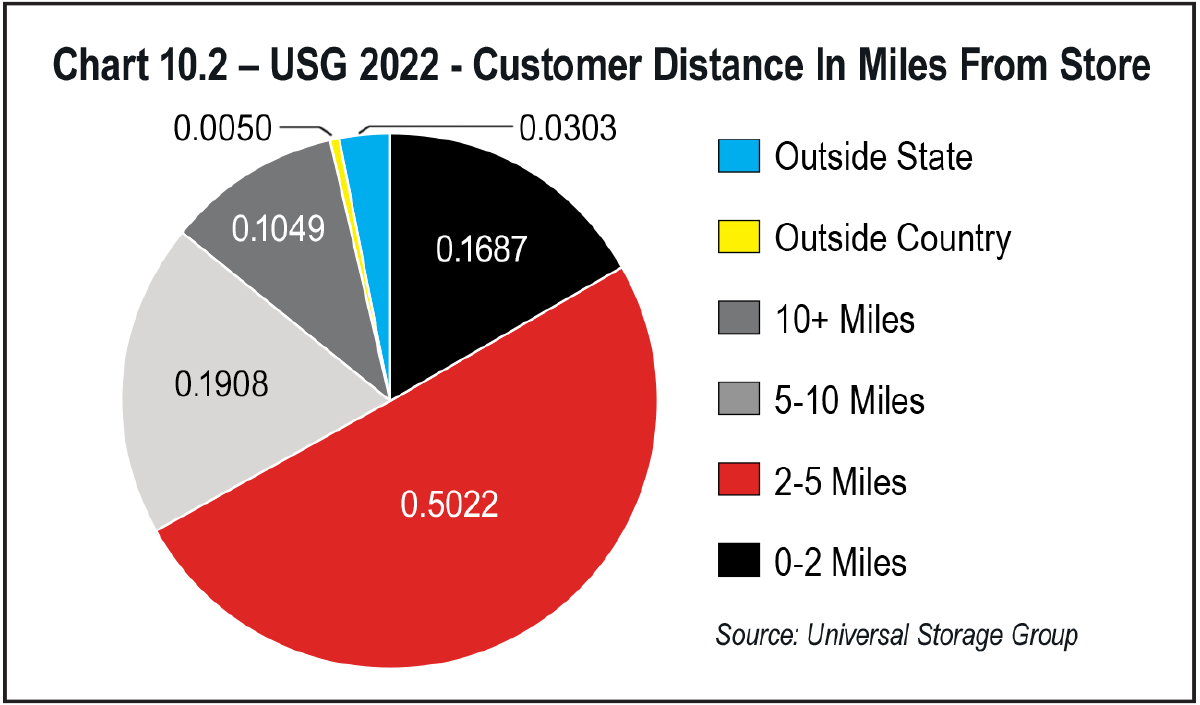
- Apartments, real estate offices, moving companies, building managers, BOMA, IREM, apartment associations, Home Builders Association
- Doctors, dentists, chiropractors, other medical professionals
- Title companies, CPAs, attorneys, banks
- Service businesses, local retailers, interior designers
- Distribution, manufacturers’ reps, truck-based businesses
- Schools, universities, large employers, hospitals
- Chamber members, other club members
- Non-profit organizations, government agencies
- Dealers of RVs, boats, motorcycles, and other motorized vehicles
- Homeowners associations, trailer parks
- Crisis centers, insurance companies, fire and disaster clean-up companies
- Churches and synagogues
Once you have visited each of these, make sure you get a business card and contact from each one. When you get back to your office, make sure to add them to your email database for announcements about your upcoming on-site events or “Business of the Month” program.
Most of us are members of our local chambers of commerce, but how involved are we in the monthly activities and events? When possible, are you attending every possible meeting to exchange business cards, meet new members, and have breakfast with other local businesses? If not, get out there. This is the logical first place to start participating. If your store is new or recently added a new phase or remodeled your office, now is the perfect time to host the chamber’s Business After-Hours and show off your product. Do they have your materials available to hand out to newcomers or those visiting the chamber offices? Make sure they do; and if you pay a referral fee, make sure you express this idea to the staff and leave them plenty of referral cards.
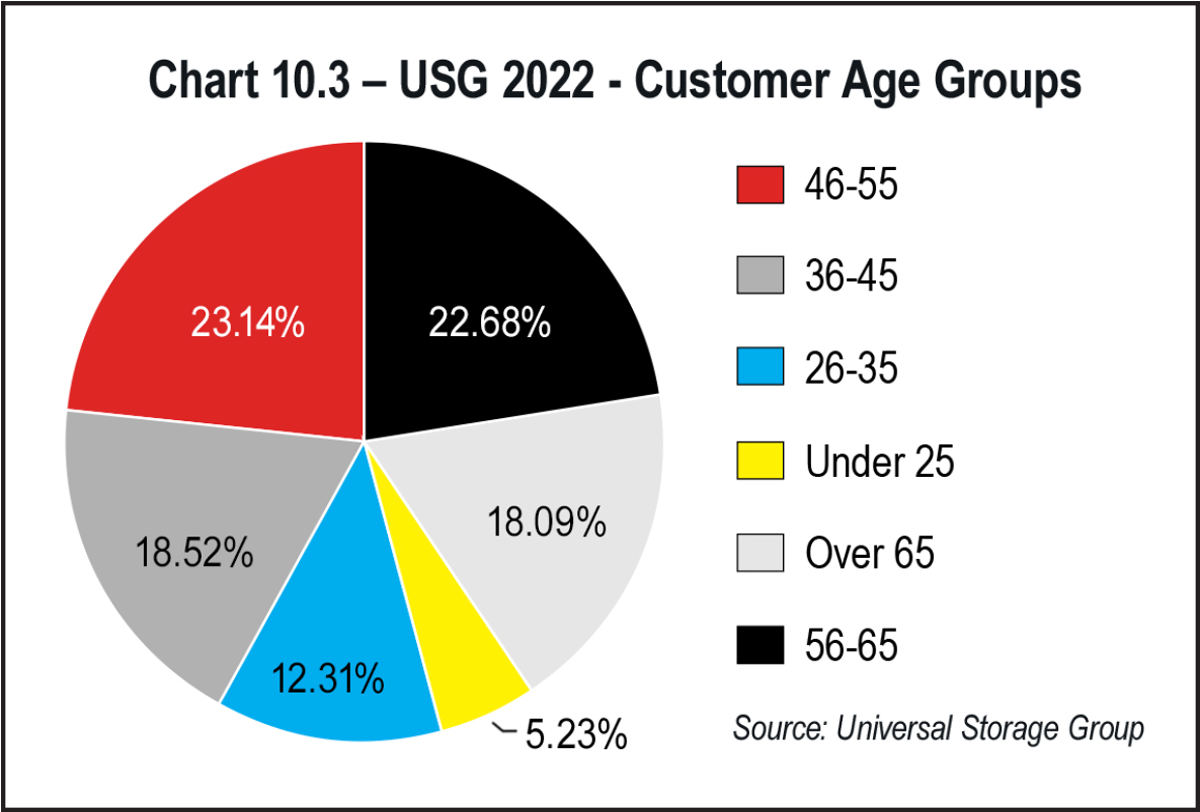
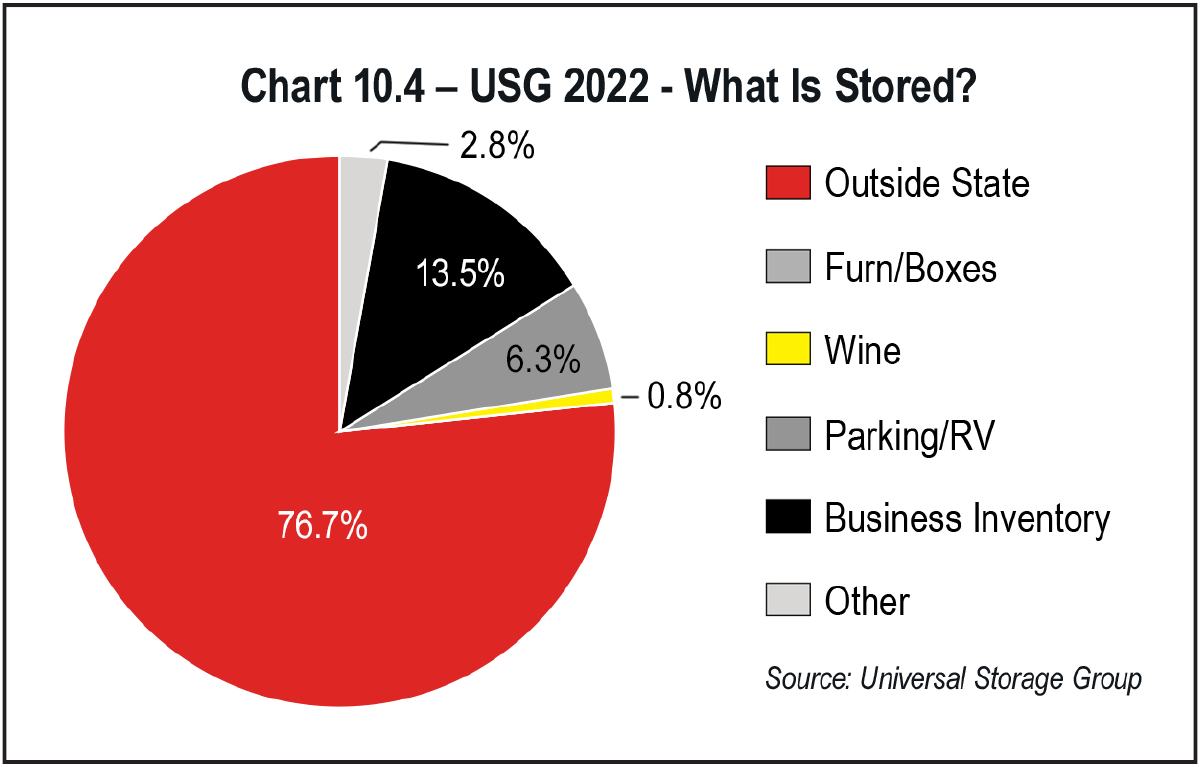
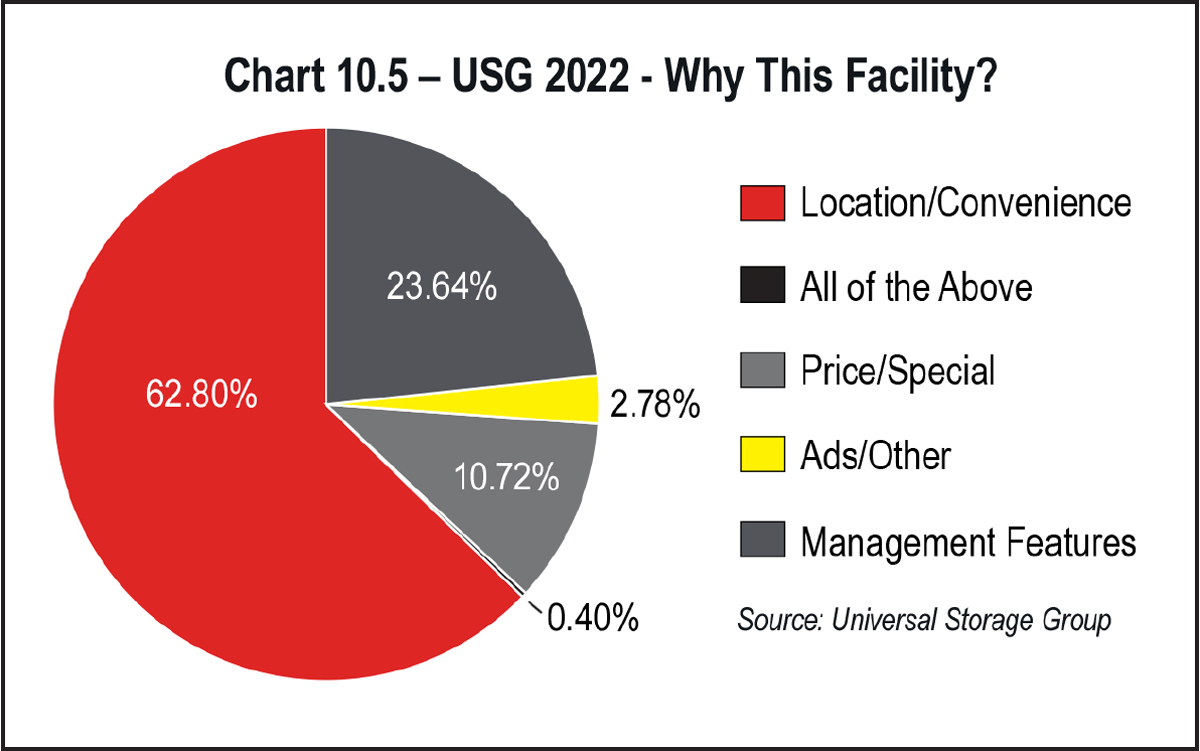
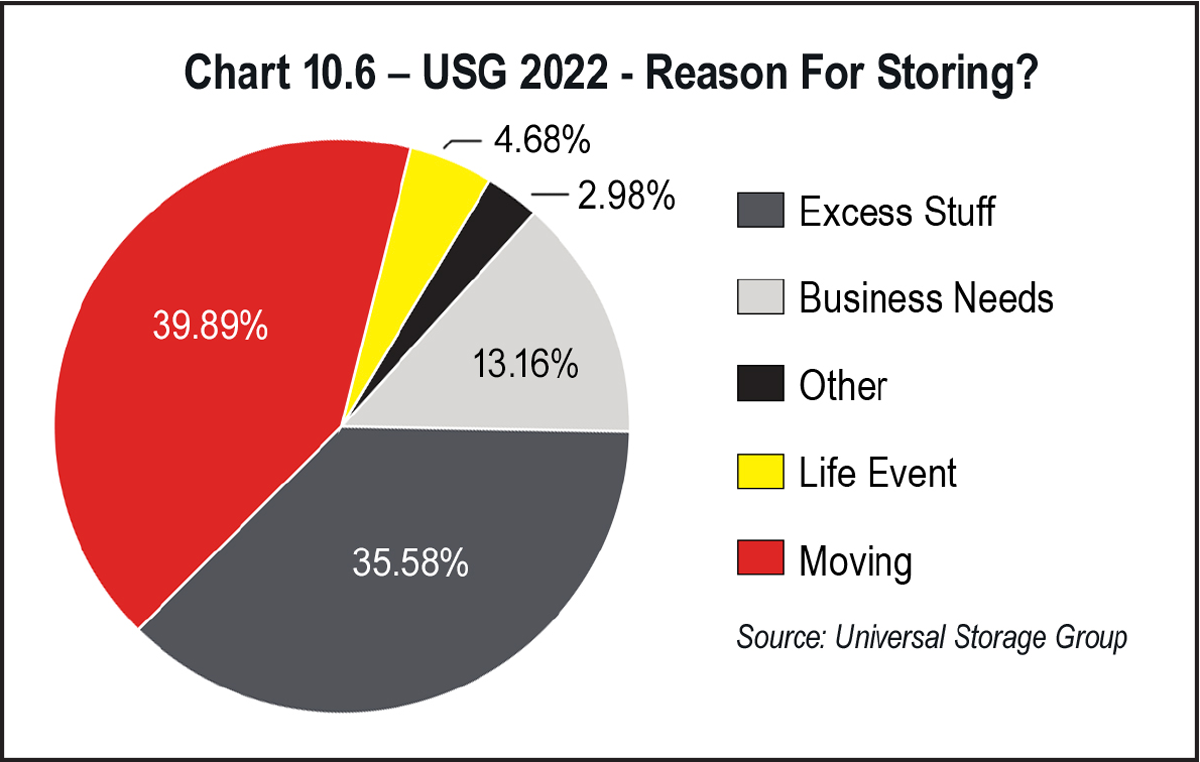
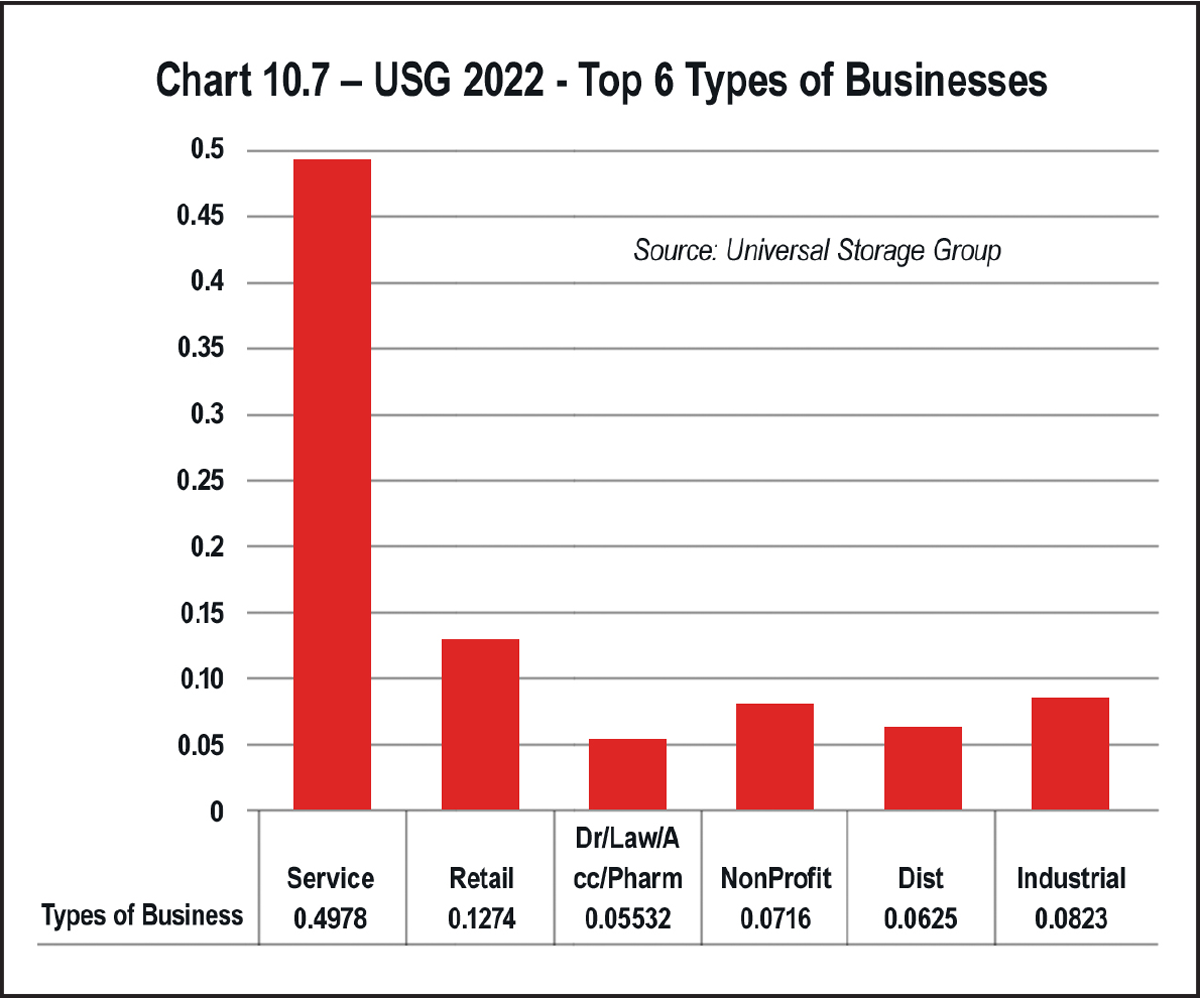
- Having a team focused on sales and customer service
- Knowing the year-to-date numbers
- Gathering marketing and demographic data about each customer at move-in
- Belonging to your local chamber of commerce
- Having an annual budget and income goals
- Setting monthly goals for outgoing calls, personal visits to local businesses, and marketing (send out marketing letters and other mailings/advertisements and emails)
- Having a viable PPC (pay-per-click) website advertising program and budget
- Making sure your software marketing choices match the actual events and programs you currently have in place
USG’s 2022 traffic sources (Chart 10.1) have proven the importance of each section or activity in contributing to the total results. Knowing the various demographics and profiles of customers assists in fine-tuning budgets each year to achieve the lowest possible lease cost but the highest possible amount of new renters.
What age groups is your store attracting? This will vary by location, as those nearest a college or university or military base will vary greatly from USG’s portfolio average shown in Chart 10.3.
Knowing what they store and why they are choosing your location and product is at the very heart of marketing. Without this information, you could be spending money and effort on programs that are not in tune with your customer base. See Chart 10.4.
Chart 10.5 proves that price is not the most important reason customers choose you; it is location and services/management.
Chart 10.6 shows the importance of knowing why they need storage. This should give you ample sources to market to that are involved with moving or small businesses.
Chart 10.7 demonstrates the significance of marketing to small businesses and retailers needing storage solutions.
There should not be a day that goes by that you don’t take some kind of marketing action. Send an email or several hundred, create some clever social media videos to share with your followers, make some outgoing calls to generate visits to the site, mail some letters or postcards to some target groups that need your product, and visit at least one local business on the way to and/or from the bank each day.
Use your digital sign to promote one of your customers or their business in addition to your own specials and the time and temperature. That really keeps the locals looking at your sign. Create an e-newsletter you email to everyone on your contact list from all the cards you gather at meetings and events and to the membership of all the clubs and groups to which you belong. Feature some fundraising news, a special customer or business, and show photographs or videos of how they use your storage property to run their business more efficiently; be sure to include a testimonial or quote. Show the logos of all the groups and associations you belong to as well. Photos, videos, and logos help you build credibility with your audience far beyond what thousands of words can do.
Just get out there weekly and spread the word; it is easy, costs very little, and produces big benefits for you and your store.
These are samples of USG’s neighborhood board with built in business card and brochure holders. These help the facilities USG manages showcase their community marketing efforts and the contacts they have made during their visits each week to local businesses. Customers love when managers can provide them a business card of a local supplier that they are interested in using. The businesses love it since it is free advertising for them.

he self-storage industry continues to evolve rapidly as more storage operators and vendors enter the market. According to a report from Mordor Intelligence, the estimated value of the global self-storage market was around $48 billion in 2020. The estimated value of the market in 2027 is $64.7 billion1.
The growing market size allows us to rethink how we approach critical aspects of self-storage operations, including security hardware, software, and processes. Having only padlocks, fences, and managers nearby is not an adequate security strategy any longer. As storage enterprises have grown and customer expectations have changed, storage operators must think beyond their site’s perimeters when devising a security strategy. Investing in equipment that provides layers of security and numerous fail-safes is critical for any self-storage operation. Some opportunities for adding layers of security include:
- Incorporating keypads at access points to enter buildings or restricted areas, such as boat and RV parking areas near their unit.
- Zone control – Leveraging an access control-enabled elevator or door so tenants can only access the areas near their units.
- Adding motion-sensitive lights and high-resolution cameras to the hallways.
- Offering door alarms and electronic smart locks for individual, unit-level security.
- Offering to equip high-value items like boats and RVs with motion-sensitive alarms.
Technologies that enable self-storage owners to implement a layered security approach include motion detection, electronic smart locks, and even AI-enabled video surveillance. There are many hardware and software components available to self-storage owners and operators; it can be hard to determine what security solutions work best for your operation when there are so many options available.
As you evaluate the security solutions available, you need to have a security strategy in mind. You should also consider your budget constraints, seeking to maximize your return on investment, and the competitive landscape around you. Security is a top-of-mind concern for your tenants; you don’t want to be seen as the storage option with the lowest degree of security compared to your competitors. Below are some additional questions to consider as you devise your security strategy.
- Do you want remote monitoring capabilities for your operation?
- How will you notify your employees and tenants of potential security breaches?
- How do you want your security strategy to influence the customer experience?
- Will you have employees on site?
- Will you offer after-hours access to your tenants?
- What access control processes do you plan to automate?
- How automated do you wish your facility to be?
- What are the expectations of your tenants, or what do competitive facilities offer their tenants?
Answering these questions will help you determine your security strategy. Once you know the goals of your security strategy you can evaluate the vendors available to you. Locating a security vendor and integrator with years of experience in the industry is crucial as you position your self-storage operation for long-term success, because an experienced vendor knows the industry and how to tailor the security strategy to fit your operation’s needs. Security vendors should not take a one-size-fits-all approach to implementing their products. Each storage operation is different.
Even if the security providers have the technical ability to install the equipment, you should consider the overall value-add experience when selecting your provider. Here are a few factors to consider when choosing your security provider:
-
Shared goals – Does the integrator listen to your security concerns and align with your goals regarding site security?
-
Industry experience – Does the vendor have ample experience in the self-storage industry?
-
On-going relationship – Will the integrator install security components and then disappear? Have they ensured the system runs well?
-
Ready to Scale – Has the individual set the system up so that there is room to scale as your business grows?
-
Integrable systems – Does the vendor only install specific security components, or do they offer a complete security system? Does the access control software integrate with your property management software?
-
Industry standard credentials – Does the integrator have the appropriate training and certifications Do they follow industry-standard protocols, or are some of their certificates outdated?
After you have determined your security strategy and selected a trusted vendor, you must evaluate the security components your site needs.
After you have determined your security strategy and selected a trusted vendor, you must evaluate the security components your site needs. Consider how the parts function individually and as a comprehensive system. The components you choose should all work together to ensure your operation functions optimally and provides an excellent experience for you and your tenants.
Secure The Perimeter
The gates and fences of a self-storage facility make up the first layer of security. You want to create a secure border. Broken fences and gates make your facility vulnerable to vandalism, break-ins, and disgruntled former tenants who could easily access the property unbeknownst to you.
In addition to discussing the different materials and types of gates and fencing available, you will want to consult an expert to ensure that your gate operator fits your operation’s needs. There are several gate types, including slide gates, vertical gates, swing gates, and pivot gates. You’ll want to consider your tenants’ needs and expectations when selecting the gate type. For instance, a site housing boats and RVs likely needs a different gate solution than a non-specialty storage site because maneuvering these high-value vehicles can be particularly challenging. You want to minimize the risk of damaging the gate and the vehicle when tenants enter the storage area. Typical weather patterns at your location may also influence your decision. Again, it is important to consult experts in the industry as you evaluate your options.
Access Control
The next line of defense is your site’s access control system. This system needs to quickly let paying tenants in the site and keep delinquent tenants and other unauthorized individuals out of it. Having a strong access control system is a crucial element of your security strategy and broader operations strategy.
- Keypads: Keypads should be top of mind when you think of access control. You should place keypads at all entry and exit points in your facility. It is also wise to put a keypad on every floor of a multistory facility. If you offer specialty storage options like boat and RV storage, putting a keypad at the entrance of the specialty storage area is recommended. With recent technological advancements, there are more options available than the standard numeric keypad. Integrating numeric keypads with Bluetooth technology creates a simple but secure way for tenants to enter your property. Encouraging tenants to create longer PIN codes than the minimum of four digits also enhances your security protocols.
- Cloud-based software: Moving your facility from desktop-based to cloud-based access control software will also enhance your site’s security. Cloud-based software is built to scale in ways its desktop counterpart cannot support. For example, cloud-based software can integrate with your property management software and unit security devices to automate the overlocking process, saving your operation valuable time. You can monitor the site remotely and get real-time notifications for any security event. Moreover, cloud-based software gives you access to a wealth of reports and analytics that can help you improve your operation. Even if the internet fails, a site controller with cloud-based software capabilities will allow you to perform some actions offline so your business doesn’t come to a screeching halt. We will cover the analytics and access control capabilities more in-depth later in this section.
- Mobile access: Mobile access apps are now a standard feature in leading self-storage facilities. PTI has seen this type of app usage grow an average of 168 percent every year since launching its first version in 2017 (see Chart 11.1). Equipped with an integrated mobile app, authorized tenants can access areas of the property without using a code, key fob, or swipe card. Mobile apps also enable digital key sharing, where a tenant can give a friend a one-time encrypted key to their unit. Of course, site managers can deny the key share if they suspect foul play. Bluetooth technology also enhances the mobile access solution by opening the access points within a certain radius. You don’t have to worry about tenants opening their units when they aren’t on the property. Site managers can also use an operator-facing mobile app like StorLogix Mobile to monitor gate access and check critical reports. Incorporating a mobile app into your access control strategy increases your operation’s security and elevates your customer experience.
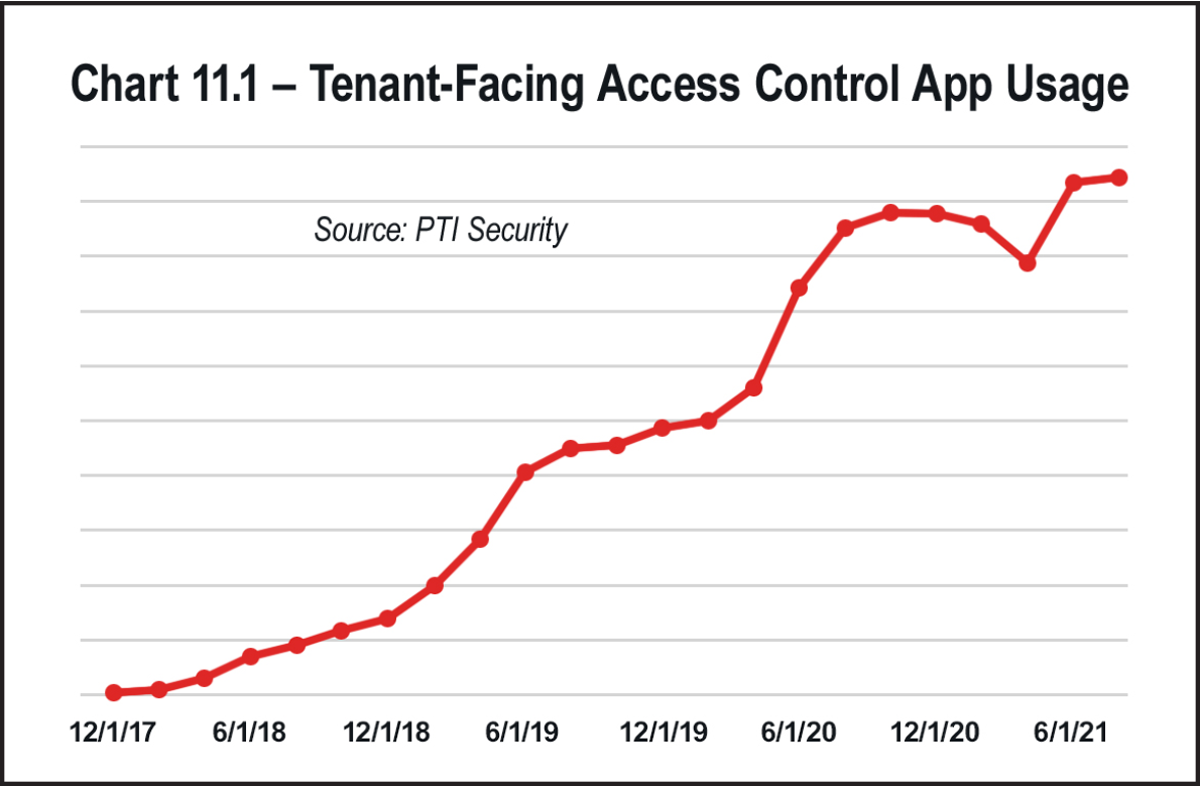
In addition to gates, fences, and an access control system, video surveillance should be a part of your security strategy. Not only do the cameras provide visibility across your property, but they also act as a deterrent to crime. Placing cameras around the perimeter of your property and throughout the corridors will help you track the activity on your site and reassure tenants that their valuables are secure.
You can also employ AI-assisted video cameras. The software can automatically alert operators of security concerns (like detecting movement in restricted areas). Some AI-enabled software can even notify the police if needed. Pinhole cameras at various entry points are another option. Moreover, many aspects of video surveillance can be automated; you may also choose to outsource your video monitoring. You don’t need to hire someone to watch the cameras all day to have a secure site. Placing lights near the cameras will provide a clear picture of site activity as well. Bad actors naturally want to avoid well-lit areas. Additionally, having good lighting and cameras is critical for tenants who have permission to access the facility after hours. If tenants wish to retrieve their RVs before sunrise, they expect to feel safe during their visit. Think critically about where you need to place lights and cameras to prevent crime and reassure tenants of their safety.
It may be tempting to skimp on the cameras or not prioritize fixing them when they break in the hope that the visual of the camera is enough to deter crime. However, crime attempts are inevitable at any facility, regardless of how much you invest in your security strategy. Select high-resolution cameras that clearly identify people and license plates, so you can quickly resolve security incidents.
Unit Security
Another layer of your security strategy must include unit-level security. The simple door and padlock combination is easy to bypass. Remember, security is a primary concern for your tenants. Knowing that you provide more unit-security measures than the standard padlock will give your customers peace of mind that no one will steal or damage their valuables.
Smart Locks
Electronic smart locks are an excellent unit security solution. Some examples of electronic smart locks include electronic overlocks and Bluetooth-enabled padlocks. The overlocks can sync with your access control software to engage the moment tenants are late paying their bills. It can also alert management if the lock gets damaged. Moreover, Bluetooth padlocks leverage smartphones and mobile apps to access the unit, eliminating the need to carry a physical key or remember a PIN. In the near future, the biometric ID technology we are accustomed to using to access smartphones will enter the self-storage market. Biometric-enabled locks are already present in the wine storage market.
Portable locks (typically padlocks) have remained a constant in self-storage and are often used for operators who need a solution that can be moved from unit to unit. Historically, these locks are used for overlocking units for tenants who are late in payment or for those existing facilities where running wires could be cost prohibitive and/or have traditional latches on doors of the facility. Today’s portable locks, like PTI’s Helox Smart Padlock, are more advanced and provide operators the ability to do contactless rentals through cloud-based access control as well as a more pleasant tenant experience that leverages Bluetooth connectivity, which is rapidly becoming an expectation of tenants.
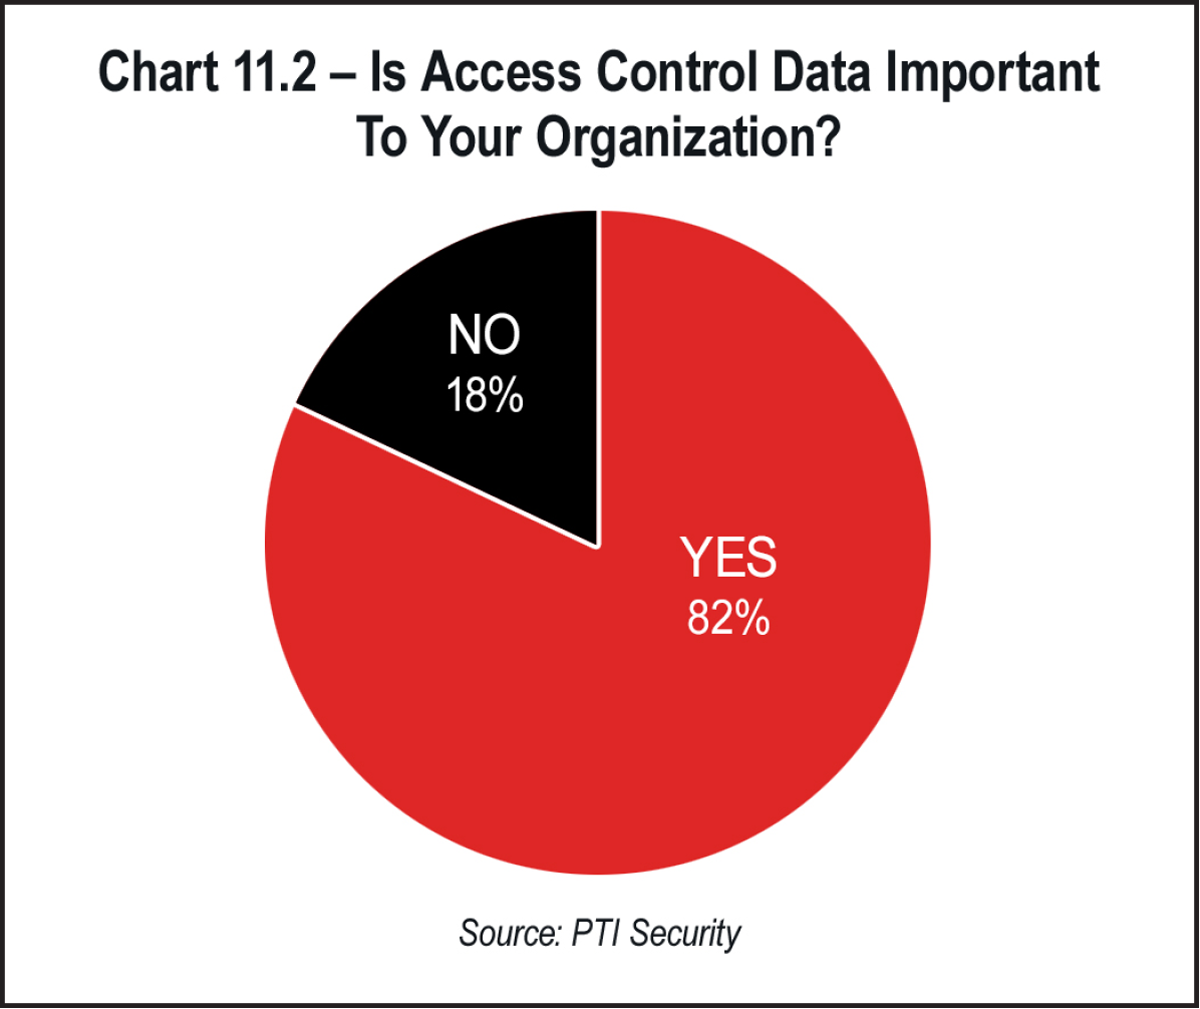
Door Alarms
Door alarms are another aspect of unit security to consider. Just like electronic smart locks, door alarms can communicate with your access control software so you can know of the security threat instantly. Syncing the alarm with lights and sirens will also deter intruders and alert you to the threat in the office or be paired with sirens/lights/etc. to scare off intruders and alert anyone in the area.
In-Unit Monitors
Theft is a problem for any self-storage operator, but it can be partially, if not completely, mitigated by combining the aforementioned security solutions with an in-unit monitor such as StorageDefender. Such monitoring typically provides both operators and tenants activity alerts sent directly to the owners’ smart devices whenever any activity is detected in the unit. While this additional layer of security may not be for every facility, operators should know it is an option that can typically be an additional source of revenues for tenants who demand additional security.
As self-storage operations grow, owner-operators must consider how to monitor their security systems to drive business decisions. Advanced access control software and controllers, such as PTI’s next-gen CloudController and StorLogix Cloud platform, should be able to represent key performance indicators visually and generate customized reports so self-storage owner-operators can make effective business decisions without getting overwhelmed by all the data available to them. Then, they can analyze the data to identify the strengths and weaknesses of their operations, moving them to take actions that will ultimately drive revenue and enhance operational efficiencies.
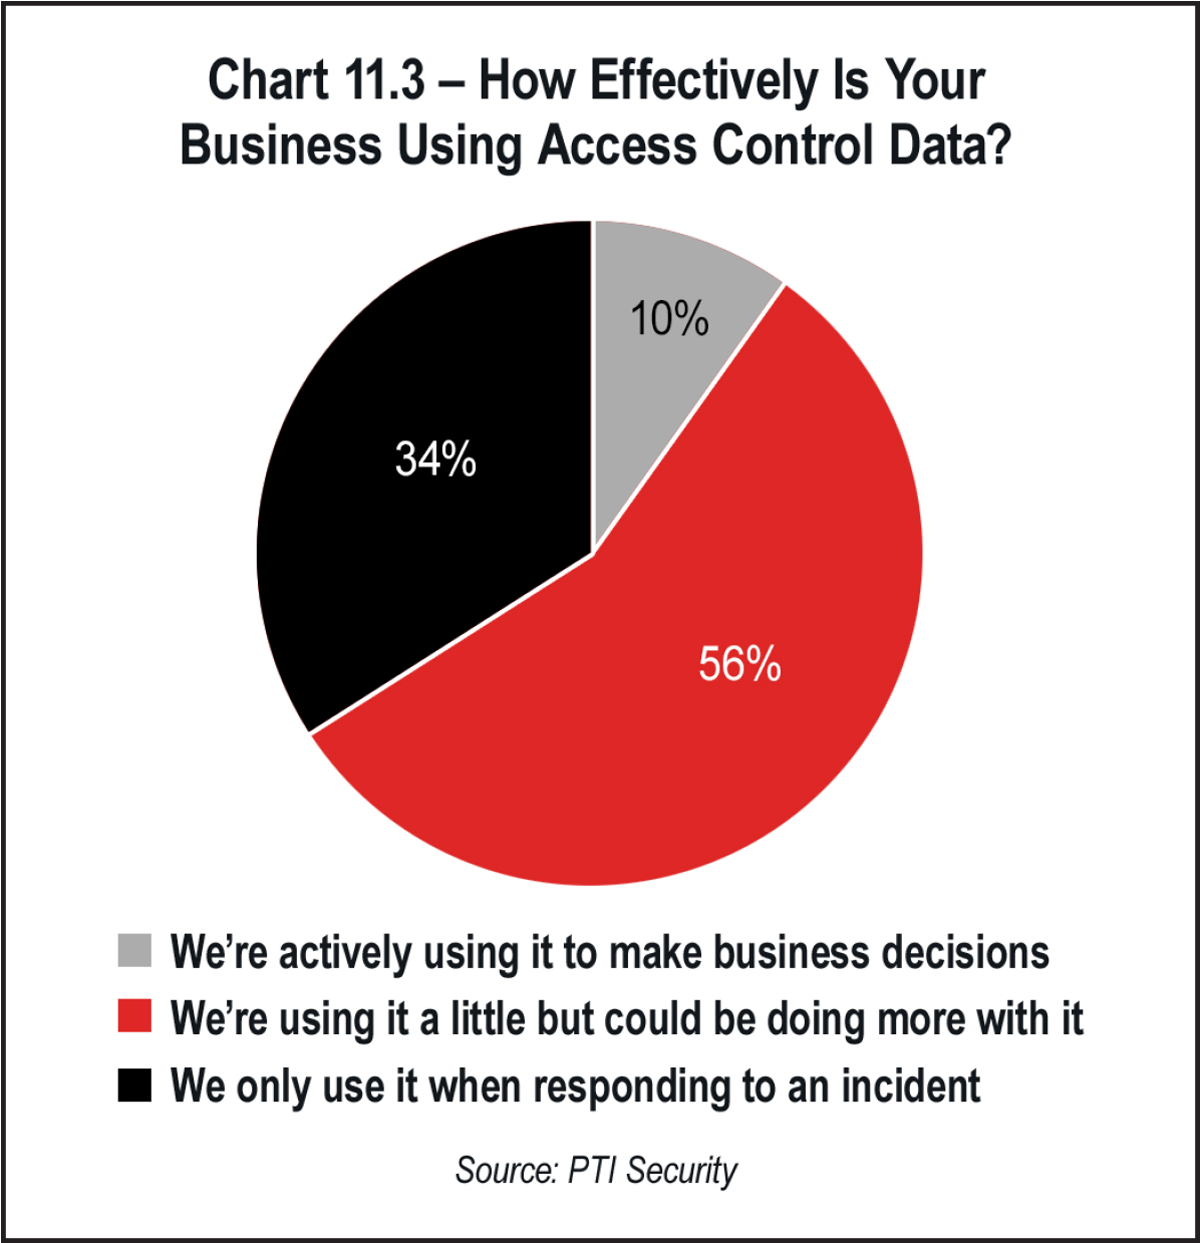
PTI’s StorLogix Cloud access control software and CloudController work together to enable the following2:
- An Aggregated Dashboard
- Access at-a-glance intel on site activity and security equipment statues.
- Portfolio-wide visibility allows you to access this data from anywhere for all your facilities.
- Geographic site mapping visually represents the security health of all your facilities.
- Fully customizable reports help you track the KPIs that matter to your business.
- Complete Accessway Control
- Remotely control your site’s accessways and doors with one click.
- Open, lockdown, or hold open access points so you can respond to emergencies quickly.
- Fully Customizable Notifications
- Identify the notifications you want to receive without getting bogged down by the notifications you don’t need.
- Receive the notifications in the way that works best for you and your team, whether it is via text, email, browser, or push notifications.
- Receive all notifications in real time so you never miss a potential security incident.
- Leverage the notification data to generate granular reports and make better business decisions.
- Integration with other security products
- Mobile access solutions
- Unit security devices
- Property management software
Security technologies such as the CloudController and StorLogix Cloud will continue to advance the analytics capabilities and access control integrations in the future.
In summary, every security decision you make should align with your broader business and operations goals. Know how these security decisions provide value to your company. Remember to consider these questions as you determine the vision for your business:
- How does automation fit into your business vision and security strategy?
- How do you want to position your facility relative to your competition?
- How do you plan to track and analyze data to make better business decisions?
- What are your plans for growth in the next few years? Are the systems you’re putting in place today ready to scale?
Knowing the vision for your business and designing a security strategy that achieves this vision will drive success for your self-storage operation.
1 Mordor Intelligence. (2022). Self storage market trends, growth & industry analysis: 2022-2027 https://www.mordorintelligence.com/industry-reports/self-storage-market
2 Williams, M. (2022, October 10). Next-gen cloudcontroller improves self-storage security. PTI Security Systems. https://ptisecurity.com/next-gen-cloudcontroller-improves-self-storage-security/
he RV/boat storage sector has come into the spotlight in recent years, as investors and traditional self-storage owners have been on the lookout for the next self-storage. Indeed, the sector has many of the same characteristics that have made self-storage attractive for years: a highly fragmented industry with low operating costs and high margins, strong and growing demand with limited supply, and high potential for income growth. Investor interest in the emerging niche asset class has led to increased transaction volume and pricing in recent years, while development, although picking up, has failed to keep pace with the increased demand for parking.
RV/boat storage is viewed as a subsector of the self-storage property type, as many traditional self-storage properties include parking spaces for RVs and boats, as well as commercial and personal vehicles. However, many of these properties lack the amenities and services that are in demand from the modern RV/boat owner. While some new supply in recent years has aimed to suit these needs, there does seem to be a supply and demand imbalance that presents a unique opportunity for investment and consolidation in the sector. Success investing and operating in RV/boat storage will rely on intimate market and trade area knowledge, as well as insight into the unique characteristics of the property type.
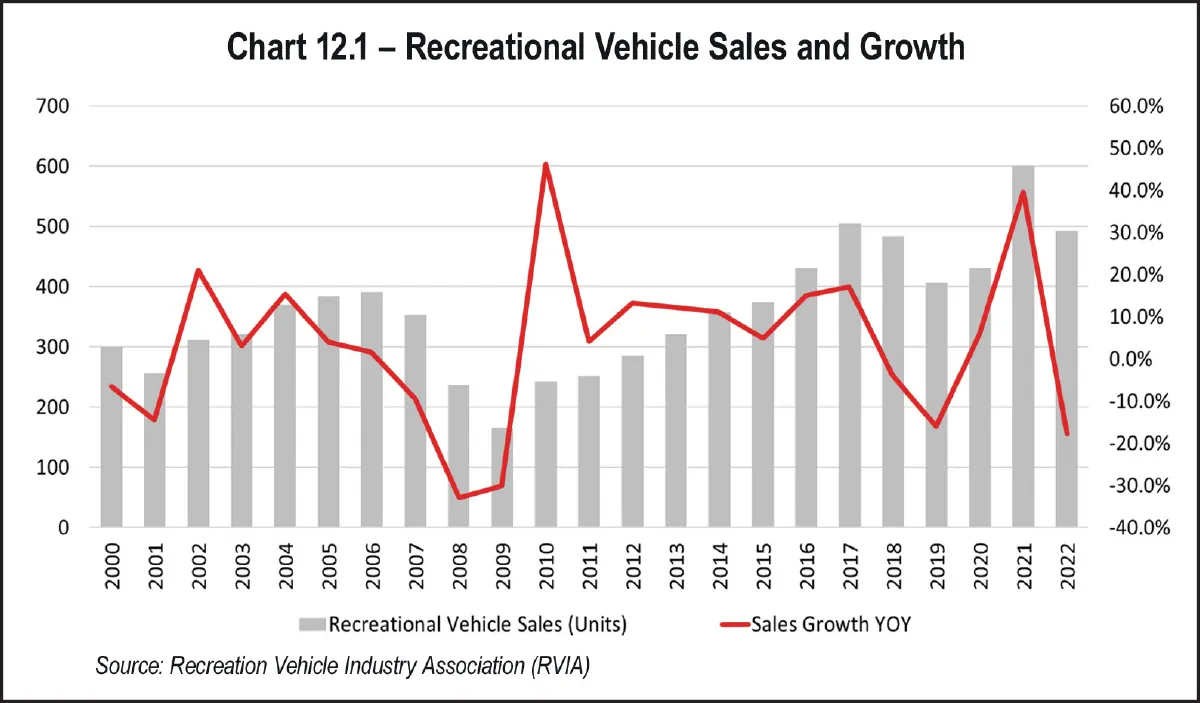
At the same time, development of RV/boat storage facilities has failed to keep up with demand due to unique supply constraints, including the amount of land needed to develop a facility, the cost of construction, and difficulty getting through the entitlement process. Yardi Matrix tracks 1,380 dedicated RV/boat storage properties in 42 states. Although RV registrations increased 22 percent from 2017 to 2021, the number of RV/boat storage facilities only increased 9.8 percent during this period. And although supply picked up in 2022, annual deliveries as a percent of stock has only averaged 2.6 percent for the last five years, below the average going back to 2000 and well below the average for traditional self-storage properties of 4 perent supply delivered annually.
These supply and demand characteristics, and an overlap with self-storage, have drawn attention to the property type in recent years; transaction volume and pricing have soared in response. According to Yardi Matrix data, there was a record 114 RV/boat storage sales in 2022, and 103 in 2021, compared to an average of 42 sales per year from 2015 to 2020. The average sales price for RV/boat storage properties has risen to close to $1 million per acre in 2022 and 2023, compared to $428,000 per acre from 2015 through 2020. Much of the increase in volume and pricing recently has been from large owners/operators, who are mostly new entrants to the sector, aiming to build a national brand. Still, 88 percent of properties are owned by an individual or entity with a single property. This means the sector is ripe for consolidation and large investors and operators can take advantage of economies of scale and operational expertise. See Chart 12.2 below.
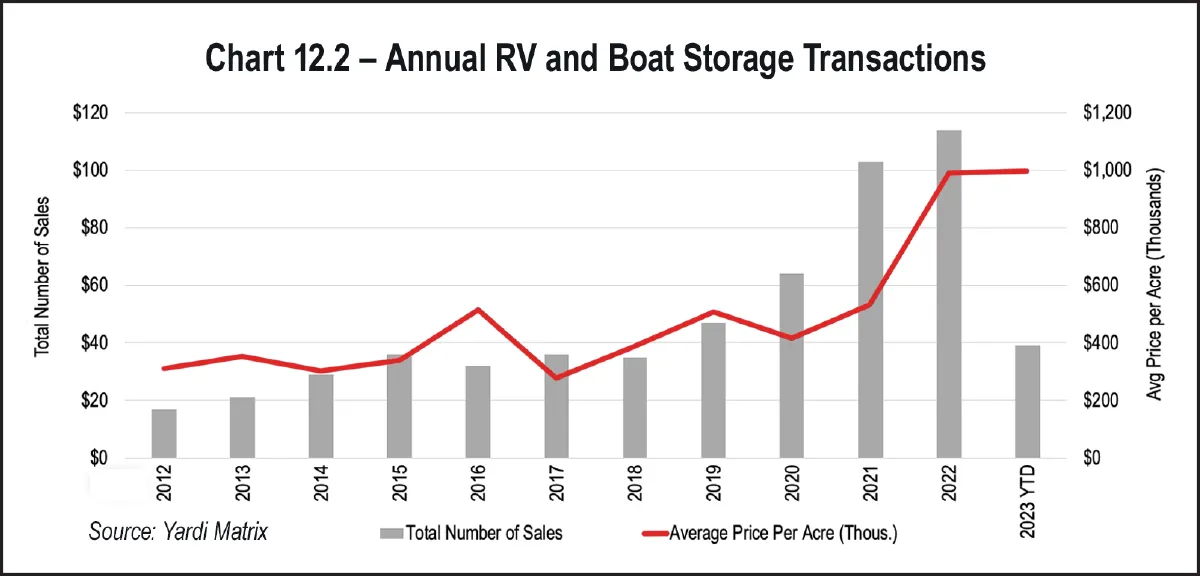
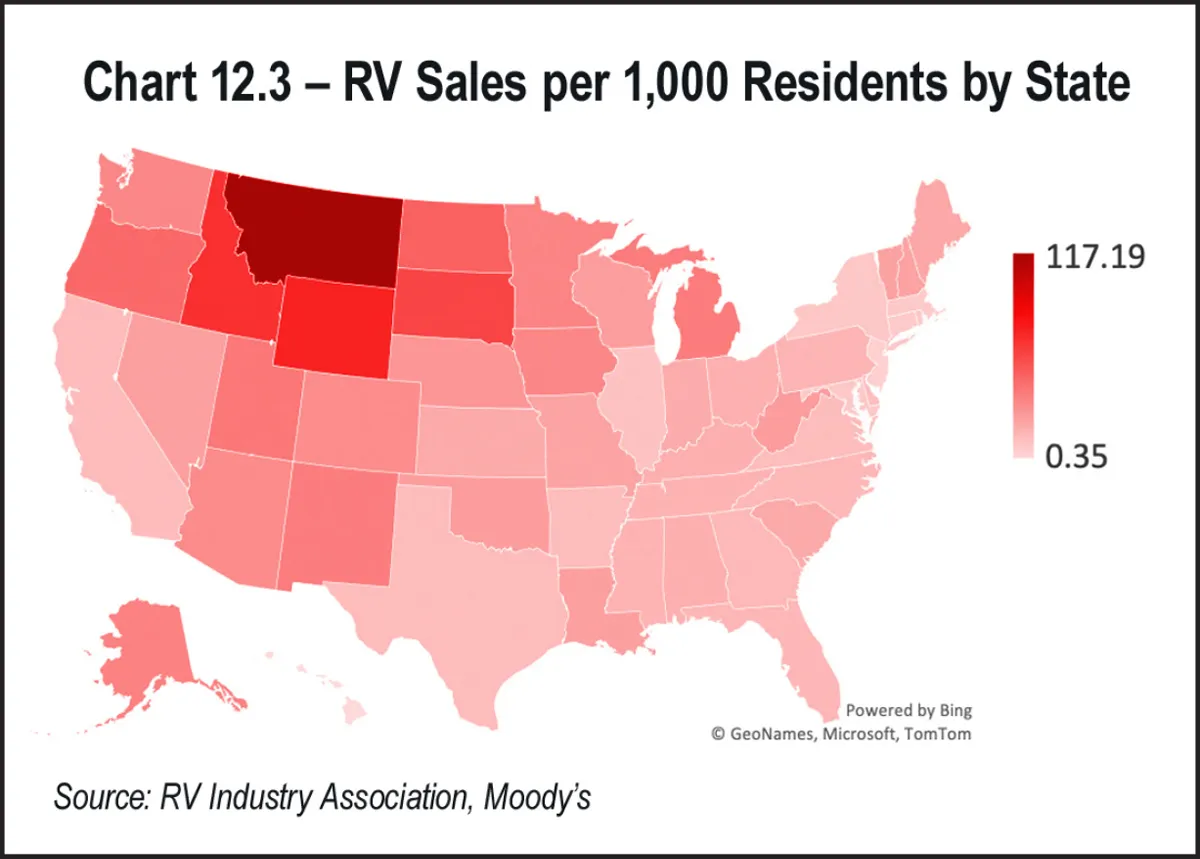
On the supply side, calculating RV/boat storage supply can be challenging since most RV/boat storage properties have very little, if any, enclosed parking space that shows up in property records. Of the dedicated RV/boat storage properties in Yardi Matrix’s database, only about half include enclosed parking spaces; a vast majority have mostly uncovered parking spaces. Additionally, many traditional self-storage properties include parking, which can make up a very small or very large portion of their rentable area. Data from a large self-storage operator shows that half of their properties include some parking for rent, averaging 4,844 net rentable square feet of parking at those properties. However, at a property level, parking net rentable square feet ranges from 100 square feet to over 200,000 net rentable square feet of parking. This makes sizing the overall market or calculating saturation for parking (i.e. parking spaces per household or rentable square footage per capita) extremely difficult to do.
Using this methodology, the top markets for total square footage and parking saturation per capita are shown in Table 12.1 below. Dallas and Houston have the most net rentable parking square footage nationally with 19.1 million and 17.7 million square feet, respectively, distantly followed by Denver, Atlanta, and Phoenix. A few smaller markets have very minimal parking space, including Lafayette, Ind.; Honolulu, Hawaii; and Scranton, Pa., all with less than 100,000 net rentable square feet. Applying market population estimates, it seems smaller Texas and Sunbelt metros and Denver have the highest square footage per capita (all over three square feet per person), while New York, Philadelphia, and Baltimore are on the list of markets with the lowest parking saturation (under 0.25 square feet per person). This provides some context for rent levels, which are highest in some of the markets with the least supply, like Honolulu, Baltimore, and New York.
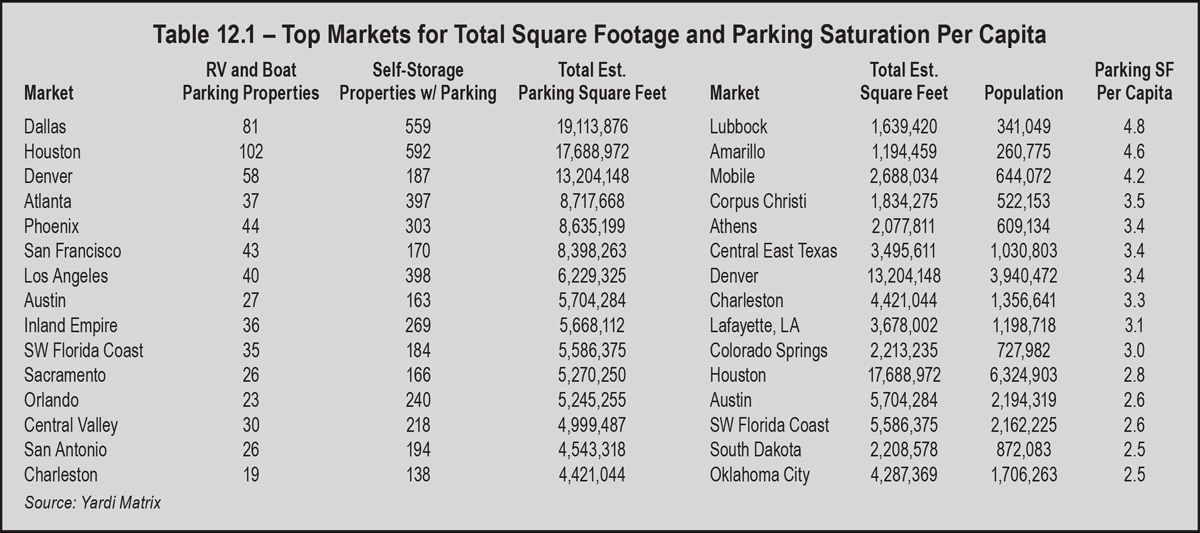
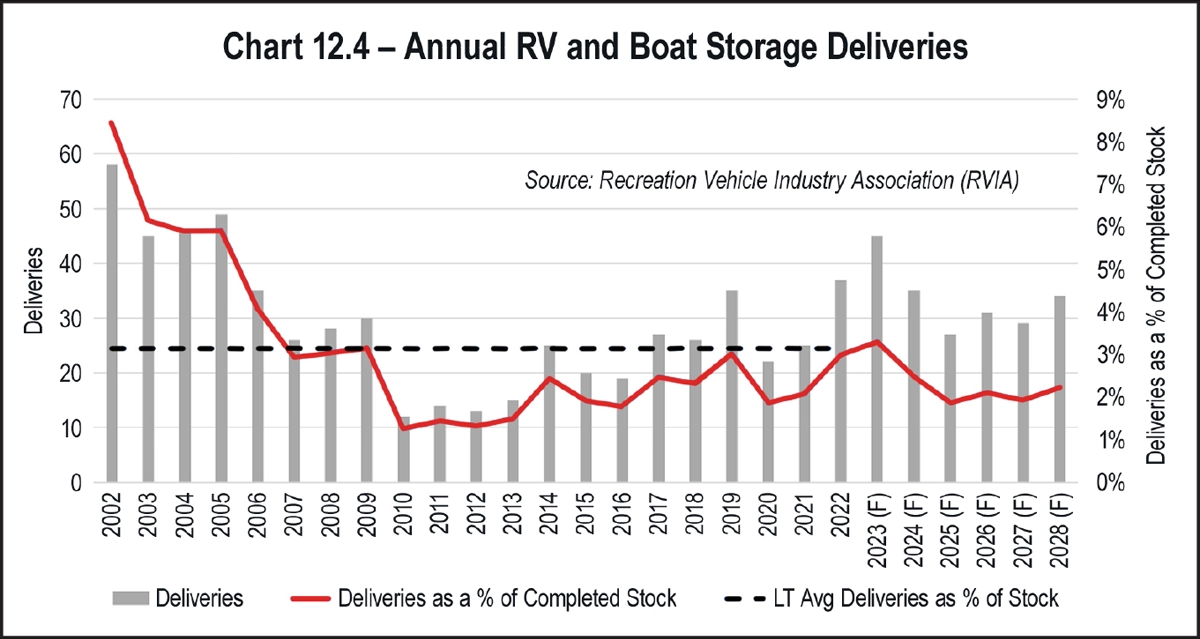
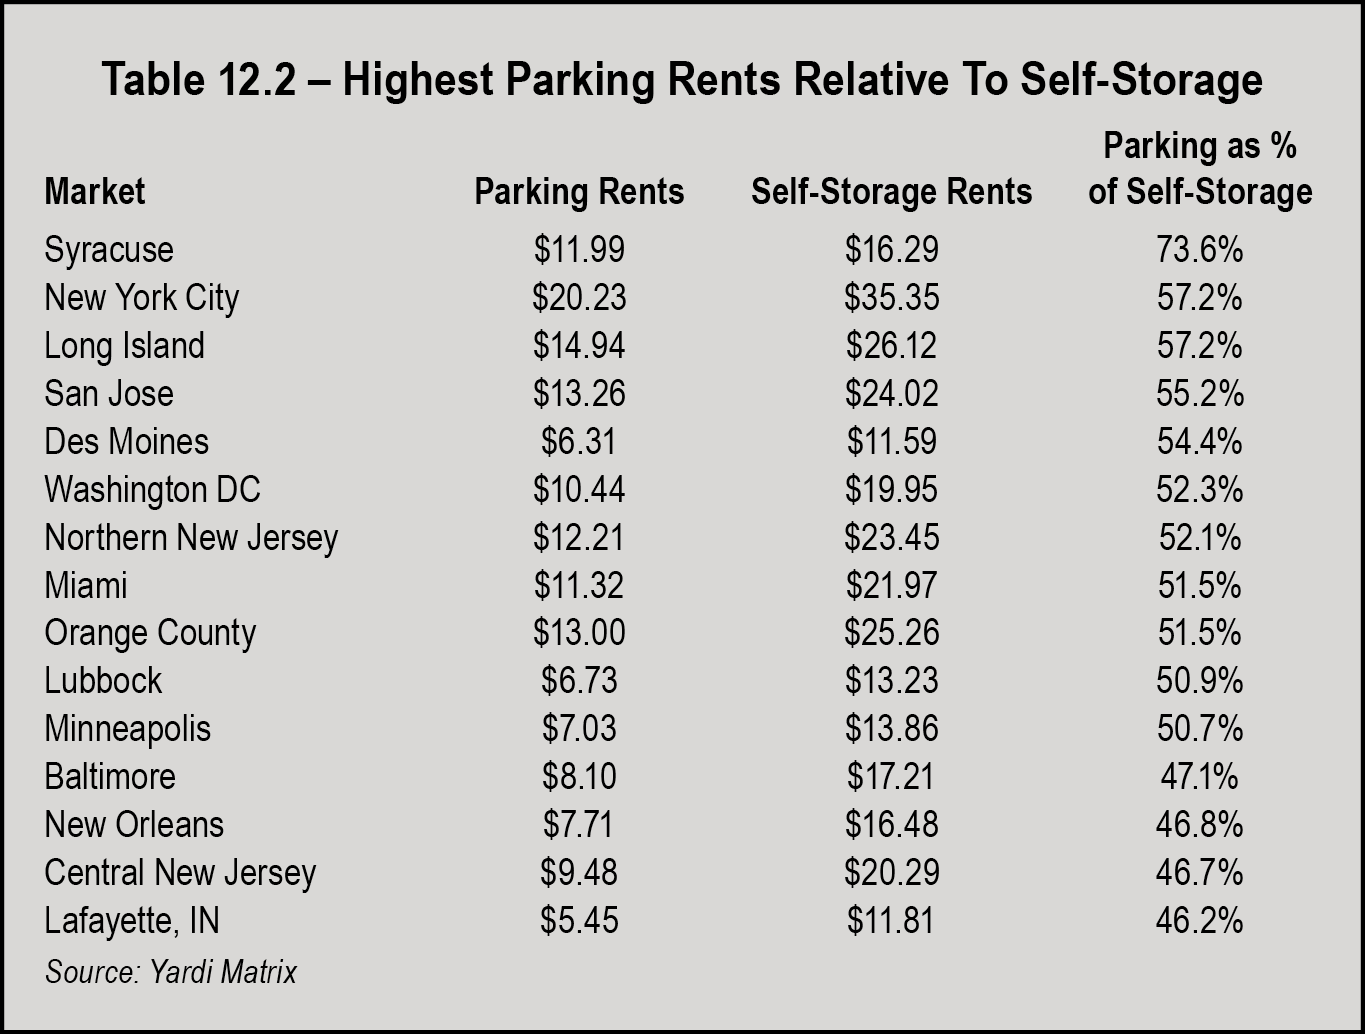
Since 2018, three markets have had their first and only RV/boat storage property deliver, while some high-growth markets (like Boise, Huntsville, and Nashville) have seen multiple stores deliver, more than doubling their store count. Again, Dallas has had the most new supply, with 24 properties built since 2018, followed by Southwest Florida Coast and Phoenix with 10 new RV/boat properties each. Much of the new supply built recently is higher quality product, better suited for the needs of the modern RV owner. Over 75 percent of properties built since 2018 are paved, versus 53 percent of properties built before 2018. Nearly 50 percent of properties built since 2018 have covered parking spaces, versus only 27 percent of properties built prior to 2018. And 29 percent of properties built since 2018 have a dump station, one of the most in-demand amenities, versus only 16 percent of properties built before 2018. All of these data points suggest that much of the RV/boat storage nationally is underimproved and there is a vast opportunity for new supply to offer modern amenities. Additionally, there are many older properties that would benefit from renovations and the addition of some of the amenities that are in-demand today, like a dump station, air and water station, and washing bays.
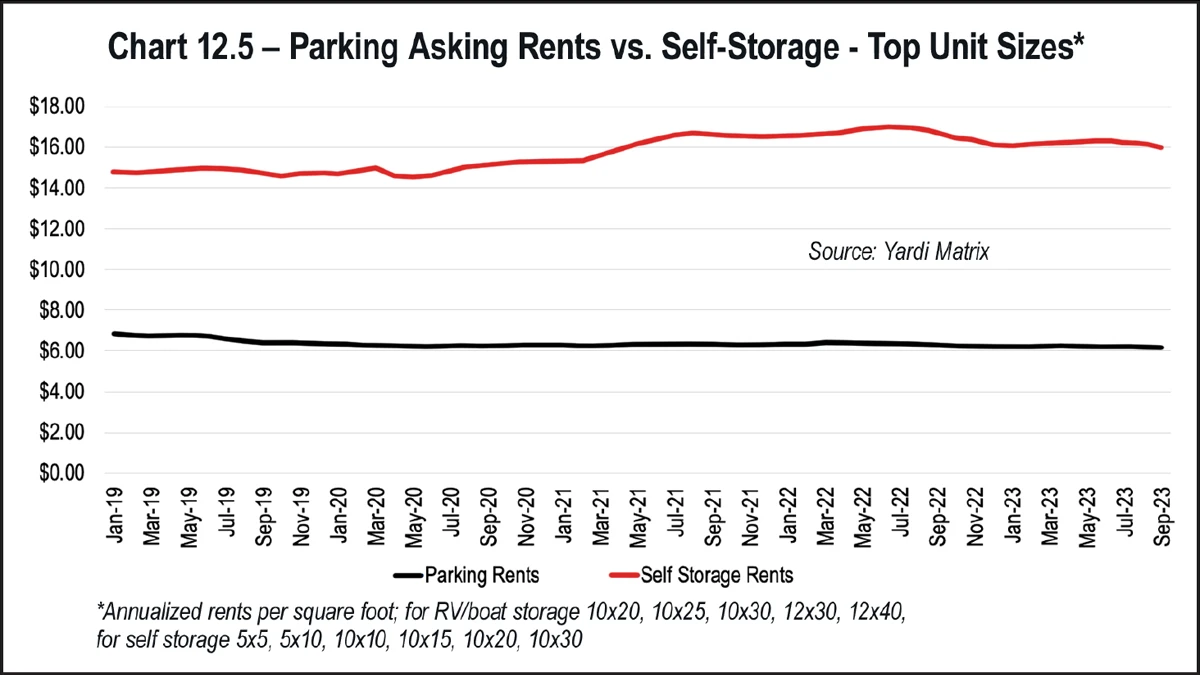
At a market level, the difference in parking rents versus traditional self-storage can be much lower or higher depending on local supply and demand factors. Table 12.2 below shows the markets with the highest parking rents relative to traditional self-storage. Parking rates are usually highest versus traditional self-storage in markets with limited parking supply, places like New York, San Jose, Miami, and Orange County. Other markets, like Des Moines, Lubbock, Minneapolis, and Lafayette, have relatively low self-storage rates and/or low levels of supply and solid demand.
Rents for parking have drifted down over the past several years, partly the result of greater dedicated RV/boat storage coverage. Parking rents also did not experience the same dramatic increase during COVID that self-storage did when the sector was benefitting from surging demand from record-high migration. However, recently same-store rent growth for parking spaces has not experienced the same widespread declines that self-storage has experienced; instead, it’s been more flat and steady, catching the attention of developers and investors. Parking rent growth has outpaced traditional self-storage since September 2022. As of September 2023, parking rents were down 0.8 percent year-over-year versus -4.2 percent for self-storage. Parking rents have actually increased in a number of markets, including many smaller markets and in New York and Charlotte. See Chart 12.6 on page 126.
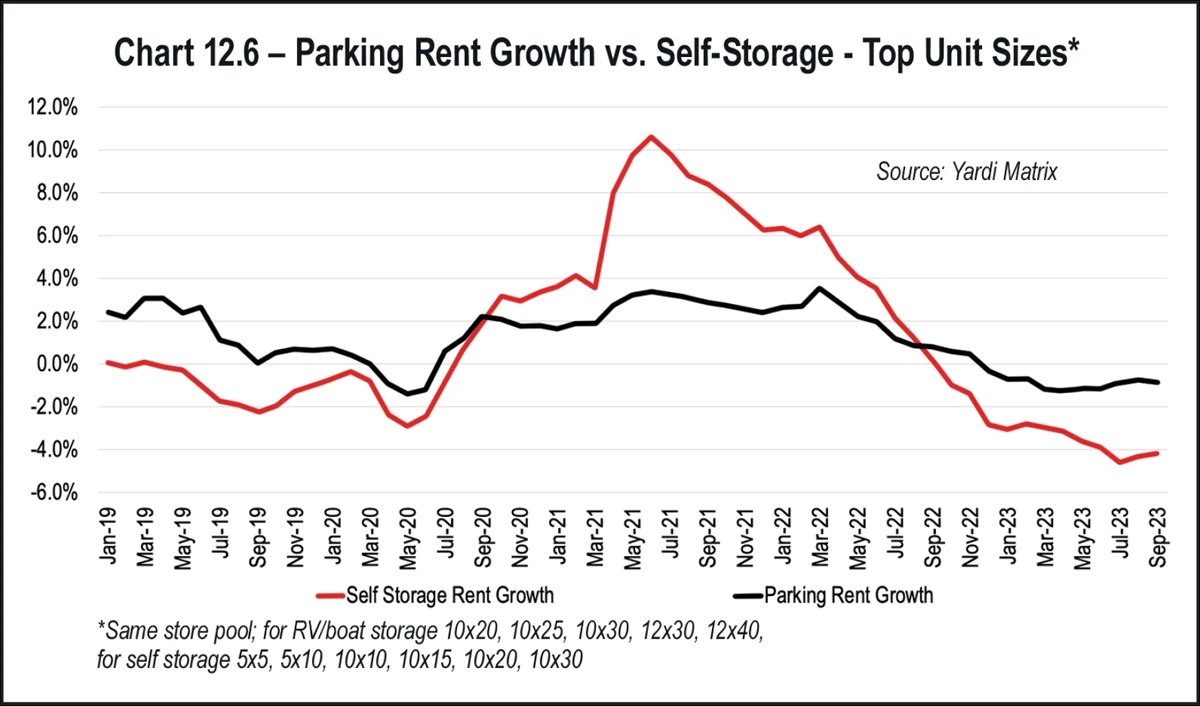
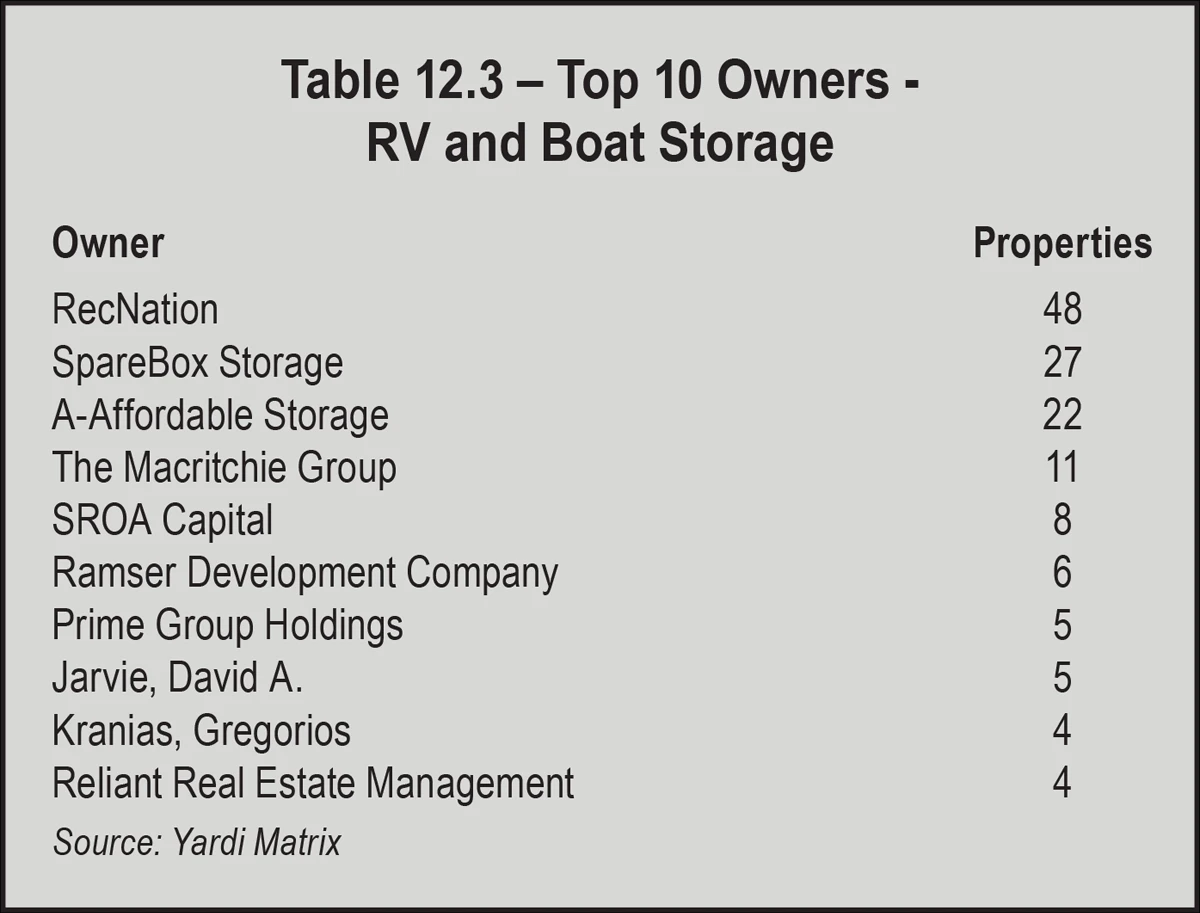
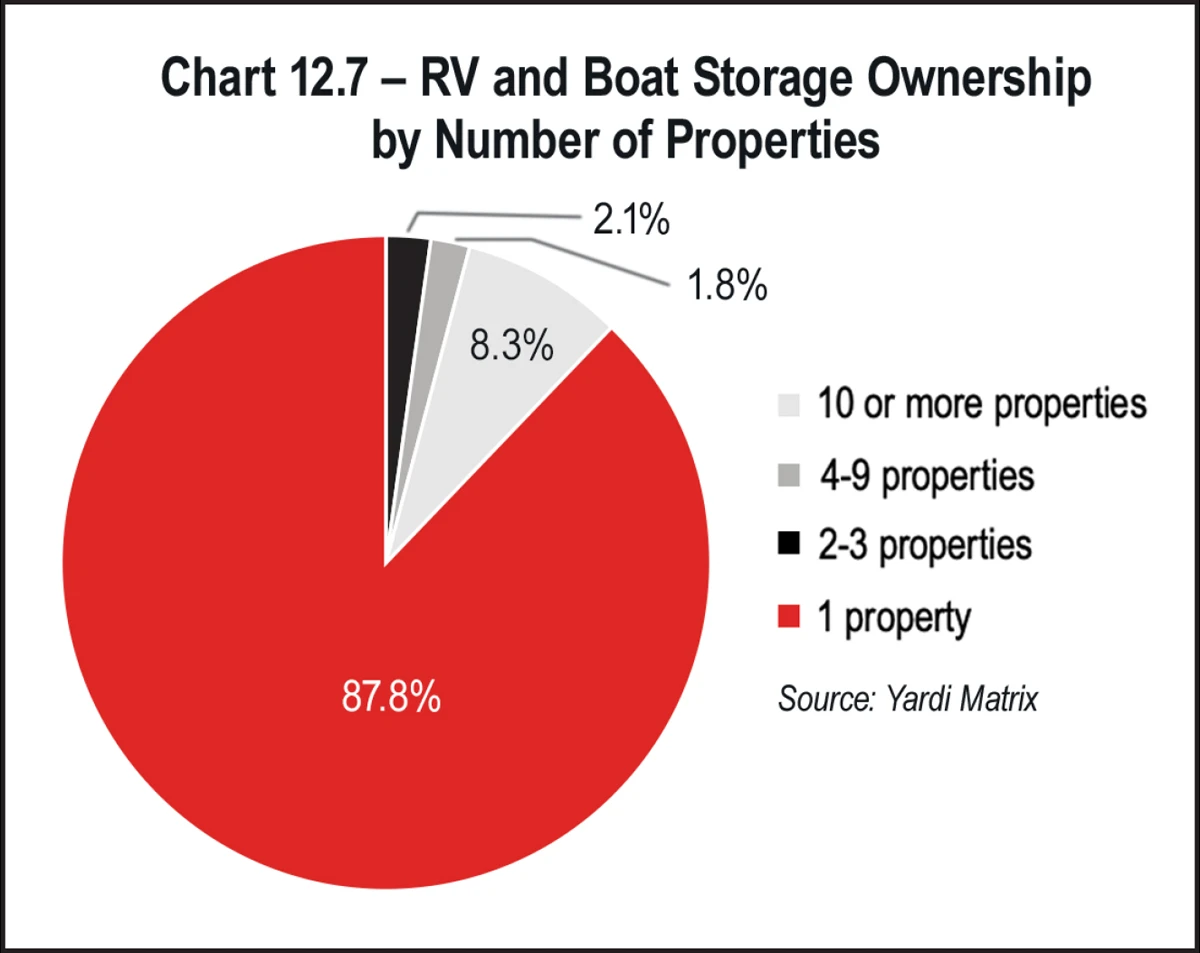
Other active buyers are investing in RV/boat storage alongside traditional self-storage. Yardi Matrix has noted sales of RV/boat storage properties in recent years to large self-storage owners/operators including Amerco Real Estate (dba U-Haul), Madison Capital Group (Go Store It), National Storage Affiliates (various brands), Strategic Asset Management (SmartStop) and The William Warren Group (StorQuest). These owners and operators may see operational similarities with self-storage and have unique insight into demand and rent trends as they already own and operate many self-storage properties with RV/boat parking. They are able to integrate RV/boat storage properties into their portfolios and management platforms and take advantage of their sector knowledge and boots on the ground management.
Additionally, large private equity groups have set their sights on the niche sector and have acquired RV/boat storage properties recently, including Invesco, Blackstone Group, Hines Interests, KKR and Brookfield Properties. Although their ownership is currently very limited, these companies have extremely large balance sheets and have the ability to transform the RV/boat storage into a more institutionally-owned sector like self-storage has become over the past few decades.
Like development activity, much of the transaction volume in recent years have focused on high-growth Sun Belt markets, particularly Texas and Florida. Nearly half of the 320 RV/boat storage properties sold since 2020 have been in these two states, with the most in Houston (43), followed by Dallas (29) and the Southwest Florida Coast (18). Other markets that have experienced a notable amount of sales recently include Oklahoma City, Denver, the Central Valley of California, and Phoenix. Only 16 properties have sold in the Northeast, half of these occurring in Massachusetts. Like self-storage, pricing varies significantly by market and depends on the availability of data and age and quality of properties being sold, but ranges from $125,000 per acre in Corpus Christi to over $5 million per acre in Los Angeles.
espite uncertain macro-economic conditions, investor interest in the self-storage asset class remains high. Self-storage is resilient to both inflation and recession and is considered by many market participants to be a safe haven. For example, self-storage has outperformed other CORE sectors of real estate, such as apartments and industrial property, over the long run, according to NAREIT data. Investor expectations are changing due to expectations of improved operational and lending conditions in 2024, as well as stable to decreasing cap rates. It is interesting to note that Chart 13.1 Public Storage Same-Store Rental Activity research by Newmark Self Storage Practice, PSA Quarterly and Supplemental Public Filings: 2Q 2022 to 3Q 2023, self-storage rental income growth or actual rents increased 9.80 percent, while street rates or asking declined 18.40 percent.
In “Self-Storage Economics and Appraisal,” market conditions are outlined as the core of self-storage economics. It is described as an analysis of the market conditions that affect value using both qualitative and quantitative techniques. One tool, benchmarking, can be a starting point of analysis. For example, a measure of the total self-storage supply per person in the local trade area can be benchmarked to core-based statistical area (CBSA) data published by the Almanac. Another tool, the Cost of Occupancy (COO), can measure rents as a ratio of average household Income to CBSA data also published in the Almanac.
Investor expectations are changing due to expectations of improved operational and lending conditions in 2024, as well as stable to decreasing cap rates.
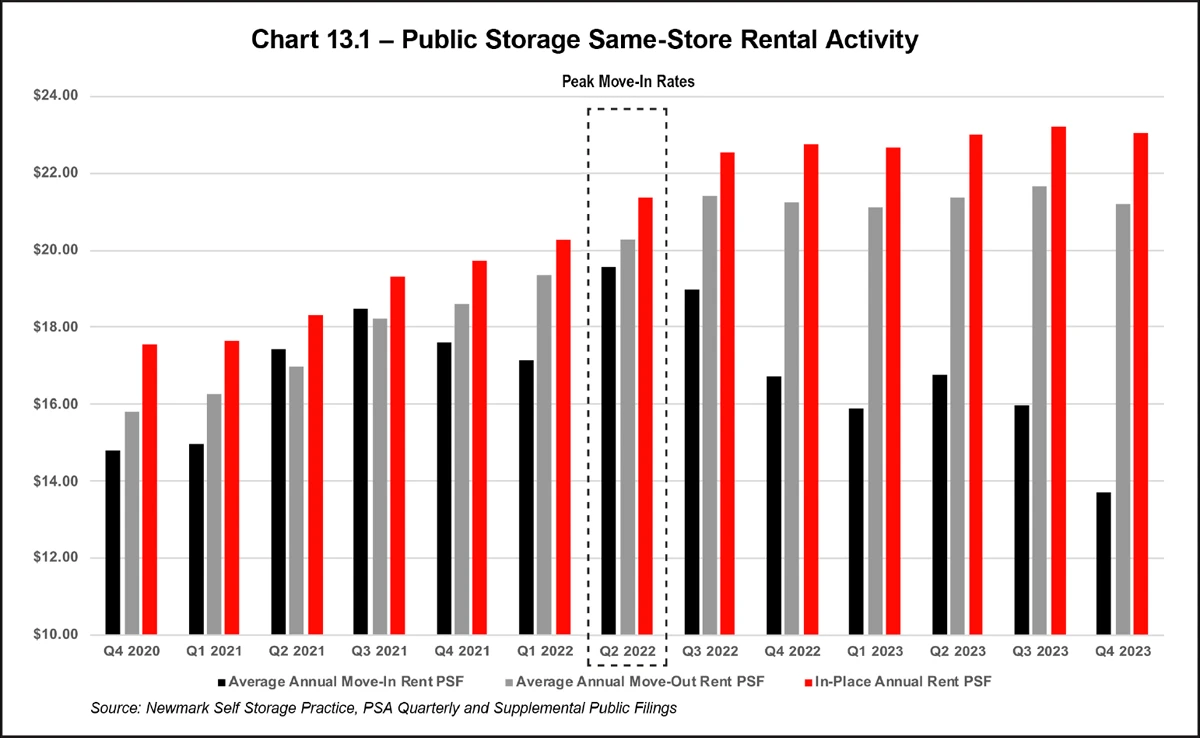
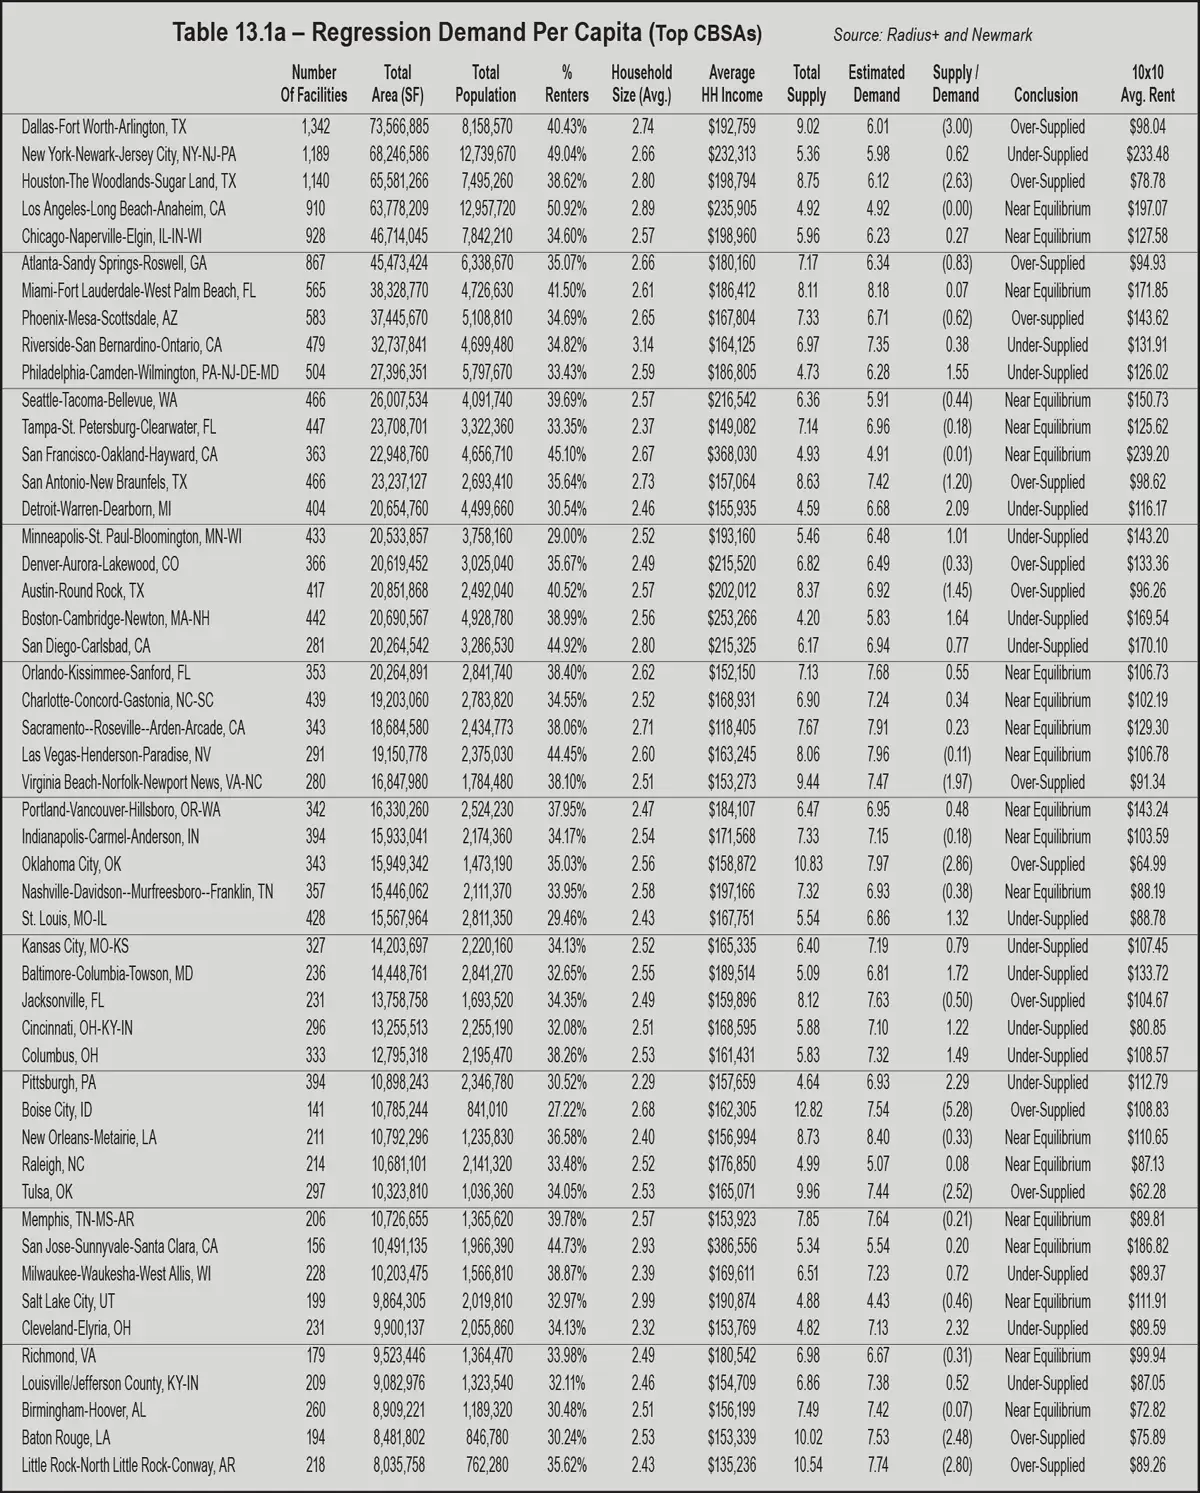
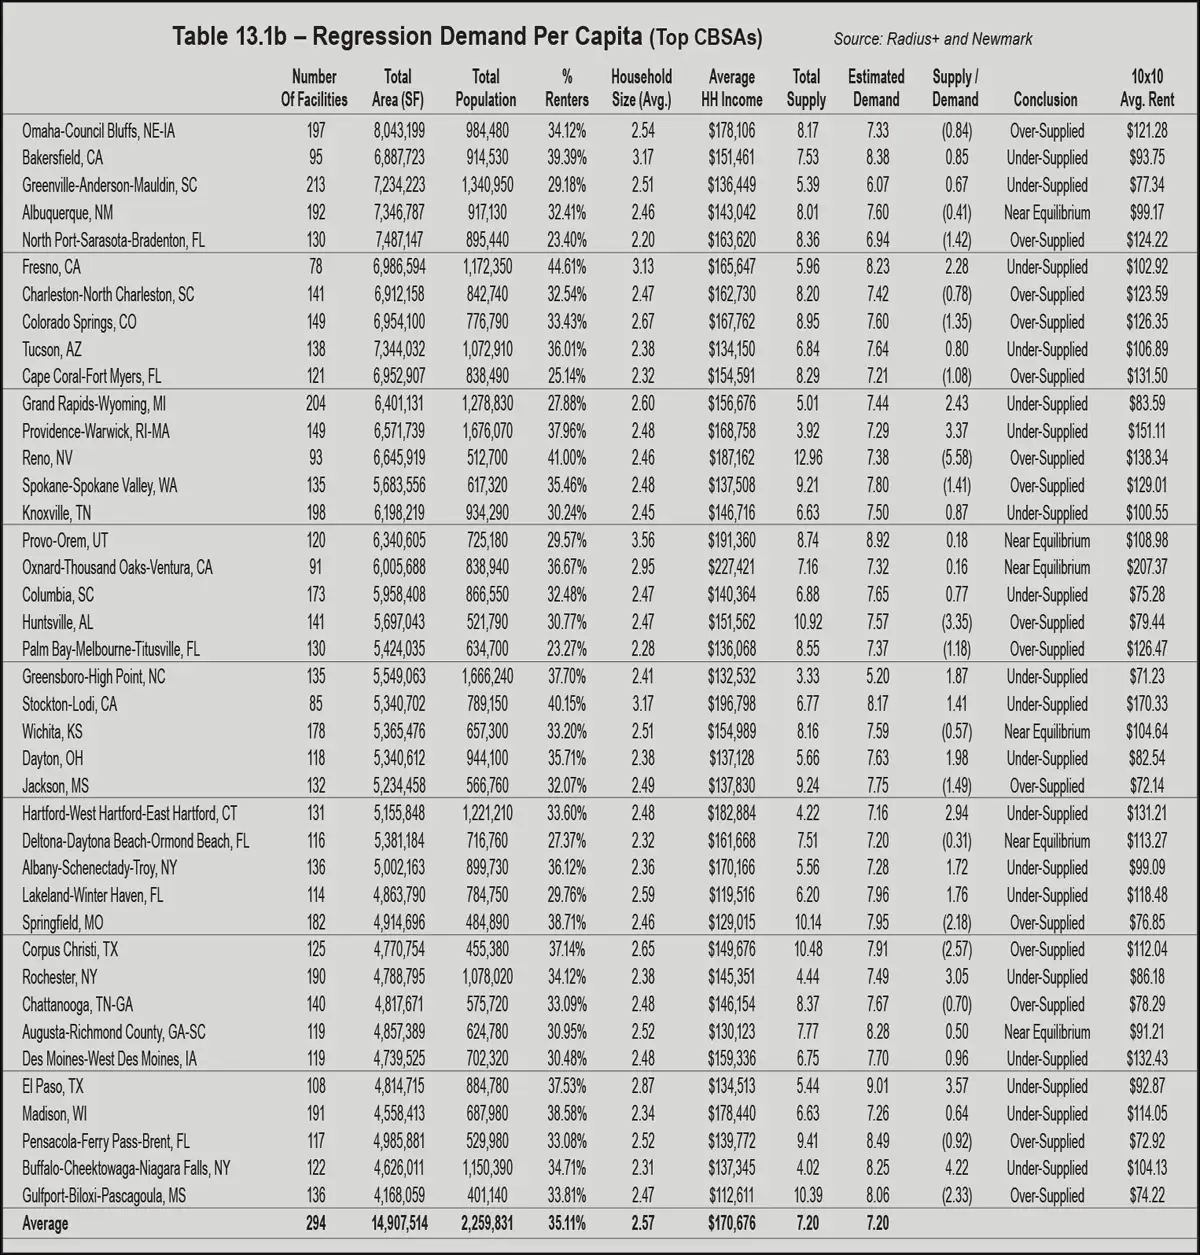
Determinants of the self-storage market relate to the forces of supply and demand, as is the case with other types of real estate. The analysis of demand generators, however, is focused on four key variables:
- Population
- The percentage of renters
- Average household size
- Average household income
A simple econometric model can be used to estimate self-storage demand. Table 13.1 shows the results of regression analysis using a proprietary model registered with the Library of Congress. However, this data can be easily duplicated in spreadsheet software or statistical packages. In the multiple regression model, the dependent variable is square feet of self-storage per person. The independent variables are the demographic variables by CBSA: population, percentage of renters, average household size, and average household income. Testing these variables for relationships and rank indicates a moderate correlation with a multiple r coefficient of 0.45333 and an r-squared of 0.22484. Comparing existing supply to demand can be used as a benchmark to determine if a CBSA is undersupplied, oversupplied, or at equilibrium.
- Market participants report cautious optimism for the sector in heading into 2024. Cap rates increased only 7 basis points from the prior quarter to a current average stabilized rate of 5.75 percent. Many pointed out continued strong ECRI (Existing Customer Rate Increases) despite declining street or asking rates. The prevailing view, according to the survey, is improved operating, interest rates (lower), and investment activity in 2024.
- Discounted cash flow modeling is more important than ever for investment and underwriting decisions. While it appears rental rates have kept pace with inflation, a “return to normal” is likely in 2024 regarding rent rate growth. Expenses will be closely monitored with concerns of rising utility and tax accounts. Remote or less on-site management and contactless customer rentals will increase as cost cutting tool of operations.
- Supply chain problems have restricted self-storage development that resulted in a conservative pace of new product in 2023. Although supply chain is easing, city processes with permits and entitlements are not getting easier. Lenders are more conservative, and with the higher cost of funds, some projects that were feasible less than a year ago may be marginally feasible or not feasible in 2024. As a result, supply and demand fundamentals should remain strong for the sector over the next several years.
he overall capitalization rate or “cap rate” is used to convert income to value. One of the easiest ways to think of the relationship of a cap rate to value is the acronym IRV: Income divided by Rate = Value or I/R = V. As the cap rate goes down, the value goes up. Officially, the direct capitalization is defined by The Appraisal Institute in the Dictionary of Real Estate as follows (page 65):
To complicate matters, a cap rate can be calculated on last year’s net operating income (often called trailing), a forecast of next year’s expectations of net operating income (forecast). Moreover, the “true” cap rate is often a perspective, not a fact. For example, the seller may believe the cap rate was a 5.5 percent, implying a higher value, while the buyer may believe the cap rate was a 6 percent, implying a higher return. And, the broker involved in the deal may report a 5.75 percent cap rate. While all three perspectives are important to understand, it doesn’t exactly determine the cap rate.
For comparison purposes, it is best to understand the forecast or stabilized cap rate (for example, this is the cap rate used in an appraisal) and the trailing cap rate to understand expectations of buyers and sellers in the transaction. It is also important to understand if expenses were adjusted to market, particularly real estate taxes, in the forecast or stabilized cap rate. For the purposes of this section, the stabilized or forecast (sometimes called Year 1) cap rate will be addressed because it is typically the most consistent cap rate considered for comparison purposes (for example, it is the basis of Investor Survey’s on cap rates).
- Direct Cap Comparables – Deriving comparables from similar properties that have sold is generally the preferred technique when sufficient information is available. For example, what cap rate is reported (the trailing or the stabilized)? Comparable cap rates are summarized in Table 14.1 below.
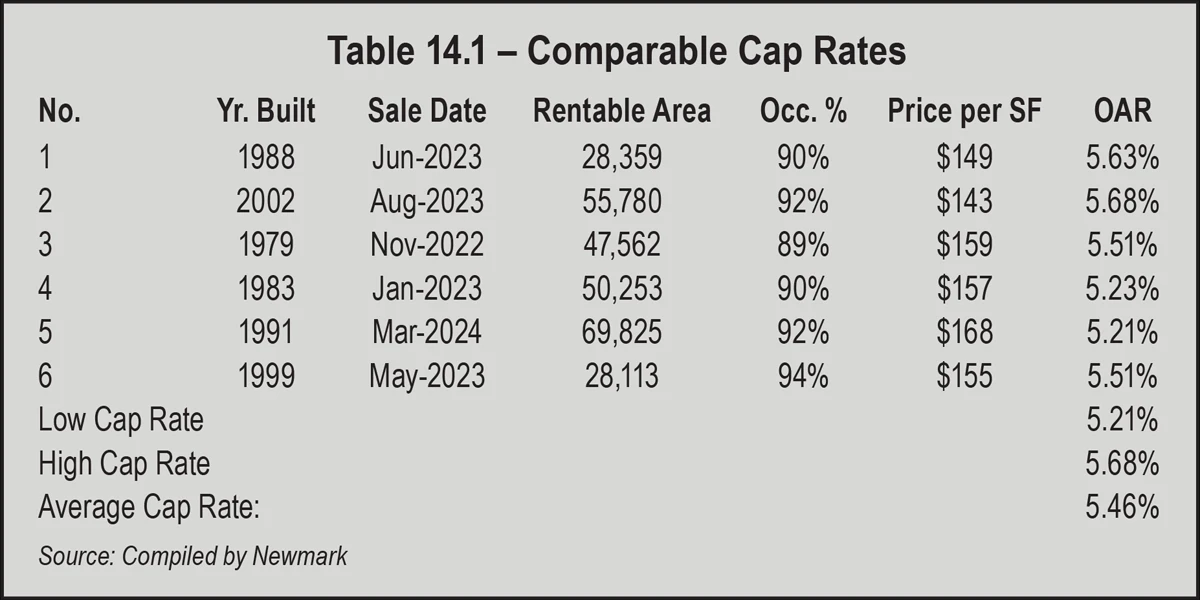
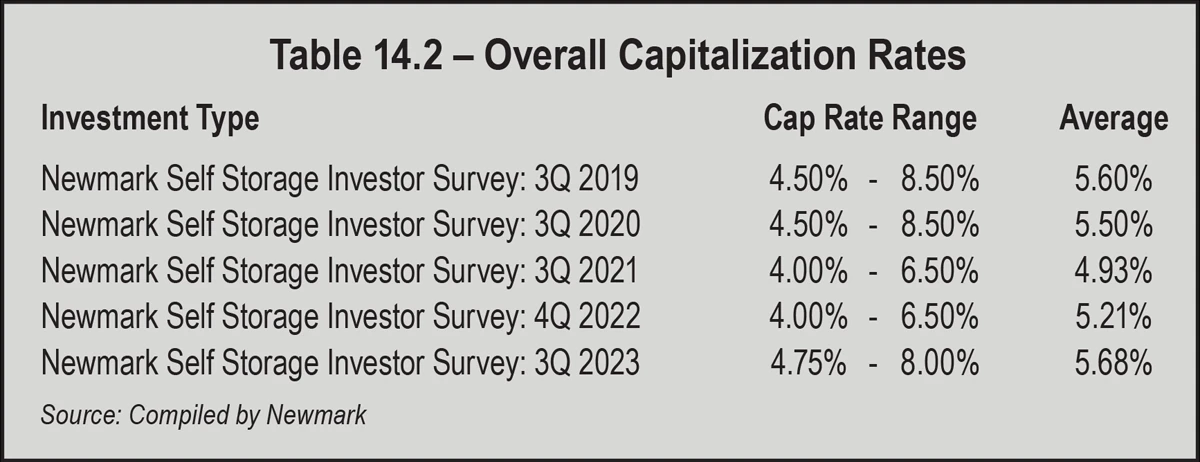
- Investor Surveys – Survey research is based on periodic publications of the current thinking of investors, compared to historical performance data of comparable sales. Surveys are generally used as support and should not be relied upon as a primary source. They are very useful to understand real-time market dynamics. Surveys can vary in scope of research, so it is worthwhile to review a wide variety of publications. The results of the most recent self-storage investor surveys are summarized in Table 14.2 on page 135.
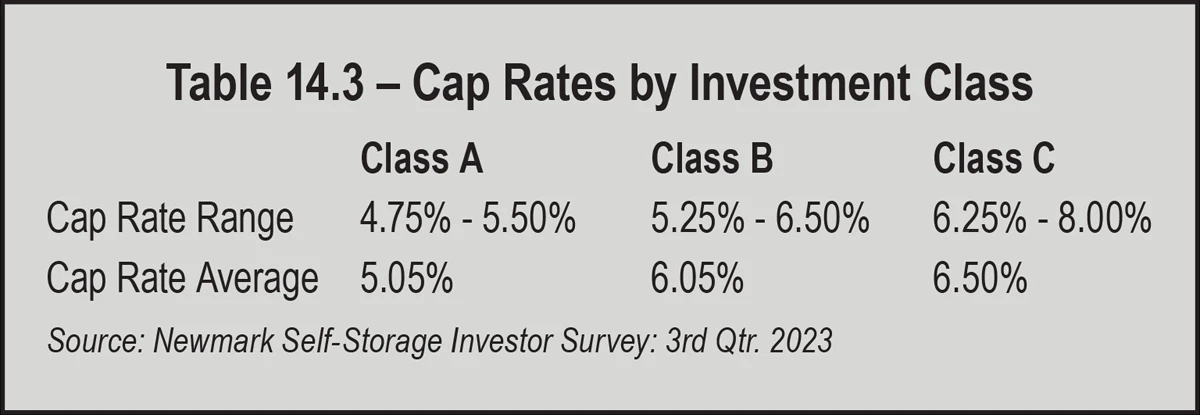
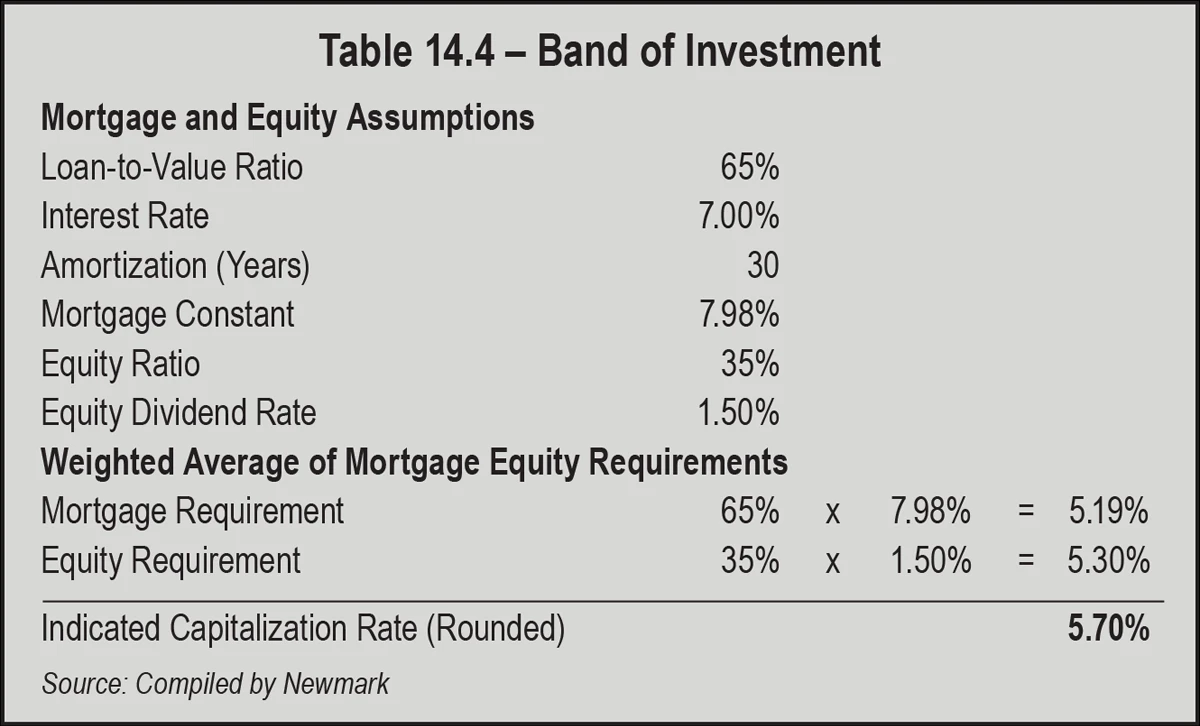
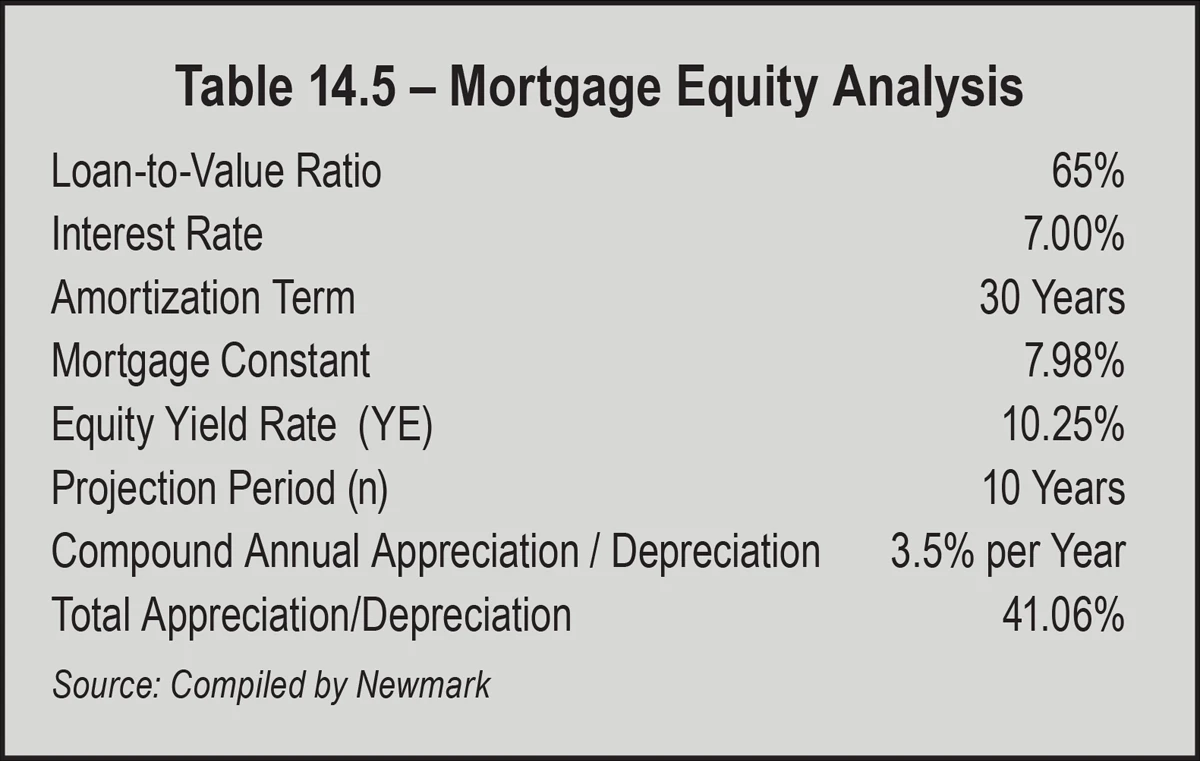
This is useful because cap rates vary by the physical and economic characteristics of a property. In general, the higher quality or class of property, the lower the cap rate (resulting in higher values). Survey research can also be supplemented by direct interviews with market participants such as real estate brokers who specialize in the self-storage asset class. In this regard, local participants can provide anecdotal but vital understanding of the local market conditions. For example, in markets with new construction, the cap rates may be impacted.
- Band of Investment – This technique is based on returns to debt and equity, sometimes called a built-up model. It accounts for market-based financing with a market-based return to equity. The return to equity for a single asset is typically higher than a comparable self-storage annual return to investor or dividend from a self-storage REIT or stock (does not account for appreciation of the asset). Another way to look at the equity dividend, or cash on cash, is the annual return on every dollar of equity. Since most properties are purchased with a combination of debt and equity, the technique has relevance in the market. A Band of Investment Analysis example is summarized in Table 14.4 on the opposite page.
Over the past year, the return to equity has changed significantly lower due to higher interest rates. Some investors are willing to underwrite a negative return in the initial year to make a deal pencil, but that means significant upside is expected in rents. Common to industrial and apartment sectors, this is new for self-storage. It is another indicator that institutional investors have confidence in the self-storage asset class in bull and bear markets.
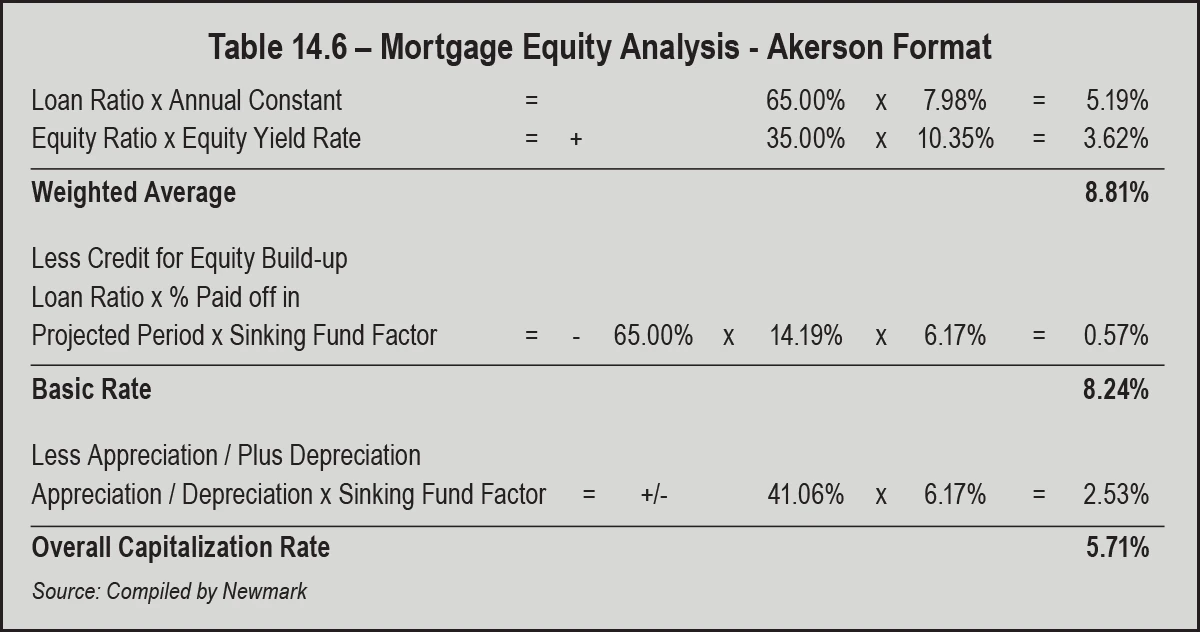
- Mortgage Equity Analysis – This analysis derives from the idea that real property investments are a combination of two components: debt and equity. It differs from the Band of Investment because it accounts for total yield: equity dividend and appreciation over time. It is a useful tool because it solves for a levered equity yield (that includes both cash flow or equity dividend and appreciation over time). Self-storage as an asset class has demonstrated superior returns for many years. For example, comparing total return of self-storage REITs over the last 25 years, self-storage has provided an 16.30 percent return on average and is superior to other core sectors such as office, industrial, retail, or apartments (based on NAREIT data or publicly traded companies only). As a result, institutional investors have been storing capital in the sector. The Mortgage Equity Analysis solves for equity yield, a common metric of the comparison of returns among investments for the institutional market. The equity yield rate estimated is lower for a single asset (in this case estimated at 10.25 percent) than publicly traded REIT data because REITs offer greater liquidity. The mortgage equity example, with the same mortgage requirements as the Band of Investment example for consistency, is presented in Tables 14.5 on the opposite page and 14.6 above.
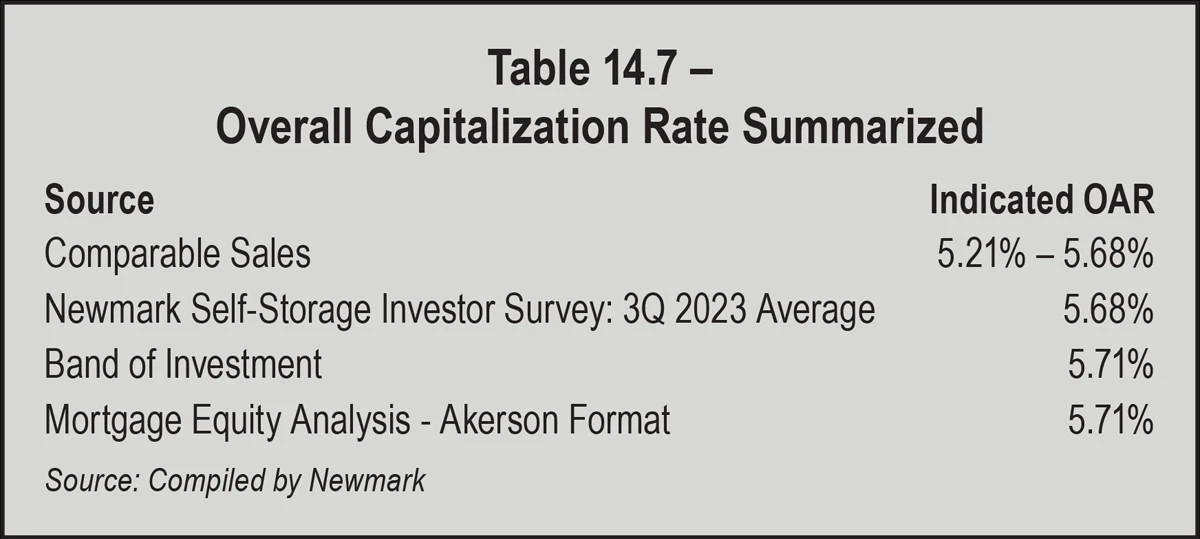

simple terms, an appraisal is “the act or process of developing an opinion of value of an asset” (The Appraisal of Real Estate, 15th Edition). A self-storage appraisal is simply the economic model or methodology of developing an opinion of value. Appraisal has evolved as the asset class has become significantly more sophisticated in recent years. Therefore, the focus of this section is on key points to analyze when appraising or arriving at an opinion of value.
This modeling explains why self-storage cap rates lag interest rate increases; investors are willing to accept lower returns (dividend or cash on cash) on equity. As shown in the example, a 100 bp increase to the interest rate results in a 50 percent decrease to the equity return. Investor underwriting has changed over the last year to include negative leverage, or a negative return in the first year or two of the holding period. As a result, cap rate and yield rate modeling has changed in Discounted Cash Flow analysis for the sector.
As shown in Table 15.3, the Valuation Matrix with a 7.75 percent shows a typical spread between the cap rate (5.00 percent) and yield rate approximal to the compound rate of growth of NOI. As more institutional investors from other sectors have entered self-storage, modeling for self-storage is reflecting other sectors that have a compressed yield rate and a higher terminal cap rate (75 bp spread to 5.00 percent cap rate) as shown in the Valuation Matrix with a 7.00 percent Internal Rate of Return (yield rate).
As demonstrated, the modeling is different, but the valuation indication does not change. These revisions reflect the market response to dynamic macro-economic conditions. Self-storage is a good hedge against inflation, and the R word for the sector is not recession but resistance (to recession). As a result, more equity is still seeking to store capital in self-storage than product available. The Band of Investment reflecting a 50 bps increase in interest rates is presented on page 141.
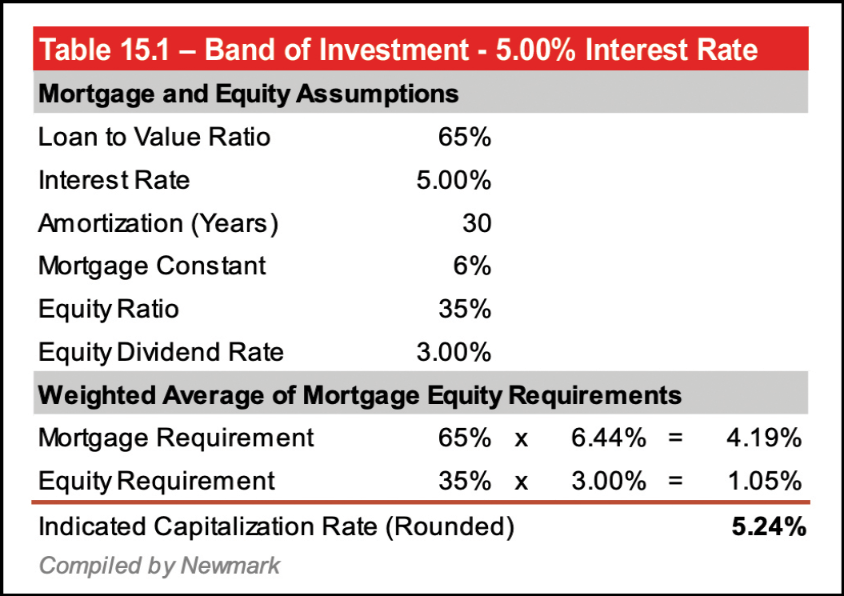
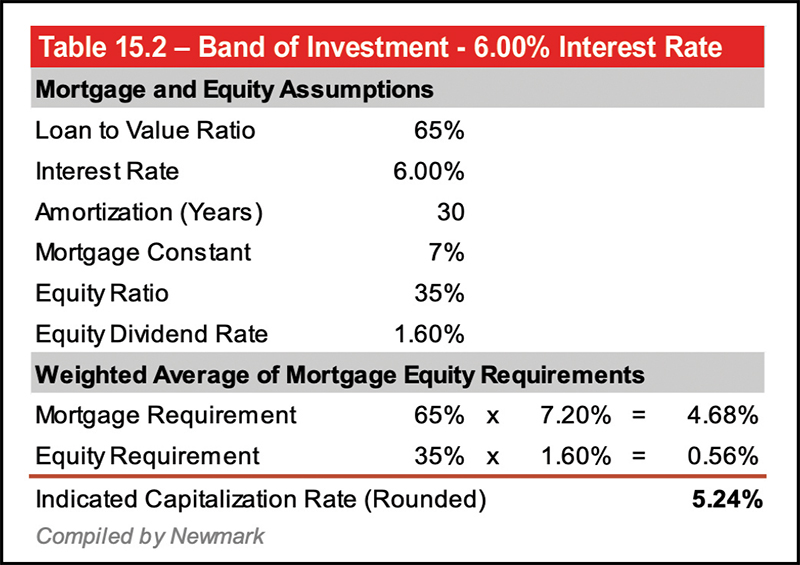
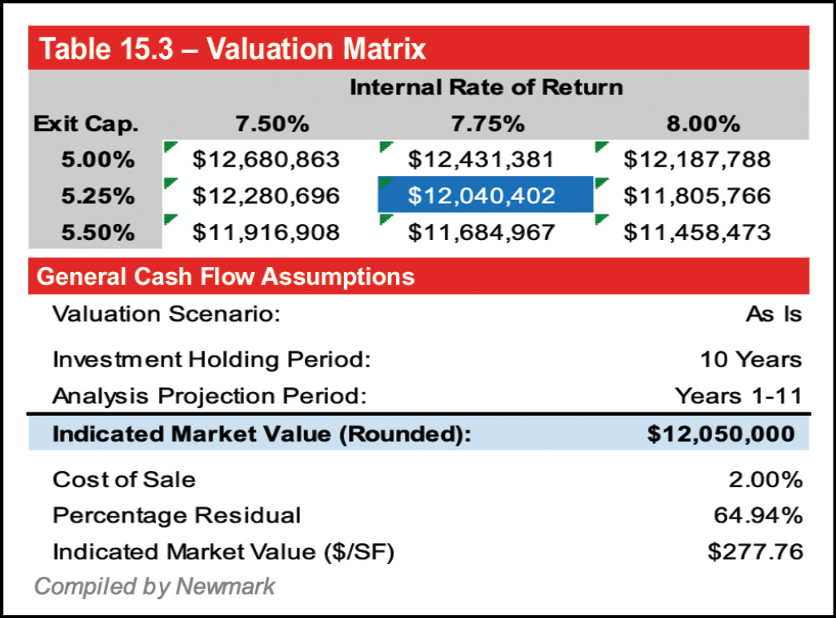
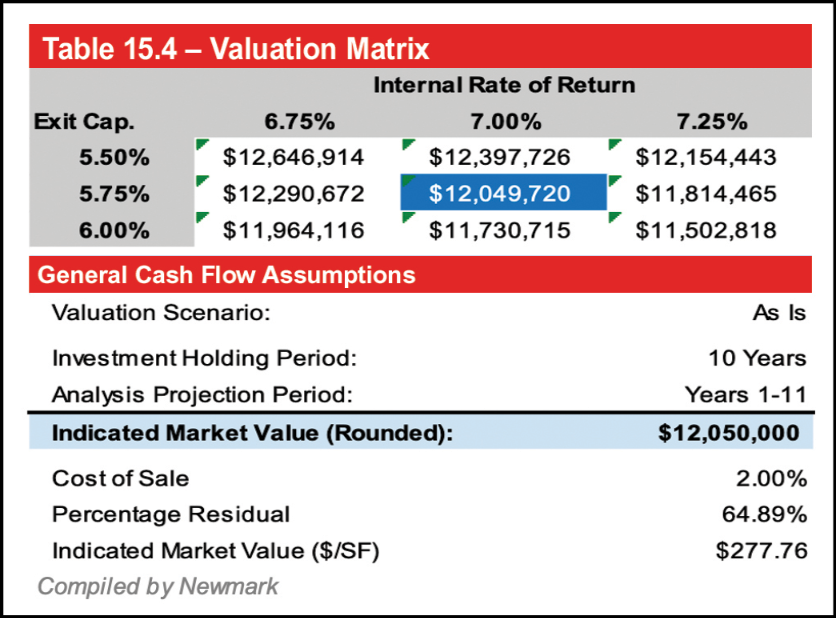
- Identification of the Problem (for appraisal, usually identifying the assignment)
- Scope of Work Determination
- Data Collection and Property Description
- Data Analysis
- Application of the Approaches to Value
There are three specific approaches to value that reflect distinct methods of data analysis: the Cost Approach, the Sales Comparison Approach, and the Income Capitalization Approach. The use of two or three of these approaches are then reconciled into a final opinion of value. For self-storage, the primary investment criteria are based on cash flow. As a result, the income capitalization approach is emphasized in self-storage valuation and will be analyzed first.
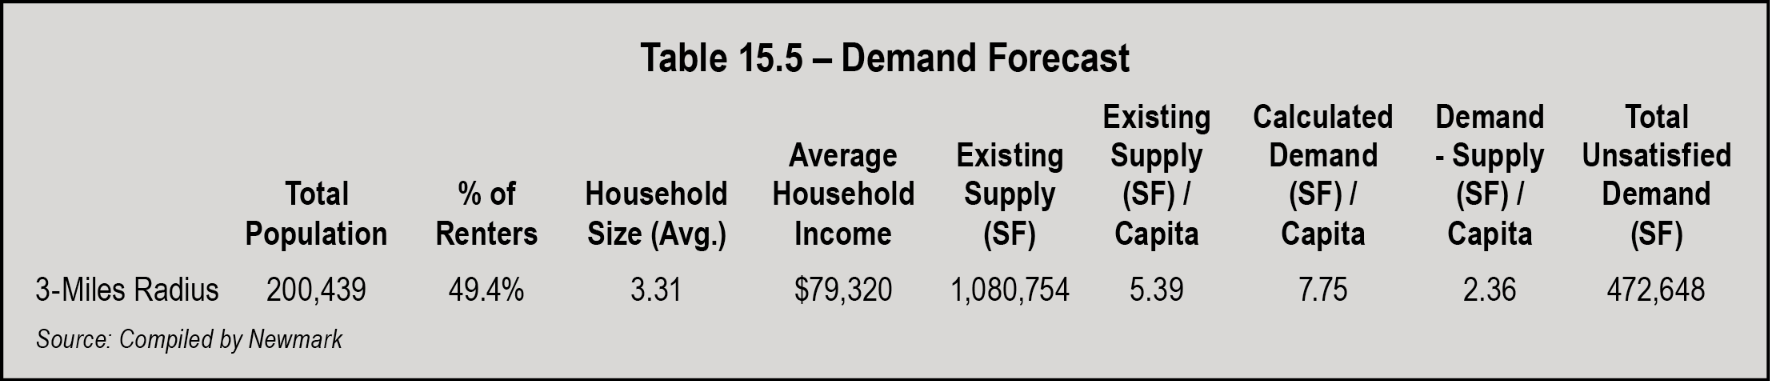
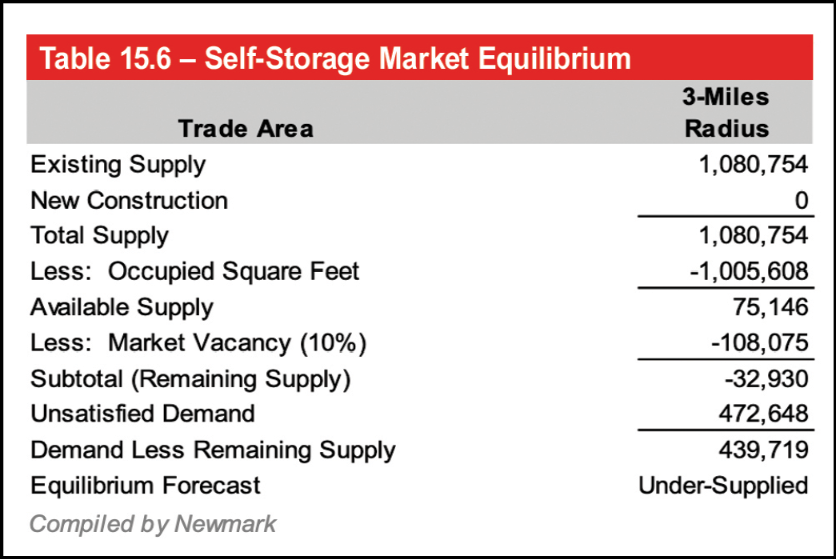
As to historical trends, a review of the subject property financials is best. An example is presented in Table 15.7 below.
Notice the pattern of Effective Gross Income or EGI. From 2019 to 2020, it increased $64,495, an increase of 20.19 percent. From 2020 to 2021, EGI increased only $616, or less than 0.10 percent. The trailing twelve months (TTM) is not as good an indicator as calendar years due to seasonality and can be skewed. Given this history, an increase of $14,836 or 3.86 percent is concluded in the Year-1 Forecast.
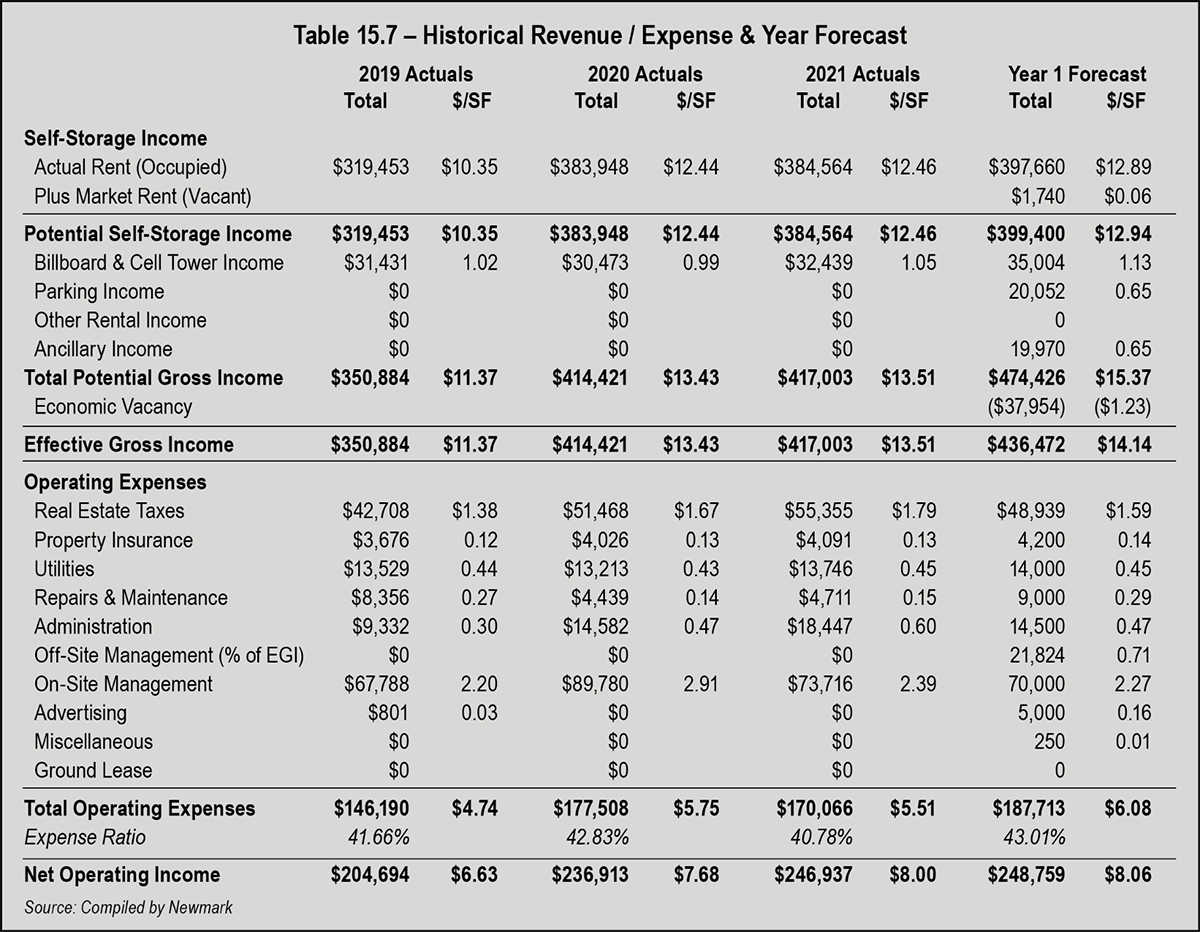
Another test of reasonableness to forecasting collected income or EGI is the Cost of Occupancy (COO). The COO is the average annual rent of a unit (total rent collected divided by occupied units) compared to average annual household income. In general, a ratio near 2 percent suggests rent upside. Alternatively, a ratio above 3.5 percent suggests less upside. In this case, the COO is 1.58 percent, suggesting continued upside in collected rents. As one person noted, some people spend more on coffee than the COO of a self-storage unit. So, who would bother to spend a Saturday moving out of a unit for a savings of 7 percent to 9 percent?
Operating expenses historically at the subject property should be compared to national data, such as the Self-Storage Expense Guidebook (also published by Modern Storage Media) and expense comparables. Data should be analyzed by square footage and as a ratio of EGI. An example is presented in Table 15.8 below.
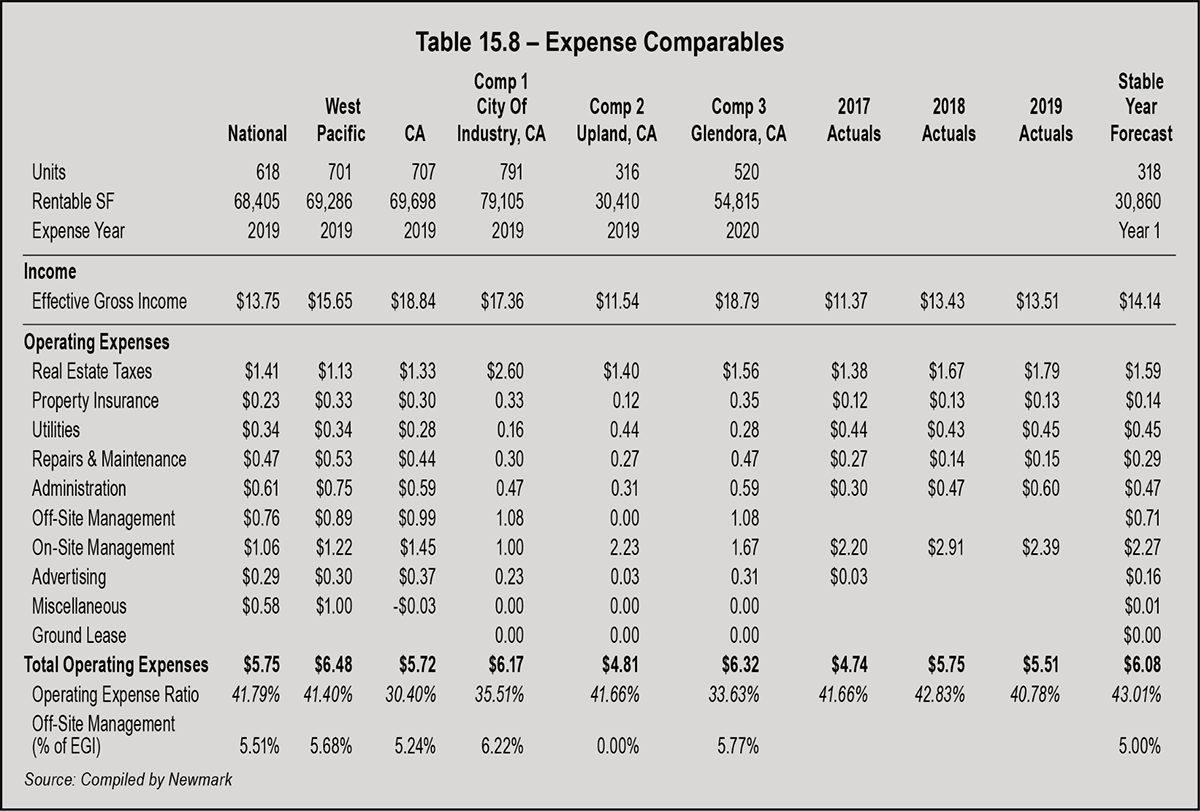
- Relationships – A 10-year discounted cash flow model is the primary decision maker in over 85 percent of investors surveyed. (Please visit www.modernstoragemedia.com to see published Investors Surveys). As outlined earlier, this is because of the increasing sophistication of the self-storage sector. It accounts for both cash flow (equity dividend) and appreciation (yield) during a typical 10-year holding period.
- The relationship of the cap rate and Internal Rate of Return (IRR) or discount rate should be within 50 basis points of the compound rate of the net operating income during the holding period. In this example, the net operating income is forecast to increase at 3.19 percent. With a cap rate of 5.5 percent, an IRR of 8.25 percent is within the 50 bps parameter. Alternatively, since last year, a compressed IRR can be used with an increased terminal cap rate.
- As a test of reasonableness, the relationship of cash flow to appreciation can be examined. In this example, the reversion or appreciation component represents 59 percent of total value, with the balance being attributed to cash flow. In an ideal market, the balance is 50 percent/50 percent. But in appreciating sectors and markets like this self-storage example, the reversion or appreciation component may be as much as 65 percent. Conversely, in down markets, the cash flow may be emphasized as much as 65 percent with only 35 percent of total value being attributable to appreciation.
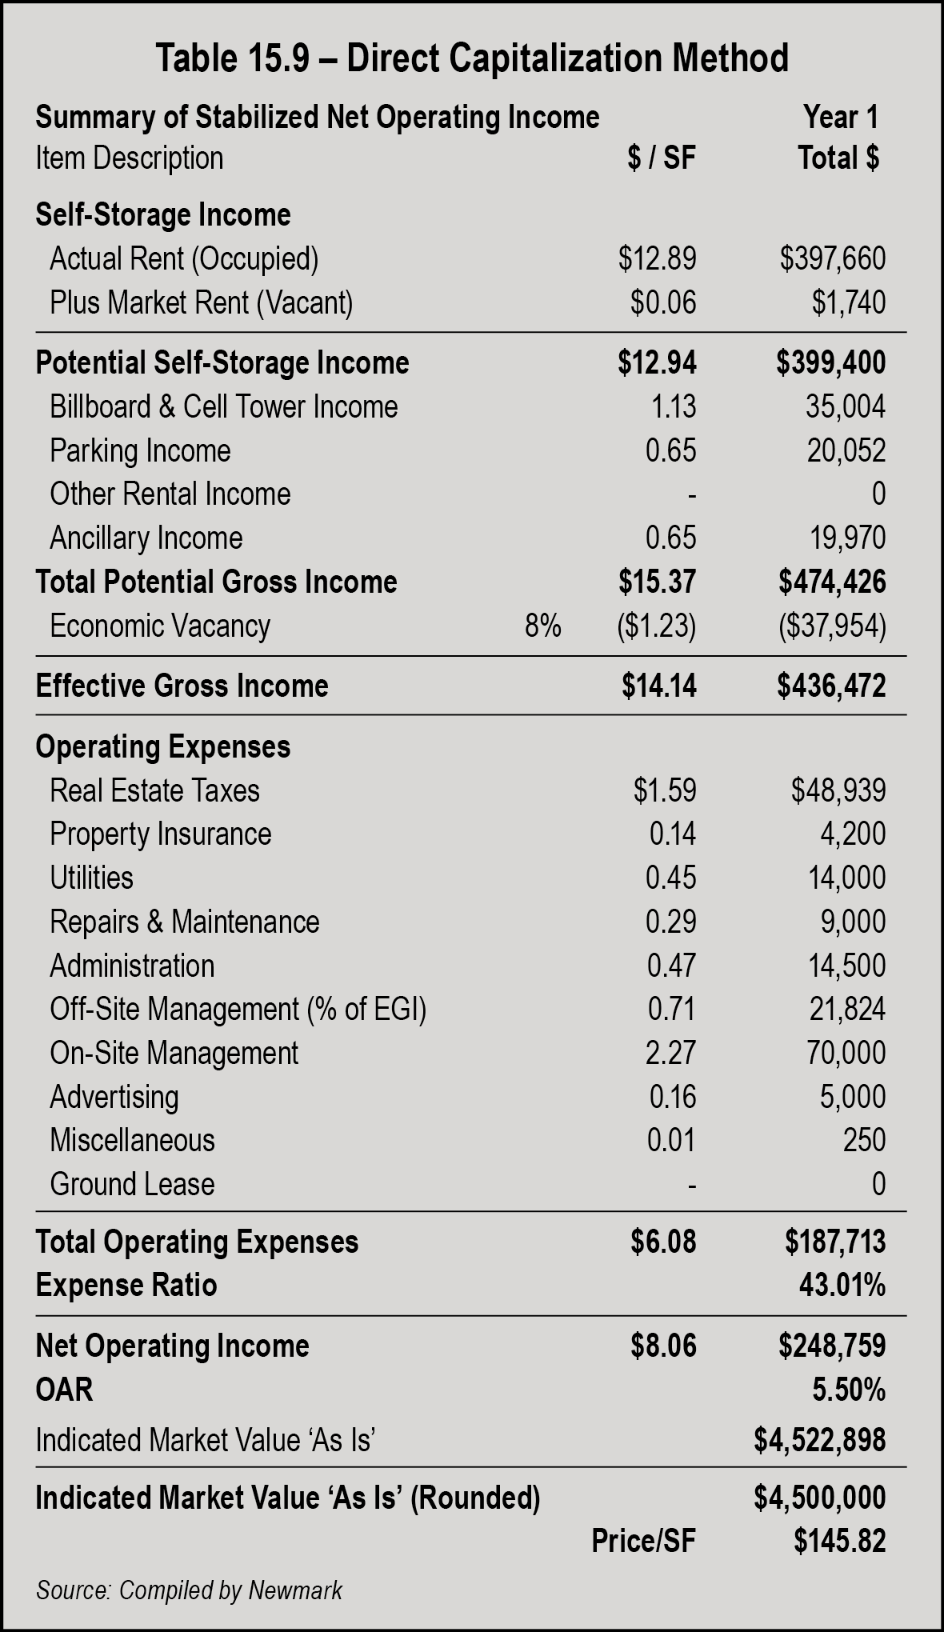
- Unit of Analysis – The appropriate unit for comparison in the sales comparison approach is the price per square foot of rentable area. For self-storage, the price per unit can be easily skewed due to variances in unit mix. For example, a price per unit analysis shows a higher range. Therefore, the price per square foot of rentable area is considered most credible.
- Economic Characteristics – One of the most under-utilized adjustments particular to self-storage is economics characteristics. Since cash flow is the driver of investment decisions in the asset class, economic characteristics should be among the most important adjustments. Economic characteristics include attributes associated with a trade area beyond the location adjustment. For self-storage, this adjustment considers whether the conditions of the comparable trade area can be classified as oversupplied, undersupplied, or at equilibrium. Net operating income per square foot can be one benchmark tool; however, it is not a mathematical relationship and must be used with great care. Another measure of this variable relates to unit rent. For example, the operation of the business generates the net operating income applied to the real estate. In general, there is a correlation between higher rent and higher value. As a result, an adjustment for economic conditions is considered. Unfortunately, precise data and a direct relationship are difficult to isolate. Looking at net operating income as a benchmark, and considering the other adjustments, an adjustment can be derived.
- Adjustment Summary – The total range of adjustments should always decline after the adjustment process, or what is the point of the exercise? In the following example, the range is narrowed from 90 percent to 15 percent. An example is presented in Table 15.12 below.
- Effective Gross Income Multiplier (EGIM) – The EGIM tests the reasonableness of the forecast year-one cash flow to the concluded cap rate. Using the formula 1-expense ratio/EGIM (or value divided by effective gross income), expense ratios can be compared to concluded cap rates. In general, the lower the expense ratio the higher the cap rate.
- Secondary Approach – For self-storage, the sales comparison approach is secondary. Because of the emphasis and impact of cash flow and relatively low sales volume in many markets, the price elasticity of self-storage can be very large. As previously discussed, the market emphasizes cash flow and the income approach significantly more than the sales comparison approach.
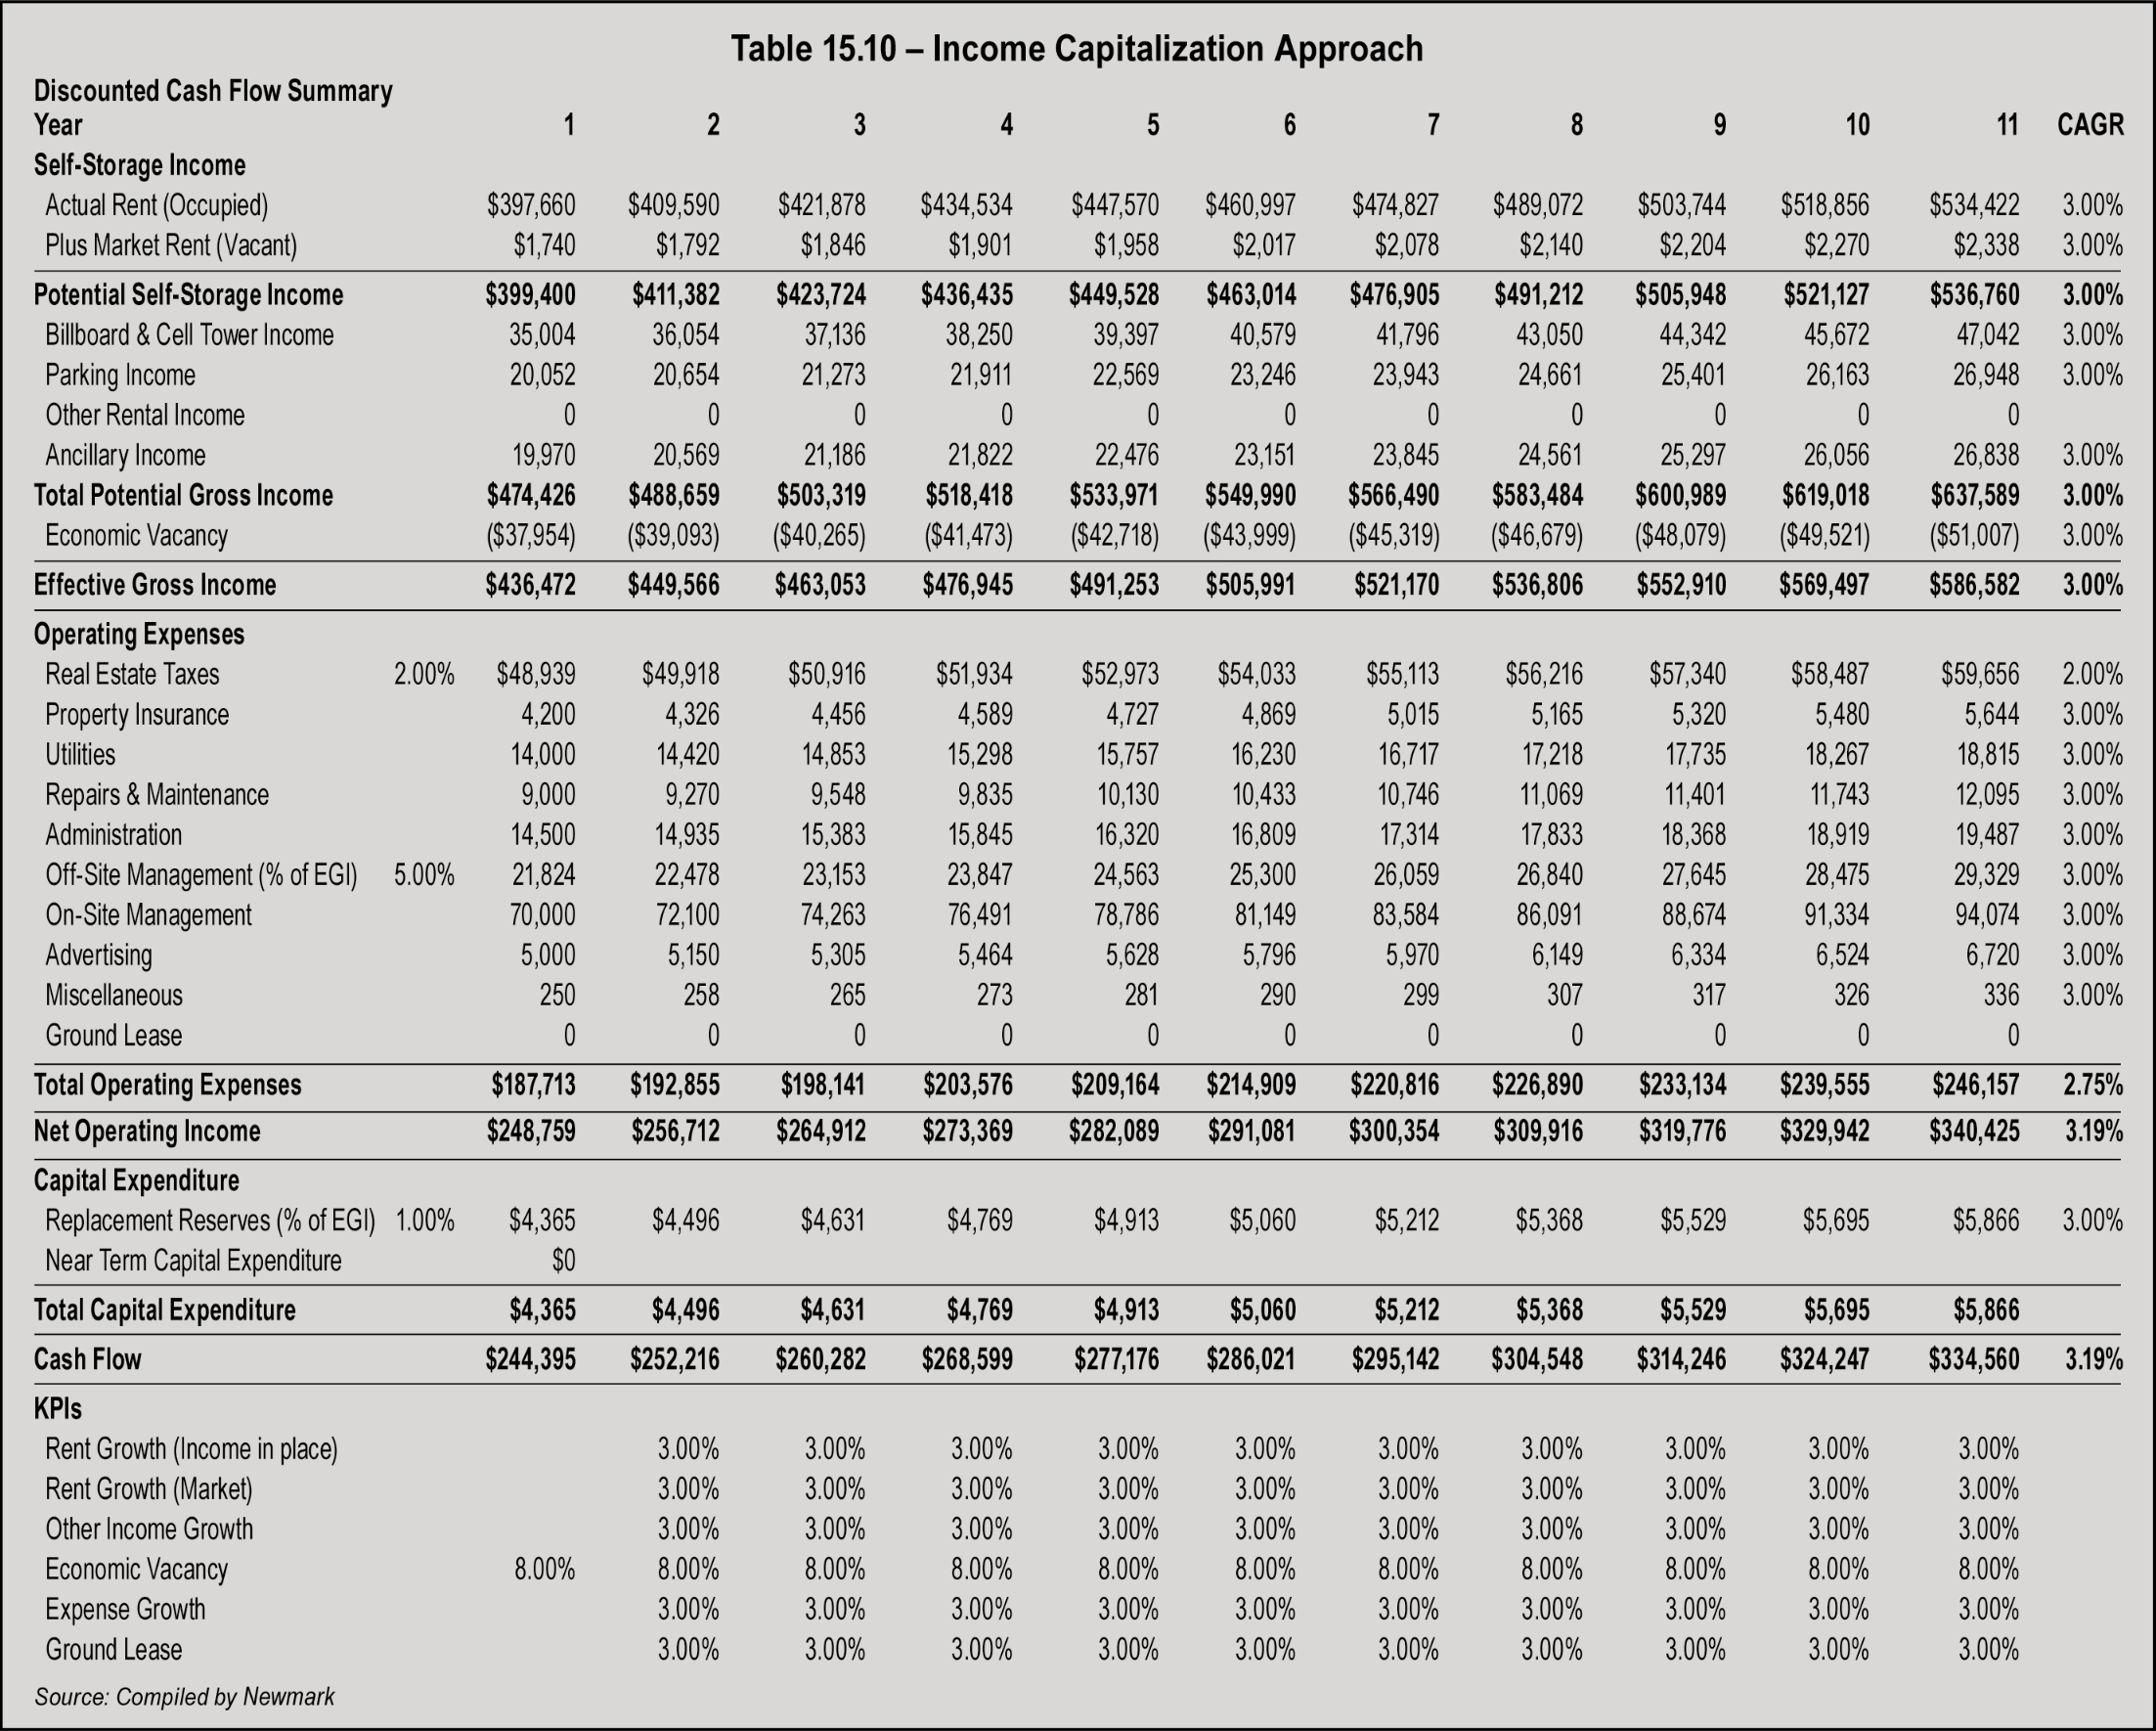
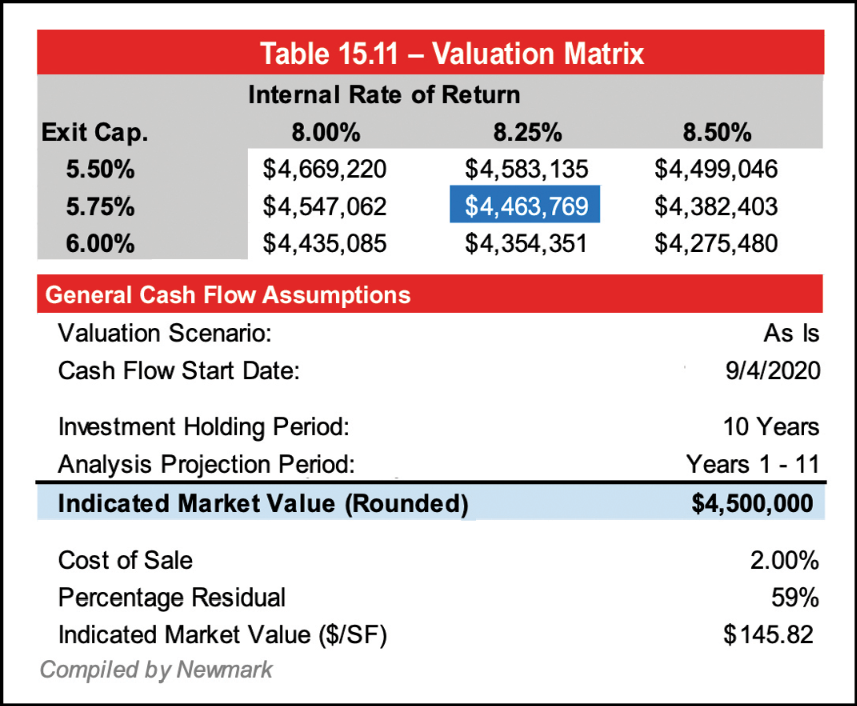
- Applicable and Relevant – The cost approach is best used for newer properties due to the challenges of estimating depreciation. However, some lenders want an estimate of remaining economic life to ensure the building is economically viable during the amortization period of a loan. This can create challenges and highest and best use questions of a self-storage property. Some investors like to purchase below replacement cost, but this metric can be difficult to quantify due to the wide range of replacement cost estimates, particularly as costs are currently fluctuating due to supply chain problems. Therefore, the applicability and the relevance of the cost approach warrants careful consideration to a credible opinion of value.
- Land Valuation – Self-storage land can be difficult to entitle or obtain zoning approval. Municipalities prefer other property types that generate more jobs or retail sales tax revenue. Therefore, if land sales utilized in an appraisal are not purchased and entitled for self-storage, the land component of self-storage can be undervalued. In general, self-storage land approximates a range of 10 percent to 40 percent of total property value but is typically in a narrower range of 25 percent to 35 percent.
- A cost approach for self-storage typically represents a value upon completion. Depending upon the local market, it may be appropriate to add absorption costs for stabilization (rent loss and some profit for time during lease-up).
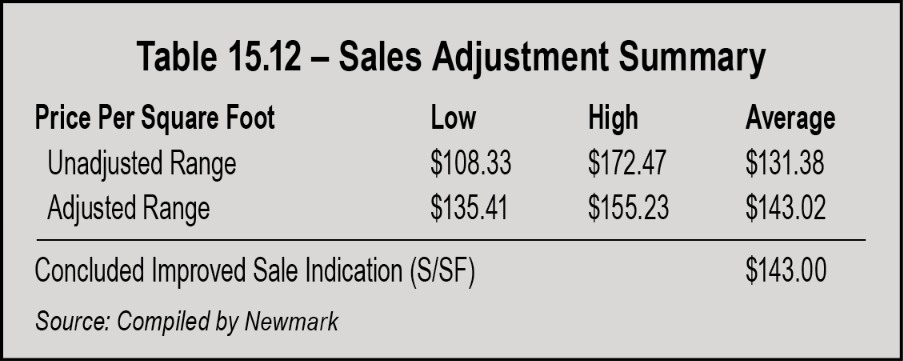

we turn the page on 2023 and reminisce on one of the most volatile lending climates in more than a decade, a compelling case can be made that 2024 will be brighter. There is no sugar-coating the sharp rise in interest rates over the last two years and its stifling effect on transaction volume and the availability of debt. 2023 brought the first wave of debt-related stress the self-storage industry has seen in some time. This materialized for borrowers who needed to refinance out of low interest rate debt into an interest rate significantly higher than the loan they repaid. However, with the Treasury index dropping 100 basis points between Halloween and Christmas, there are signs of optimism rippling through the capital markets. While there are a lot of unknowns hanging in the balance, 2024 might bring much needed relief and afford borrowers a slew of compelling opportunities to finance their assets.
Understanding prevailing interest rates are among the most critical prerequisites for a borrower seeking financing. To put the coming year into perspective, a brief review of rate movement in 2022 and 2023 through the lens of the Federal Funds target rate is a good proxy of recent activity in the debt markets. The target rate was held near zero to spur economic recovery following the Financial Crisis in 2008. Finally, in December 2015, the target rate was increased, a milestone followed by several hikes thereafter. The onset of COVID-19 prompted an emergency meeting in March of 2020, when the Fed Funds rate was cut back down to 0.0 to 0.25 percent. This near-zero level persisted until March 2022 when the Fed began an aggressive campaign to curb rampant inflation. The Fed raised rates seven times to end 2022 at a range of 4.25 percent to 4.50 percent.
The Fed policy action of 2022 bled into 2023, albeit at a slower pace. The Fed hiked rates at four of the first five meetings for a total of 1 percent in an ongoing effort to win the battle against inflation. Between March 2022 and July 2023, the benchmark index increased 525 basis points (5.25 percent), marking the fastest increase since another inflationary battle in the 1980s. The movement can be broadly described and summed up as follows: Debt became even more expensive in 2023 than it was in 2022.
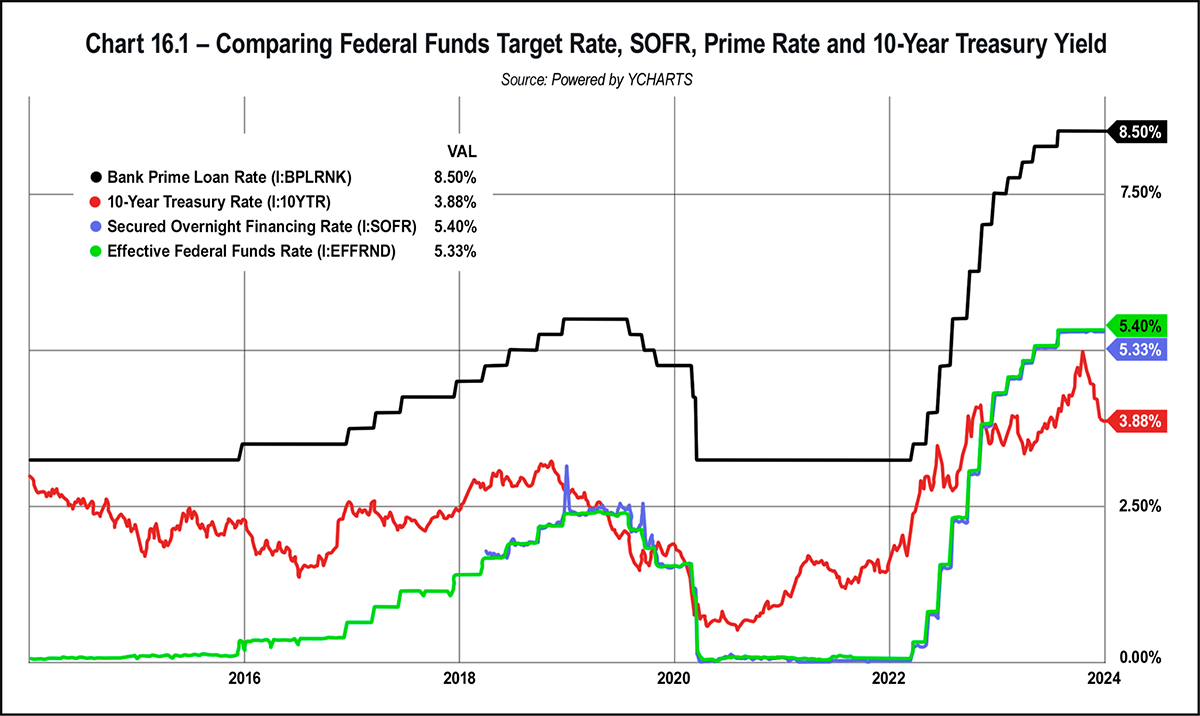
page 149.
It remains to be seen how the Fed Funds Rate (and thus Prime and SOFR) will move across eight meetings in 2024. Still, as seen in Chart 16.1, the 10-year treasury rate has fallen more than 1 percent since hitting a recent peak near 5 percent in October 2023. At the last meeting of 2023, the Fed forecasted that the Fed Funds Target rate would decline approximately 1 percent in both 2024 and 2025, likely by way of several quarter point rate cuts. Accordingly, fixed interest rates trended lower to start the year. Numerous lenders who previously suspended new originations have resumed lending. As always, external forces and events may indirectly affect capital markets. The ongoing war in Ukraine, unrest in the Middle East, rising insurance costs, and a banking industry awaiting new regulation changes are significant drivers of volatility, to name a few.
- LTV = loan amount divided by appraised value
- Debt yield = net operating income (“NOI”) divided by loan amount
- DSCR = NOI divided by annual debt service
In times of rising interest rates, loan proceeds are more likely to be constrained by DSCR hurdles than either of the other two metrics listed above. For example, an asset with a $10 million valuation may not be eligible for a $7.5 million loan (75 percent LTV) if the in-place cash flow reports well below a 1.25x DSCR. The following capital stack example demonstrates the challenges faced in 2023 if refinancing was required rather than elective.
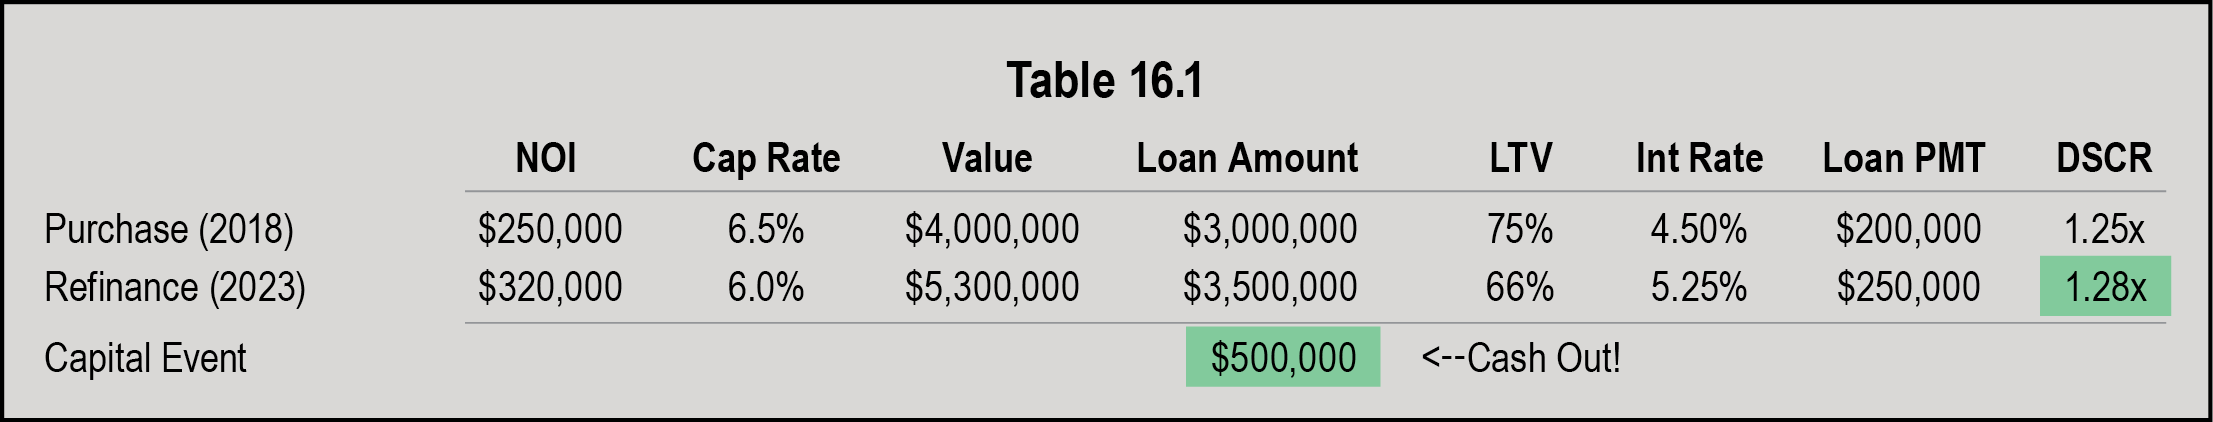
However, as readers are likely aware, the above situation did not unfold as planned. Rather, while values increased by virtue of lower cap rates and higher NOI in the years following acquisition, interest rates did not cooperate! Table 16.2 below demonstrates an equity shortfall situation that was fairly common this past year.
Not only does Table 16.2 illustrate an example of cash infusion required by means of an equity shortfall, but it also demonstrates a brutal reality regarding debt service payments. In both tables, total loan payment increased by $50,000 per year. However, in Table 16.2, this increase occurred in concert with a lower loan amount rather than a cash out.
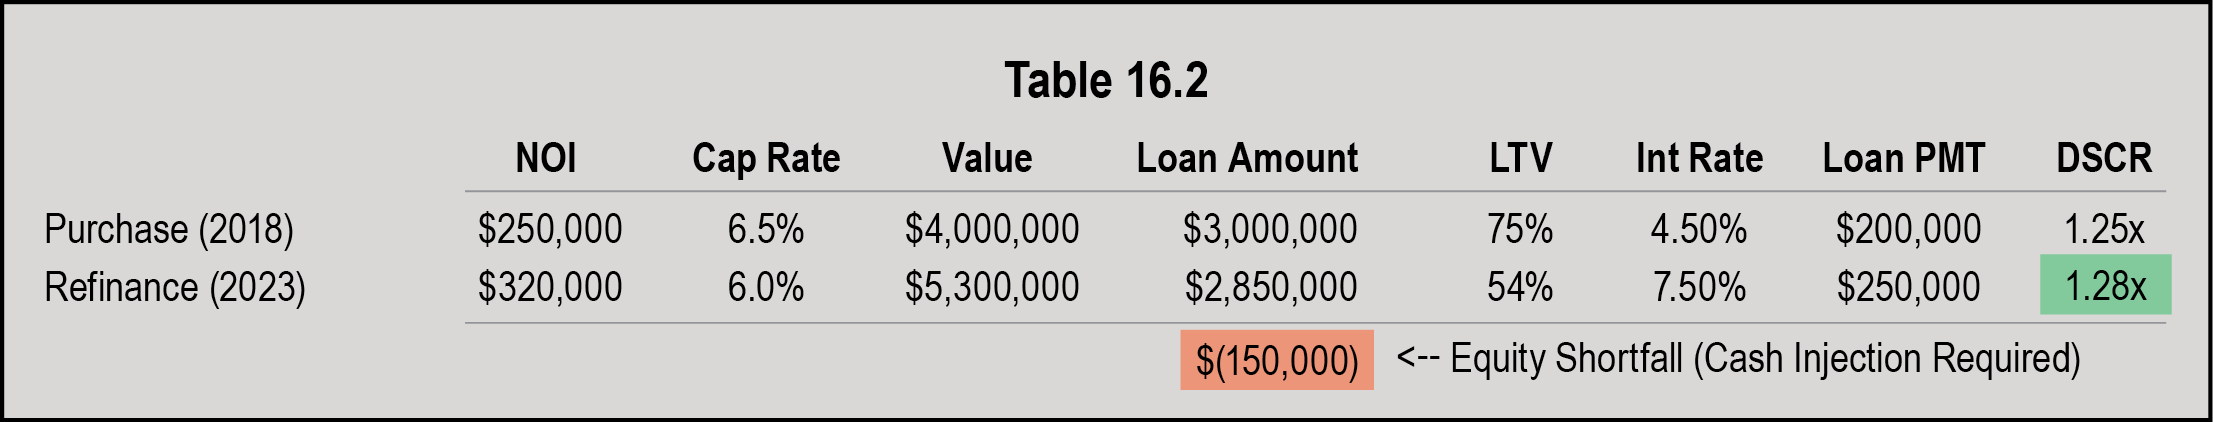
A consequence of rising interest rates was a decline in property values by way of rising cap rates. Although cap rates did not increase in unison with interest rates, values were driven down in the last year. The transaction market was stifled with mismatched buyer and seller expectations. In addition, a softening of storage fundamentals has occurred in recent years, namely slower rate growth and lower occupancies. According to data from MJ Partners, Q3 2023 saw the REITs report same-store occupancies ranging from 88.5 percent to 94.1 percent, compared to 92.6 percent to 95.2 percent a year ago. Softness notwithstanding, if interest rates cooperate and begin to reverse course, 2024 could be a fruitful year for borrowers refinancing or acquiring property.
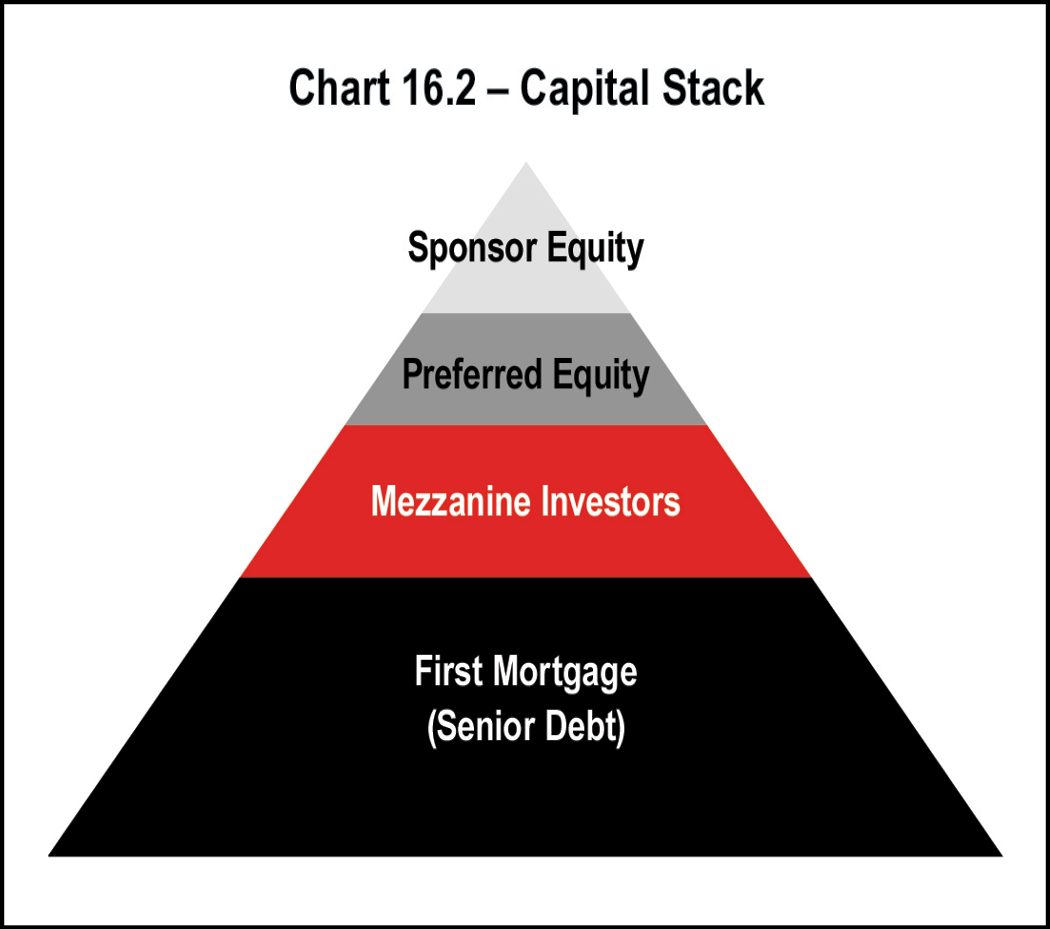
Chart 16.2 clarifies the capital stack; the pyramid shape is not purely coincidental. The level of risk and required rate of return effectively shrink from top to bottom. The top of the pyramid is the riskiest position as equity partners are last in line to receive proceeds. Meanwhile, senior lenders have priority on cash flow and inherently hold the least risky position. Lenders and equity stakeholders work hard to understand the risk profile of a deal going in, and price their offerings accordingly. Typically, the capital stack includes the following arrangement from greatest risk to least:
- Sponsor equity
- Preferred equity
- Mezzanine investors (hybrid debt and equity)
- First mortgage (senior debt)
The relative position of the stakeholders within the capital stack changes with the passage of time. As the mortgage principal is paid down, equity increases. Sponsor equity is subordinate to most debt. The value of sponsor equity can be calculated by subtracting the value of the higher priority positions from the asset’s market value.
The amount of equity a sponsor holds in an asset is important to a lender. A borrower with little or no equity stake in a property may have different interests than one with ample equity remaining, especially in the eyes of a lender. This does not discount long-term ownership where capital investments continue to be made into property to support and increase value.
Mezzanine debt and preferred equity are available in the market for larger transactions and under extraordinary circumstances. The pyramid graphic above shows these interests lodged between the senior loan and sponsor equity positions. Given that these loans are subordinate to senior debt, they are riskier and therefore command higher interest rates. Debt funds, which can serve as the senior lender or provide a level of hybrid debt, have become more popular lately.
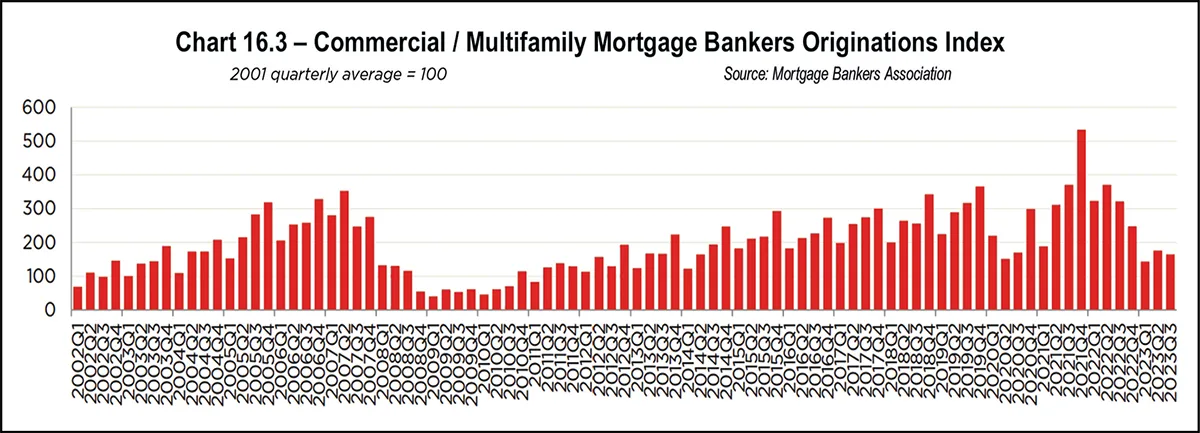
Total U.S. Commercial Mortgage-backed Securities (CMBS) issuance came back strong after the 2008 recession. However, the pandemic led to 2020 year-end CMBS issuance of just $56 billion. 2021 CMBS issuance rose to $109.8 billion, a 14-year high. At the end of quarter three 2023, total CMBS issuance sat at just $26.4 billion, less than half of the $63.3 billion through the same period a year earlier. This decline in volume underscores how rising interest rates hit the CMBS market particularly hard.
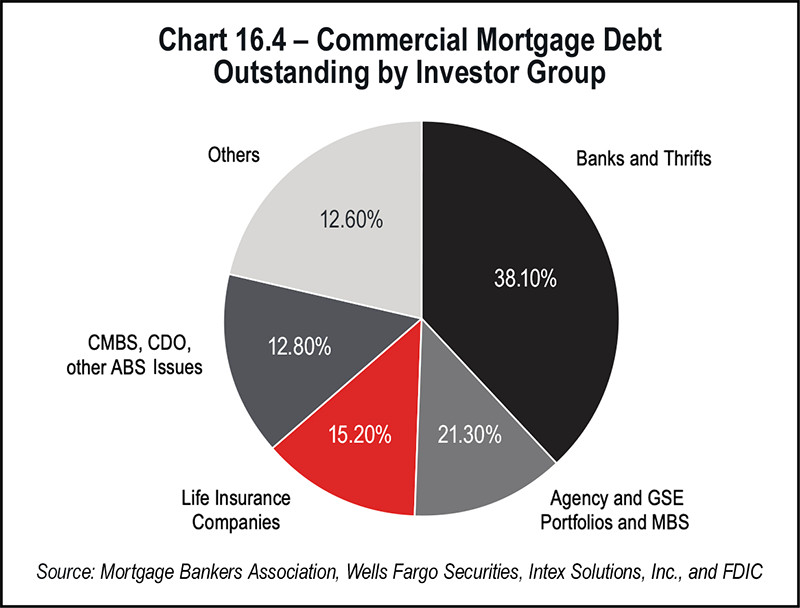
Self-storage reports favorable delinquency trends among its peers, outperforming all other property types. Per data historically available from the rating agency DBRS Morningstar, the delinquency rate for self-storage in the CMBS market peaked at 3.99 percent in 2011. This figure is still reported well below 1 percent and continues to outperform all other asset classes. Although nothing is perfectly recession-proof, industry experts have long speculated that self-storage is as close as it gets. Time will tell if this holds true, but storage enjoys demand drivers that work well in both good and bad times. See Chart 16.5 below and Chart 16.6 on page 154.
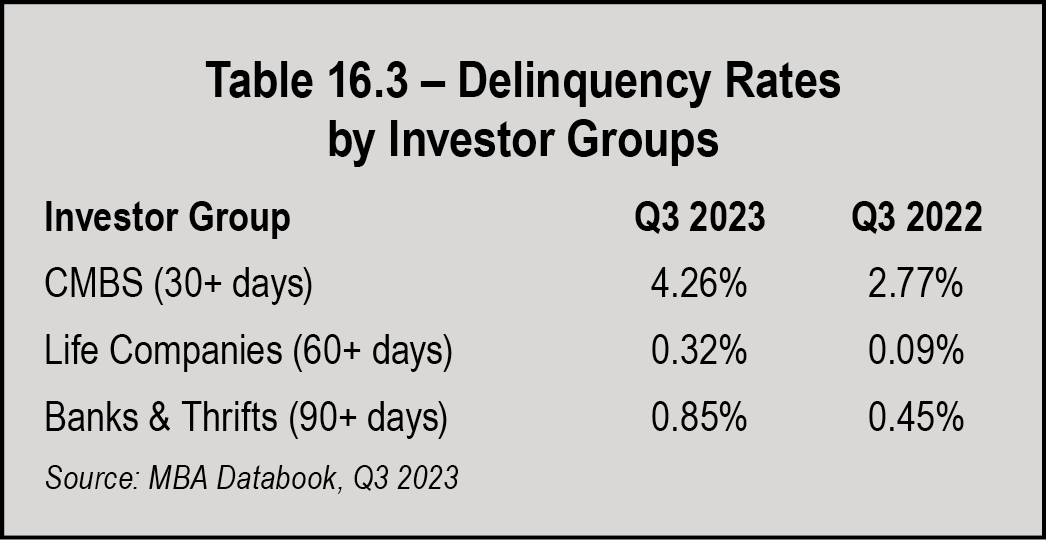
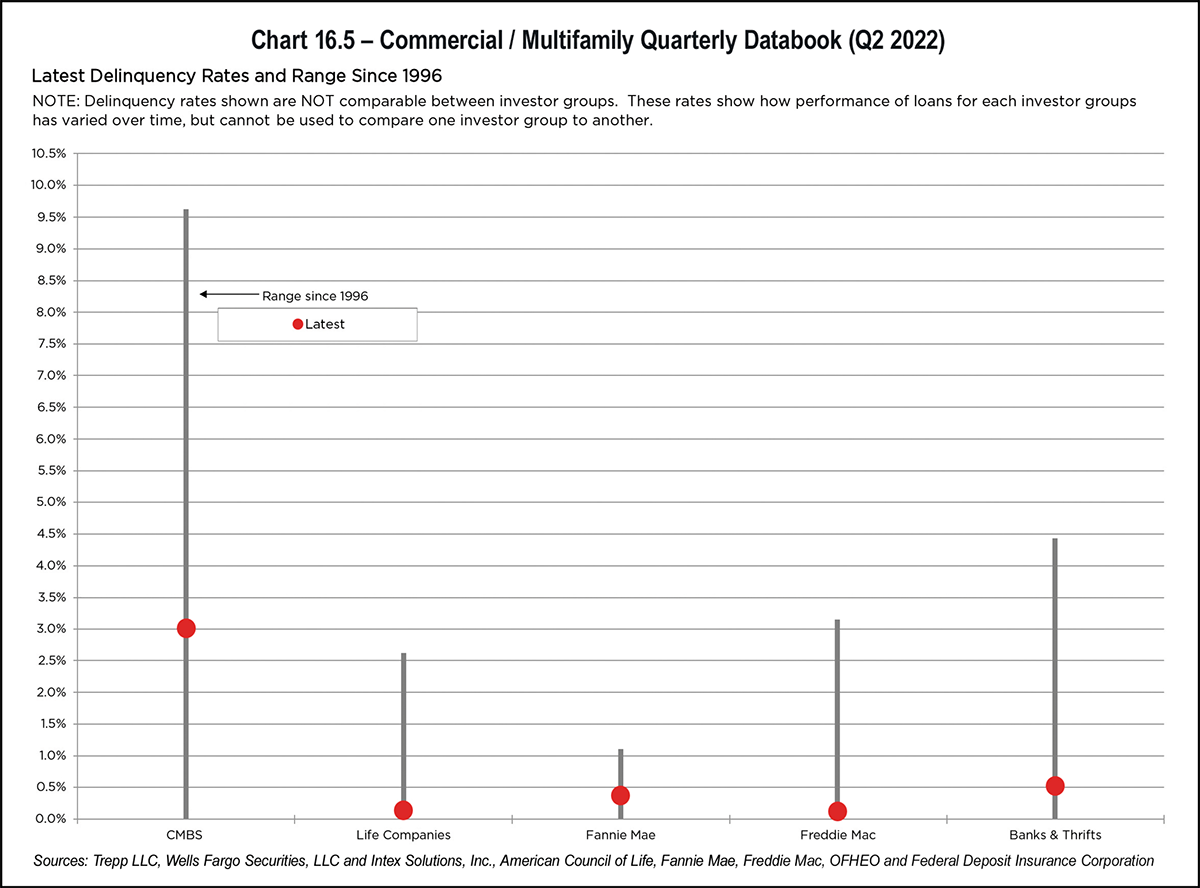
Since there is no cash flow during construction and breakeven doesn’t occur for some time after Certificate of Occupancy, construction loans are inherently more risky. Lenders increasingly look to make loans primarily to guarantors with strong balance sheets and significant development experience, in addition to requiring significant depository relationships.
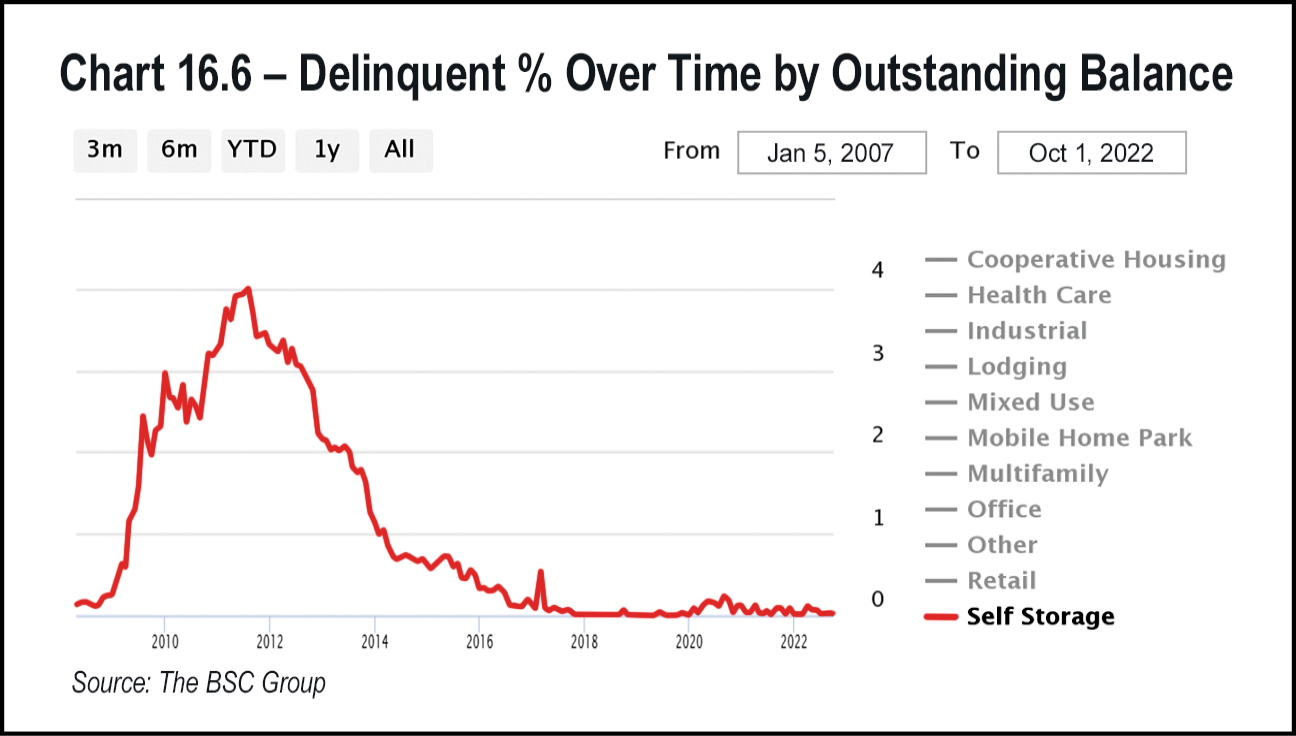
It is important to arrange an upfront interest-only period until the property can cover amortizing debt service payments. This is coupled with an interest carry reserve until the property breaks even. One of the more costly flaws in development financing is underestimating the required lease-up time, a mistake which can, in a worst-case scenario, sink a development.
Lenders build debt service coverage tests into loan agreements and will stress test a project to see if it can cover interest-only payments after a predetermined number of months following completion. Eventually, lenders will test for principal and interest coverage. In addition to testing for project viability, this doubles as a lender safeguard.
The importance of thoughtful budgeting before beginning a project cannot be overstated. A feasibility study is essential; borrowers must go above and beyond to understand the market, including market rents and the competitive landscape, both in terms of existing and prospective projects.
Bridge lenders came into focus following the 2008 recession and were competing for deals more than ever before. In fact, bridge lenders were so inundated with storage deals that they had the luxury of setting more restrictive loan minimums. While these minimums can prove challenging for borrowers with smaller transactions, they are not uniform and shouldn’t discourage borrowers from seeking bridge debt.
Bridge loans are often non-recourse in nature and can be originated to include a fixed or floating interest rate, with flexible prepayment language. They will commonly involve three-year terms with extension options exercisable for a fee if the loans are performing. Rates vary significantly, but at the time of this writing, spreads range from roughly 300 and 600 basis points above SOFR. The loan fee structure is commonly referred to as “one in, one out,” because these lenders commonly charge an origination and exit fee of 1 percent of the loan amount.
Bridge loans are utilized for assets which are not producing stabilized cash flow; therefore, bridge lenders adopt a more forward-looking approach. In contrast to permanent lenders who are most concerned with in-place DSCR or Debt Yield, bridge lenders work carefully to understand the terminal or take out debt yield to inform their lending decision. One of the most significant shifts in bridge underwriting in recent years has been a move away from trended rent projections. In other words, lenders are not buying into double-digit rent growth to support the viability of a transaction. Instead, they will apply a stabilized vacancy to in-place rents or moderate rent growth over the loan term.
Assets requiring bridge loans are not in a position to cover interest-only debt service payments at origination, let alone amortizing payments. Consequently, bridge loans are structured with interest shortfall reserves to increase the likelihood of success of a borrower’s business plan. In some cases, these loans feature future funding components. Lenders may require additional collateral such as a cross-collateralization with another asset to get comfortable with the deal. This requirement provides additional credit enhancement for the lender. A bridge loan is not an appropriate long-term debt solution; however, it can be a flexible interim financing option. Even if interest rates decline in 2024, there is no doubt bridge loans will remain an important source of capital for certain storage borrowers.
Bank loans normally feature one- to five-year terms but can offer terms of 10 years or greater. Amortization schedules tend to be on the conservative side at 20 or 25 years. Despite historically being able to offer as high as 80 percent leverage, today it is rare for a bank to comfortably exceed 75 percent leverage given DSCR constraints.
Banks will generally require personal recourse guarantees on almost all loans; however, the amount of recourse may be reduced or eliminated for low-leverage loans and for institutional sponsors where active relationships exist. Transaction costs for bank deals are generally reasonable, and prepayment structures can be negotiated.
Credit unions have been an increasingly relevant financing source for self-storage borrowers in the face of rising borrowing costs. Credit unions are similar to banks with several key differences. Banks tend to be extremely relationship driven, while credit unions may be more transactional in nature. Some credit unions exhibit a greater willingness to lend outside of a predefined footprint and are comfortable lending without a preexisting relationship. Credit unions rarely have deposit requirements and may be in a position to offer better interest rates than other lenders given their status as not-for-profit institutions.
While credit unions have shined in the face of rising interest rates, this is not to assert that credit unions are better than banks. In fact, there are situations where credit unions fall short or simply are not an option for borrowers. Indeed, credit unions can be stricter on cash-out requests and are more likely to quote a tighter amortization period. Holding interest rates constant, shorter amortization schedules result in higher debt payments, even while accelerating principal paydown. Finally, most credit unions are not equipped to handle construction or other transitional deals that require draws and the carrying of interest.
During the pandemic, SBA financing was a great alternative for deals that would have otherwise landed in CMBS or another similar product. SBA products are priced over the Prime rate, which was quite compelling at that time but has since skyrocketed to 8.5 percent since March 2022. Both products were once routinely priced at a fixed rate over Prime, but banks originating SBA debt have primarily moved to a floating rate product recently. The floating rate product will benefit borrowers, assuming rates decline in 2024 and thereafter. The SBA maintains a maximum exposure per borrower of $5,000,000 (with some exceptions) on the government guaranteed portion. As a result, the 7a loan program typically maxes out at $5,000,000, while the 504 program, which includes a bank originated first mortgage in addition to the SBA piece, can handle larger transactions.
7a loans, similar to 504 loans, can be utilized to fund acquisition, refinance, and construction. These loans are commonly floating-rate products structured with a Prime-based interest rate that resets quarterly. 7a loans include a fully amortized 20- or 25-year schedule and have a 5 percent-3 percent-1 percent prepayment schedule; the 7a program notably features a more compelling prepayment schedule than its 504 counterparts.
In construction lending, it is becoming more difficult to finance projects through the SBA at desired leverage points. Although SBA loans technically provide leverage of up to 90 percent, many projects pencil only at lower leverage. This is a result of rising interest rates in conjunction with the SBA requiring that a project break even on an amortizing basis within 24 months of receiving the Certificate of Occupancy.
Interest rates for SBA loans are priced over Prime, ranging from 0 percent to 2 percent over, or 8.5 to 10.5 percent all in. Borrowers are subject to guarantee fees at a percentage of the loan amount on top of standard closing costs. SBA loans are document-intensive and time consuming to close. When applying, find a lender that is Preferred Lender Program certified. This allows the bank to approve loans on behalf of the SBA, which can speed up closing. A shift in SBA operating procedures was recently implemented which opens a previously closed door for borrowers planning to engage larger third-party management companies, such as a REIT. SBA loans have proven beneficial to many borrowers and will continue to be a useful option in 2024.
Interest rates for CMBS transactions, like most loan products, are computed by adding a risk spread premium to a benchmark index such as a U.S. Treasury rate. For example, if spreads were in the 3.0 percent range and the 10-year treasury rate is 4.0 percent, the corresponding rate on 10-year CMBS money would be 7.0 percent. CMBS interest rates are priced at 250 to 350 basis points over the applicable Treasury at the time of this writing. There is an option to buy down rate for a set fee (1 percent buys down the interest rate by roughly 15 basis points for a 10-year deal, while the same 1 percent buys down rate roughly 25 basis points for a five-year product). These lenders prefer primary-market deals, but they will compete for loans in secondary markets as well. Location is one of several qualitative factors that can impact base pricing in CMBS.
CMBS loans are 10-year fixed-rate loan products including a 30-year amortization schedule following any interest only associated with the loan; five-year CMBS loans are available but may carry a pricing premium. There has been a proliferation of five-year CMBS deals in direct response to market demand. This shift in conjunction with six months open prepayment at the end of the term increases flexibility and could continue to be a popular option as rates decline. Borrowers can utilize the CMBS loan product to achieve several structural advantages such as non-recourse, multiple years of interest only or to facilitate a cash out. Historically, borrowers could achieve 75 percent leverage, however, higher interest rates have put downward pressure on leverage as deals are commonly DSCR constrained. Finally, the CMBS loan is a product which can close quicker than many of its counterparts. All of the above traits are distinguished advantages of the loan type, but the CMBS product is not without its drawbacks.
Restrictive prepayment options limited to yield maintenance or defeasance are pitfalls of the product type. Defeasance is the act of replacing the collateral that generates the anticipated stream of debt service payments, often with a portfolio of varying maturity, multi-denomination securities. Defeasance can be difficult to execute given the time and complexity required to secure the replacement collateral. Both defeasance and yield maintenance penalties are less severe in a rising interest rate environment. In fact, the current interest rate environment may present a compelling opportunity for those looking to refinance a CMBS loan as the rates of the day are often significantly elevated compared to the rate attached to the loan being prepaid.
CMBS normally features higher closing costs and more rigid loan documents than other loan types. However, a few CMBS lenders offer competitive fixed closing cost programs between $25,000 and $32,000 all-in for loans up to $10 million as part of a small balance loan program.
Because CMBS loans are pooled together and sold as a securitized bond in the secondary market, the loan documents have many non-negotiable standard clauses and requirements. Additionally, the loans are most often serviced by a third-party, rendering any post-closing structural changes more challenging.
Given their conservative nature, Life Companies put an emphasis on stressing cash flow and cap rates, in addition to mandating higher going in DSCRs. It is no surprise that these loans are frequently constrained at lower leverage than their counterparts. Many Life Companies have historically preferred larger loans ($10 million and up) but will stretch down for the right deal to compete with other loan products.
Life Companies can quote terms ranging from five all the way up to 30 years, with a variety of amortization schedules available. Life Company products are often quite reasonable from a transaction cost standpoint, and these lenders can negotiate flexible prepayment terms. The lenders may offer a forward rate lock agreement with a signed application at their discretion. Given a core focus on conservative underwriting and low leverage, it may not come as a surprise that Life Companies’ interest rates are currently the lowest in the market. At the time of this writing, Life Company interest rates vary depending on the lender but are among the only products which can be originated with an interest rate in the 5s.
Life Company loan products have been a great source of capital for the self-storage industry, assuming storage properties meet the lenders’ criteria. It is worth mentioning that almost any structural feature one can think of could be a point of negotiation if the deal is favored by a Life Company. Because of the tremendous track record of self-storage against other property types, insurance lenders have and will continue to have an appetite for self-storage in 2024.
Many recent developments have been built based on operating projections that are no longer adequate to make monthly loan payments or achieve the expected stipulations given the increase in interest rates. Additionally, a softening of rents may lead to a decline in operating income for more stabilized assets, making it more difficult to pay debt service. Whether because of rising rates, delays in construction, increases in development cost, or downward pressure on rental rates, some deals will certainly end up “stuck in the mud,” and in need of some creative solutions. This is all in addition to the situation outlined in the capital stack example relating to stressed debt on stabilized assets.
Subordinate debt is a blanket term for additional financing with a lower priority to cash flow than the first lien mortgage. This type of debt can provide more capital and higher leverage to help bridge an equity gap. Subordinate debt lenders in the current market will take a capital position between the first mortgage cut off, reaching up to 85 percent LTV or sometimes even higher.
By reaching higher in the capital stack, subordinate lenders inherently assume greater risk and therefore expect a higher rate of return. Interest rates on subordinate debt available in the market today range from 10 percent to 20 percent. Subordinate debt lenders can be flexible and willing to structure payments to match the cash flow projections of the specific asset. For example, the debt might feature interest-only payments for several years before any amortization. In some cases, lenders offer interest only for the full term.
The two most common subordinate debt products are junior mortgages (B-Notes) and mezzanine financing. Mezzanine lenders provide subordinate debt that is secured against an ownership position in the borrowing entity, rather than the mortgaged property itself. Conversely, B-Notes take a secondary debt position secured by the mortgaged property as collateral for the loan. This mortgage is junior in priority to the first mortgage or senior note, (the A-Note), hence the nomenclature.
There are situations where cash flow erosion is dramatic enough that the available cash from operations no longer supports the debt service payments. In extreme cases, the corresponding value decline may be so severe that the sponsor’s equity is completely eroded. In these situations, the sponsor may be required to infuse new equity into the transaction. If the sponsor does not have the equity, one option is to seek joint venture equity. Joint venture equity is selectively available to owners in transactions where there is upside, stemming from a development or recapitalization scenario and resulting in enhanced cash flow and consequent value.
An experienced broker understands how to properly package a loan request and appropriately position the asset to the lending community. Lenders faced with a stack of potential deals are more likely to engage in a succinct, digestible presentation than a collection of scattered documents. A broker’s expertise is the result of being in the market every day and constantly evaluating available debt products offered by lenders.
Brokers charge for their services, but many borrowers will confirm that the fee paid to a competent broker is worth the peace of mind that comes with a smooth execution. Finally, in addition to aiding with the closing, hiring a broker also frees up borrowers to pursue value-add strategies such as acquiring new facilities or expanding existing ones.
There is room for improvement in both the underlying indexes and credit spreads to bring interest rates to a more palatable level. Even if interest rates do not drop significantly in 2024, opportunities remain to finance existing and new projects. Self-storage has historically thrived in the face of adversity. In fact, the asset class has reacted positively to material changes in economic conditions many times. Storage fundamentals have endured despite pullback from staggering growth post-pandemic. Although 2023 cultivated financing challenges via rising interest rates, there are numerous reasons to be cautiously optimistic in 2024.
elf-storage development has been appealing to many industry investors, owners, and operators over the past few years, following years of minimal development from 2009 until 2016 and solid fundamentals. Development activity sunk as low as 12 million net rentable square feet annually in 2011 and 2012, or around 1 percent of existing supply. As net operating income grew much faster than most other property types during this period, development activity started to pick up in the middle of the last decade and reached a peak in 2018 and 2019 with over 70 million net rentable square feet per year, or over 5 percent as a percent of stock. With over 4,598 properties or 415 million net rentable square feet delivered since 2017, this has been one of the most active development cycles in the history of the industry. Despite the new supply, the industry has managed to maintain occupancy levels over 90 percent, a testament to strong demand patterns that for years have outpaced new supply. Looking forward, Yardi Matrix projects supply will remain elevated, yet as a portion of existing supply, annual deliveries will be below the long-term average of 4 percent. See Chart 17.1 below.
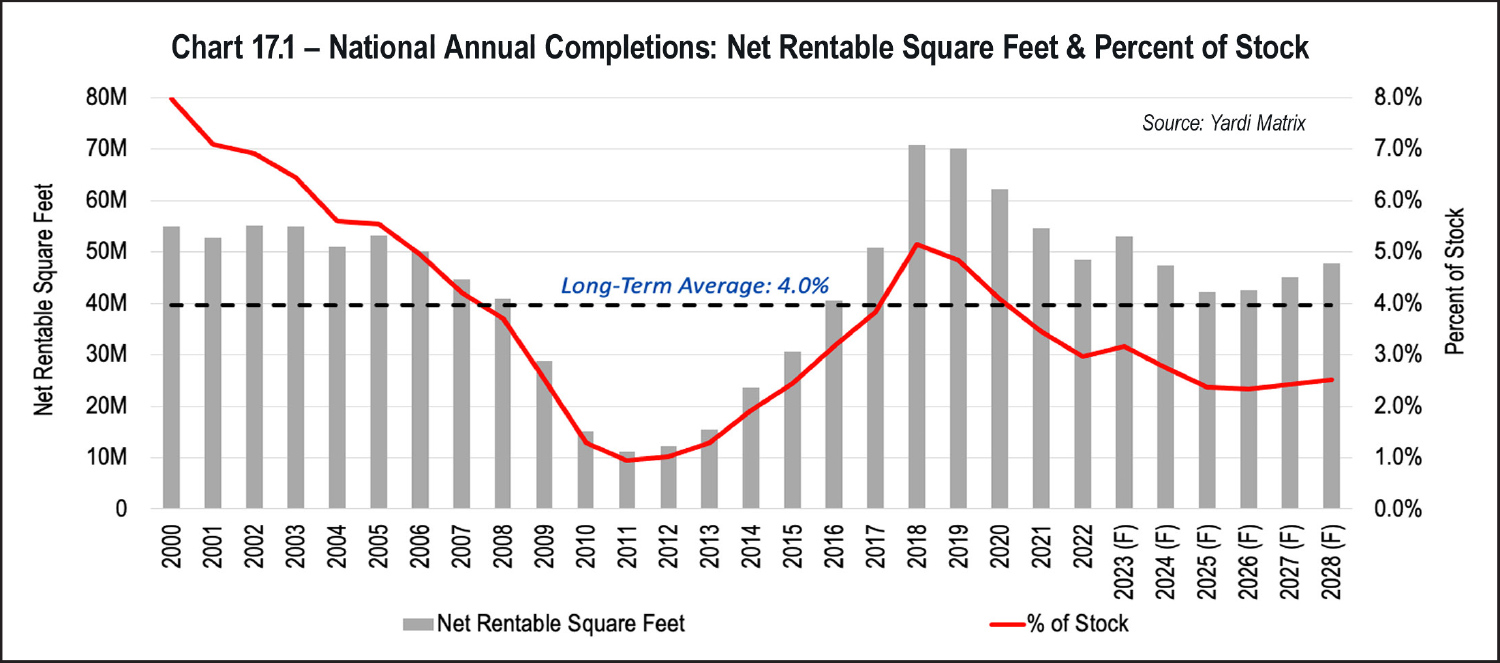
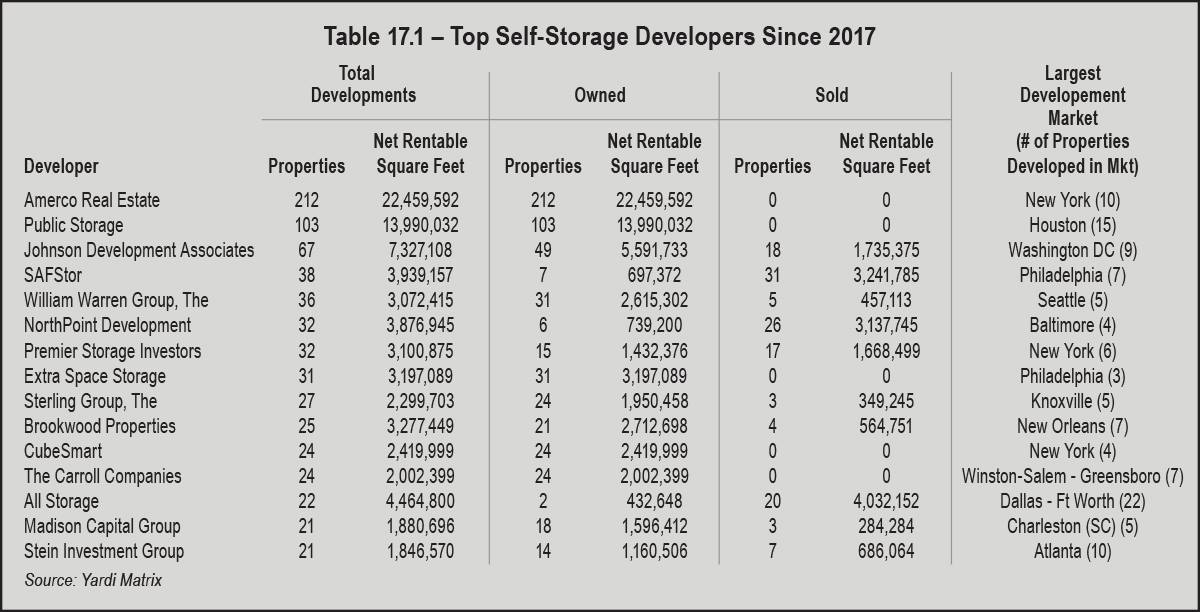
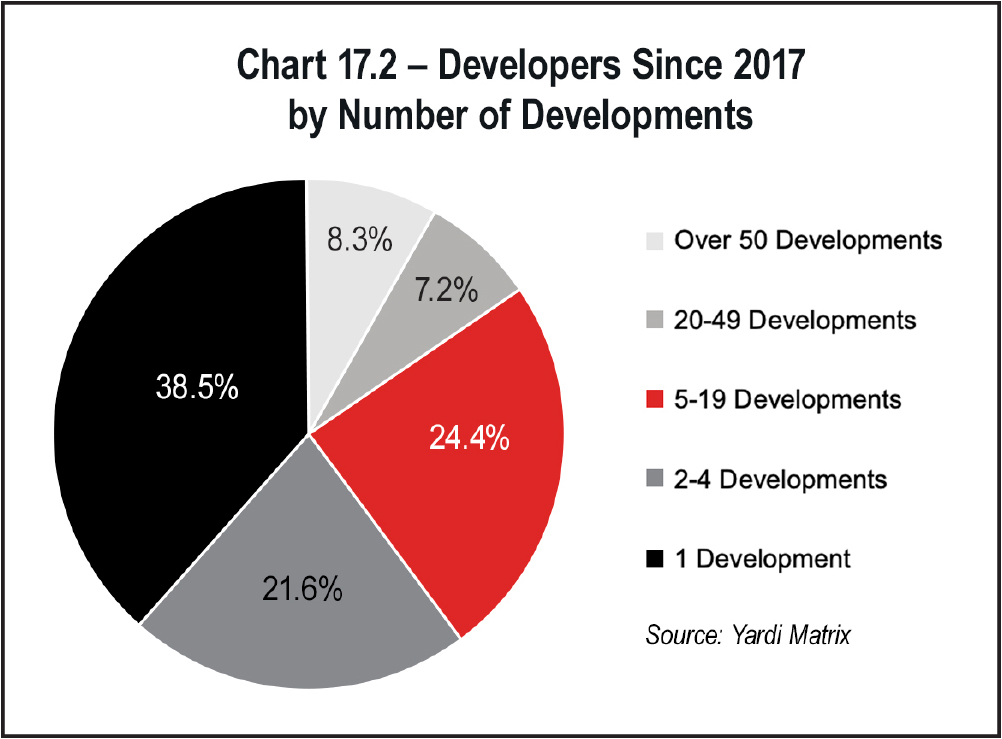
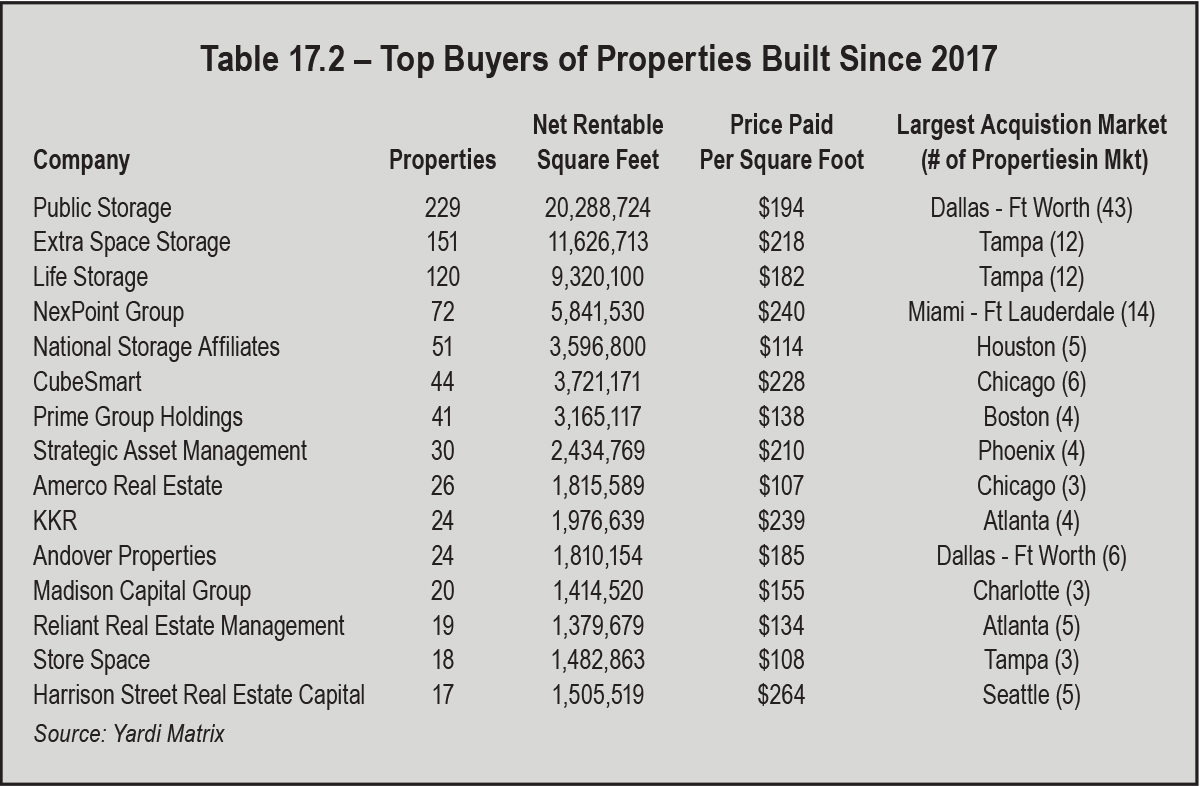
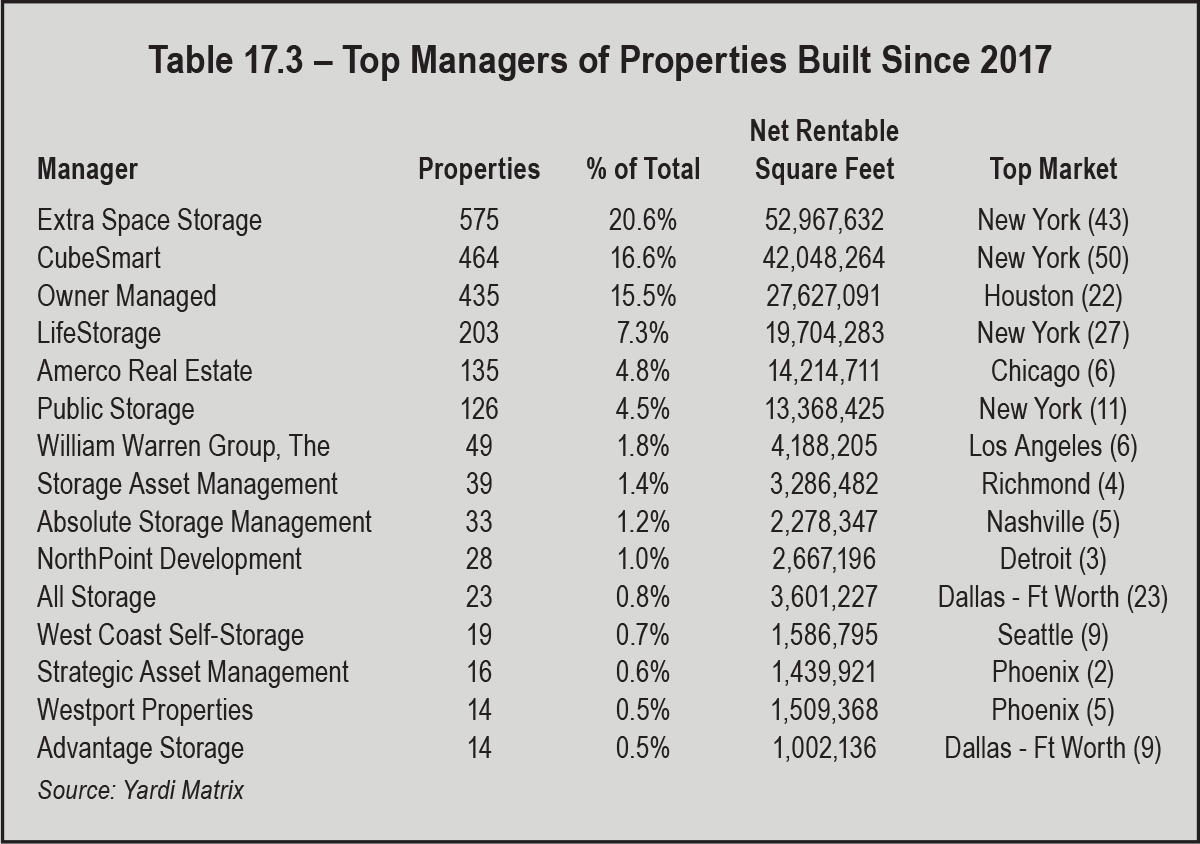
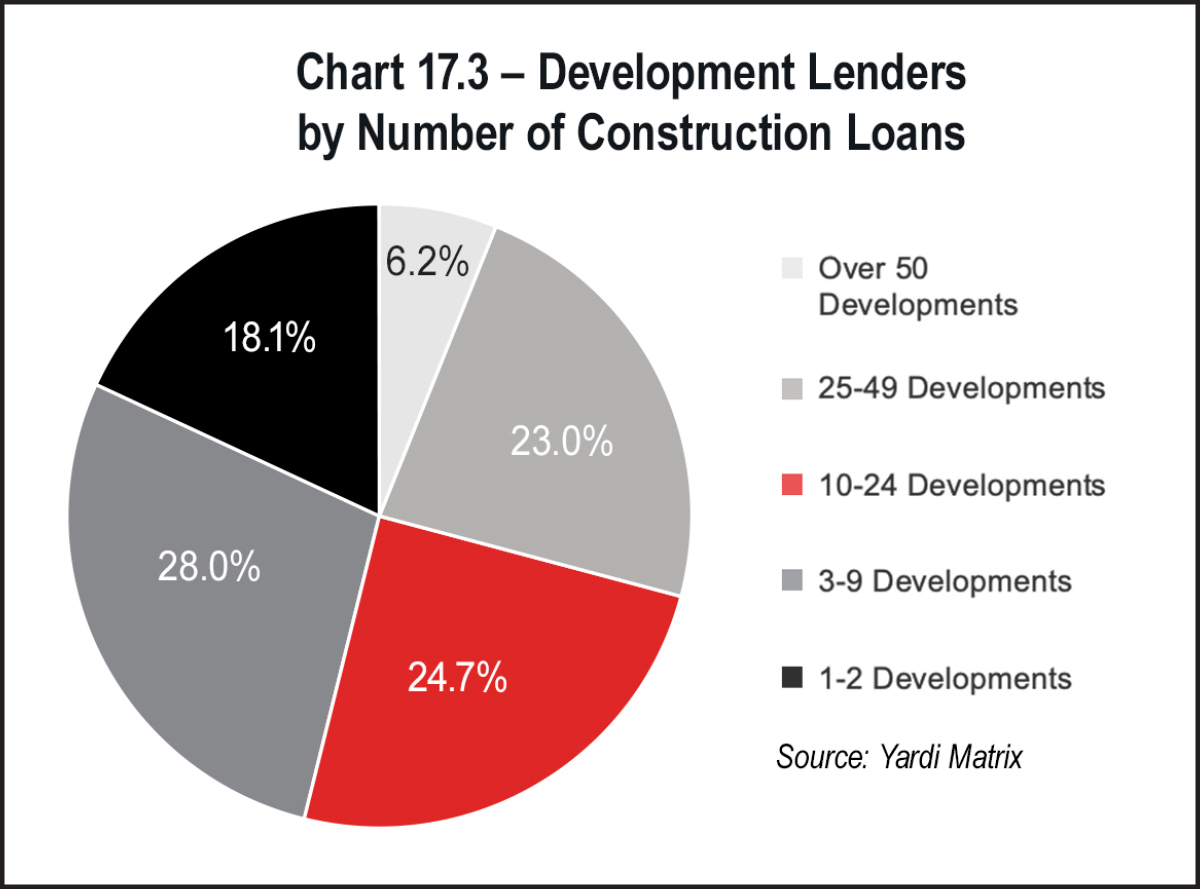
Many developers have enlisted larger operators, usually the self-storage REITs, to assist with planning and to lease up the properties for a variety of reasons. Many times, lenders to self-storage developers will request third-party management, and the REITs have responded by rapidly expanding their third-party management platforms. The self-storage REITs have managed nearly 50 percent of all properties delivered since 2017. This has resulted in consolidation of management in the industry, with the REITs expanding their third-party management portfolios by 198 percent, from 767 stores in Q4 2016 to 2,289 stores in Q2 2023. CubeSmart and Extra Space have largely been the operator of choice for many developers; they have by far the largest third-party management platforms, managing a total of 1,705 properties for third parties as of Q2 2023. In many cases, this has helped these companies build market intel, sometimes in new markets and submarkets for them. It also has helped companies gain access to off-market deals, acquiring the third-party managed stores from developers during or following their lease-up. New York has been one of the most active markets for development this cycle, and the REITs have been the manager of choice for new stores there. See Table 17.3 above.
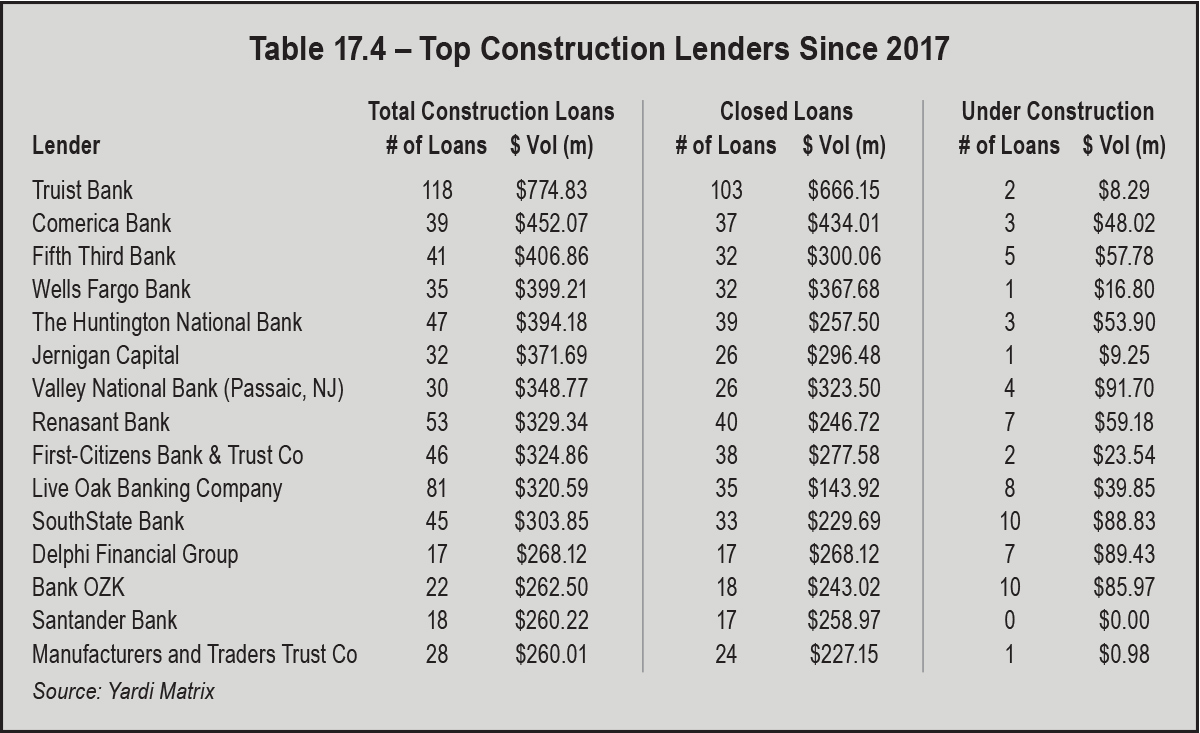
Looking forward, much of the supply under construction or in planning today is still coming from smaller development shops and individuals with limited experience in the sector. The largest developers today include some of the same companies that were top developers over the past few years, as well as newer upstarts that have recently raised large amounts of capital, like InSite (dba SecureSpace Self Storage), DXD. Capital, and Store Space. The development landscape nationally is still incredibly fragmented, with nearly 60 percent of 696 ground-up developments or conversions under construction coming from developers with only one project under construction, and 76 percent of new developments under construction coming from a developer with three or less projects. Of the 1,544 planned self-storage developments, over 64 percent are from a developer with one project; 84 percent are from developers with less than five developments in planning. Again, Amerco, InSite, and Public Storage are the leading developers with projects in planning, and no other developer has more than 12 properties planned. See Tables 17.5 and 17.6 below.
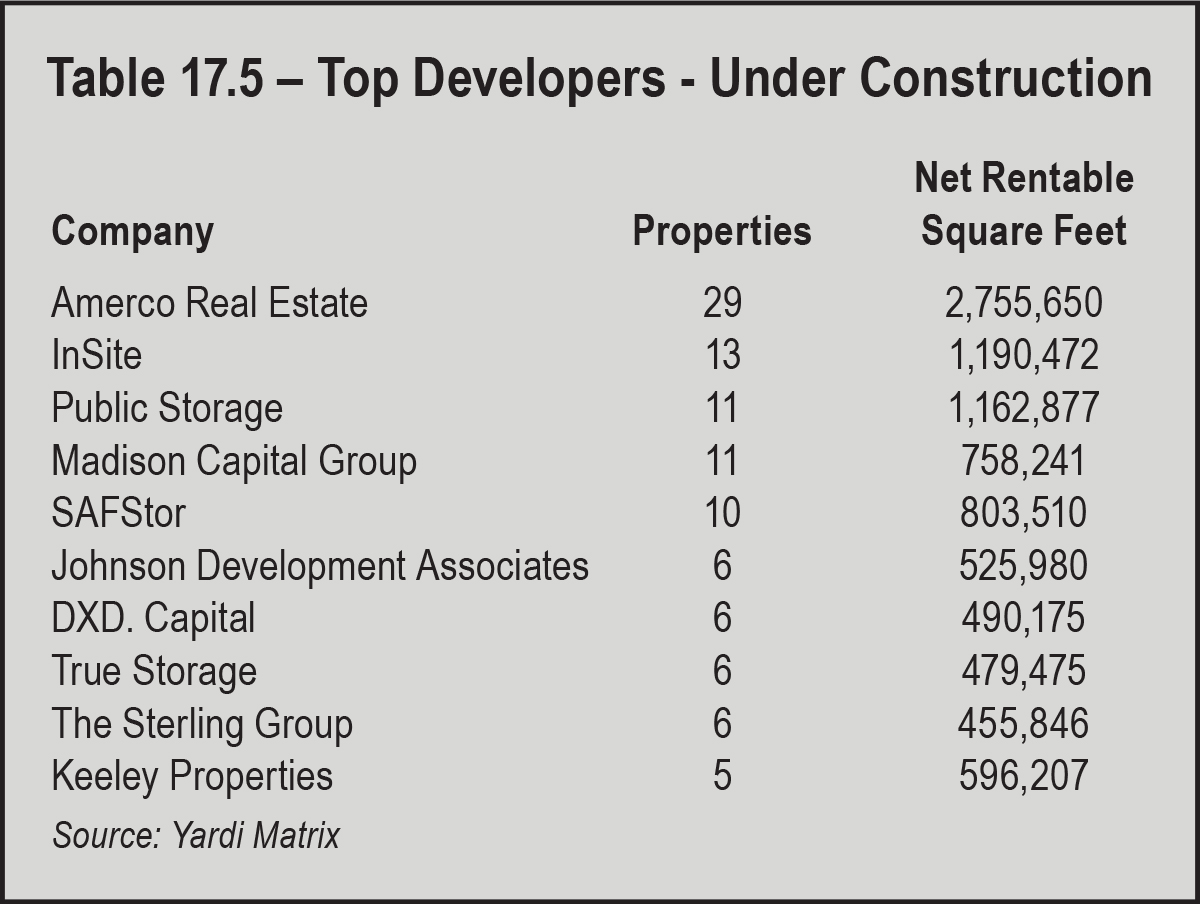
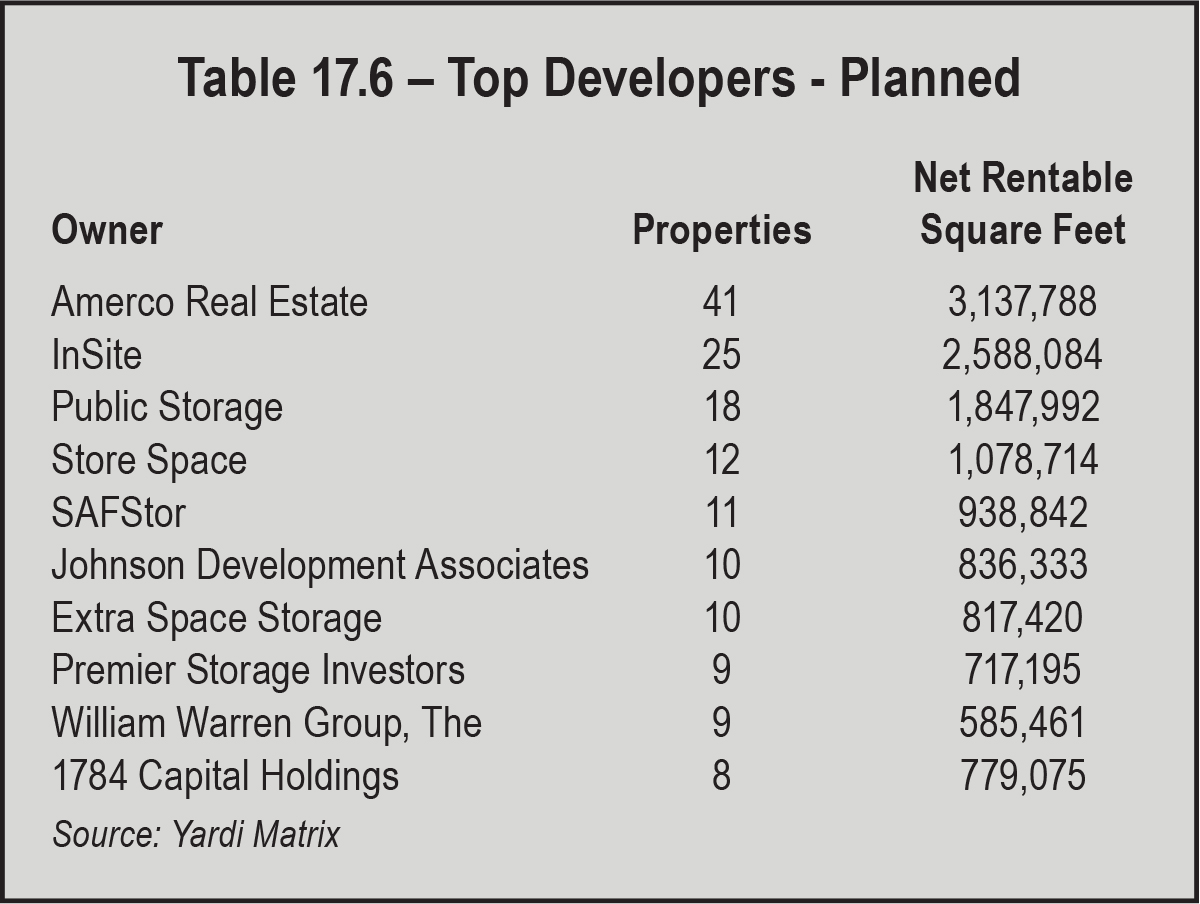

proper feasibility study should begin with a market study. A market study determines if the trade area is oversupplied, undersupplied, or at equilibrium. It should also quantify the amount of demand in the trade area. If there is sufficient demand, phase two is a feasibility report.
In our appraisal practice at Newmark, we complete these two-phase analyses for clients and also review many feasibility studies. Unfortunately, many of the reports are based on rules of thumb or estimates unsubstantiated from market data. These analyses should include multiple methodogies to determine demand and feasibility. This section will summarize our two-phase process of a market study and a feasibility report. For clarity, we have used an example prior to the current trend of rising interest rates.
As outlined in “Self-storage Economics and Appraisal,” published by the Appraisal Institute in 2012, self-storage economics is the analysis of the market conditions that affect value using both qualitative and quantitative techniques. To evaluate the key market conditions for self-storage, an appraiser must perform a series of related analyses:
- An analysis of existing supply
- A forecast of stabilized demand, resulting in a conclusion of the state of the trade area (oversupply, undersupply, or equilibrium)
- An examination of the competitive position of a facility in relation to the competition
These conclusions of market conditions and competitive position are critical to the economics of a self-storage facility. A review of rent comparables or a sample of the competition in the trade area would be insufficient analyses. Analyzing the entire supply in a trade area is critical to the market condition conclusion, which forms the basis of forecasting long-run rents, long-term or stabilized vacancy, net operating income, and capitalization and yield rate conclusions. Ultimately, the market condition conclusion is the foundation of the valuation conclusions. Fortunately, the dynamic economic and demographic data used in the analysis of self-storage economics is readily available to appraisers.
A comparison of local, regional, and national supply data underscores the need for local trade area analysis to provide an accurate snapshot of the self-storage market for a particular facility. National market data and trends are useful tools in general, but local trade area analysis is the essential starting point for analyzing a self-storage facility. For example, market equilibrium is measured in terms of a balance between supply and demand in each trade area. To analyze the subject trade area, four analyses are presented: two quantitative and two qualitative.
Quantitative Models
The quantitative analyses are based on a quantitative forecast of stabilized demand using our proprietary, econometric model, and an analysis of the cost of occupancy (or the ratio of average household income to average self-storage rent). Determinants of the self-storage market relate to the forces of supply and demand, as is the case with other types of real estate. The analysis of demand generators, however, is focused on four key variables:
- Population
- The percentage of renters
- Average household size
- Average household income
Similar to other types of trade areas, a self-storage trade area is “the geographic area immediately adjacent to the property from which the retail establishment obtains 60 percent to 70 percent of its total customers.” Such a detailed gravity model analysis is beyond the scope of most appraisal assignments, but these principles can be applied when determining the subject trade area.
A typical primary market is described by the population density and the proximity of existing supply. As for land use patterns, the availability of vacant land parcels for self-storage development is limited in many cities. Furthermore, self-storage developers may have difficulties obtaining entitlements because some planning and zoning authorities perceive the tax and job base to be relatively low. Cumulatively, these factors suggest that a review of several local trade areas is the best tool for measuring the market.
Under these parameters, analysts typically define the trade area of a self-storage property using a series of rings with a radius of 1.0 to 5.5 miles as outlined in survey research. In some cases, a ZIP code study of existing tenancy may assist in defining the proper trade area. For the purposes of analysis, we have used a trade, consider the typical trade area defined as a 5-mile radius.
Sources used in local trade area analysis include public records and primary survey research. The data sources vary in scope, method, and precise geography of research but are considered reasonable indicators of current trends and conditions in the subject trade area because the data has been supported by field research. For the subject, we utilized REIS, PAC-COMM, Radius, and primary survey research. The supply (competition and subject) of self-storage is summarized in the Local Market Inventory and Self Storage Supply tables below.
To test market saturation in a static equilibrium model, a forecast of demand in the subject trade area is critical to the determination of project feasibility.
Demand
Self-storage demand is measured in terms of square feet per capita. As a test of reasonableness, demand is estimated for the subject based on a simple econometric model developed by the Newmark Self Storage Group for self-storage properties. After mining demographic data for meaningful mathematical relationships for self-storage, there are four characteristics key to demand: population, percentage of renters, household size, and household income. The data is analyzed in a regression model detailed in the Demand Forecast Table below. Using multi-variable regression, the variables correlate (not cause) to demand.
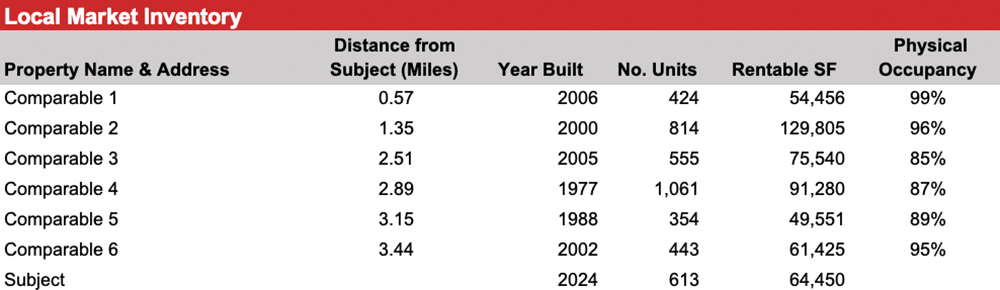
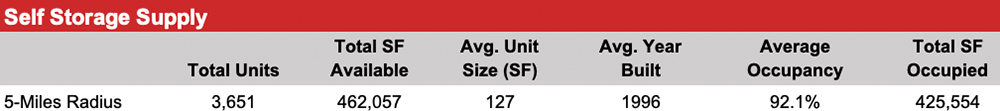
Market Equilibrium – Summary Of Econometrics
The Self Storage Market Equilibrium table on the opposite page shows the total supply (existing supply plus new construction), less occupied square feet in the trade area, results in the available supply in rentable square feet. Based on our analysis of the trade area, we have forecast a trade area vacancy, which is the amount of rentable square feet that will remain vacant. The result is the remaining rentable square feet available in the trade area shown as a negative in the table. Unsatisfied demand is the result of the multi-variable regression. Adding this to the remaining supply results in the trade area demand; if the result is a negative, then the trade area is oversupplied.
Cost Of Occupancy
As a test of reasonableness, we have calculated the cost of occupancy for the subject based on market rents (average annual unit price of the market rent forecast divided by the average household income of the trade area). In this case the cost of occupancy is below 2.00 percent. For self-storage, we note trade areas below 3.00 percent generally have room to improve rental rates (revenue enhancement). Quantitatively, the market appears to be undersupplied within the 5-mile radius, based on local demographic factors.

The benchmark data is presented in the Local Market Inventory below.
The subject rentable square feet per capita is above the CBSA, state, and national average, indicating potential oversupply. However, physical occupancy in the trade area is 92.10 percent. Overall, this indicates undersupply conditions in the subject trade area.
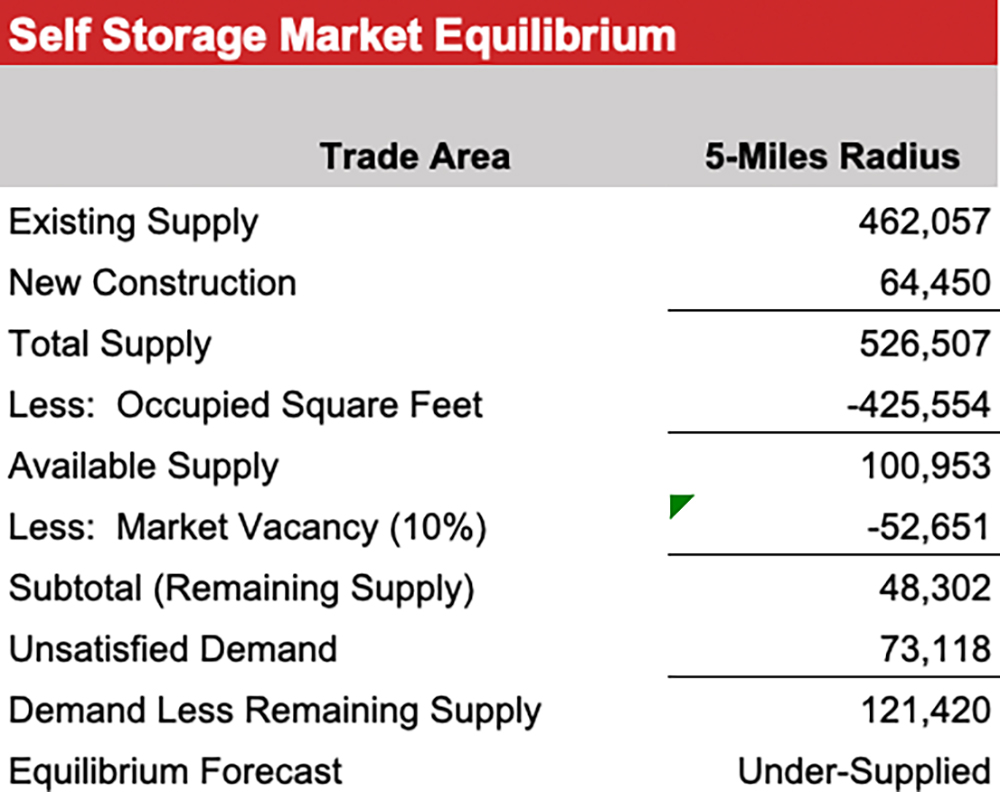
To assist feasibility analysis, we utilize the income capitalization approach. This approach to value views the subject through the eyes of a typical investor. It is based on the premise that the higher the earnings for a property, the higher its value. This approach converts anticipated future benefits or dollar income to be derived from ownership into a present value estimated through the capitalization process. Application of the approach includes the following steps:
- Survey the rents of comparable properties to estimate an economic market rent for the subject property. For self-storage, this step should include an analysis of each unit based on asking rent and actual rent to compare to market rent.
- Estimate operating expenses (including economic vacancy) applicable to the subject ownership, including an analysis of the trailing three-year financials (when available) to compare patterns in effective gross income and operating expenses.
- Derive net operating income for the subject property.
- Estimate the remaining economic life of the subject based on the market or the investor’s holding period.
- Select the proper capitalization method and rate.
- Capitalize the net operating income into an indication of value.
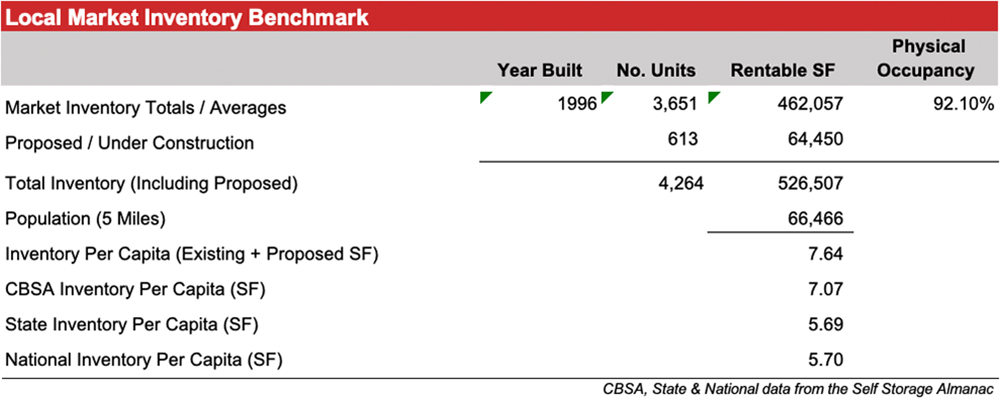
- Direct capitalization is a method used to convert an estimate of a single year’s income expectancy into an indication of value in one direct step, either by dividing the income estimate by an appropriate income rate or multiplying the income estimate by an appropriate factor. Direct capitalization employs capitalization rates and multipliers extracted from the market data. Only one year’s income is used. Yield and value change are implied, but not identified.
- Yield capitalization is a method in which future benefits are converted into a value indication by discounting them at an appropriate yield rate (DCF analysis) or applying an overall rate that reflects the investment’s income pattern, value change, and yield rate.
As an asset class, self-storage was historically not considered institutional grade (although REITs are widely traded). Over the past five years, however, investment analytics for this sector have increased significantly. Consequently, the investment market now relies on both direct and yield capitalization. Due to revenue enhancement, discounted cash flow is typically emphasized in the investment community. Considering all aspects that influence an investment decision for self-storage, both methods are analyzed in this feasibility study.
- Late fees
- Unit insurance (such as renter’s insurance for an apartment)
- Administrative fees
- Truck rentals
- Retail sales of storage items (from the office)
The projection used in this analysis is based upon the budget and market rent, together with our assumptions as to the absorption of the vacant space, market rent growth, and renewal/turnover probability. We begin our rental income analysis by discussing certain aspects of the subject property, namely its occupancy and the quoted rent levels of its various unit types.
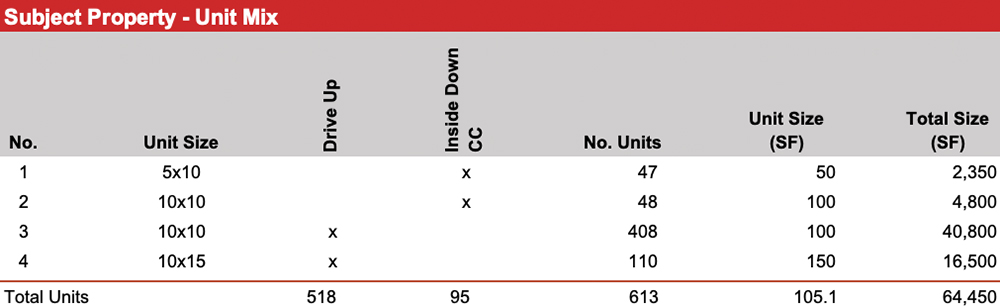
The subject average unit size is 105 square feet, slightly smaller than the average unit size within the 5-mile radius of 127 square feet and the average unit size of the rent comparables of 126 square feet. However, these factors are considered more precisely in the selection of rents per unit and in the occupancy analysis.
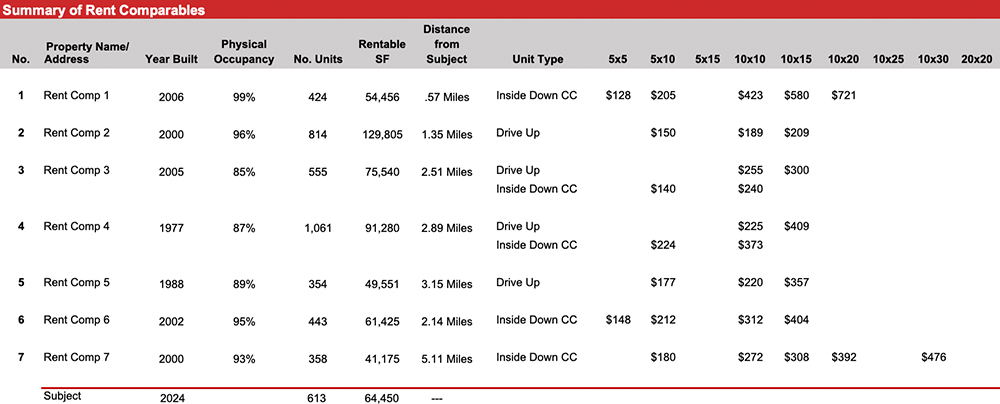
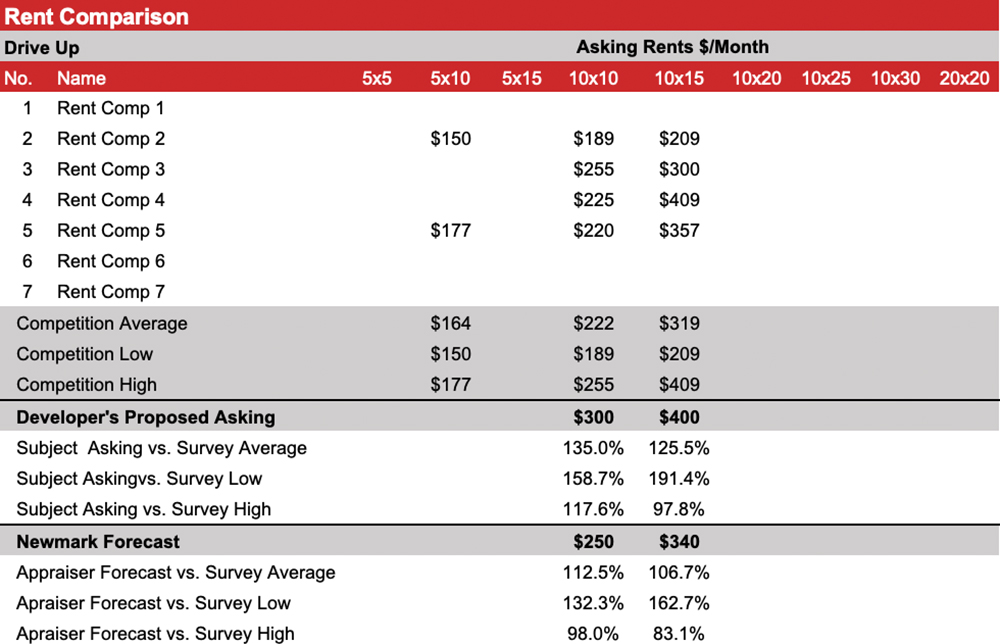
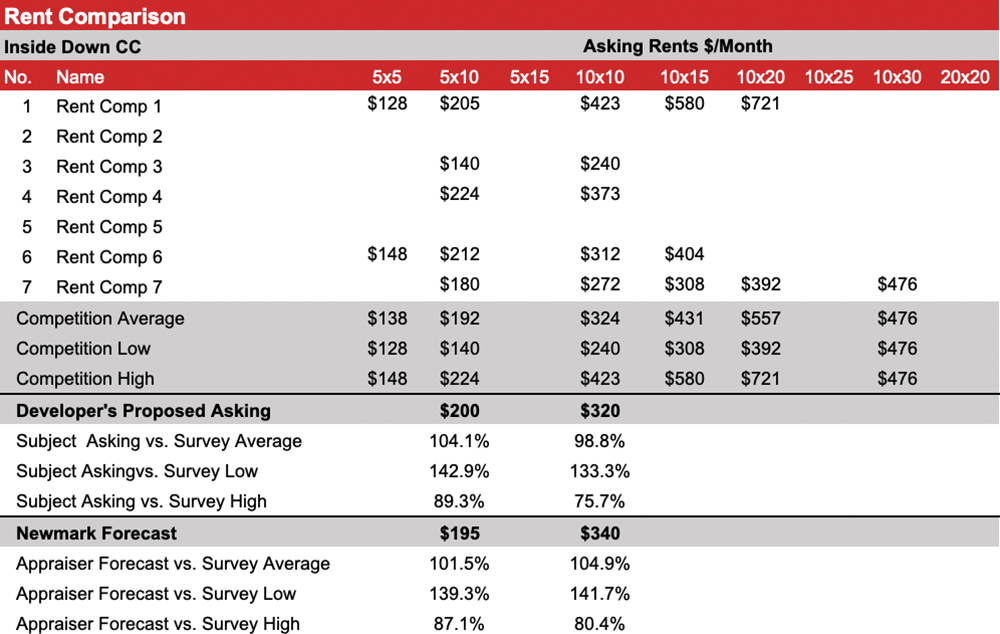
The adjustment of comparable rent data is difficult because textbook methodology for the income capitalization approach is limited, unlike for the other approaches. Nevertheless, rental adjustments should follow a logical and sequential path to derive a reasonable market rate conclusion. Adjustments should account for financial, locational, and physical aspects of the rental data. The seven key variables that warrant consideration for adjustment are:
- Rent basis
- Escalation
- Concessions
- Conditions of rent transaction
- Market conditions (time)
- Physical characteristics
- Location
More important than mathematical equivalencies, however, is actual data. For example, managers were queried about the asking rent on available, vacant units (typical of the industry) to obtain the representative rate of the comparable (and other parameters such as specials, discounts, or other concessions). This data is considered to be a reasonable representation of the market. Rent analysis should consider the elements of comparison, but rents are often best analyzed in chart or table format. Each unit is analyzed and compared to market comparables. The analysis should consider the unit size as well as location within the facility.
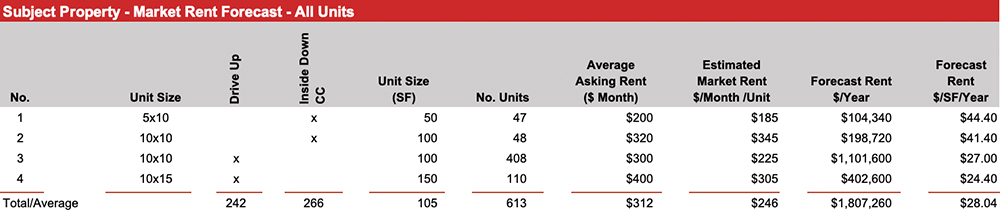
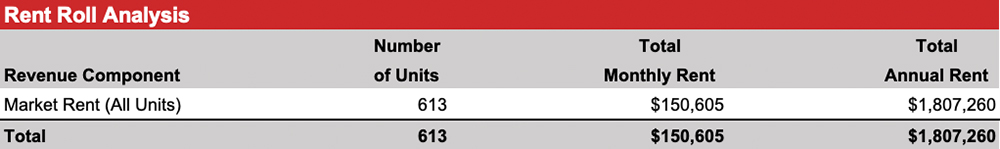
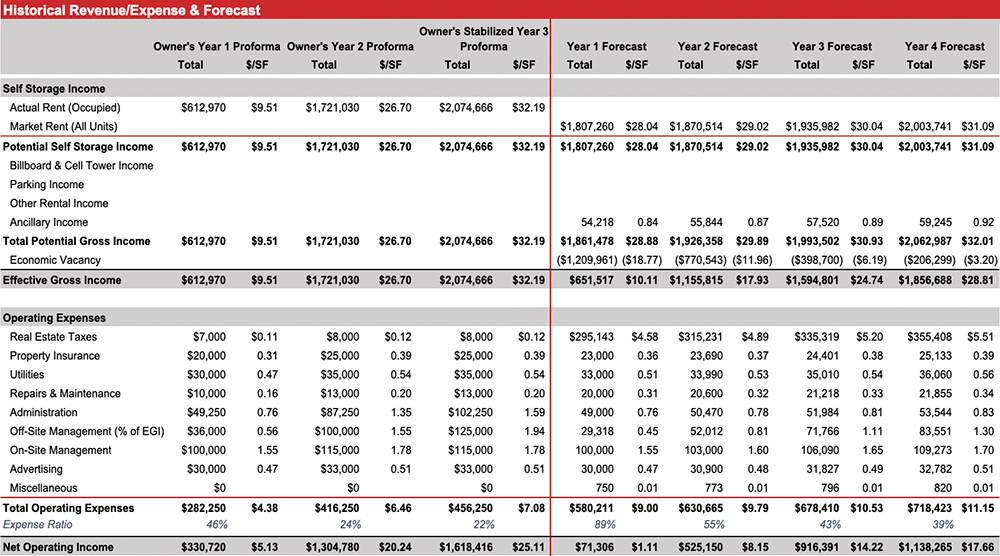
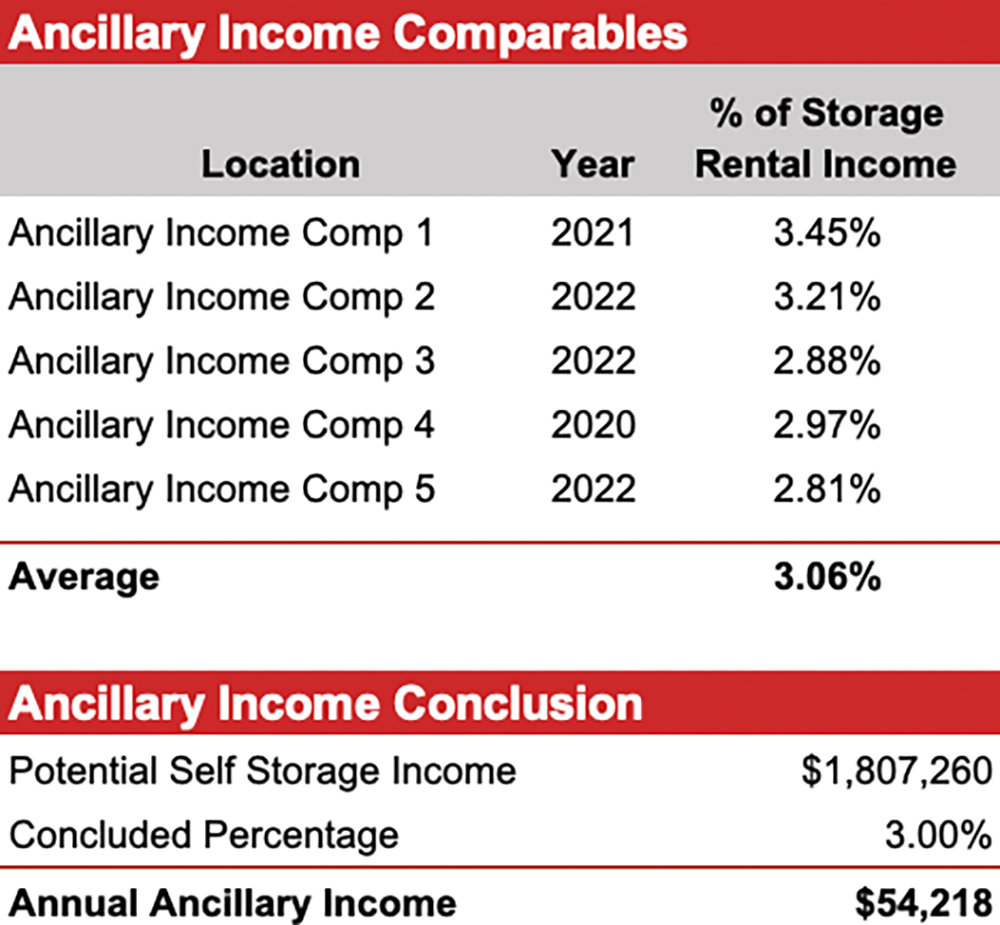
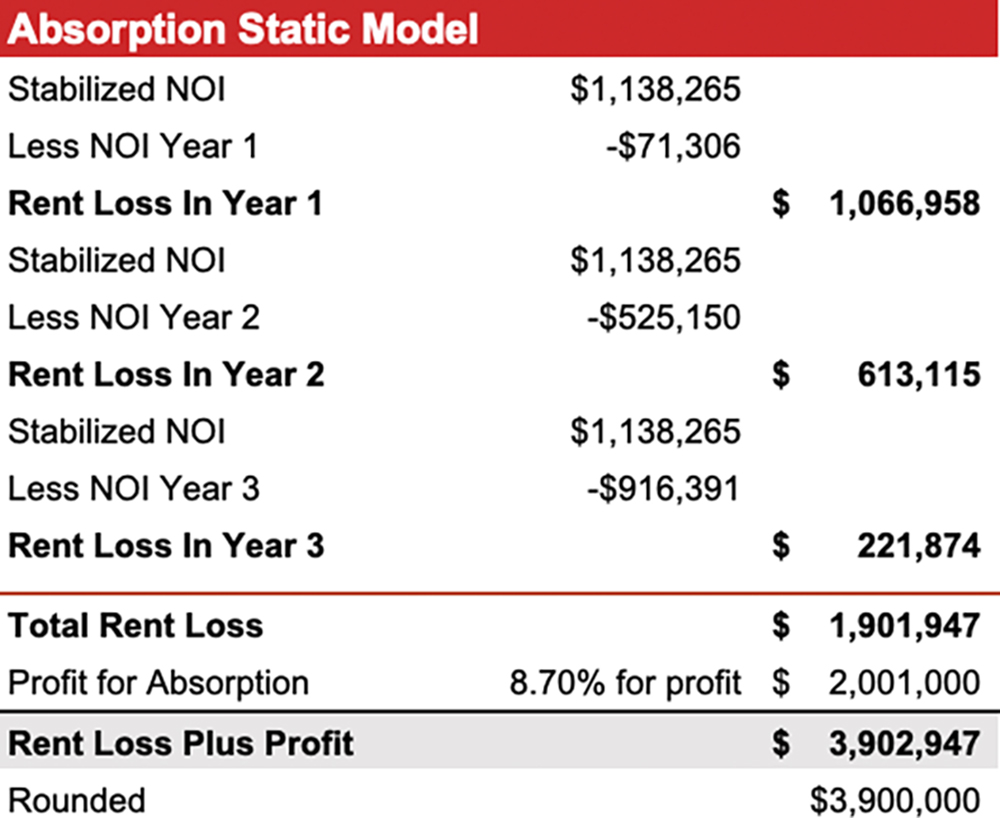
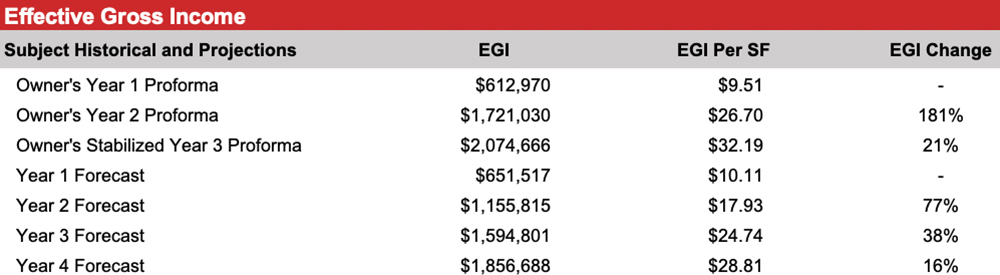
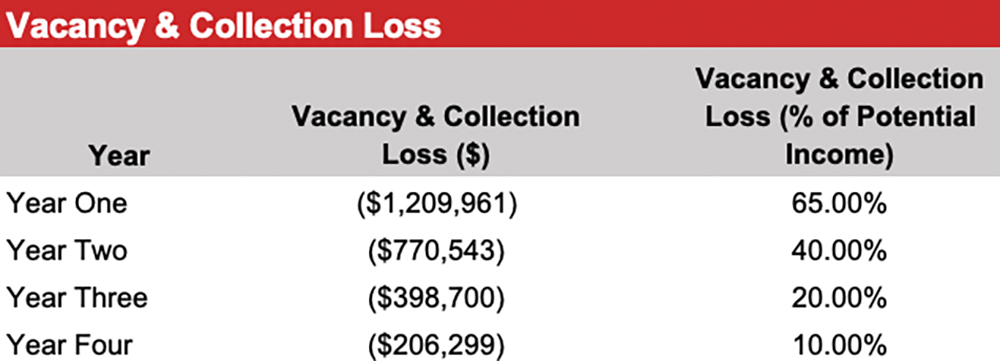
The Absorption Static Model table above shows total rent loss of $1,901,947. In addition, prudent investors in self-storage expect a profit for the time and risk associated with lease-up to stabilization. Based on that table, the implied profit is 8.7 percent (of the stable value); this is considered a reasonable return for time and risk associated with this project.
The Expense Comparables table on page 174 summarizes the expenses of the subject, comparable properties, the 2023 Self-Storage Expense Guidebook national data, and the applicable NCREIF Division.
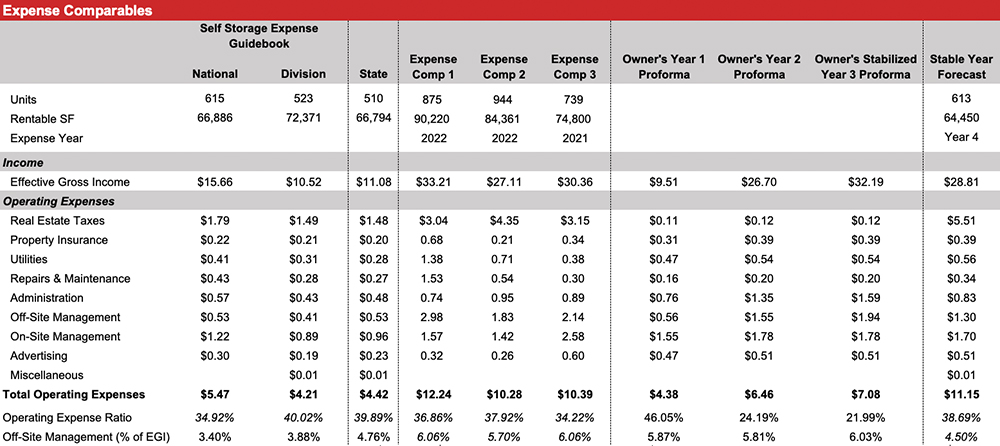
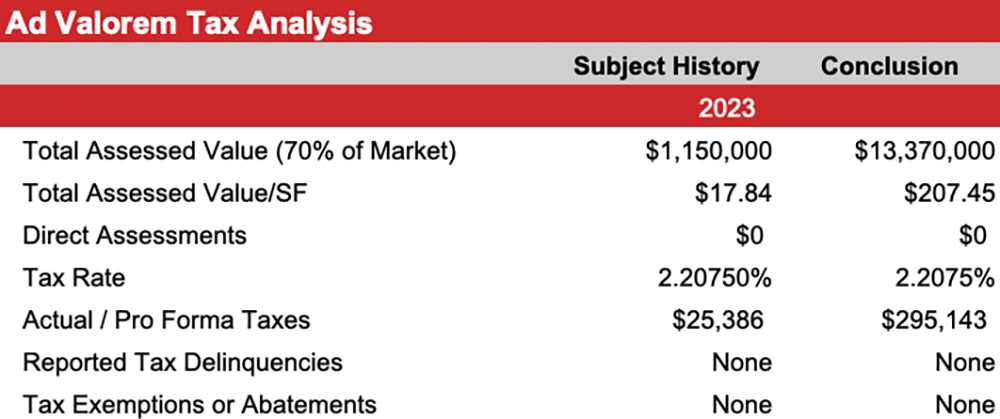
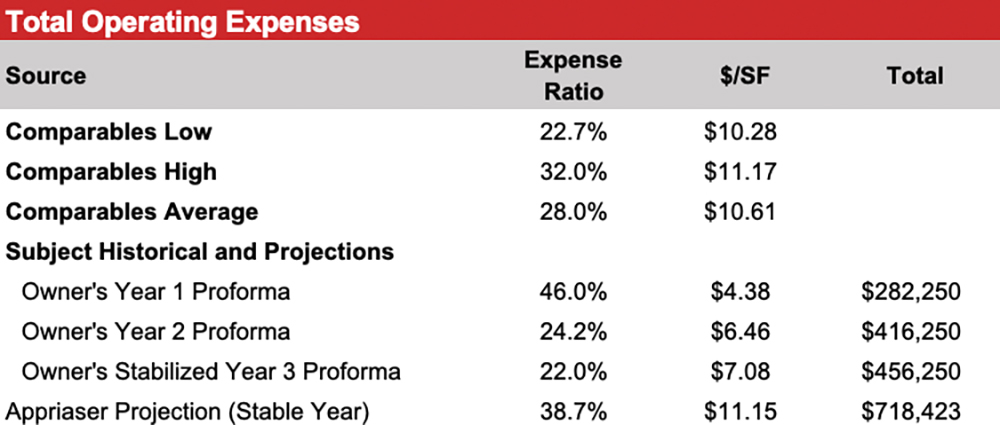
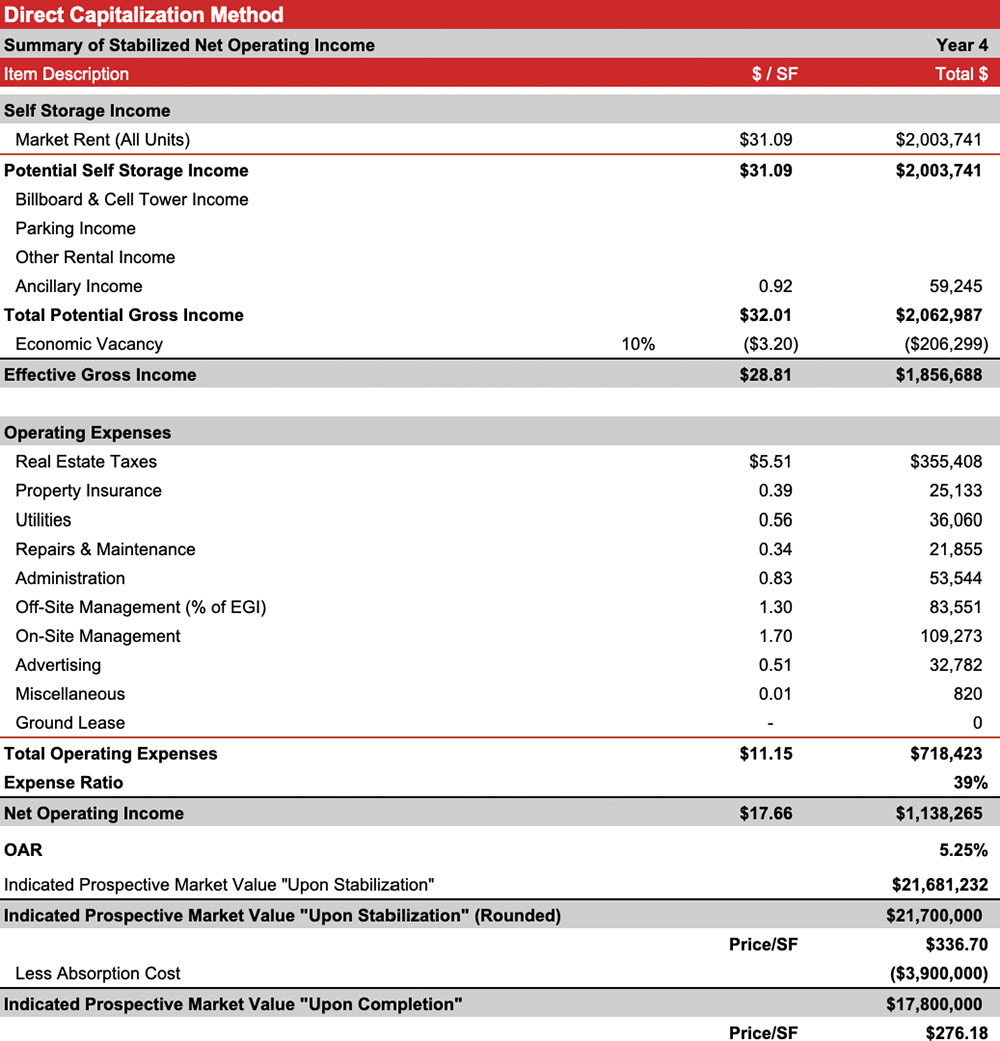
The subject per square foot expense ratio is 38.70 percent on year four (stable year). This is considered reasonable.
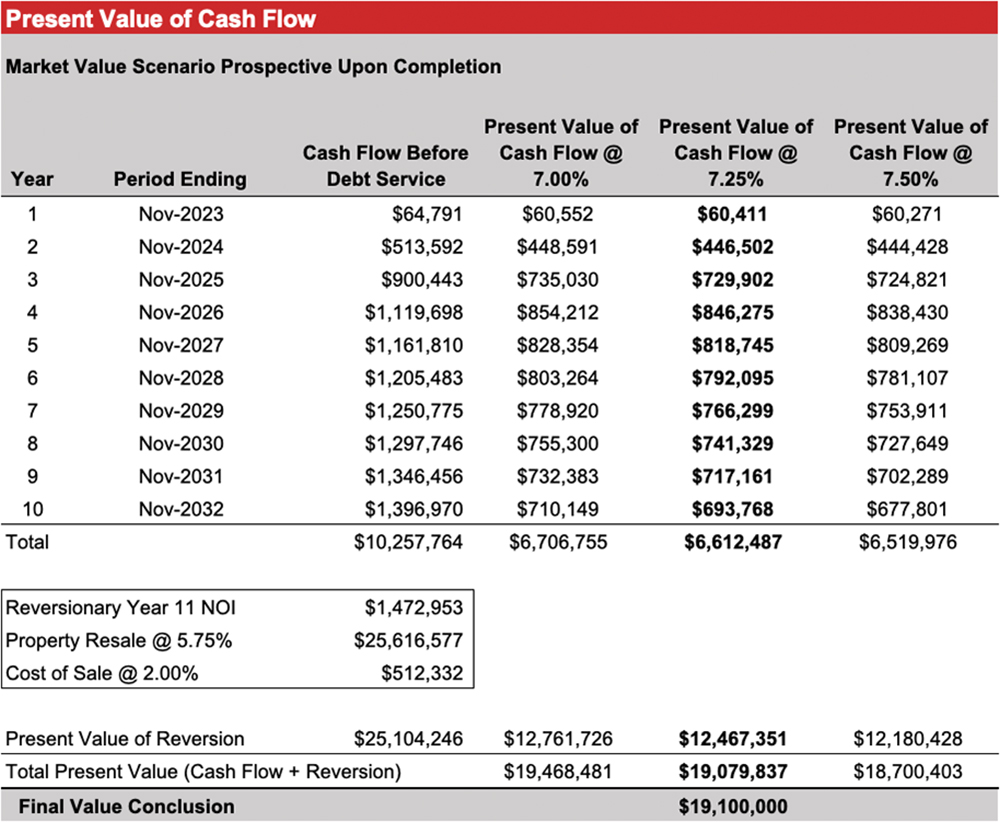
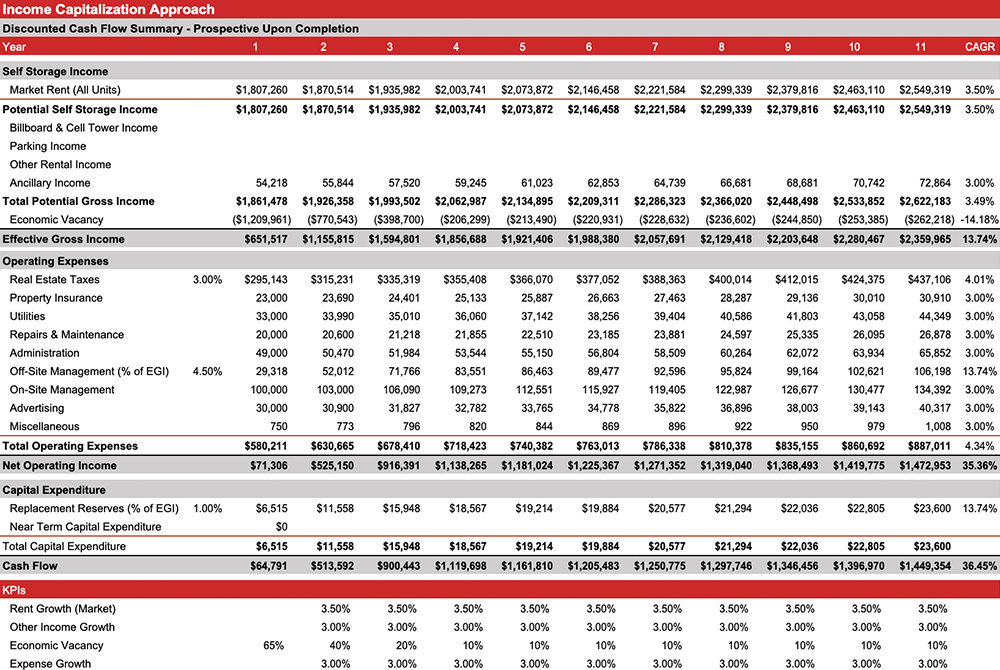
The reversion year must be representative of the cash flow pattern, or the present value analysis will be skewed. The report is based on the premise of a sale at the value date. Therefore, an investor must carefully consider a resale strategy or the basis of the reversion. The next investor will consider the following 10 years’ income. In this regard, we have based the complete value on year one to year 10 and the as stabilized value on year four to year 13. The DCF analysis utilizes a 10-year projection period for each scenario. This is consistent with current investor assumptions.
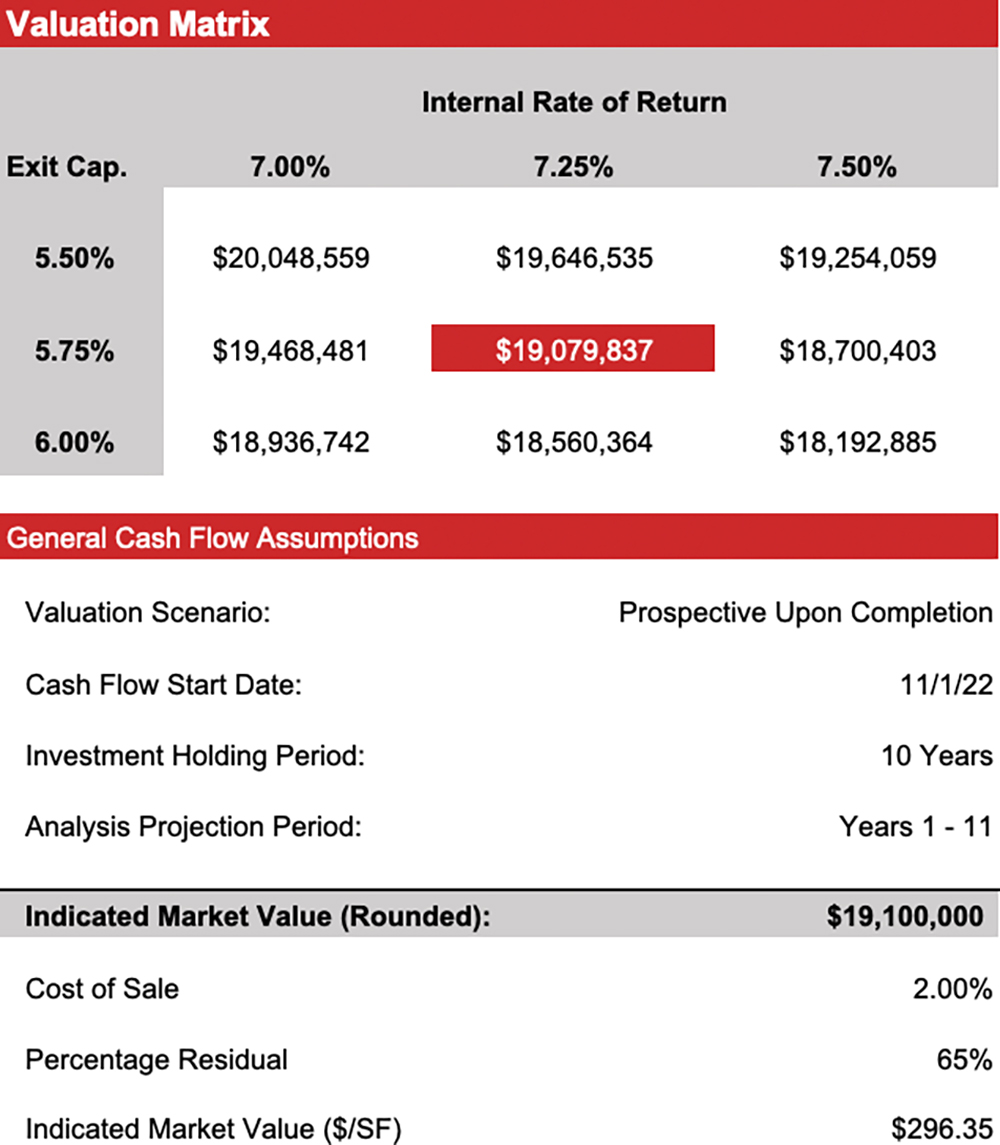
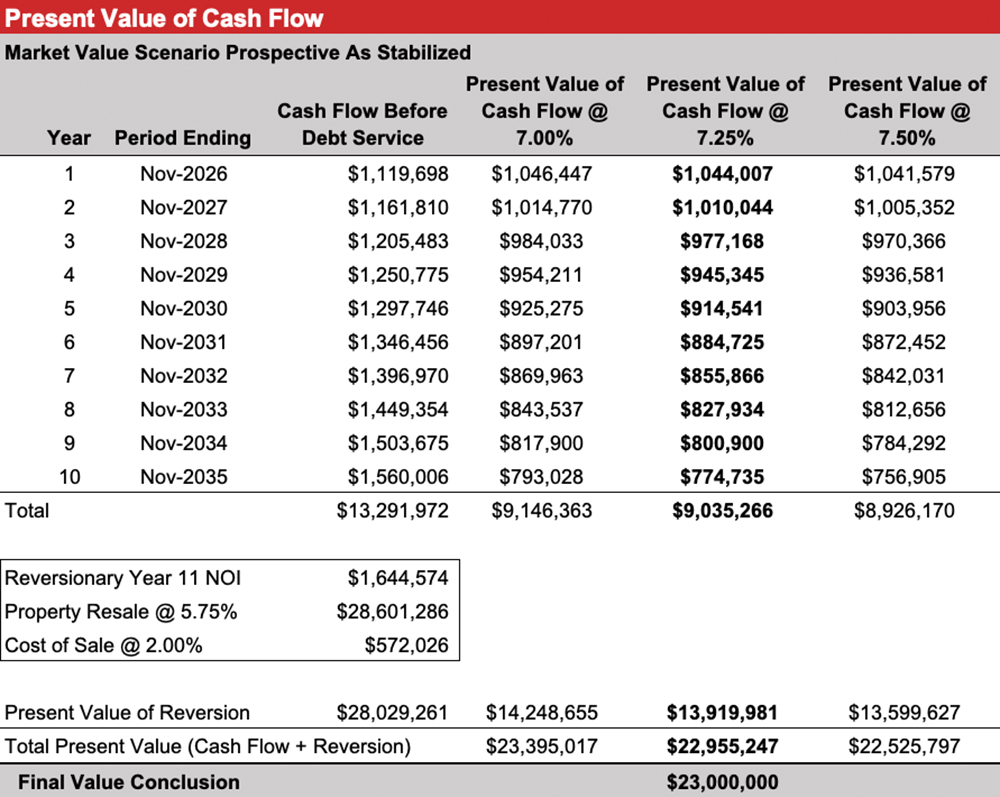
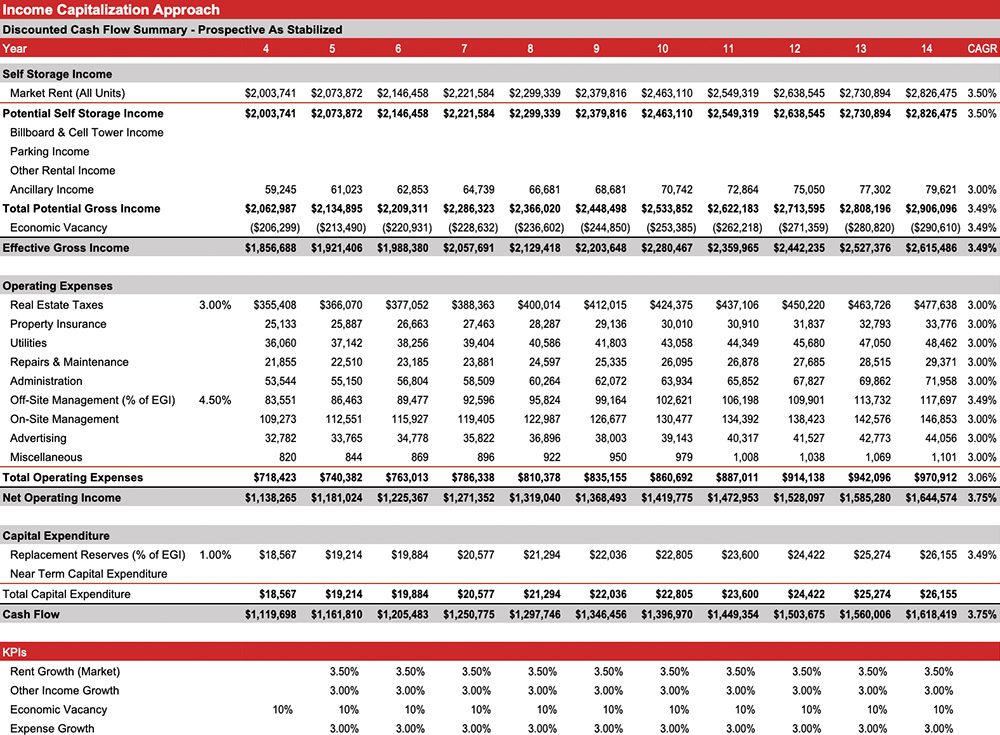
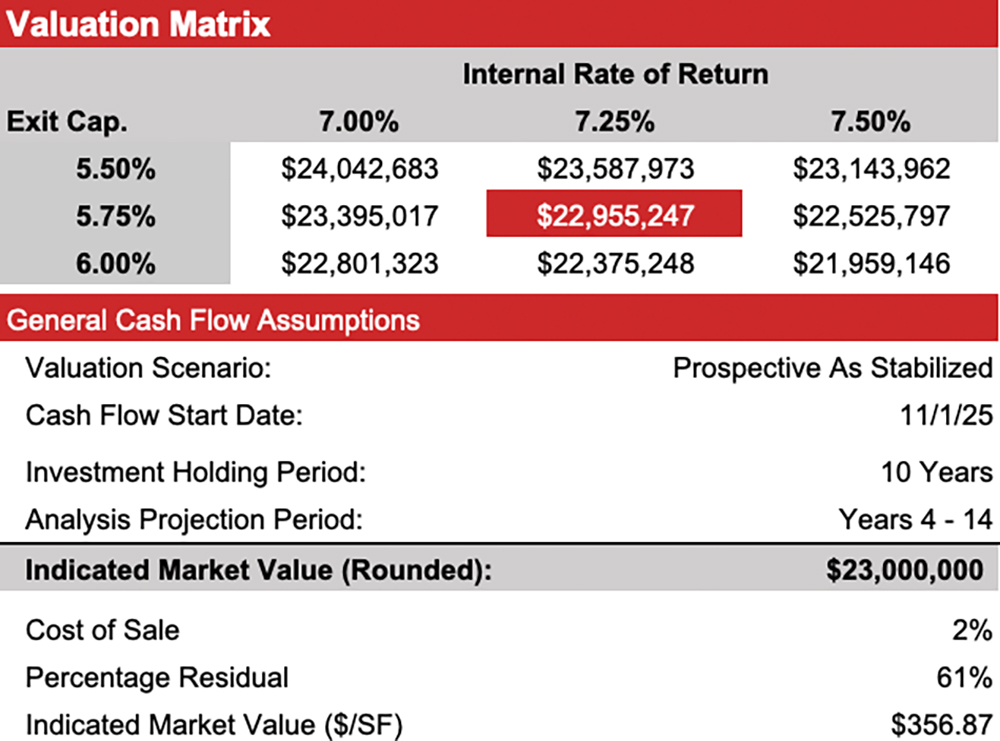
Sometimes called growth rates, escalations are typically based on a forecast of the Consumer Price Index (CPI). As previously concluded, the CPI forecast is 3 percent annually. Expenses are subject to inflation regardless of market conditions.
Discount Rate
Conversion of the cash flows and reversion to present equity value is by discounting at the discount rate (annual Internal Rate of Return or IRR). The discount rate (IRR) is a projection of the probable yield. It accounts for return to capital and return to equity (entrepreneurial profit). Therefore, the anticipation and expectations of investors in the market are more important than historical data. See the Present Value of Cash Flow, Income Capital Approach, Valuation Matrix, Present Value of Cash Flow, Income Capitalization Approach, and Valuation tables on the previous pages.
As a test of reasonableness of the cash flow and IRR conclusion, a changing income (projected for the subject) can be tested with a common yield capitalization model, sometimes called the Universal Formula. This is a simple mathematical relationship that considers the overall capitalization rate and the growth rate to derive the yield rate or IRR. That is, the capitalization rate plus appreciation equals the IRR; or Y = R + A, where Y = IRR, R = overall capitalization rate, and A = growth rate. On this basis, a typical overall capitalization rate for the subject would be 5.25 percent. However, the spread to terminal rates have increased for self-storage, more in line with core assets, and therefore the IRR has declined. Considering the projected income stream based on an analysis of the quality, quantity, and duration of the income expectancy, as well as the foregoing analysis, a 7.25 percent discount rate is appropriate for the projection period. Considering the foregoing analysis, the subject discounted cash flow analyses are reasonable (see cash flow).
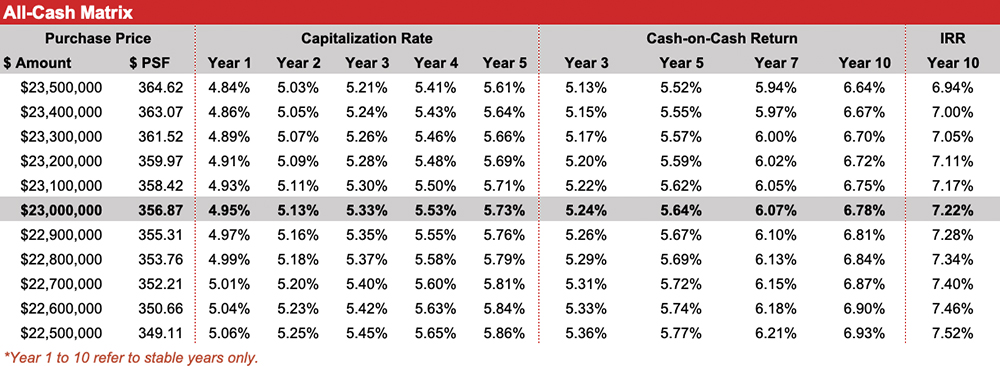
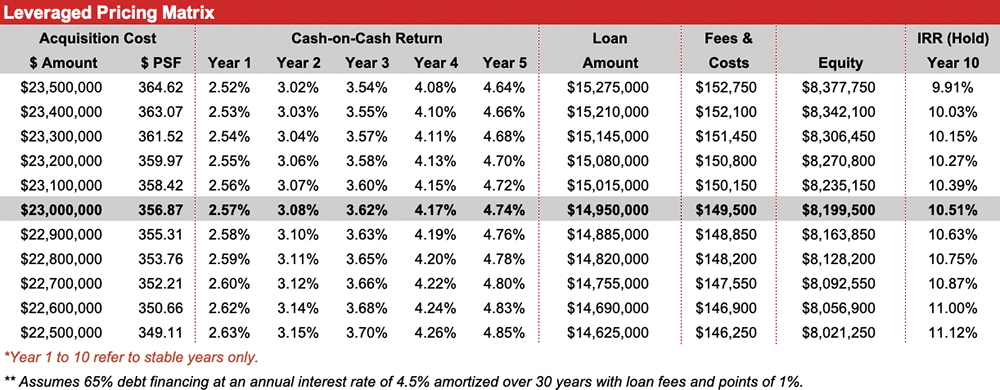
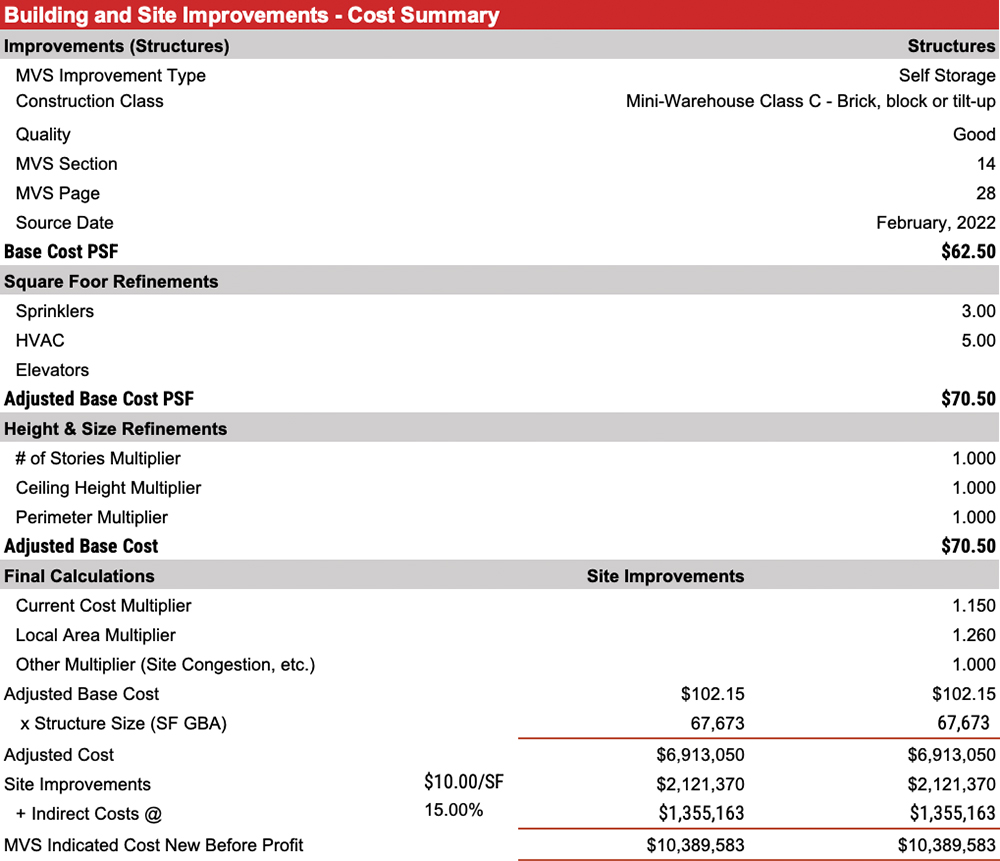
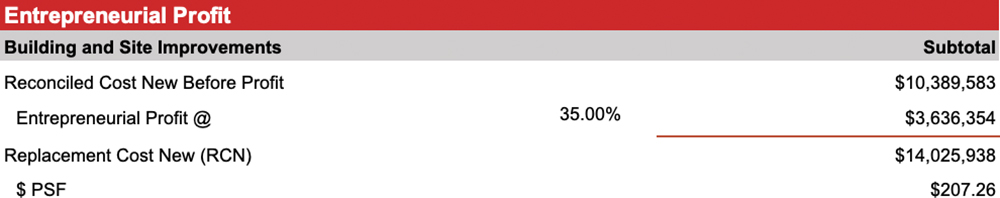
In estimating the replacement cost new for the subject, the following methods/data sources have been utilized, if available:
- Marshall Valuation Service (MVS) cost guide, published by Marshall and Swift, LLC, a nationally recognized publication containing construction costs
- Actual/budget construction cost figures available for comparable properties; and
- The subject’s actual construction costs (if available).
Marshall Valuation Services – Direct Cost
Salient details regarding the direct costs are summarized in the Cost Approach Conclusion at the end of this section. The MVS cost estimates include the following:
- average architect’s and engineer’s fees for plans, plan check, building permits and survey(s) to establish building line
- normal interest in building funds during the period of construction plus a processing fee or service charge
- materials, sales taxes on materials, and labor costs
- site preparation including finish grading and excavation for foundation/backfill
- utilities from structure to lot line figured for typical setback
- site improvements (included as lump sum additions)
- initial tenant improvement costs are included in MVS cost estimate (additional lease-up costs such as advertising, marketing, and leasing commissions are not included)
- contractor’s overhead and profit, including job supervision, workmen’s compensation, fire and liability insurance, unemployment insurance, equipment, temporary facilities, security, etc.
Base building costs (direct costs) are adjusted to reflect the physical characteristics of the subject. Making these adjustments, including the appropriate local and current cost multipliers, the direct building cost is indicated.
Additions
Items not included in the direct building cost estimate include parking and walks, signage, landscaping, and miscellaneous site improvements. The cost for these items is estimated separately using the segregated cost sections of the MVS cost guide.
Indirect Cost Items
Several indirect cost items are not included in the direct building cost figures derived through the MVS cost guide. These items include developer overhead (general and administrative costs), property taxes, legal and insurance costs, local development fees and contingencies, lease-up and marketing costs, and miscellaneous costs. For self-storage, indirect costs are typically in the 10 percent to 20 percent range of direct costs.
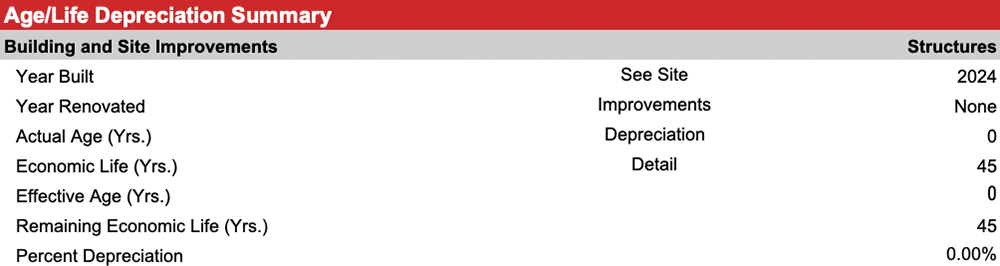
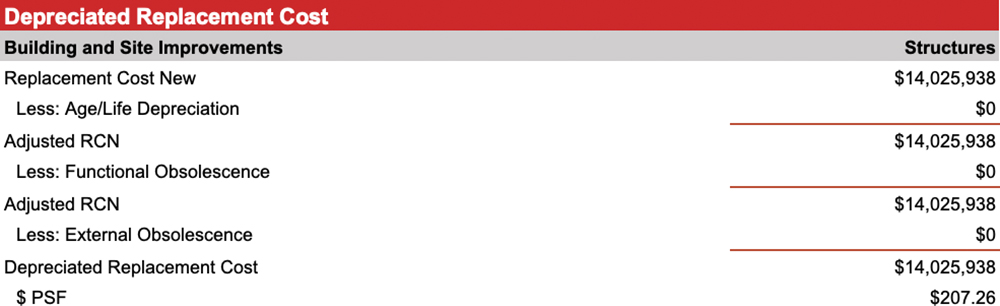
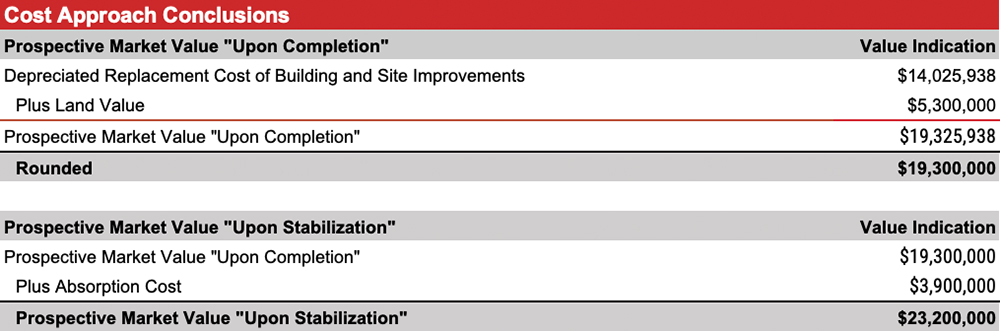
See Building and Site Improvements – Cost Summary table above.
Entrepreneurial Profit
Entrepreneurial profit represents the return to the developer and is separate from contractor’s overhead and profit. Developers are reporting a profit range from 20 percent to 35 percent with an average of 30 percent. Self-storage profit is high due to the difficulty in obtaining zoning approvals or entitlements, as municipalities tend not to like the sector because it offers no retail tax revenues and creates few jobs per facility. As a result, self-storage profit factors have been increasing over the past five years. See Entrepreneurial Profit table above.
We have compared the survey research of Newmark and the developer’s budget and they reasonably corroborate. Since the variance is small it confirms the reasonableness of the developer’s budget. Considering the MVS data is based on multiple facilities we have relied on this for our feasibility analysis.
Depreciation
Depreciation is defined as “a loss in property value from any cause; the difference between the contributory value of an improvement and its cost at the time of appraisal.” There are essentially three sources of accrued depreciation:
- Physical deterioration, both curable and incurable;
- Functional obsolescence, both curable and incurable; and
- External obsolescence.
In this case, the subject trade area has sufficient demand for additional supply based on four tools of analysis. Moreover, the contemplated development (the subject property) achieves milestone of feasibility consistent with the market using financial and cost analytics. Make sure feasibility reports include detailed analyses and multiple methodologies to support credible conclusions.

-
Self Storage Association
Contact: Tim Dietz, CEO
1001 N. Fairfax Street, Suite 505
Alexandria, VA 22314
Phone: (888) 735-3784
Email: tdietz@selfstorage.org
Website: www.selfstorage.org -
STATE ASSOCIATIONSAlabama Self Storage Association
Contact: Melissa Huff, Director
PO Box 282
Hixson, TN 37343
Phone: (423) 443-8249
Email: info@alabamassa.org
Website: www.alabamassa.org -
Arizona Self-Storage Association
Contact: Amy Amideo, Exec. Director
PO Box 44031
Phoenix, AZ 85064
Phone: (602) 374-7184
Email: azsa@azselfstorage.org
Website: www.azselfstorage.org -
Arkansas Self Storage Association
Contact: Shelly Harris
18 Freeway Drive
Little Rock, AR 72204
Phone: (501) 607-4775
Email: sharris@arssa.org
Website: www.arssa.org -
California Self Storage Association
Contact: Ross Hutchings, Exec. Director
5325 Elkhorn Boulevard, #283
Sacramento, CA 95842
Phone: (888) 277-2207
Email: ross@californiaselfstorage.org
Website: www.californiaselfstorage.org -
Colorado Self Storage Association
Contact: Maggie Thomas, Administrator
9457 S. University Boulevard, Suite 810
Highlands Ranch, CO 80126
Phone: (303) 350-0070
Email: admin@coloradossa.com
Website: www.coloradossa.com -
Dakotas Self Storage Association
Contact: Erin Lightfoot
1001 N. Fairfax Street, Suite 505
Alexandria, VA 22314
Phone: (703) 575-8000, ext. 100
Email: DakotasSSAExecDir@selfstorage.org
Website: www.DakotasSSA.org -
Florida Self Storage Association
Contact: Leslie Fuqua
1001 N. Fairfax Street, Suite 505
Alexandria, VA 22314
Phone: (863) 884-7204
Email: FSSAExecDir@selfstorage.org
Website: www.floridassa.org -
Georgia Self Storage Association
Contact: Samantha Kilgore, Exec. Director
PO Box 1128
LaGrange, GA 30241
Phone: (678) 764-2006
Fax: (706) 883-8215
Email: info@gassa.org
Website: www.gassa.org -
Idaho Self Storage Association
Contact: Erin Lightfoot
1001 N. Fairfax Street, Suite 505
Alexandria, VA 22314
Phone: (703) 575-8000, ext. 100
Email: IDSSAExecDir@selfstorage.org
Website: www.ssaidaho.org -
Illinois Self Storage Association
Contact: Leslie Fuqua
1001 N. Fairfax Street, Suite 505
Alexandria, VA 22314
Phone: (703) 575-8000, ext. 100
Email: ILSSAExecDir@selfstorage.org
Website: www.ilselfstorage.org -
Indiana Self Storage Association
Contact: Sally Novak
1001 N. Fairfax Street, Suite 505
Alexandria, VA 22314
Phone: (703) 575-8000, ext. 100
Email: INSSAExecDir@selfstorage.org
Website: www.ssaindiana.org -
Iowa Self Storage Association
Contact: Erin Lightfoot
1001 N. Fairfax Street, Suite 505
Alexandria, VA 22314
Phone: (703) 575-8000, ext. 100
Email: iassaexecdir@selfstorage.org
Website: www.iowassa.org -
Kansas Self Storage Owners Association
Contact: Brian Goldman, Exec. Director
PO Box 7624
Overland Park, KS 66207
Phone: (785) 380-8886
Email: kansasstorage@gmail.com
Website: www.kssoa.org -
Kentucky Self Storage Organization
Contact: Sally Novak
1001 N. Fairfax Street, Suite 505
Alexandria, VA 22314
Phone: (703) 575-8000, ext. 100
Email: KYSSAExecDir@selfstorage.org
Website: www.kyssa.org -
Louisiana Self Storage Association
Contact: Melissa Huff, Director
PO Box 282
Hixson, TN 37343
Phone: (423) 443-8249
Email: info@ssala.org
Website: www.ssala.org -
Maine Self Storage Association
Contact: Rich Trott, President
c/o Swift Storage
35 Farwell Drive
Rockland, ME 04841
Phone: (207) 596-6401
Email: mainestorage@gmail.com
Website: www.mainessa.com -
Maryland Self Storage Association
Contact: Julie LaRose
1001 N. Fairfax Street, Suite 505
Alexandria, VA 22314
Phone: (703) 575-8000, ext. 100
Email: MDSSAExecDir@selfstorage.org
Website: www.ssamaryland.org -
Self-Storage Association of Michigan
Contact: John Lindley, President
2222 Association Drive
Okemos, MI 48864
Phone: (888) 308-7726
Email: info@mmhrvca.org
Website: www.selfstoragemichigan.com -
Minnesota Self Storage Association
Contact: Erin Lightfoot
1001 N. Fairfax Street, Suite 505
Alexandria, VA 22314
Phone: (703) 575-8000, ext. 100
Email: MNSSAExecDir@selfstorage.org
Website: www.minnesotassa.org -
Mississippi Self Storage Owners Association
Contact: Heather McCombs, Exec. Director
PO Box 89
Gulfport, MS 39502
Phone: (228) 365-8965
Email: contact.msssoa@gmail.com
Website: www.msssoa.org -
Missouri Self Storage Owners Association
Contact: Shelly Harris, Exec. Director
PO Box 105920
Jefferson City, MO 65110
Phone: (573) 480-0454
Email: sharris@mssoa.org
Website: www.mssoa.org -
Montana Self Storage Association
Contact: Erin Lightfoot
1001 N. Fairfax Street, Suite 505
Alexandria, VA 22314
Phone: (703) 575-8000, ext. 100
Email: MTSSAExecDir@selfstorage.org
Website: www.montanassa.org -
Nebraska Self Storage Association
Contact: Bill Lange, President
PO Box 173
Kearney, NE 68848
Phone: (308) 338-9947
Website: www.nebraskaselfstorageownersassociation.com -
Nevada Self Storage Association
Contact: Erin Lightfoot
1001 N. Fairfax Street, Suite 505
Alexandria, VA 22314
Phone: (703) 575-8000, ext. 100
Email: NVSSAExecDir@selfstorage.org
Website: www.nvssa.org -
New Hampshire Self Storage Association
Contact: Courtney Kahler, Exec. Director
17047 Goldcrest Loop
Clermont, FL 34714
Phone: (603) 255-7055
Email: NHSSA@NHSSA.net
Website: www.NHSSA.net -
New Jersey Self Storage Association
Contact: Julie LaRose
1001 N. Fairfax Street, Suite 505
Alexandria, VA 22314
Phone: (703) 575-8000, ext. 100
Email: NJSSAExecDir@selfstorage.org
Website: www.njssa.org -
New Mexico Self Storage Association
Contact: Erin Lightfoot
1001 N. Fairfax Street, Suite 505
Alexandria, VA 22314
Phone: (703) 575-8000, ext. 100
Email: NMSSAExecDir@selfstorage.org
Website: www.newmexicossa.org -
New York Self Storage Association
Contact: Peter Ferraro, CEO
136 Everett Road
Albany, NY 12205
Phone: (518) 431-1106
Email: admin@nyselfstorage.org
Website: www.nyselfstorage.org -
North Carolina Self Storage Association
Contact: Sally Novak
1001 N. Fairfax Street, Suite 505
Alexandria, VA 22314
Phone: (703) 575-8000, ext. 100
Email: NCSSAExecDir@selfstorage.org
Website: www.NCSSAonline.org -
Northeast Self Storage Association
Contact: Courtney Kahler, Exec. Director
17047 Goldcrest Loop
Clermont, FL 34714
Phone: (617) 600-4481
Email: NeSSA@NeSSA.org
Website: www.NeSSA.org -
Ohio Self Storage Association
Contact: Sally Novak
1001 N. Fairfax Street, Suite 505
Alexandria, VA 22314
Phone: (703) 575-8000, ext. 100
Email: OHSSAExecDir@selfstorage.org
Website: www.ohiossa.org -
Oregon Self Storage Association
Contact: Erin Lightfoot
1001 N. Fairfax Street, Suite 505
Alexandria, VA 22314
Phone: (703) 575-8000, ext. 133
Email: eking@selfstorage.org
Website: www.orssa.org -
Pennsylvania Self Storage Association
Contact: Julie LaRose
1001 N. Fairfax Street, Suite 505
Alexandria, VA 22314
Phone: (703) 575-8000, ext. 100
Email: passaexecdir@selfstorage.org
Website: www.paselfstorage.org -
Self Storage Association of South Carolina
Contact: Mary Kate Mackie, Exec. Director
PO Box 12042 • Columbia, SC 29211
Phone: (803) 814-4000
Email: info@SCSelfStorage.org
Website: www.SCSelfStorage.org -
Tennessee Self Storage Association
Contact: Melissa Huff, Director
PO Box 91
Hixson, TN 37343
Phone: (423) 443-8249
Email: info@tnssa.net
Website: www.tnssa.net -
Texas Self Storage Association
Contact: Ginny Sutton, Exec. Director
595 Round Rock West Drive, Suite 503
Round Rock, TX 78681
Phone: (888) 259-4902
Email: info@txssa.org
Website: www.txssa.org -
Utah Self Storage Association
Contact: Erin Lightfoot
1001 N. Fairfax Street, Suite 505
Alexandria, VA 22314
Phone: (703) 575-8000, ext. 100
Email: UTSSAExecDir@selfstorage.org
Website: www.ssautah.org -
Vermont Self Storage Association
Contact: Julie LaRose
1001 N. Fairfax Street, Suite 505
Alexandria, VA 22314
Phone: (703) 575-8000, ext. 100
Email: VTSSAExecDir@selfstorage.org
Website: www.ssavt.org -
Virginia Self Storage Association
Contact: Julie LaRose
1001 N. Fairfax Street, Suite 505
Alexandria, VA 22314
Phone: (703) 575-8000, ext. 100
Email: VASSAExecDir@selfstorage.org
Website: www.virginiassa.org -
Washington Self Storage Association
Contact: Diane Bevins
1402 Lake Tapps Parkway SE
Suite F-104/PMB133
Auburn, WA 98092
Phone: (206) 653-7259
Email: info@wa-ssa.org
Website: www.wa-ssa.org -
Wisconsin Self Storage Association
Contact: Barbara Scheibe, Exec. Director
21620 Belgren Road
Waukesha, WI 53186
Phone: (262) 786-3960
Fax: (262) 786-2424
Email: info@wiselfstorage.org
Website: www.wiselfstorage.org -
IndustryNational Portable Storage Association
Contact: Mark DePasquale, CEO
3312 Broadway, Suite 105
Kansas City, MO 63114
Phone: (816) 960-6552
Fax: (816) 960-6575
Email: mark@npsa.org
Website: www.npsa.org -
InternationalFederation Of European Self Storage Associations (FEDESSA)
Contact: Rennie Schafer
Bluepoint
80 BD. A. Reyers
1030 Brussels, Belgium
Phone: +32 472 943324
Email: info@fedessa.org
Website: www.fedessa.org -
Self Storage Association of Australasia
Contact: Sandra Evans
Unit 4 – 2 Enterprise Drive
Bundoora, Victoria 3083
Australia
Phone: +61 3 9466 9699
Email: admin@selfstorage.com.au
Website: www.selfstorage.com.au -
Belgian Self Storage Association
Contact: Carlo Swaab
Breedveld 29
1702 Groot-Bijgaarden, Belgium
Phone: +32 2 229 56 42
Email: info@shurgard.be -
Canadian Self Storage Association
Contact: Sue Margeson
PO Box 43
Rosseau, ON, P0C 1J0, Canada
Phone: (888) 898-8538
Fax: (519) 941-0877
Email: info@cssa.ca
Website: www.cssa.ca -
Danish Self Storage Association
c/o City Self Storage
Bryghuspladsen 8, Indg. C, 3. Sal
1473 Kbh K, Denmark
Phone: +45 30 36 00 43
Fax: +45 1270 62 34 71
Email: alag@pelicanselfstorage.dk
Website: www.selfstoragedenmark.dk -
France Self Storage Association
Contact: Loic Vaillant
Phone: +33 1 70 37 29 64
Email: contact@ci-selfstockage.fr
Website: https://ci-selfstockage.fr -
Germany Self Storage Association
Contact: Christian Lohmann
NordkanalstraBe 52
20097 Hamburg, Germany
Phone: 040 21091765
Fax: 040 23808003
Email: info@selfstorage-verband.de
Website: www.selfstorage-verband.de -
Ireland Self Storage Association
Contact: Brian Hefferon
c/o Elephant Storage Ltd. Nesta
Deansgrange Business Park
Deansgrange
Co. Dublin, A94 A4AG
Phone: 353 (01) 219 0200
Website: www.irishselfstorageassociation.ie -
Italy Self Storage Association
Contact: Cesare Carcano
Email: info@aisi-selfstorage.it
Website: www.aisi-selfstorage.it -
Japan Self Storage Association
Contact: Tatsuya Saji
Japan 101-0051 Tokyo 2-11-4-301
Jinbocho Kanda Chiyoda-ku
Phone: 81-3-5211-8933
Fax: 81-3-5211-8944
Email: rsaji@trwinds.com -
The Netherlands’ Self Storage Association
Van Lennepweg 10
2111 HV Aerdenhout
The Netherlands
Phone: 0031 6 54 27 47 92
Fax: 0031 23 5444 080
Email: info@shurgard.nl
Website: www.nssa.nl -
Norwegian Self Storage Association
Contact: Per Hague
Havnegaten 2 – 4306 Sandnes
0580 Oslo
Phone: 992 518 944
Website: www.nssa.no -
Spain Self Storage Association
Contact: Carles Viladecans
Street Calvet 5, 2º 2ª
08021 Barcelona, Spain
Phone: 34 937 076 549
Email: info@aess.es
Website: www.aess.es -
Self Storage Association Sweden
Contact: Paola Barraza
Box 2-178 21 Ekero, Sweden
Phone: 46 851970073
Email: paola.barraza@ssasweden.com
Website: www.ssasweden.com -
Swiss Self Storage Association
Contact: Christian Schmutz
Hardstrasse 14
CH-4052 Basel
Switzerland
Phone: 0041 61 312 44 88
Fax: 0041 61 312 44 89
Email: info@3sa.ch
Website: www.3sa.ch -
Self Storage Association of the United Kingdom
Contact: Rennie Schafer
The Gullet
Nantwich, Cheshire
CW5 5SZ, UK
Phone: +44 1270 623150
Fax: +44 1270 623471
Email: admin@ssauk.com
Website: www.ssauk.com -
Other Sources
Agency Records, Inc. – www.agencyrecords.com
- BRB Publications, Inc. – www.brbpublications.com
- Bureau of Labor Statistics – www.bls.gov
- Claritas – www.claritas.com
- ESRI – www.esri.com
- Integra Realty Resources – www.irr.com
- International Code Adoptions State and Jurisdiction Information – www.iccsafe.org/adoptions
- International Code Council (ICC) – www.iccsafe.org
- MapInfo – www.mapinfo.com
- National Conference of States of Building Codes and Standards (NCSBCS) – www.ncsbcs.org
- The National Fire Protection Association (NFPA) – www.nfpa.org
- PublicData.com – www.publicdata.com
- U.S. Census Bureau – www.census.gov
- U.S. Chamber of Commerce – www.uschamber.com