esides charging monthly rates for storage units, self-storage facilities can generate income in several ways, such as selling packing supplies and protection policies, renting moving trucks, offering ancillary services, and charging various administrative fees. However, rental rates remain the primary source of revenue. As such, self-storage operators should be regularly adjusting their street rates based on supply and demand and increasing the rental rates of existing customers on an annual or semi-annual basis. For instance, street rates should be increased when demand for a certain unit size and/or type is high but its supply is limited.
While rate management software helps self-storage operators to improve their net operating income, supply and demand ultimately determine the asking rates. For example, there was a staggering amount of new self-storage development across the country from 2016 to 2019 that diminished demand in some of the major metropolitan statistical areas (MSAs) and secondary markets within the United States into 2020. Afterward, supply chain issues, material shortages, and a lack of labor due to the COVID-19 pandemic caused new development to come to a temporary halt. That brief hiatus, coupled with unprecedented pandemic-related demand for storage space and drawn-out approval processes for development, helped correct the imbalance. To satisfy growing demand from both commercial and residential customers, new development resumed in 2021, albeit at a slightly slower pace, and brought more self-storage space to the market. Since then, higher interest rates, crippling inflation, and a tighter lending market have kept new supply from exceeding demand.
In general, new supply seems to be in check, but it’s believed that the housing market has been putting pressure on demand since the 2023 Self-Storage Almanac was published. Elevated home values, significantly higher interest rates, and insufficient household incomes have created an unaffordable housing market for many Americans. As Arlen Nordhagen, founder and vice chairman of National Storage Affiliates Trust says, “Almost no one today is selling their existing home with a 3 to 4 percent mortgage to move into a nicer home with a 7 to 8 percent mortgage!”
Mike Burnam, CIO and president of StorageMart, has also voiced concern with the housing market. “If people cannot buy homes, they do not move; if they do not move, the demand for storage stagnates.”
Unfortunately, as you will see in the tables within this section, it’s possible that idle demand is to blame for declines in rental rates in the second half of 2022 and into 2023. Another possible contributing factor of the lower rental rates is the fact that some self-storage businesses have been experiencing push back from displeased customers who felt they were misled by extremely low introductory rental rates after receiving substantial price hikes a few months into their tenancy—a revenue management tactic that a few REITs began using in the second half of 2023. Some of these disgruntled customers even contacted news outlets and city officials to voice their concerns over these exorbitant practices, which initiated discussions about potential caps on self-storage rental rate increases. While no caps on rental rate increases have been implemented in the U.S. so far, there’s no guarantee that rent control ordinances won’t be passed in the future if these extreme rental rate increases continue to distress customers and make headlines.
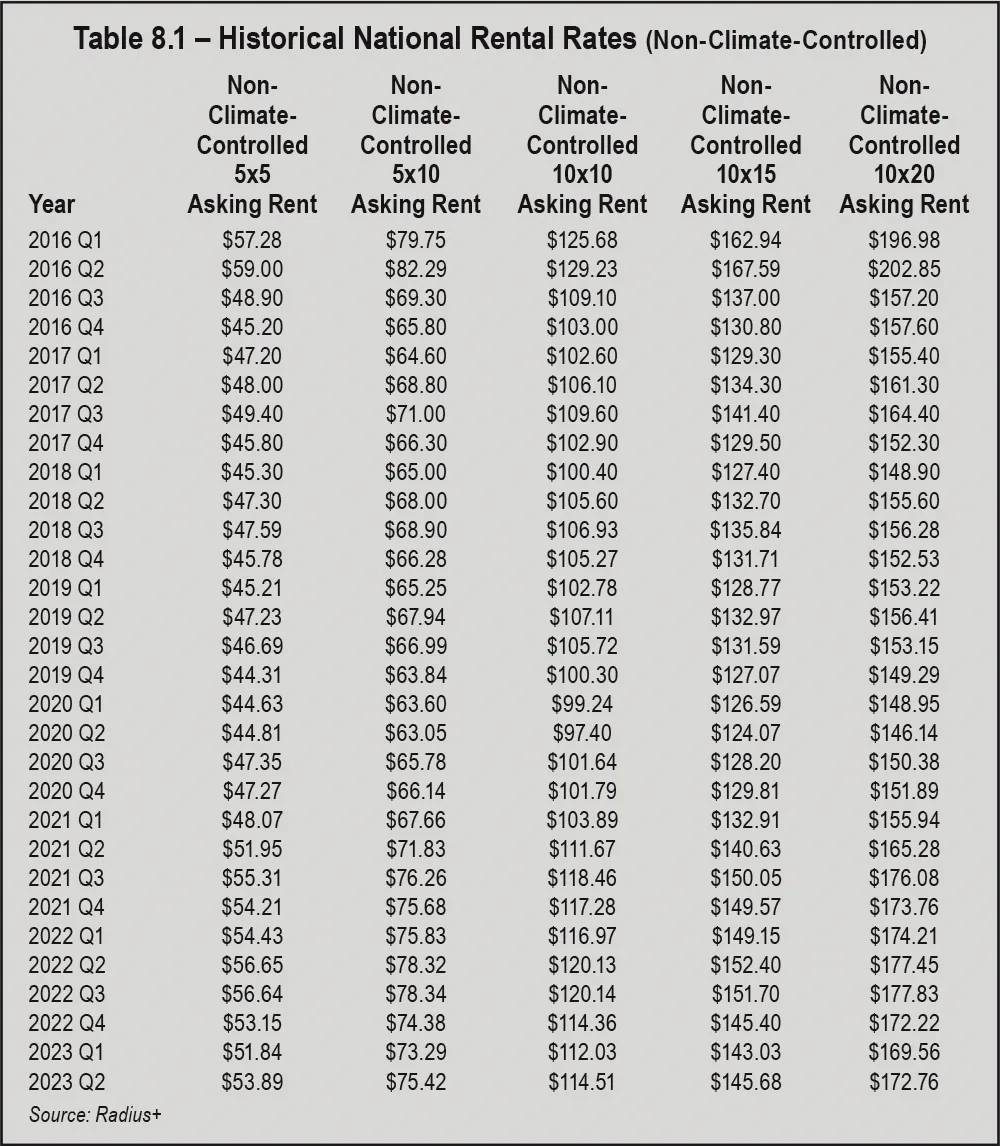
Normally, the second quarter of each year is marked by modest gains compared to its previous quarter, and then followed by even greater increases in the third quarter. Though that was not the case for 2020, when rates dropped in the second quarter, steady increases were reported afterward. The typical seasonality of rental rates returned after the first quarter of 2021, with all sizes of non-climate-controlled units experiencing rental rate increases in the second and third quarters of 2021 and decreases in the fourth quarter. This is typical. However, the first quarter of 2022 broke the usual pattern, with three of the five sizes of non-climate-controlled units posting modest increases. All five unit sizes in Table 8.1 reported increases in the second quarter of 2022, which falls in line with the normal spring upswing for rental rates. When looking at the newest data in Table 8.1, one can see that minimal changes were reported for rental rates in the third quarter of 2022—an abnormality compared to the typically higher summer rates; instead, the rate increases and decreases reported ranged from 1 cent to 70 cents. Rates for all non-climate-controlled units declined in Q4 2022 and Q1 2023 before gradually increasing in Q2 2023, but those rental rates remained lower than Q2 2022’s rates by approximately $3 to $7.
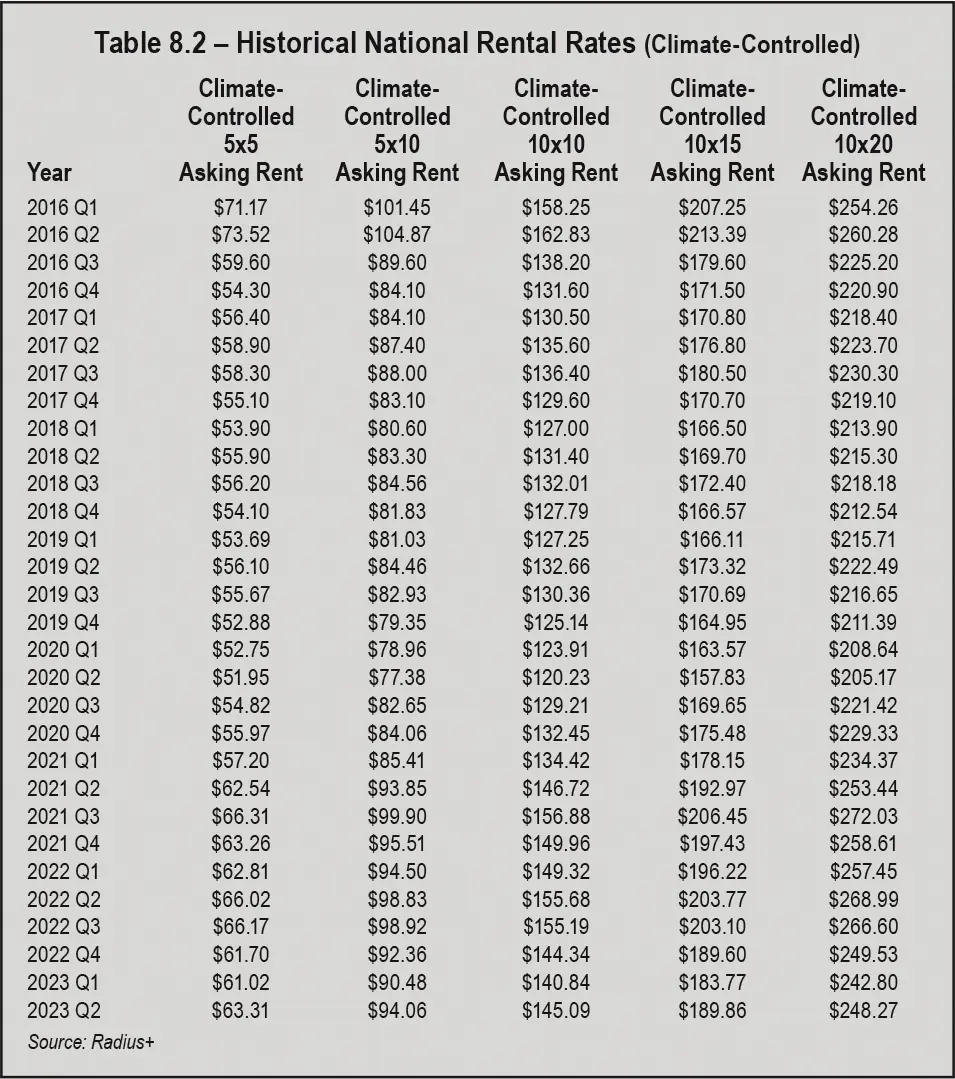
According to Table 8.2, rental rates for all five climate-controlled units stuck to the seasonal pattern in 2021 and the first half of 2022. However, only two of the five unit sizes reported increased rates in Q3 2022, which is usually the busiest time of the year; rental rates decreased for climate-controlled 10-by-10s, 10-by-15s, and 10-by-20s that quarter, and only modest gains were noted for 5-by-5s and 5-by-10s (15 cents and 9 cents, respectively). All climate-controlled unit sizes experienced rental rate declines in Q4 2022 and Q1 2023. Despite increasing in Q2 2023, the rental rates remained lower than Q2 2022’s rates. The most significant year-over-year (Q2 2022 to Q2 2023) rental rate decrease reported in Table 8.2 was $20.72 (climate-controlled 10-by-20s).
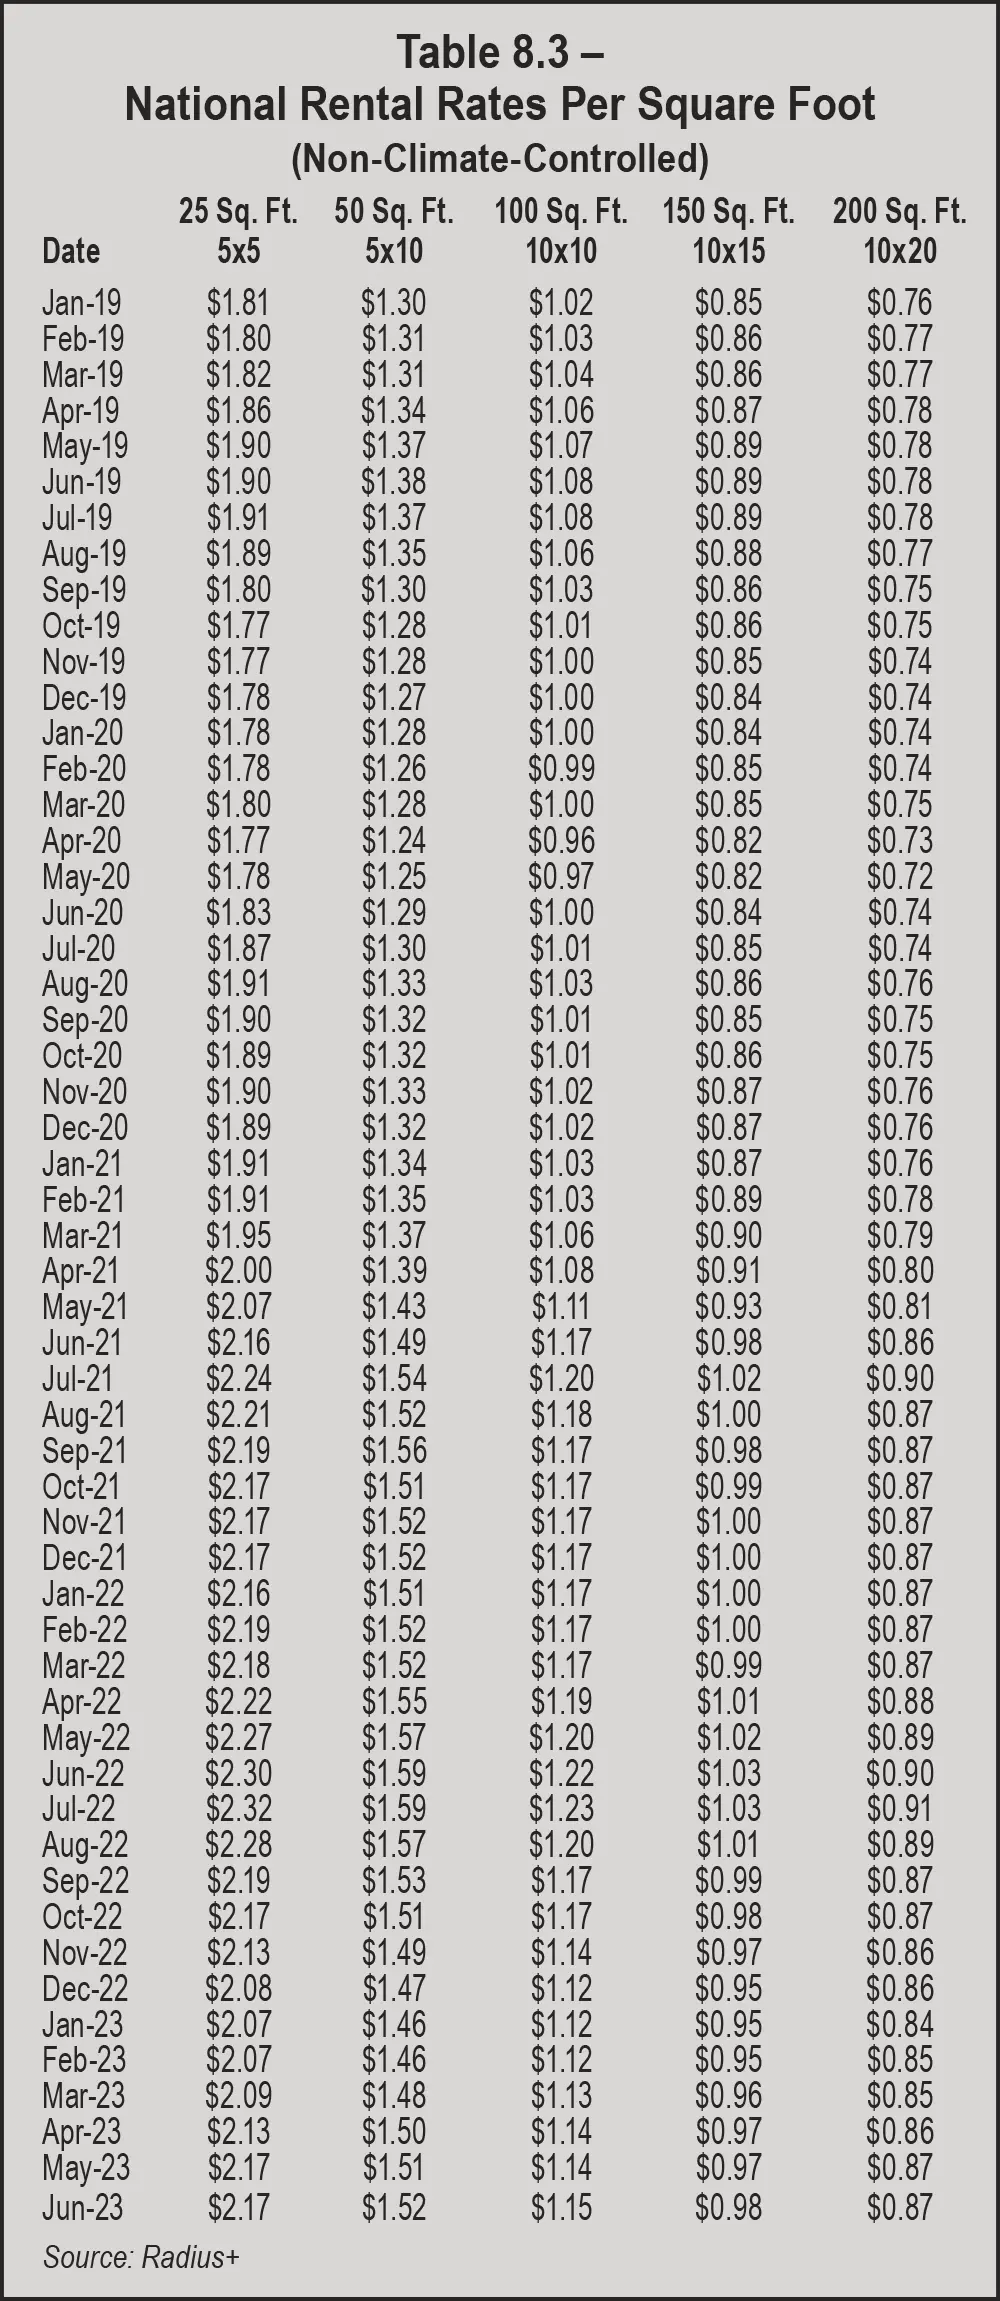
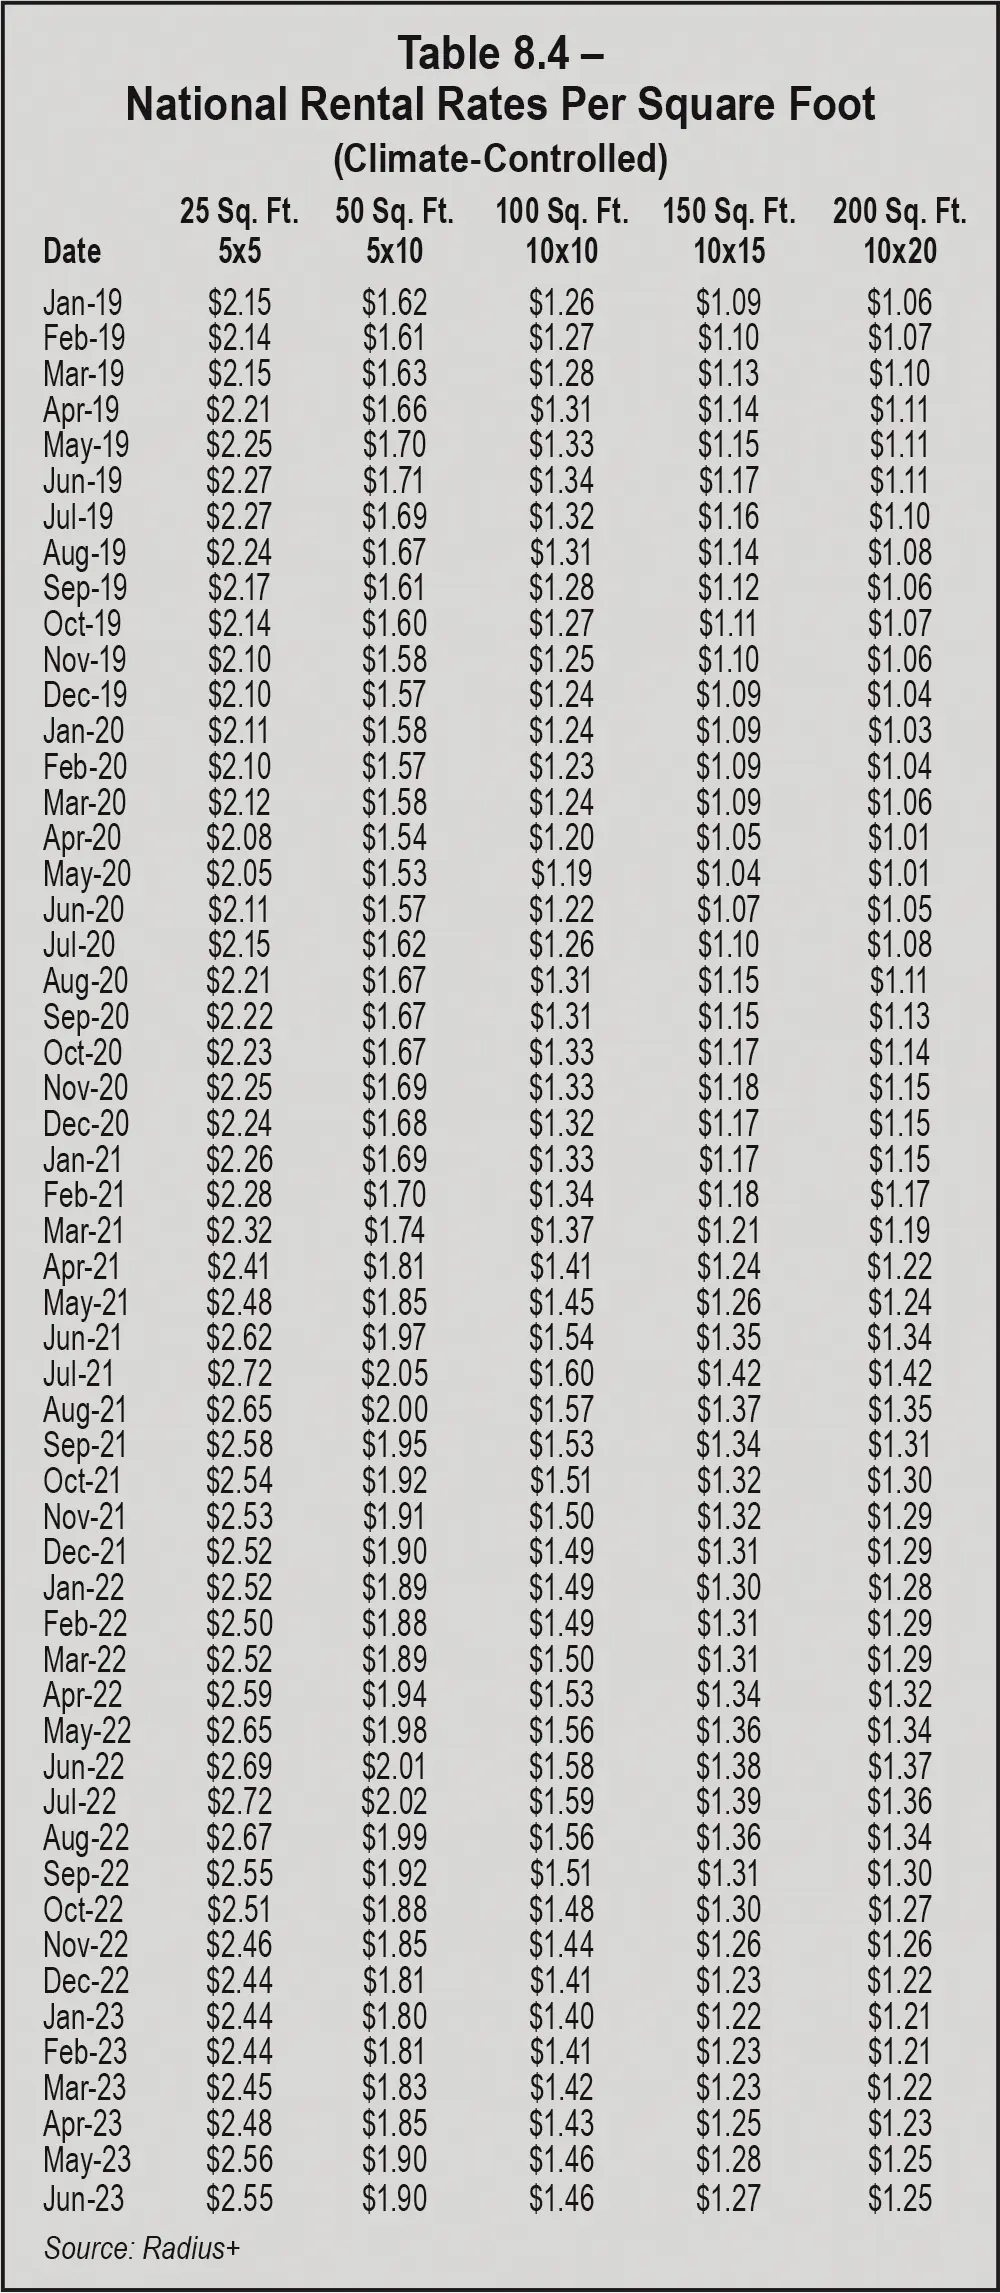
Tables 8.3 and 8.4 detail the national rental rate data for non-climate-controlled and climate-controlled units by square foot by month. The newest 12 months listed within these tables (July 2022 to June 2023) show gradual changes to rates, with all rates in June 2023 down several cents from the highs of June 2022. As seen in Table 8.3, all non-climate-controlled unit sizes had the highest rates in June or July of 2022. Rates for 5-by-5s experienced a double-digit decrease from June 2022 to June 2023 ($0.13), while rates for the other four unit sizes were nudged downward by 7 cents, 5 cents, or 3 cents per square foot. Table 8.4 shows that July 2021 was the best month for climate-controlled units of all sizes. The second-best month was July 2022 for all sizes except 10-by-20s, which had its second highest rate in June 2022 ($1.37 per square foot). However, like non-climate-controlled units, all sizes of climate-controlled units posted double-digit year-over-year rental rate declines from June 2022 to June 2023 of 11 cents to 14 cents per square foot.
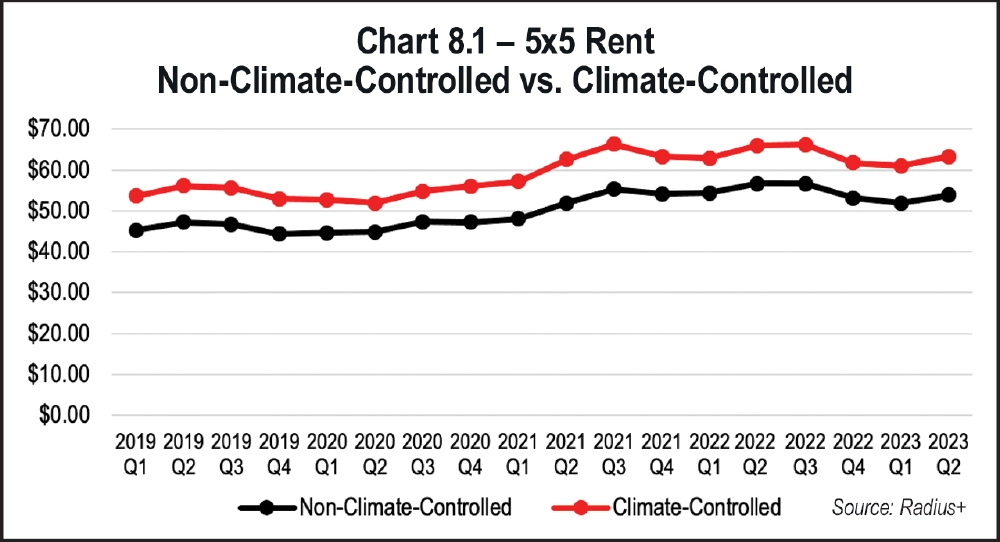
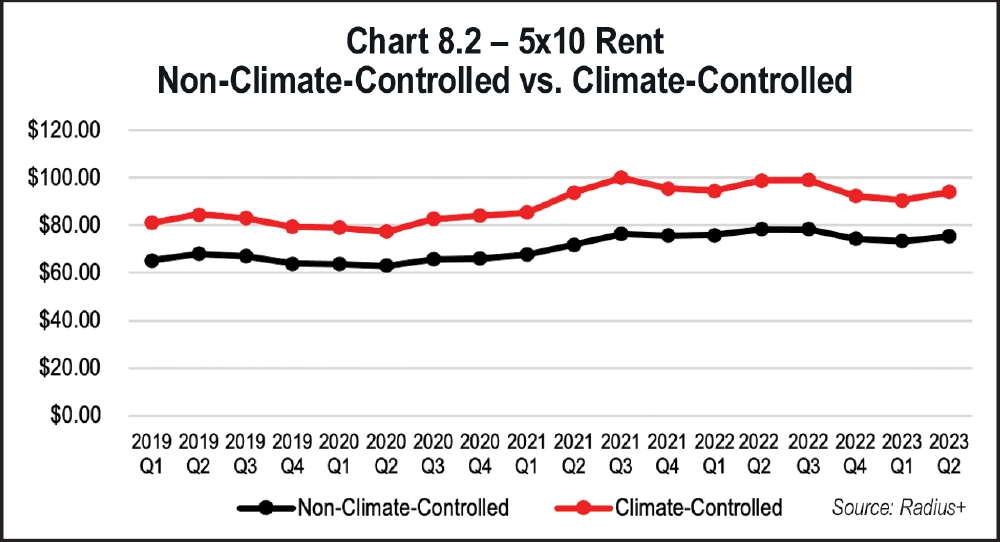
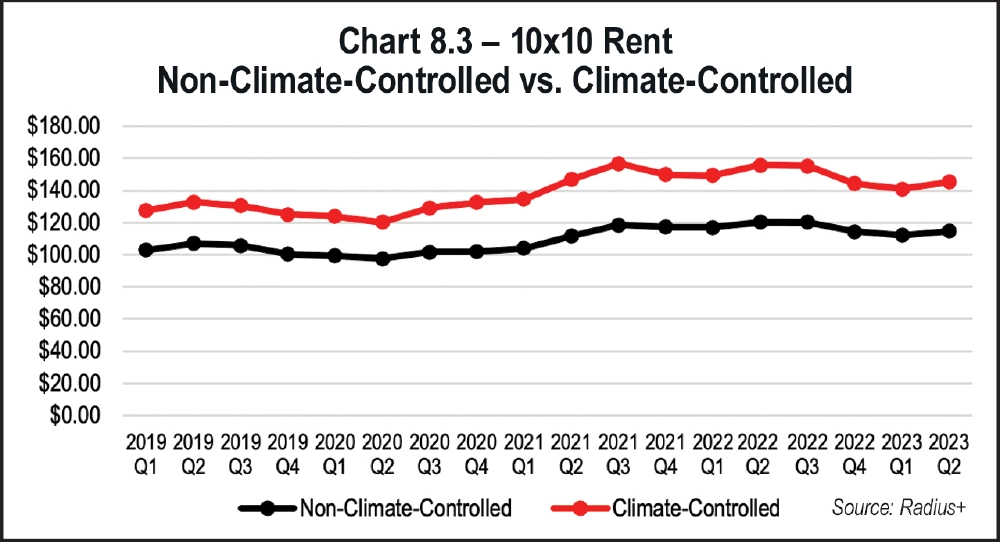
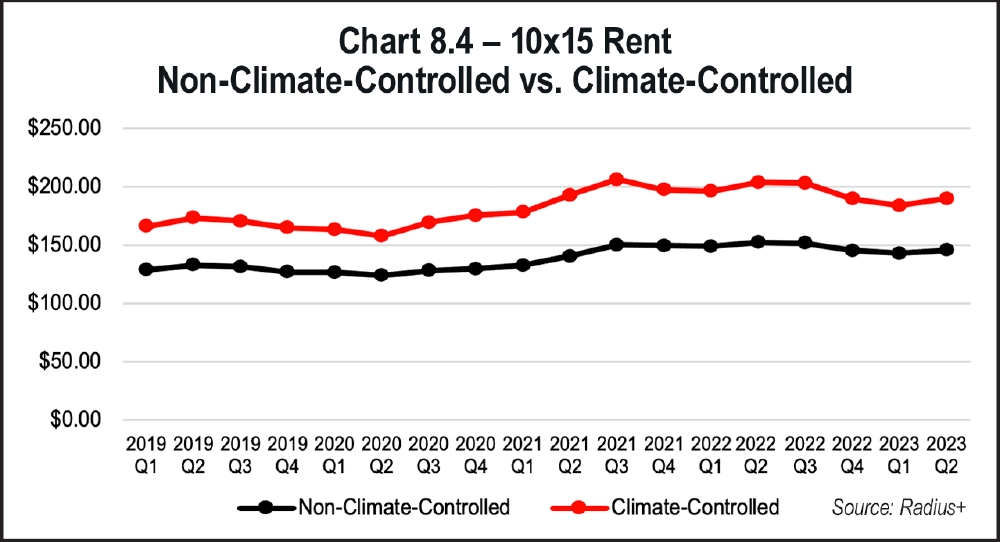
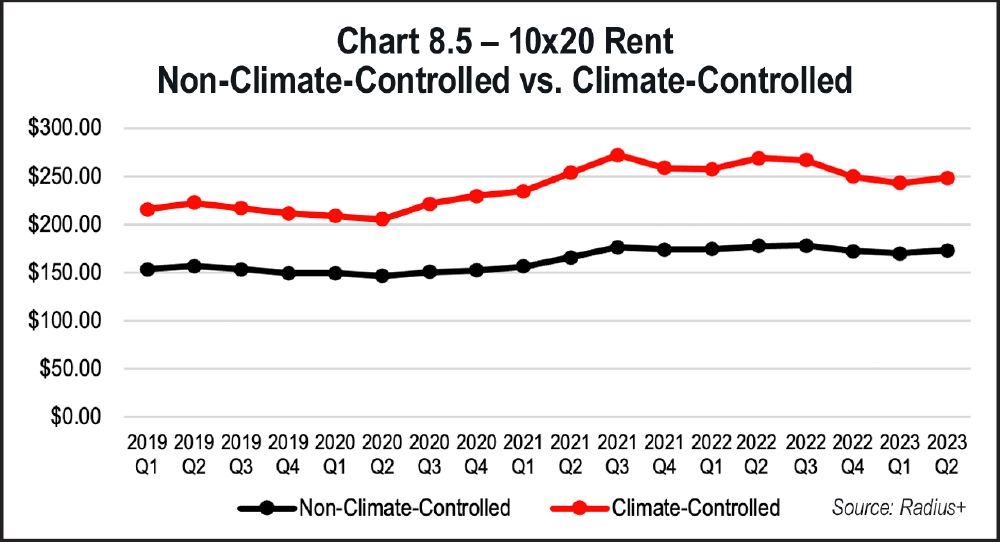
Charts 8.1, 8.2, 8.3, 8.4, and 8.5 provide side-by-side comparisons of rental rates for climate-controlled units and non-climate-controlled units by size. It is immediately obvious that climate-controlled units fetch higher rental rates. Since operators provide climate-control features to protect tenants’ stored goods from damage, they can charge more for the same amount of space. Climate-controlled units also produce an additional expense for the facility, so operators must charge higher rates to offset those costs.
As shown in Chart 8.1, there is a nearly $10 difference between rates for climate-controlled and non-climate-controlled 5-by-5 units most quarters. That gap shrunk by about two dollars in the fourth quarter of 2022, when non-climate-controlled 5-by-5s were at $53.15 and climate-controlled 5-by-5s were $61.70. Chart 8.2 reports an approximately $20 difference in quarterly rates for 5-by-10s of both unit types, but that variance lessened slightly in Q4 2022 and Q1 2023 ($17.98 and $17.19, respectively). Most quarters, there’s a nearly $30 price gap for rental rates of climate-controlled and non-climate-controlled 10-by-10s, according to data in Chart 8.3. However, the difference was widened to $35.05 in Q3 2022. For the last four quarters within Chart 8.4, climate-controlled 10-by-15s commanded rental rates that were $40.74 to $51.40 higher than non-climate-controlled 10-by-15s. There’s an even larger price gap when it comes to 10-by-20s. Chart 8.5 shows that climate-controlled 10-by-20s collected $73.24 to $88.77 more than non-climate-controlled 10-by-20s from Q3 2022 to Q2 2023, even though the year-over-year (Q2 2022 to Q2 2023) rental rates for climate-controlled 10-by-20s dropped by $20.72.
As we delve into data by region, keep in mind that some municipalities across the country have been enacting moratoriums on new self-storage development. Though some are temporary, moratoriums impact self-storage supply and can create an imbalance within market areas. When no new supply is permitted, demand will eventually surpass supply, and rental rates should always keep pace with demand.
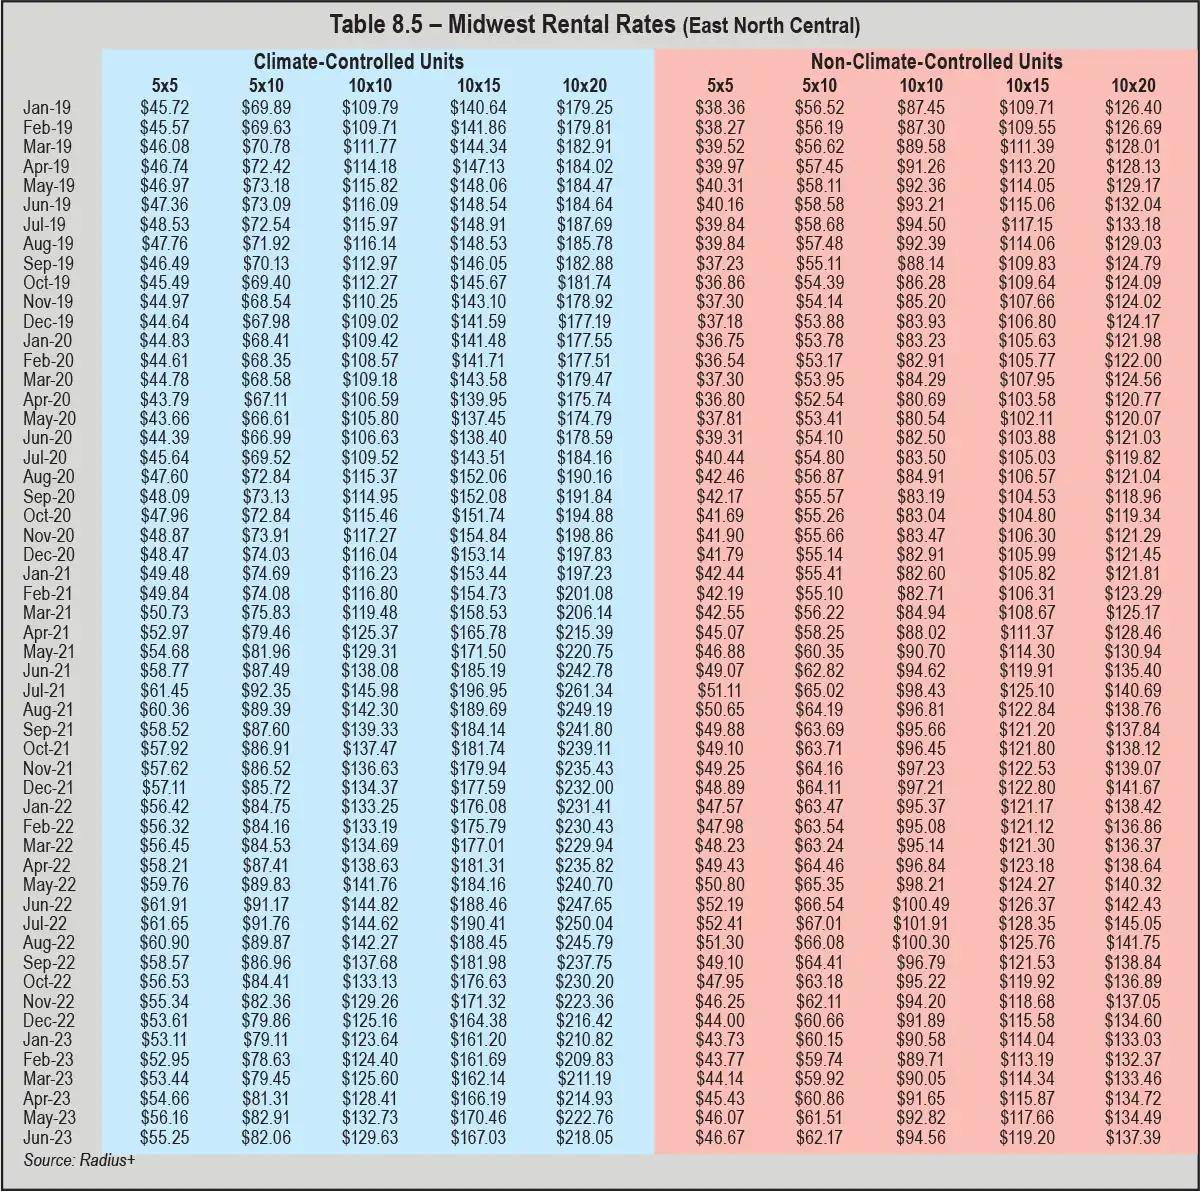
Table 8.5 shows that new highs for all five non-climate-controlled unit sizes were posted in July 2022 (the first month of the third quarter), but those top rates were eroded by six consecutive months of declines. Rates experienced upward movement from March 2023 through June 2023, yet never managed to return to the highs of July 2022. Like non-climate-controlled units, year-over-year (June 2022 to June 2023) rental rate declines were reported for all climate-controlled units in the Midwest (East North Central) region. One difference noted between the unit types is that rates fell in June 2023 for all climate-controlled units, whereas all non-climate-controlled units posted rental rate increases that month.
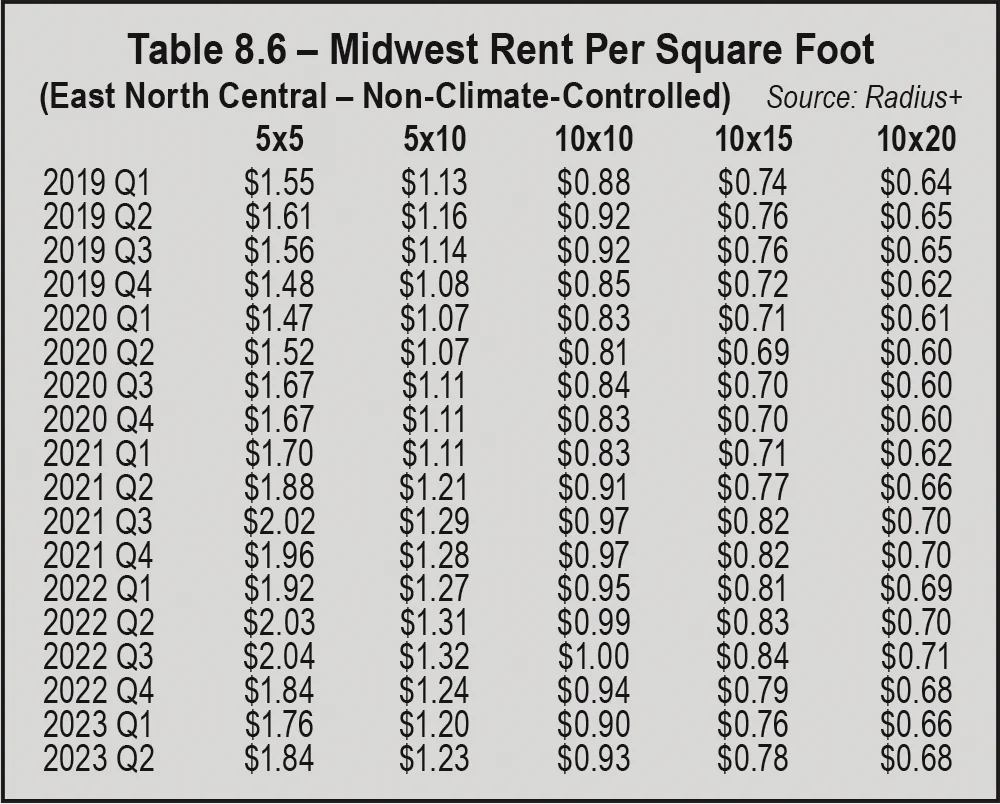
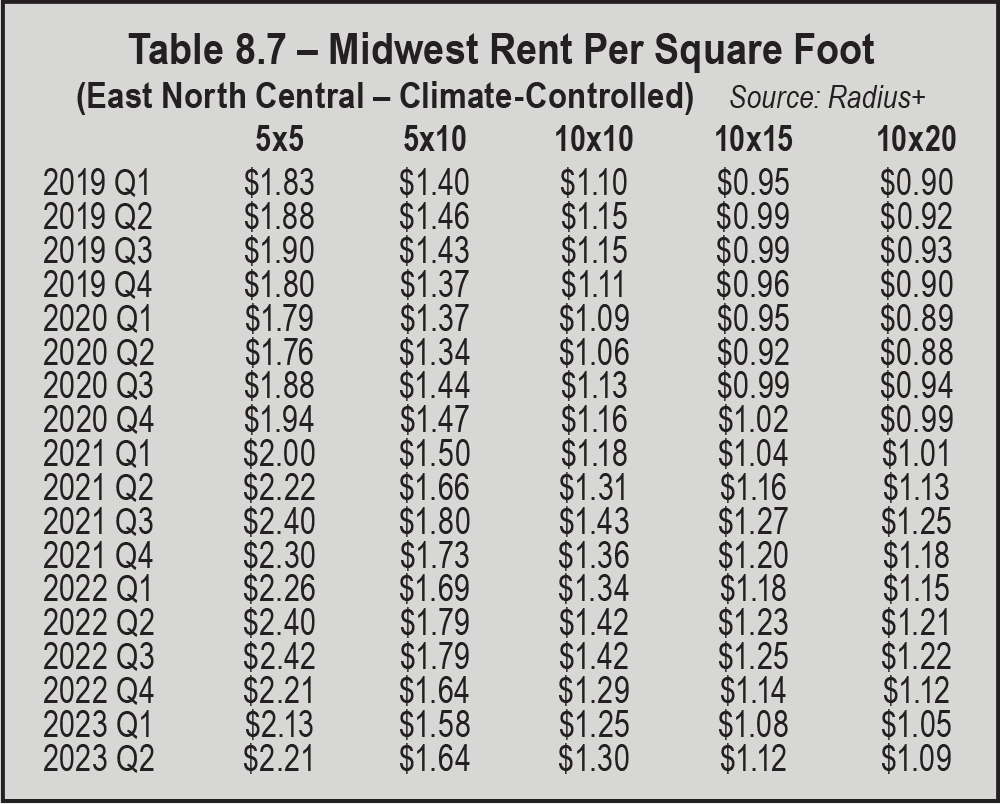
Tables 8.6 and 8.7 show rates per square foot for all unit sizes and types in the Midwest (East North Central) region. Non-climate-controlled units posted the highest rates in the Q3 2022, and 10-by-10s managed to reach $1.00 per square foot that quarter for the first and only time. Alternatively, topmost rates for four climate-controlled unit sizes were reported in the third quarter of 2021; 5-by-5s had their highest rates ($2.42 per square foot) in Q3 2022. From Q2 2022 to Q2 2023, both climate-controlled and non-climate-controlled 5-by-5s had the most substantial year-over-year losses per square foot (21 cents and 19 cents, respectively). For the same period, all other unit sizes and types also reported rental rate declines, but they were greater for climate-controlled units, which experienced 11 cent to 21 cent losses; rates dropped for non-climate-controlled by 2 cents to 19 cents.
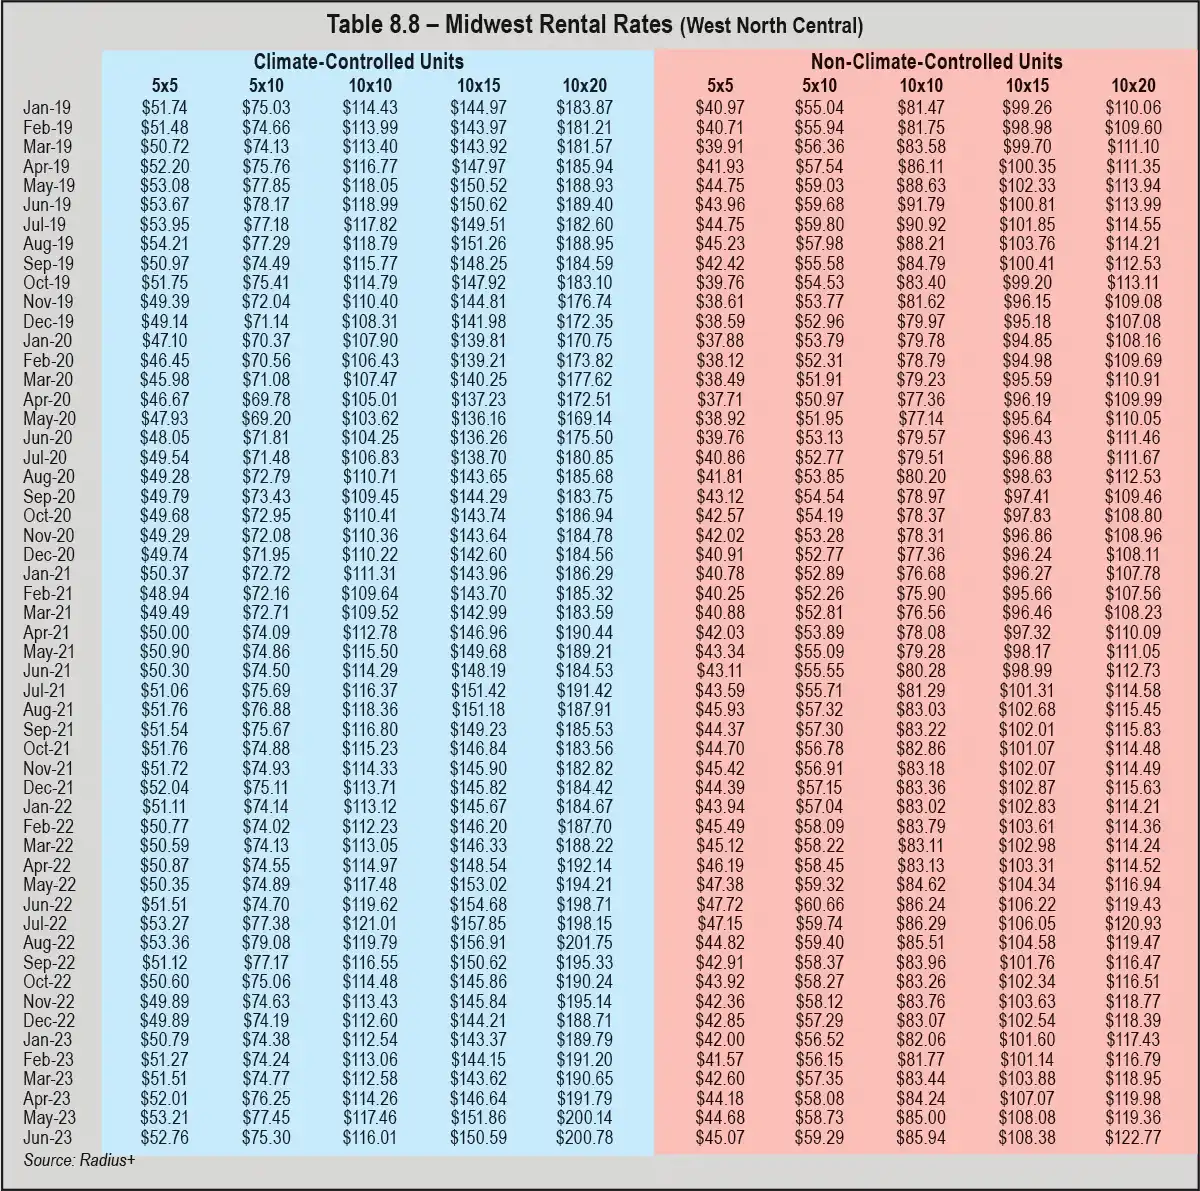
In the West North Central region of the Midwest, four of five climate-controlled unit sizes reported increases to rental rates in July 2022. Table 8.8 shows that rates for climate-controlled 10-by-20s fell by 56 cents that month, whereas the other four unit sizes had rate increases of a few dollars. The highest rates for climate-controlled 10-by-10s and 10-by-15s were in July 2022, and the other three sizes posted topmost rates in August of 2022. Rental rates for climate-controlled 5-by-5s, 5-by-10s, and 10-by-20s were slightly higher in June 2023 than June 2022. As for non-climate-controlled units in this region, only 10-by-15s and 10-by-20s had better rates in June 2023 than June 2022; rental rates declined by $2.65 (5-by-5s) or less during that same period. However, rates for all non-climate-controlled unit sizes increased increases from March 2023 through June 2023, except for 10-by-20s in May 2023, which dipped by 62 cents before rising $3.41 to $122.77 the next month.
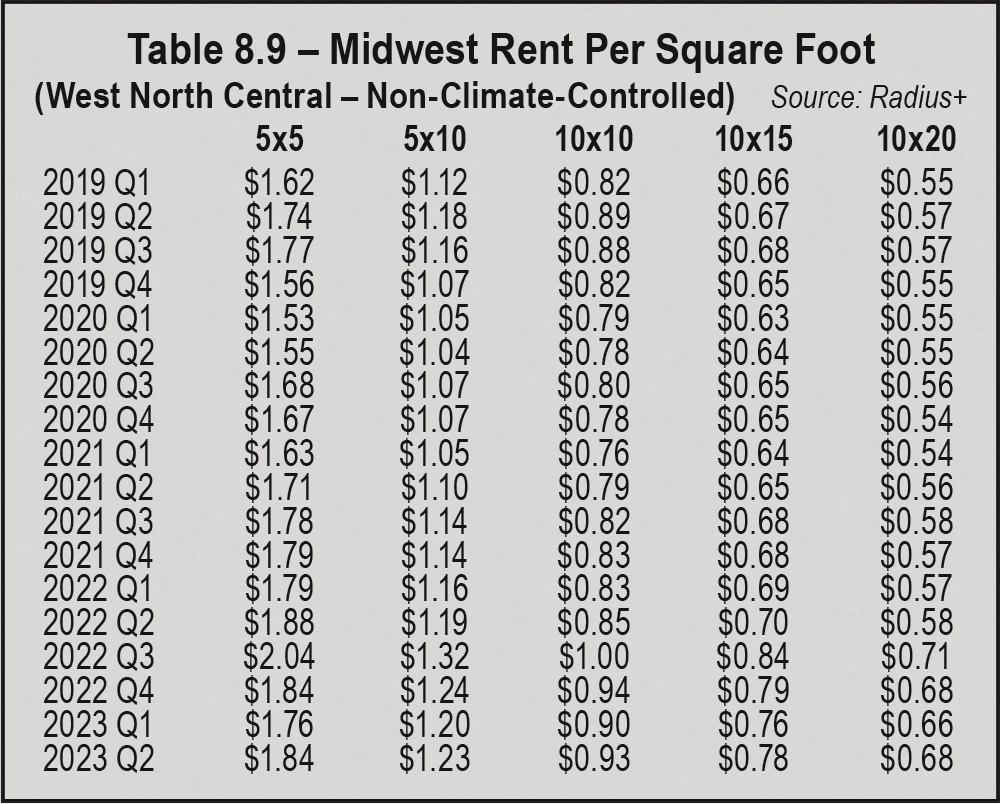
Table 8.9 shows that every non-climate-controlled unit size had topmost rates per square foot in Q3 2022. Within Q3 2022, two firsts are visible: 5-by-5s (25 square feet) reached $2.04 and 10-by-10s (100 square feet) hit $1.00. Those highs were short lived, however, as rental rates per square foot for all non-climate-controlled units dropped in Q4 2022 and Q1 2023. Rates did rebound in Q2 2023, and four of the five unit sizes managed to post higher rates in Q2 2023 than Q2 2022; only 5-by-5s experienced a year-over-year rate decline (4 cents per square foot).
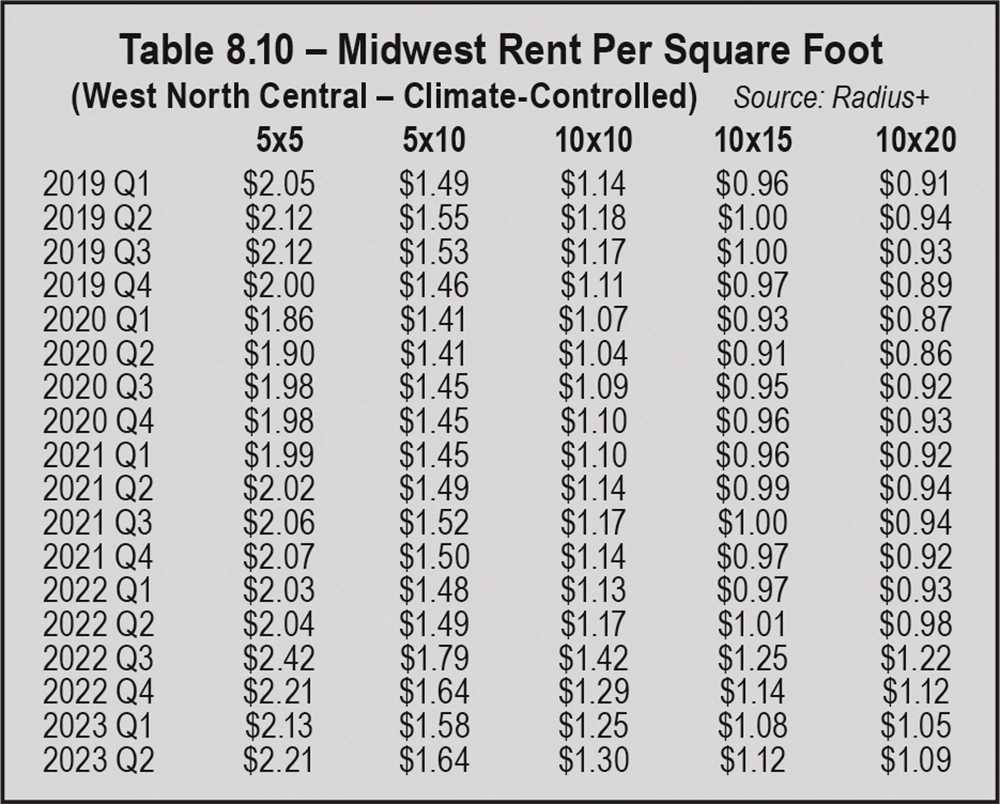
As for climate-controlled units, all sizes in Table 8.10 reported peak rental rates per square foot in Q3 2022, with gains of 24 cents or more from Q2 2022. Seasonal rate declines occurred in Q4 2022 and Q1 2023, followed by marginal increases of 4 cents to 8 cents per square foot in Q2 2023.
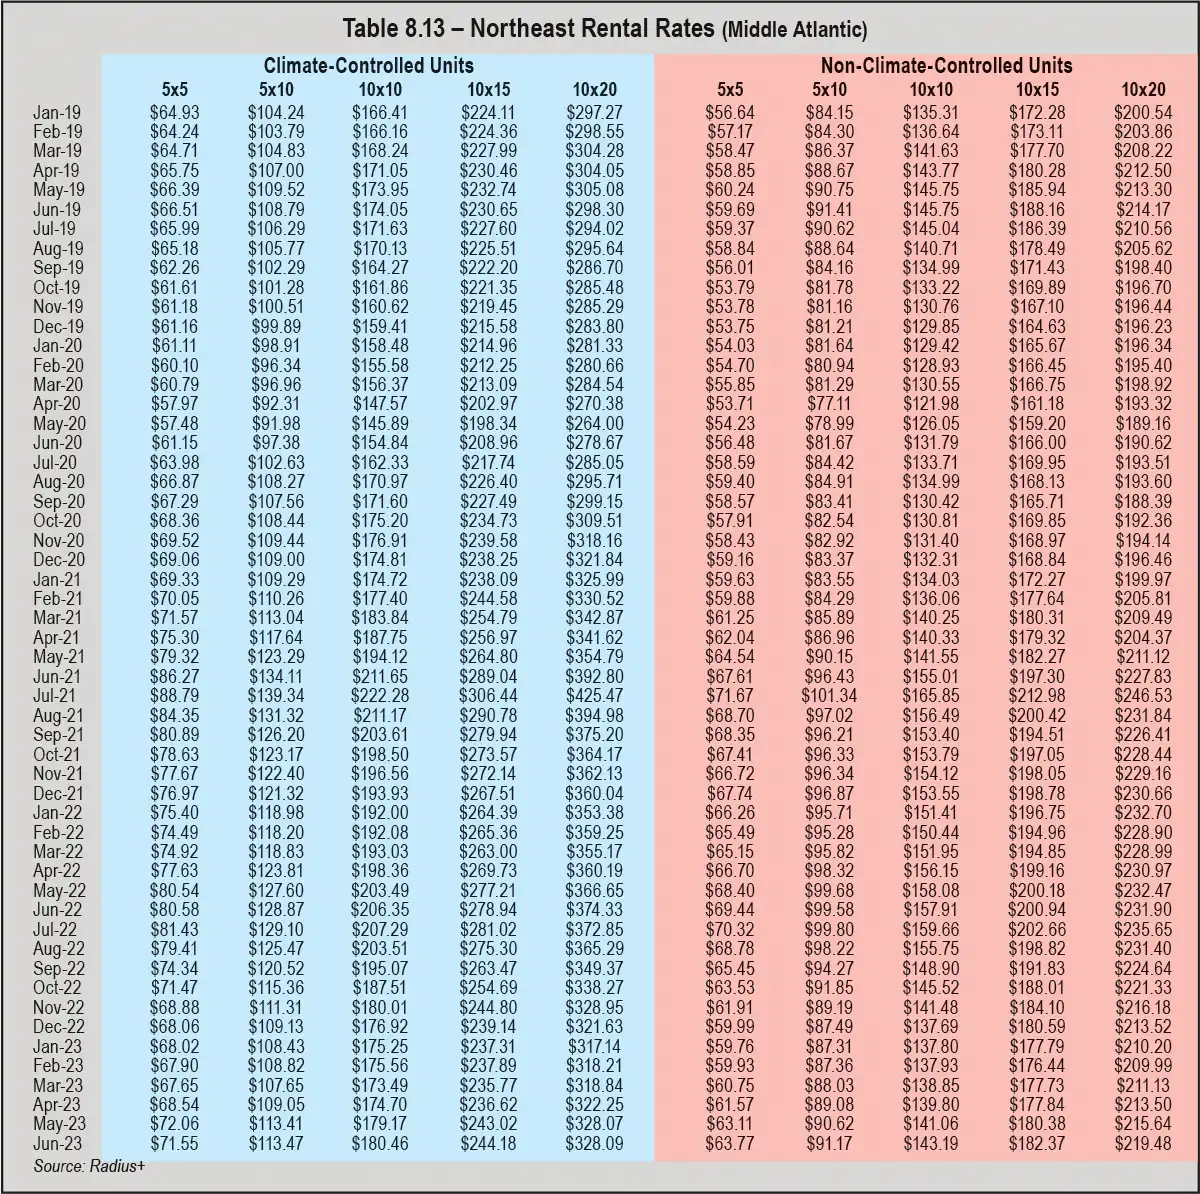
In the Middle Atlantic area of the U.S., all unit sizes and types reported the highest rates in July 2021, according to Table 8.13. Unfortunately, nine of 10 units have experienced double-digit rental rates decreases since those highs. Non-climate-controlled 5-by-5s had the smallest decline ($7.90) from July 2021 to June 2023, whereas rates for climate-controlled 10-by-20s were hit hardest, dropping nearly $100 (from $425.47 to $328.09).
Year-over-year (June 2022 to June 2023) rental rate declines were reported for each unit size and type; during that same time, rates for climate-controlled 10-by-20s fell $46.24 and six others posted double-digit declines. Although there were several months of across-the-board increases, mostly from March 2023 to June 2023, those gains didn’t outweigh the losses that occurred from August 2022 through January 2023.
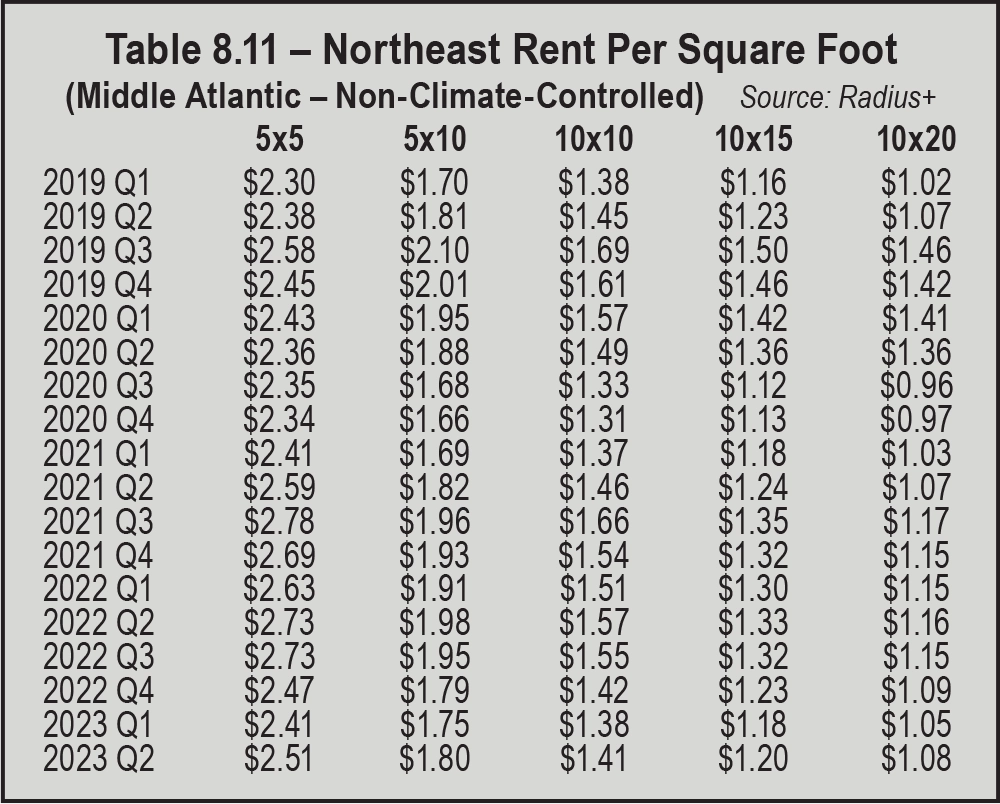
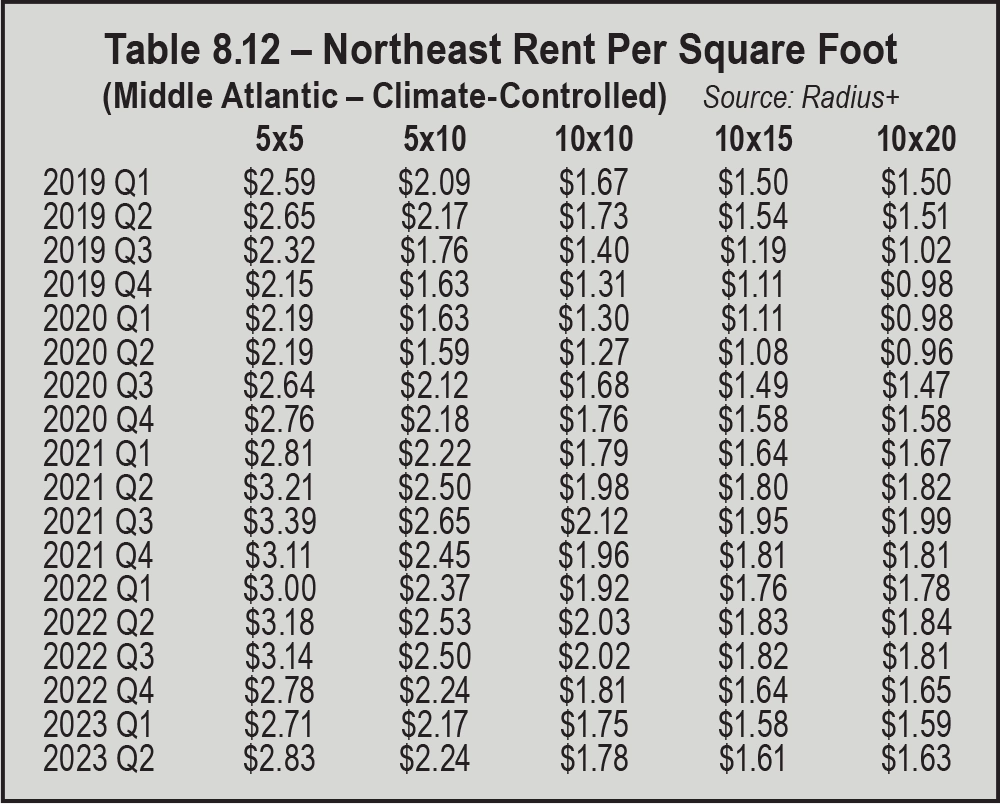
When looking at the most recent data (Q3 2022 to Q2 2023) for rental rates by square foot in Tables 8.11 and 8.12, declines are visible for three consecutive quarters (Q3 2022 through Q1 2023). Throughout that period, the rate for non-climate-controlled 5-by-5s (25-square-foot units) remained at $2.73 per square foot in Q3 2022; all other unit sizes and types experienced rental rate declines. Conversely, rates increases were posted in Q2 2023 for climate-controlled and non-climate-controlled units of all sizes, but those rental rates were still significantly lower than the previous year (Q2 2022). In fact, double-digit rate decreases can be calculated for nine of the 10 unit sizes from Q2 2022 to Q2 2023; the largest was 35 cents for climate-controlled 5-by-5s and the smallest was 8 cents for non-climate-controlled 10-by-20s. Both non-climate-controlled and climate-controlled 5-by-5s had topmost rates per square foot in Q3 2021 ($2.78 and $3.39, respectively).
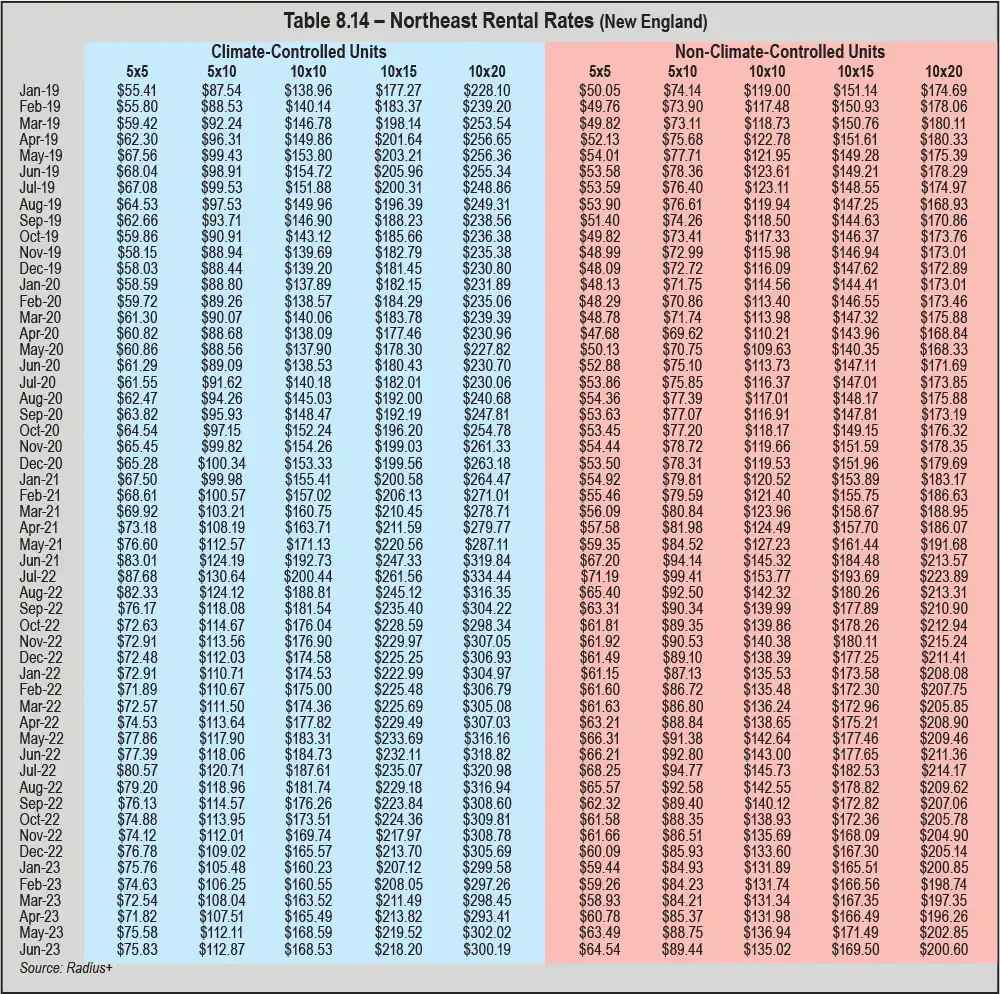
Data in Table 8.14 shows that all sizes of climate-controlled and non-climate-controlled units posted uppermost rates in July 2021. July 2022 was another good month, with all 10 units reporting rental rate increases. However, those gains were lost in August and September 2022 with across-the-board declines. Rates continued to drop for most unit sizes in the fourth quarter of 2022 and into the first quarter of 2023: October (eight of 10), November (nine of 10), December (eight of 10), and January (all 10). All 10 units’ rates increased in May 2023, but dipped again in June 2023 for six sizes. From June 2022 to June 2023, year-over-year rental rate declines are seen for all sizes of climate-controlled and non-climate-controlled unit sizes.
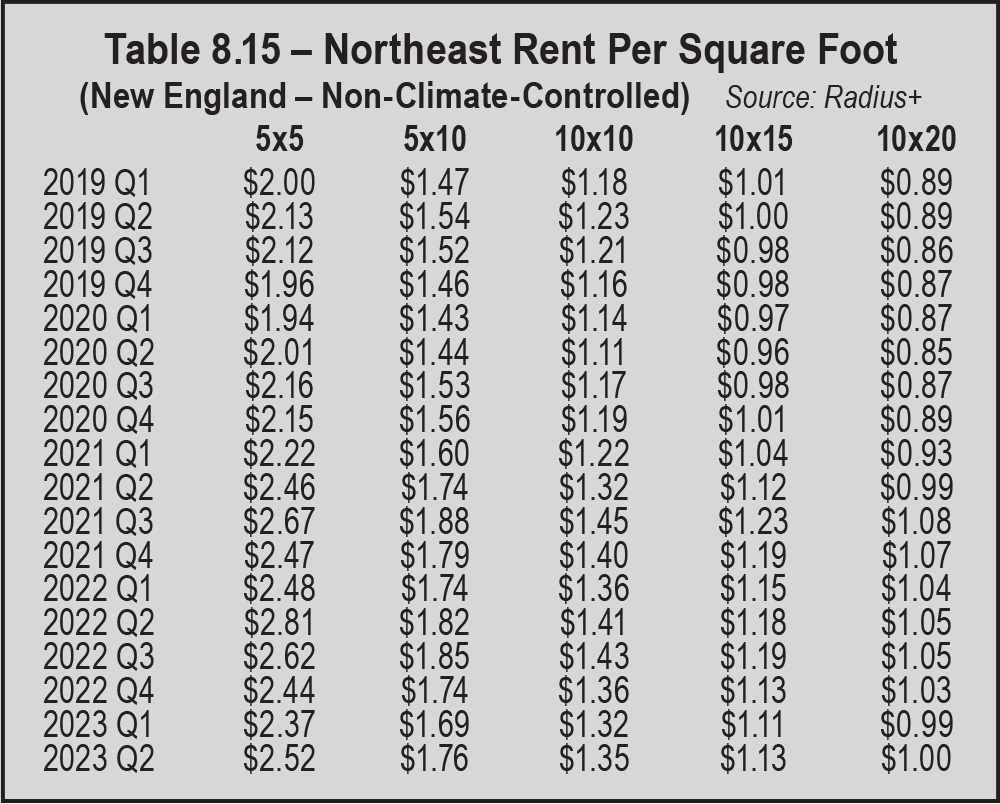
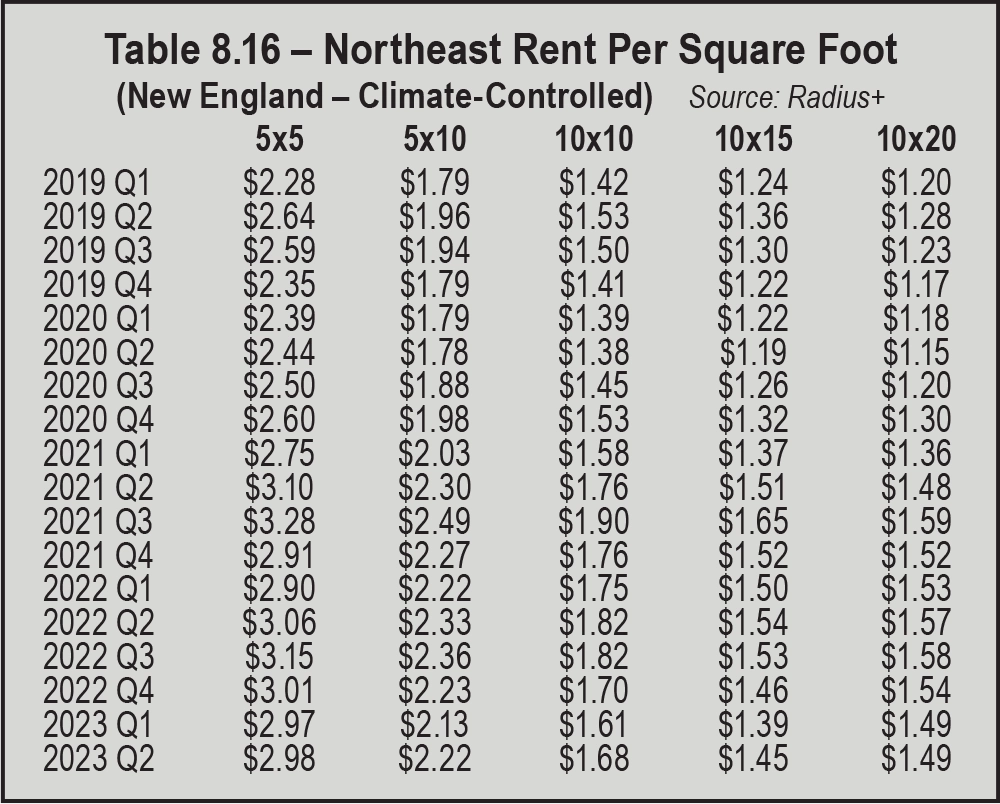
Tables 8.15 and 8.16 show rental rates per square foot by quarter for non-climate-controlled and climate-controlled units in New England. The highest rates for non-climate-controlled 5-by-5s ($2.81 per square foot) were posted in Q2 2022, whereas all other unit sizes of that type had top rates in Q3 2021. For all non-climate-controlled and climate-controlled unit sizes, rental rates declined in Q4 2022 and Q1 2023 and increased in Q2 2023 (except for climate-controlled 10-by-20s’ rates, which stayed at $1.49). Year over year (June 2022 to June 2023), rates for all units dropped by 3 cents to 30 cents.
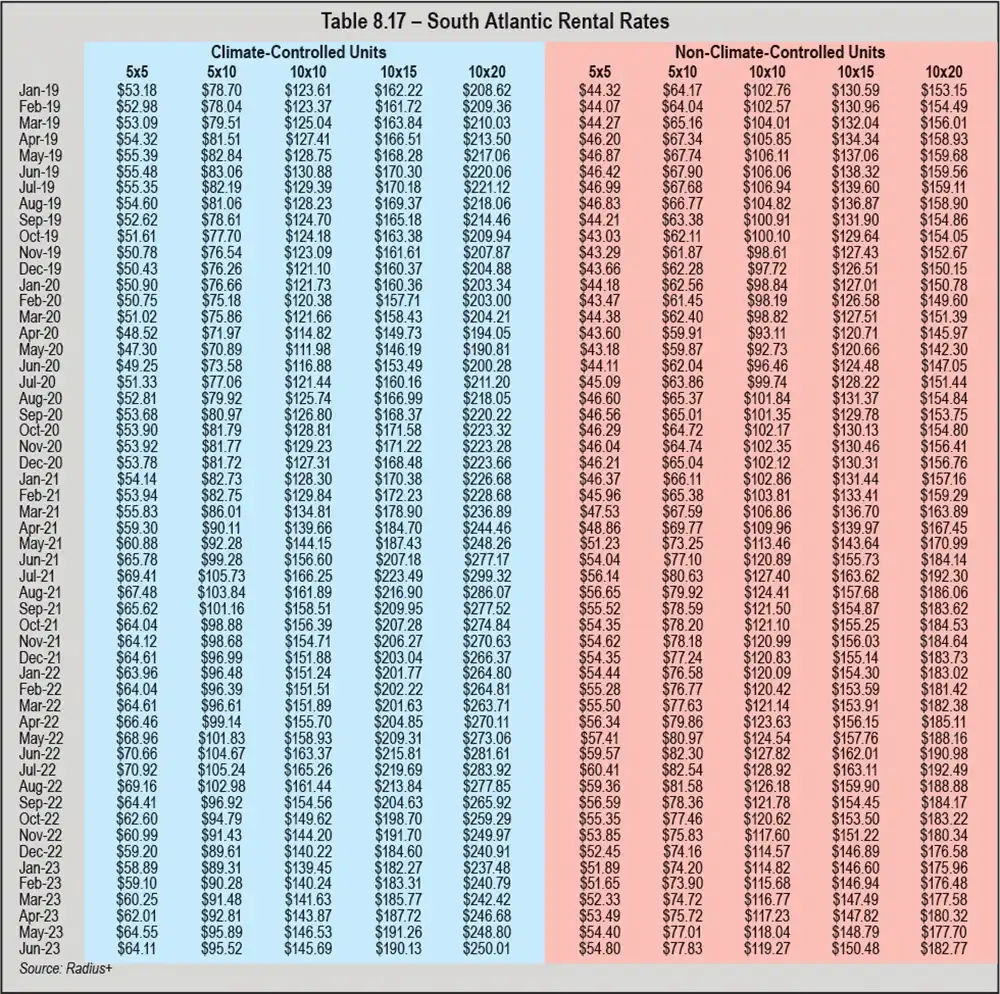
For the South Atlantic, data in Table 8.17 shows a few across-the-board trends. Similar to other regions of the United States, rental rates for all unit sizes and types in this area increased in July 2022 before declining in August and September of 2022, but three more consecutive months of decreases were reported as well (making up Q4 2022). Eight of 10 units posted rental rate declines in January 2023; non-climate-controlled 5-by-10s and 10-by-10s had minimal rate increases that month. In February 2023, rates dipped a small amount for non-climate-controlled 5-by-5s and 5-by-10s, whereas eight units reported rate increases; rental rates ticked up marginally for all units in March and April of 2023. Only non-climate-controlled 10-by-20s experienced a drop in rental rates during May 2023, but four climate-controlled units did in June 2023. Year-over-year (June 2022 to June 2023) rental rate declines are seen for all 10 unit sizes, ranging from $4.47 (non-climate-controlled 5-by-10s) up to $31.60 (climate-controlled 10-by-20s).
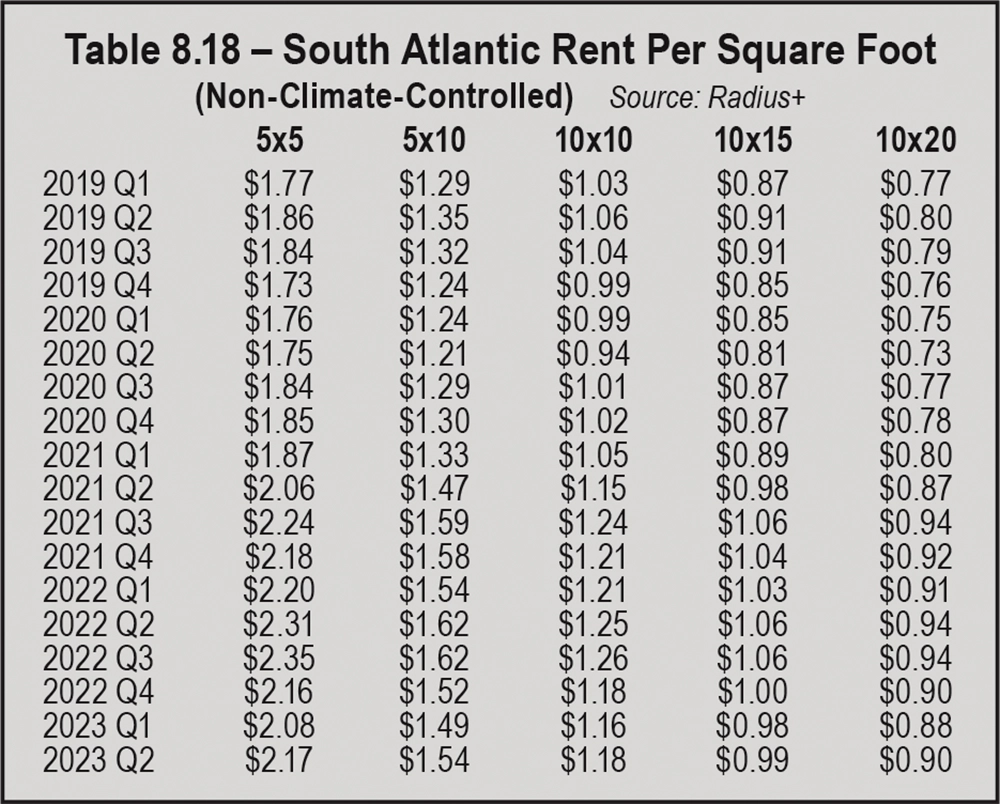
Table 8.18 provides insights into the South Atlantic’s rents per square foot for non-climate-controlled units. Topmost rates were reported for Q3 2022 for all unit sizes, however rates for three of those (5-by-10s, 10-by-15s, and 10-by-20s) remained the same from the previous quarter. All five unit sizes posted rental rate declines in Q4 2022 and Q1 2023, dropping by 27 cents for 5-by-5s, 13 cents for 5-by-10s, 10 cents for 10-by-10s, 7 cents for 10-by-15s, and 6 cents for 10-by-20s. Then, in Q2 2023, rates increased minimally for all five unit sizes, but those upticks weren’t enough to match the highs of Q3 2022 or Q2 2022. The year-over-year (Q2 2022 to Q2 2023) rate declines ranged from 4 cents (10-by-20s) to 14 cents (5-by-5s). Rates for both 10-by-10s and 10-by-15s dropped by 7 cents per square foot from Q2 2022 to Q2 2023.
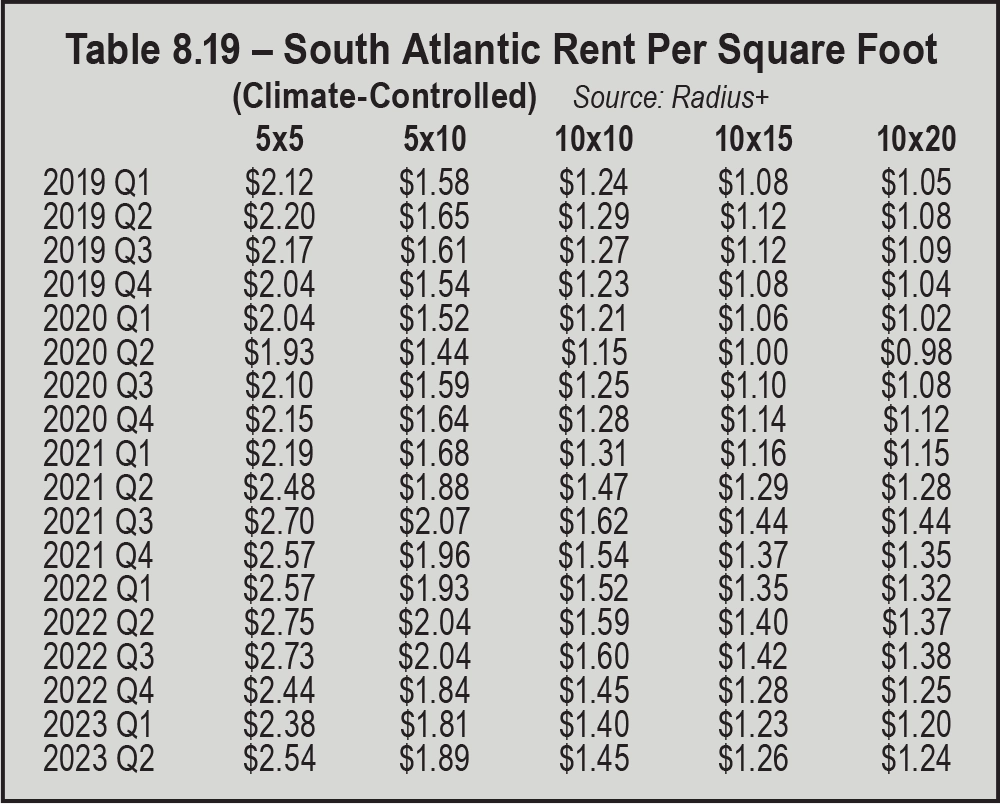
As for climate-controlled units in the South Atlantic, shown in Table 8.19, rental rates per square foot mostly followed the same pattern, decreasing in Q4 2022 and Q1 2023 and increasing in Q2 2023. Compared to non-climate-controlled units, Q3 2022 was different for climate-controlled units: three unit sizes had rental rate declines of one or two cents (5-by-5s, 10-by-10s, and 10-by-15s), one size had a one cent rental rate increase (10-by-20s), and one size’s rate was unchanged from the previous quarter (5-by-10s at $2.04). Year over year, the greatest rental rate decrease was for 5-by-5s, which dropped 21 cents per square foot; the other four sizes’ rates declined by 13, 14, or 15 cents.
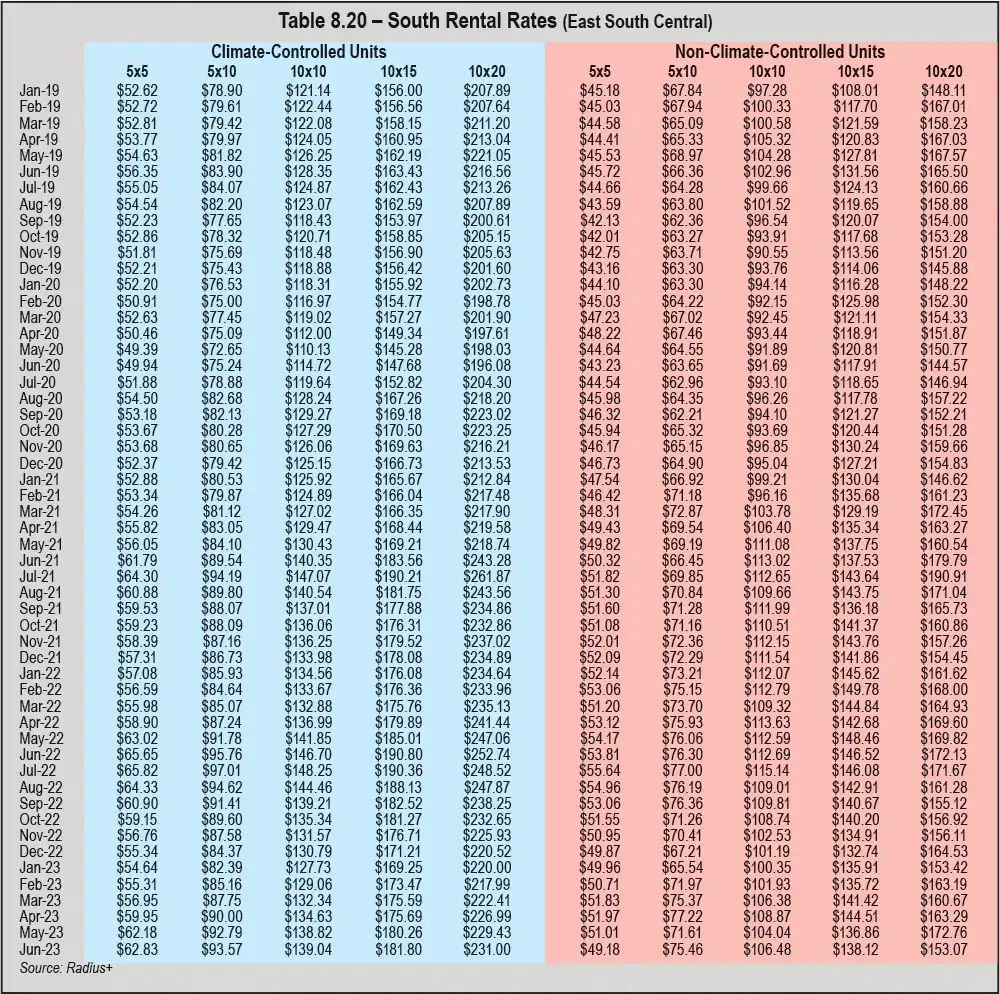
When looking at Table 8.20, one can see that there was much more variation in the South (East South Central) than other regions. However, there are a handful of consistencies to point out: All 10 unit sizes reported rental rate decreases in August 2022 and November 2022, and all 10 posted increased rates in April 2023. In addition, year-over-year (June 2022 to June 2023) rental rate drops were calculated for all unit sizes, ranging from less than a dollar (84 cents for non-climate-controlled 5-by-10s) to $21.74 for climate-controlled 10-by-20s. In July 2022, the two largest unit sizes of both unit types had rate declines, whereas the other six units had topmost rates that month. For climate-controlled 10-by-15s and 10-by-20s, the best month was June 2022. Climate-controlled units had more across-the-board trends than non-climate-controlled units: All five sizes had rental rate declines in September 2022, October 2022, December 2022, and January 2023, as well as increases in March 2023, May 2023, and June 2023. In February of 2023, only climate-controlled 10-by-20s and non-climate-controlled 10-by-15s posted rental rate decreases.
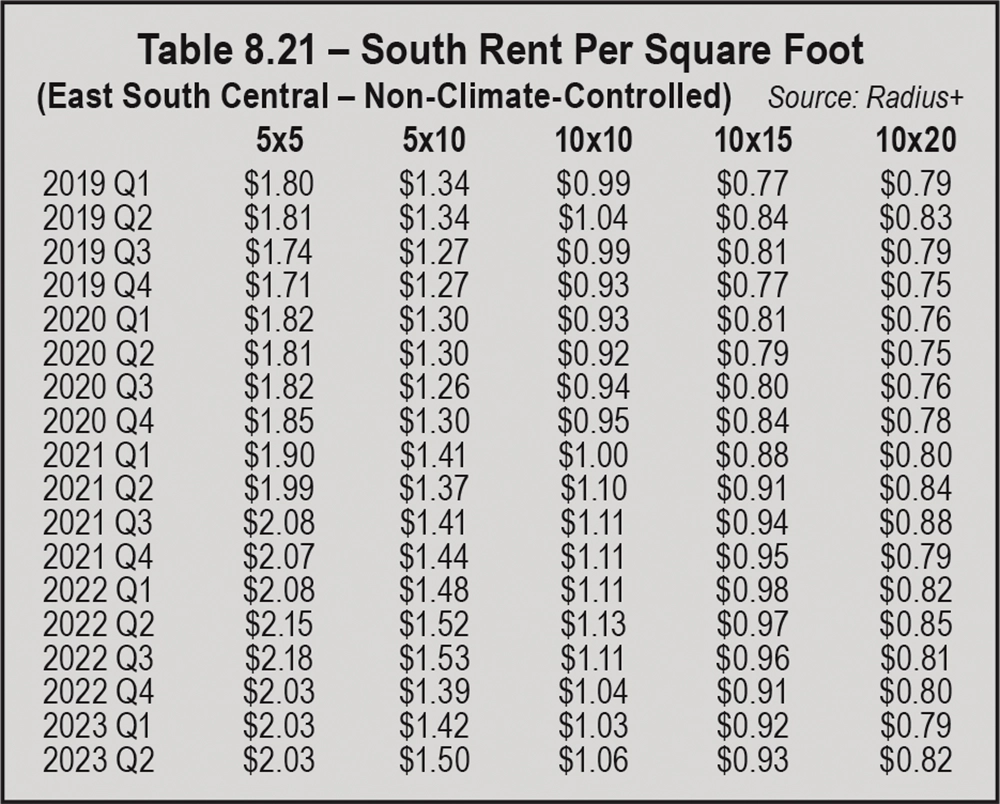
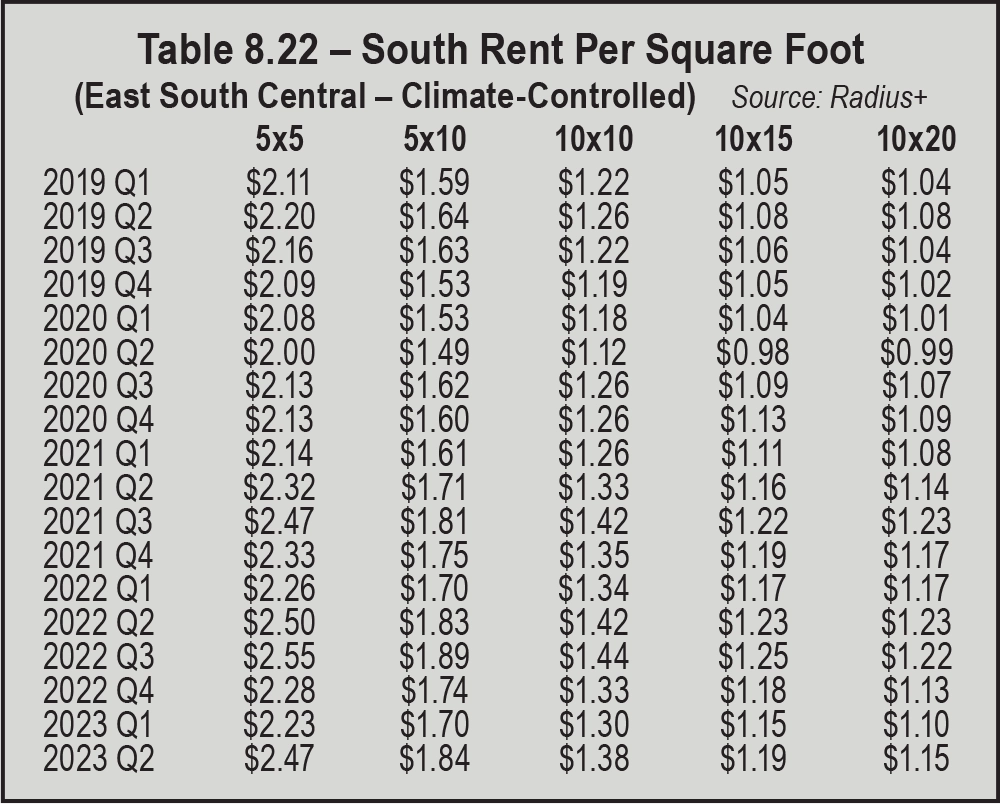
Tables 8.21 and 8.22 offer a quarterly look at rents per square foot. Compared to other regions, the year-over-year rental rate decreases in the South (East South Central) area were much less. As a matter of fact, one unit size (climate-controlled 5-by-10s) actually managed to post a one cent increase, from $1.83 in Q2 2022 to $1.84 in Q2 2023. The uniformity in rental rates for climate-controlled units seen in Table 8.20 is also present in Table 8.22, with rates for all sizes dropping in Q4 2022 and Q1 2023 and increasing in Q2 2023. Only climate-controlled 10-by-20s reported a rate decrease in Q3 2022; for the other four sizes, that was the most profitable quarter. For non-climate-controlled 5-by-5s, rates per square foot remained at $2.03 for three consecutive quarters (Q4 2022 to Q2 2023); that size had the most substantial year-over-year (Q2 2022 to Q2 2023) rate decline at 12 cents per square foot.
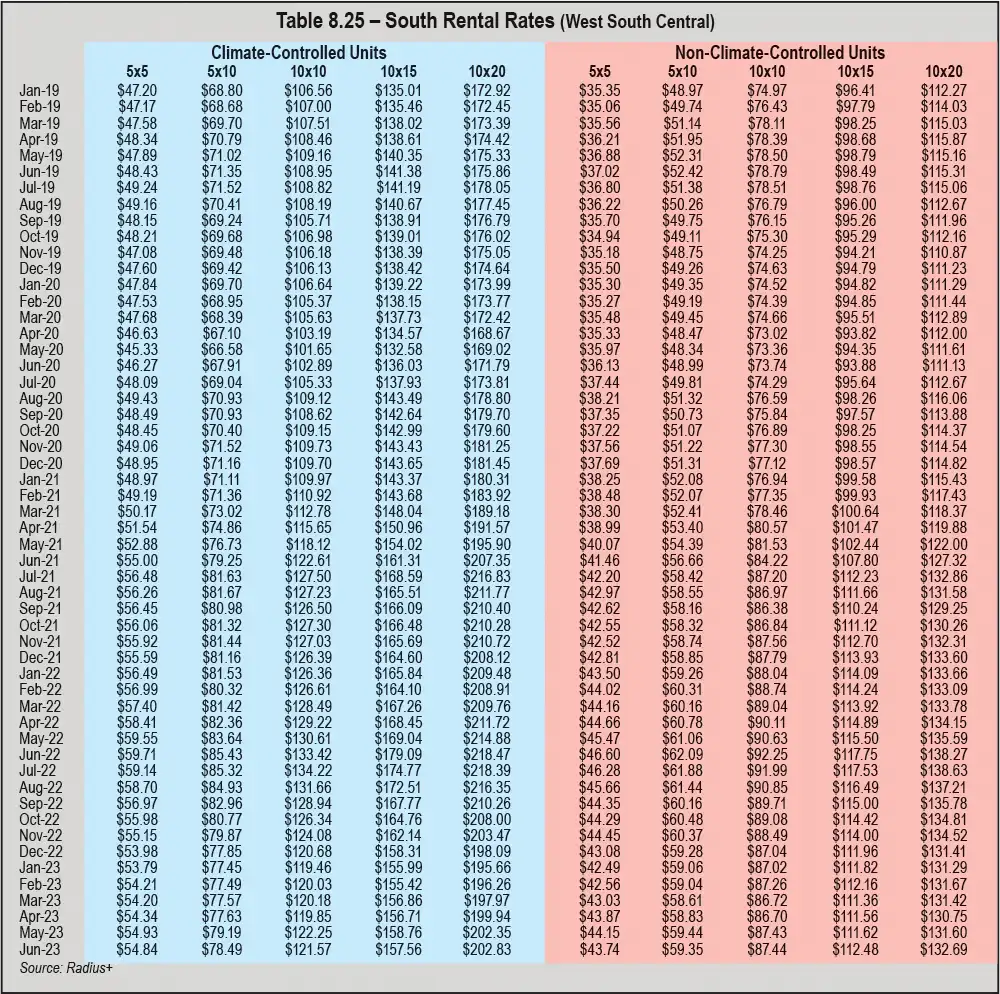
For the South (West South Central) region, Table 8.25 shows that rental rates were at their highest in June 2022 for all climate-controlled and non-climate-controlled unit sizes except climate-controlled 10-by-10s and non-climate-controlled 10-by-20s; those two units posted topmost rates in July 2022. Unlike units in other regions, rental rate decreases were reported for the majority (eight of 10) of units in the South (West South Central) region in July 2022; once again, climate-controlled 10-by-10s and non-climate-controlled 10-by-20s were the exception. From August 2022 through January 2023, across-the-board rate declines were posted by all units each month, minus two minimal rent increases: non-climate-controlled 5-by-10s in October 2022 and non-climate-controlled 5-by-5s in November 2022. Rental rates had marginal monthly increases from February 2023 through May 2023 for most unit sizes; there were several exceptions, however, mostly for non-climate-controlled units. Breaking the trend witnessed in other regions, more than half of the unit sizes listed in Table 8.23 reported decreased rents in June 2023. Compared to June 2022, all 10 units experienced year-over-year rental rate declines in June 2023; those losses ranged from approximately $3 to about $22.
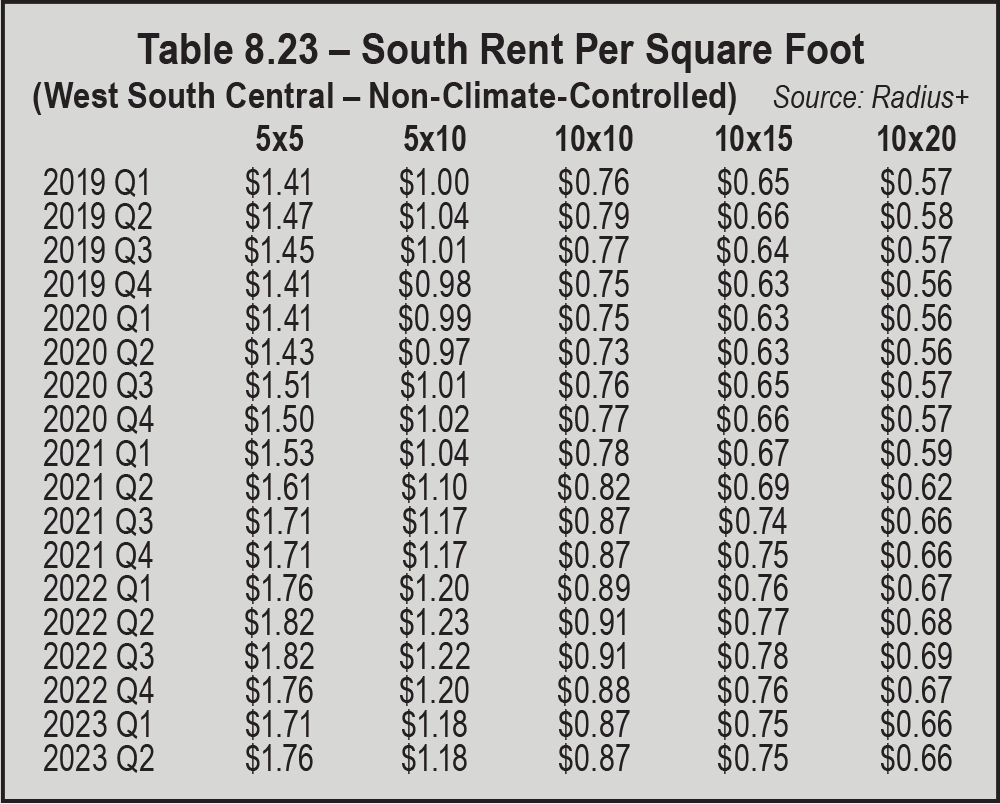
Table 8.23 shows the same data by rent per square foot on a quarterly basis for non-climate-controlled units. The best rates were posted in Q2 and Q3 2022; rental rates were unchanged for 5-by-5s and 10-by-10s at $1.82 and $0.91, respectively. From Q2 to Q3 2022, the other four unit sizes had minimal rental rate increases or decreases of 1 cent. All unit sizes reported rental rate declines of 1 cent to 6 cents in both Q4 2022 and Q1 2023. Then, in Q2 2023, only 5-by-5s managed to raise rents by 5 cents per square foot; rates for the other unit sizes were flat from the previous quarter. By square foot, the year-over-year (Q2 2022 to Q2 2023) rental rate decreases ranged from 2 cents to 6 cents.
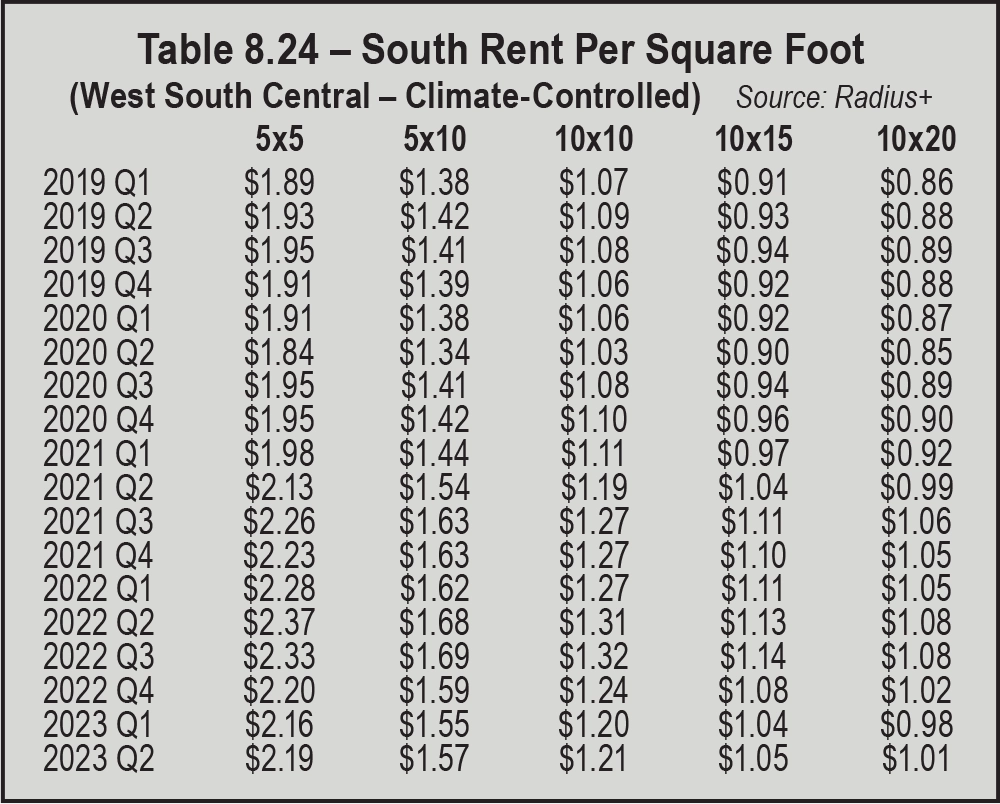
As for climate-controlled units, shown in Table 8.24, there are a few similarities to non-climate-controlled units in that region: All climate-controlled unit sizes had rental rate drops in Q4 2022 and Q1 2023 and from Q2 2022 to Q2 2023, but more substantial year-over-year losses (7 cents to 18 cents) were reported, even though all unit sizes posted increased rental rates in Q2 2023. In Q1 2023, rates for 10-by-20s dipped below $1.00 to $0.98 after six consecutive quarters above the $1 mark. Another oddity: Rates for 5-by-5s decreased 4 cents in Q3 2022; it was the only unit size to report a drop that quarter.
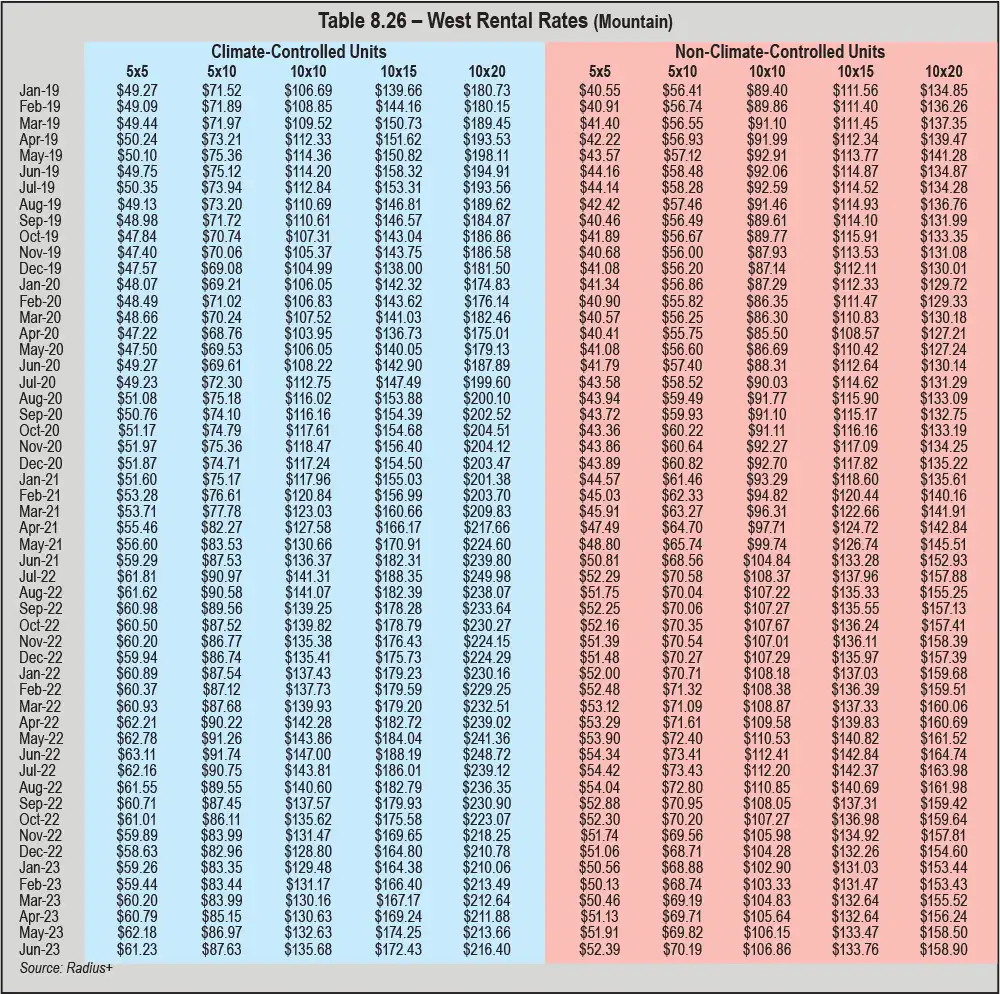
Within the West (Mountain) region, rental rate data in Table 8.26 shows that half of the units had topmost rates in June 2022, whereas rents for two non-climate-controlled units (5-by-5s and 5-by-10s) were highest in July 2022 and rates for two climate-controlled units (10-by-15s and 10-by-20s) were highest in July 2021. Besides non-climate-controlled 5-by-5s and 5-by-10s, all other units posted rental rate declines in July 2022. August, September, November, and December 2022 brought declines for all 10 unit sizes represented in the table. Conversely, all 10 unit sizes reported increased rates in May 2023. The months that make up Q1 2023 have less uniform rental rate movement. In January 2023, six unit sizes had declining rates while four had increasing rates. Then, in February 2023, rates were moving upward for seven of the 10 units. Only two climate-controlled units (10-by-10s and 10-by-20s) had rental rate declines in Marcy 2023. Rates dipped for climate-controlled 10-by-20s again in April 2023; that same month, non-climate-controlled 10-by-15s reported no change to its rental rate of $132.64. Although eight of the 10 unit sizes reported rental rate increases in June 2023, year-over-year decreases are shown for all unit sizes; those losses ranged from about $2 to $32.32 (climate-controlled 10-by-20s).
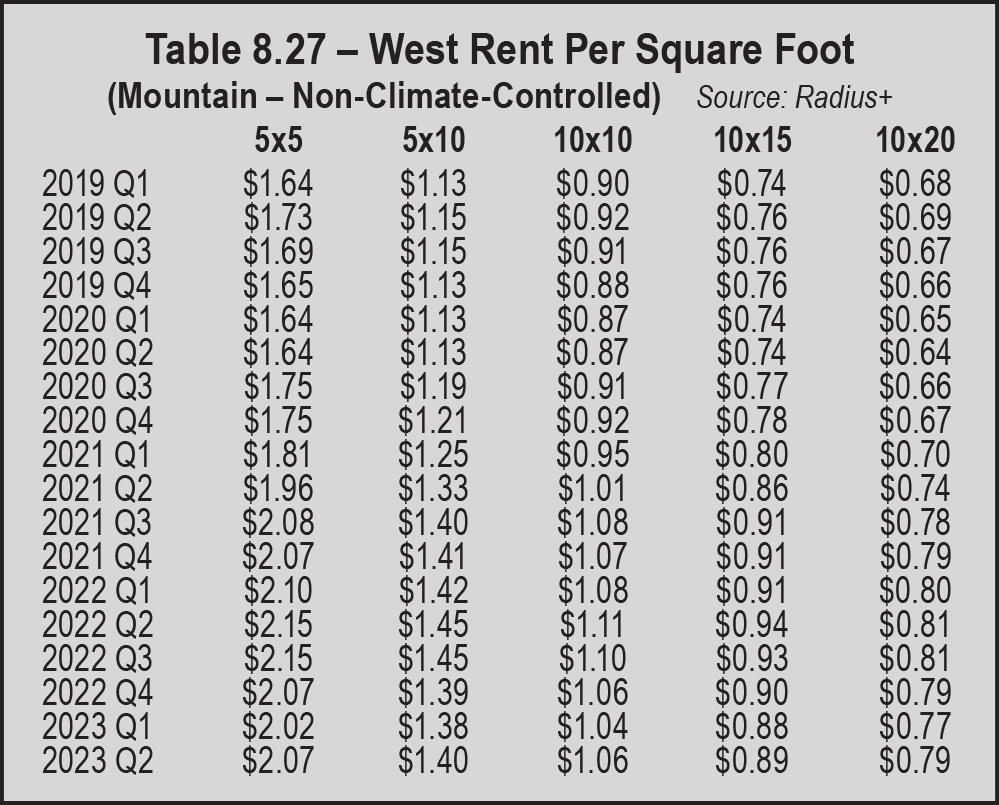
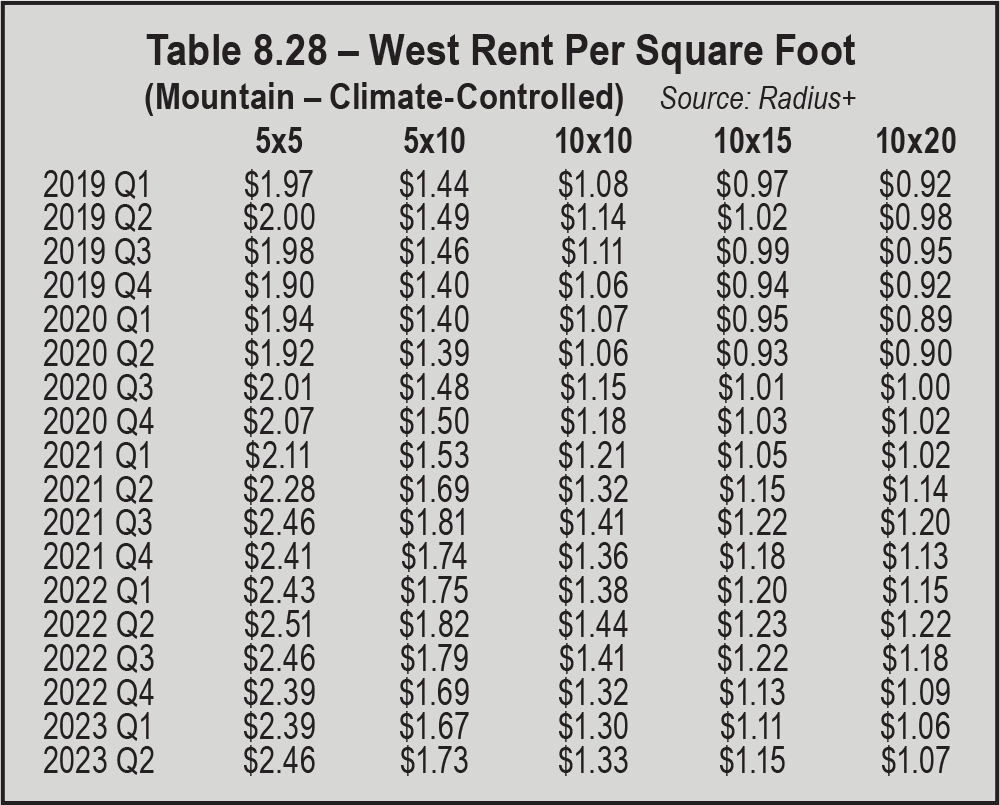
Tables 8.27 and 8.28, which detail rent per square foot for units within the West (Mountain) region, show that Q2 2022 was the best quarter for all sizes of climate-controlled and non-climate-controlled units. Additionally, rates either declined or remained flat for all climate-controlled and non-climate-controlled units in Q3 2022, Q4 2022, and Q1 2023. In Q2 2023, rates for all units were on the mend. Despite the Q2 2023 gains, all climate-controlled and non-climate-controlled units reported year-over-year rental rate declines. Of the two unit types, climate-controlled units had more substantial drops in rates from Q2 2022 to Q2 2023 (5 cents to 15 cents per square foot); rent losses for non-climate-controlled units ranged from 2 cents to 8 cents.
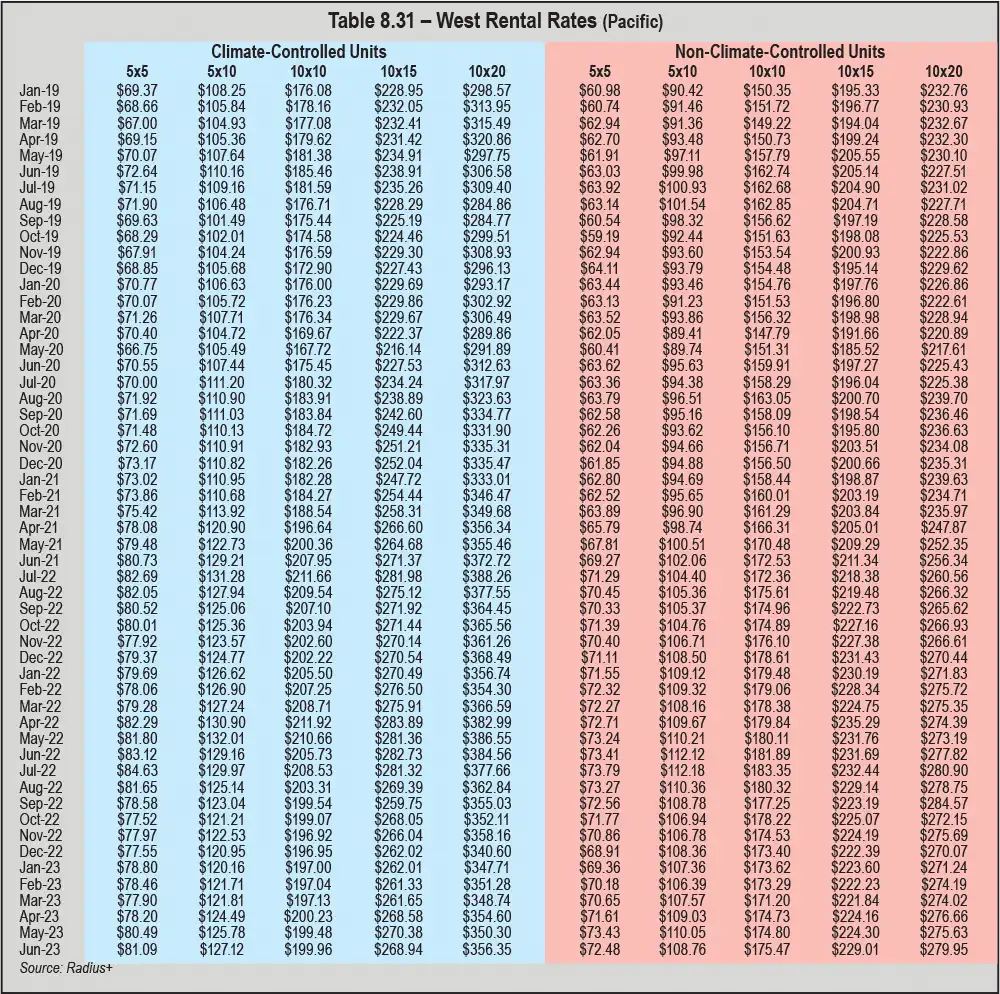
Unlike other regions, there are much fewer across-the-board trends for rental rates in the West (Pacific) region, as shown in Table 8.31. However, all 10 unit sizes did report rental rate declines in August 2022 and increases in April 2023. For non-climate-controlled units of all sizes, topmost rates were posted in July 2022. From June 2022 to June 2023, all 10 units experienced year-over-year rental rate declines. Though most were minimal (less than $2), two climate-controlled unit sizes had double-digit drops: 10-by-15s ($13.79) and 10-by-20s ($28.21).
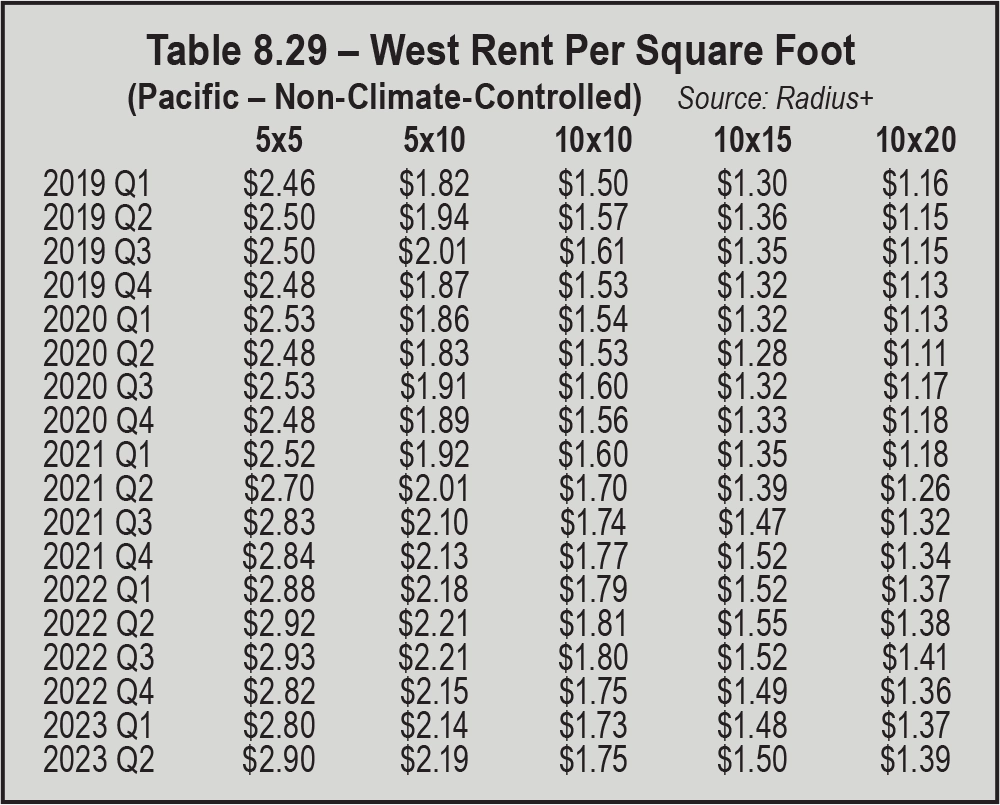
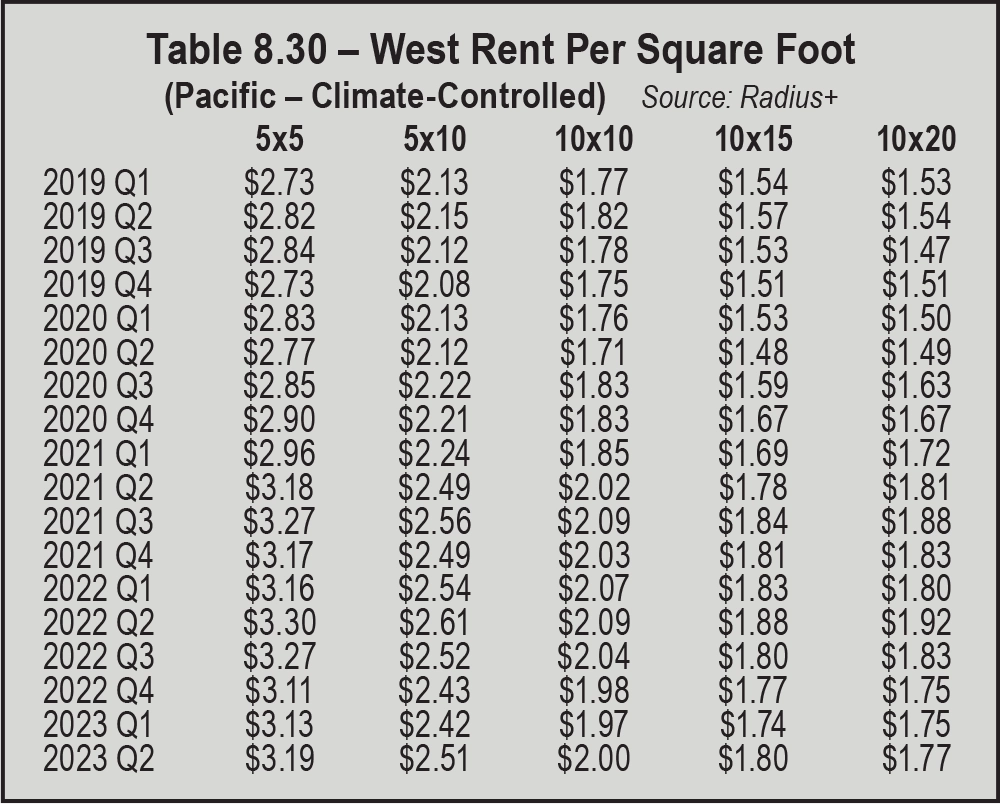
Tables 8.29 and 8.30 look at rent per square foot in the Pacific West. For all climate-controlled units, rents were highest in Q2 2022, whereas topmost rates for non-climate-controlled units were reported in either Q2 or Q3 2022. All non-climate-controlled and climate-controlled units experienced rental rate declines in Q4 2022. Only non-climate-controlled 10-by-20s and climate-controlled 5-by-5s posted marginal increases in Q1 2023 (1 cent and 2 cents, respectively); that same quarter, no change was reported for climate-controlled 10-by-20s. Rates increased for all units in the Pacific West during Q2 2023, but only non-climate-controlled 10-by-20s experienced a year-over-year (Q2 2022 to Q2 2023) rental rate increase (up 1 cent to $1.39 per square foot). Over that 12-month period, rates for all other units dropped by 2 cents to 15 cents per square foot.
Remember: Supply and demand impact rental rates. Your rates should reflect your facility’s available supply and demand within your local market. And while it may be tempting to lower your rates to attract new customers and/or match the competition, most industry veterans recommend that owner-operators sell value not price.