Section 7 Occupancy
Table 7.1 - Historical National Occupancy
P

roperly managed self-storage occupancy maximizes an operator’s bottom line, but misconceptions persist about the best occupancy strategy. Most industry operators try to keep occupancy between 90 percent and 95 percent. Some try to maintain 100 percent occupancy. Though it might seem counterintuitive, you are losing money if you keep your facility completely full. This leaves you with two options: add new units or raise rental rates.

How to measure occupancy is as important as maintaining the ideal occupancy. The two main ways to measure it are physical and economic. We report data in the Self-Storage Almanac based on physical occupancy. This measures the number of units rented. For example, if you have 100 units and 90 are occupied, then your facility’s physical occupancy is 90 percent.

By contrast, economic occupancy is based on the gross potential income you are collecting. Gross potential income factors in any concessions or discounts you give your customers. For example, if you have a 100-unit facility with 90 units rented and you give customers a one-month-free concession on the remaining 10 units, then your facility’s economic occupancy is 80 percent. This is because you collected no rent for one month on those 10 units, which decreased your income accordingly.

Kenneth Nitzberg, chairman and CEO of Devon Self Storage, based in Emeryville, Calif., says 85 percent occupancy is considered stabilized, and 90 percent is better. But too much above 90 percent is undesirable. “Because what that tells me is that we aren’t raising rents often enough or high enough to force a couple of people to move out or pay the higher rents,” Nitzberg says.

Housing Market Strain
“The self-storage industry continues to be impacted by the housing market,” Yardi Matrix stated in its December 2023 National Self Storage Report. “Rising housing costs and incomes that have not kept pace have resulted in one of the most unaffordable housing markets in the past 30 years, stifling home sales. With housing demand a key storage demand driver, the resulting housing slowdown is dampening storage occupancy and weighing down street rates. Occupancy is now back where it was pre-COVID, falling even lower in some Sun Belt markets that had previously benefited from COVID-era migration.”
Chart 7.1 - National Occupancy Rate by Quarter
Table 7.2 - National Occupancy Rate by Quarter
The report says national asking-rate growth stabilized in the prior six months, but street rates remain negative annually and sequentially. Supply under construction remains steady, but new starts are slowing. Time necessary to move to subsequent development stages has increased. This means more developers are delaying new projects.

“However, some are optimistic that as new home sales eventually find a bottom and new storage development slows, we will begin seeing improvements in storage occupancy and street rates,” according to the report.

National Occupancy Rates
Table 7.1 on page 63 is based on Q2 numbers between 2000 and 2023. Occupancy was 94.5 percent in 2021, the highest rate going back to 2000, when it was 83.7 percent. The 2023 rate of 91.6 percent decreased 1.8 percent from 93.4 percent in 2022. This follows a 1.1 percent decrease in 2022 from 94.5 percent in 2021 and a 2.3 percent increase in 2021 from 92.2 percent in 2020. The lowest occupancy percentage from Q2 2000 through Q2 2023 was 75.7 percent in 2010. Occupancy rates were in the 80s from 2000 through 2008; the 70s from 2009 through 2011; and the 80s or 90s from 2012 through 2023.

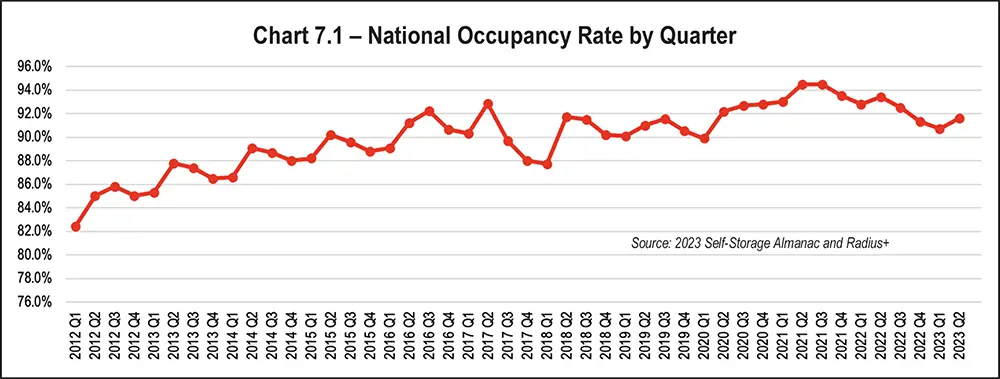
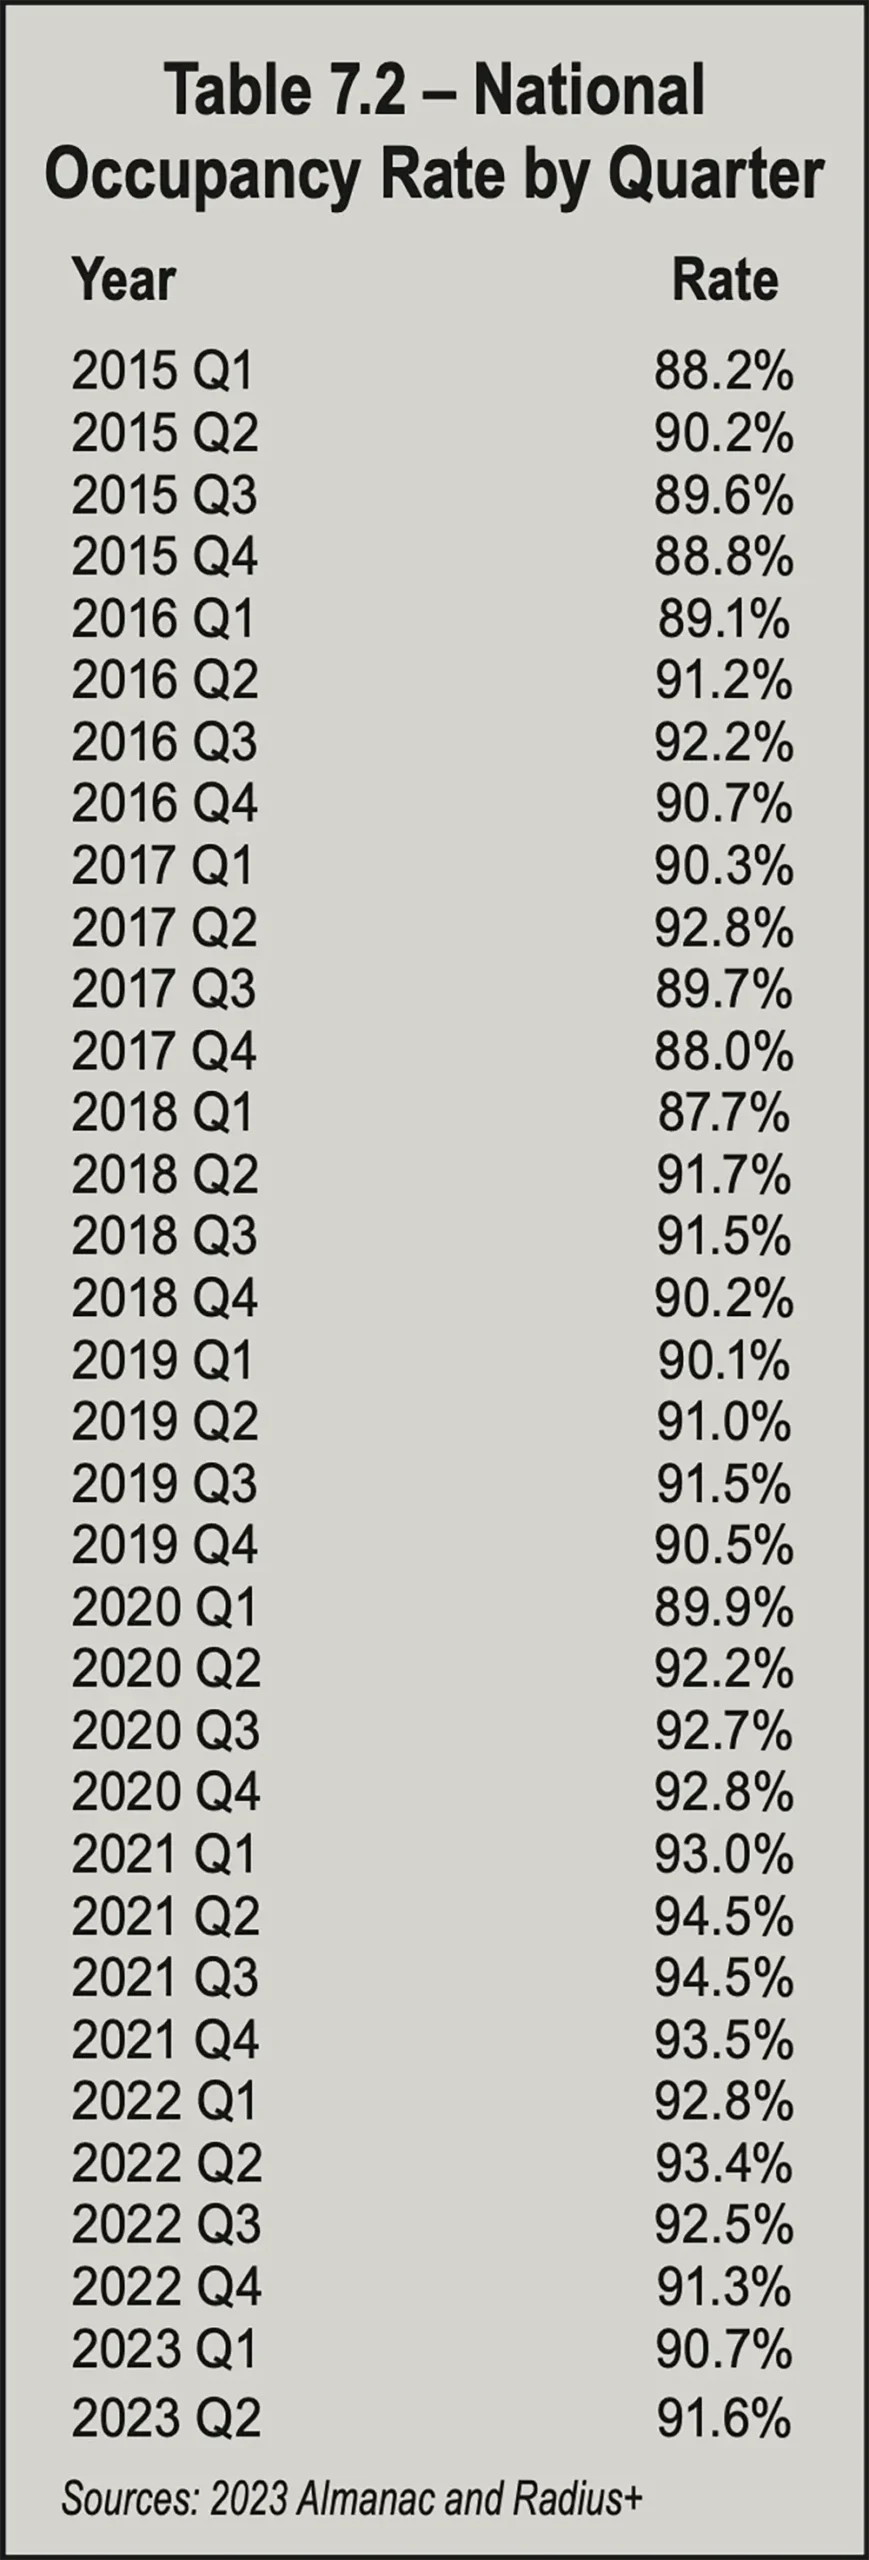
Digging deeper into the quarterly numbers in Table 7.2, which tracks Q1 2015 through Q2 2023, the low mark was 87.7 percent in Q1 2018. The high mark was 94.5 percent, which occurred in both Q2 2021 and Q3 2021. Quarterly rates increased from Q1 to Q2 throughout the period, mostly decreased from Q2 to Q3 and from Q3 to Q4; and showed an even mix of increases and decreases from Q4 to Q1. Overall, occupancy rates stayed mostly in the 80s from Q1 2015 through Q1 2016 and stayed mostly in the 90s from Q2 2016 through Q2 2023 but dipped into the 80s during four quarters of that period.

Regional Occupancy
While national rates give a broad overview of self-storage occupancy, regional rates dig down to specific geographic areas of the United States. The self-storage industry’s major data sources, such as Radius+ (the official data provider for the Self-Storage Almanac), can provide more location-specific data.

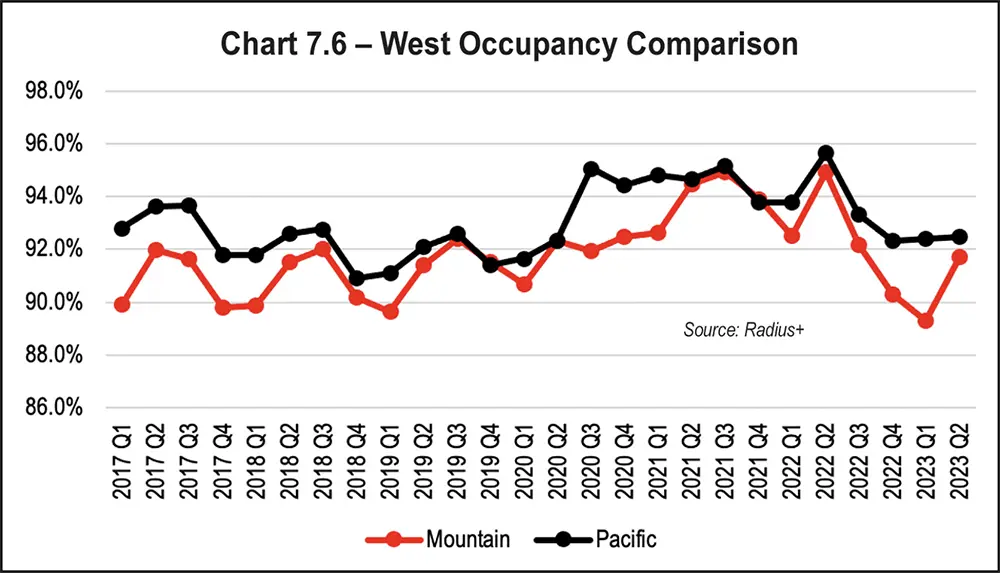
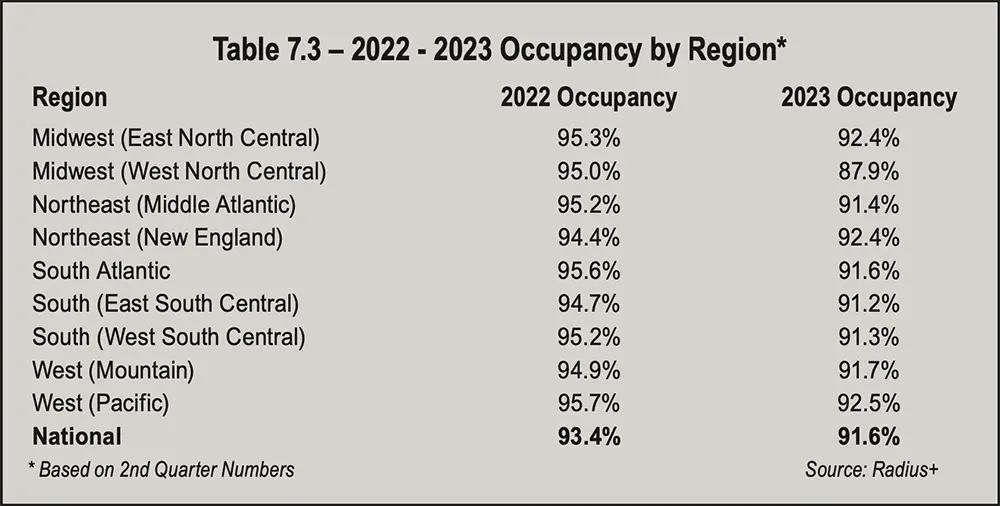
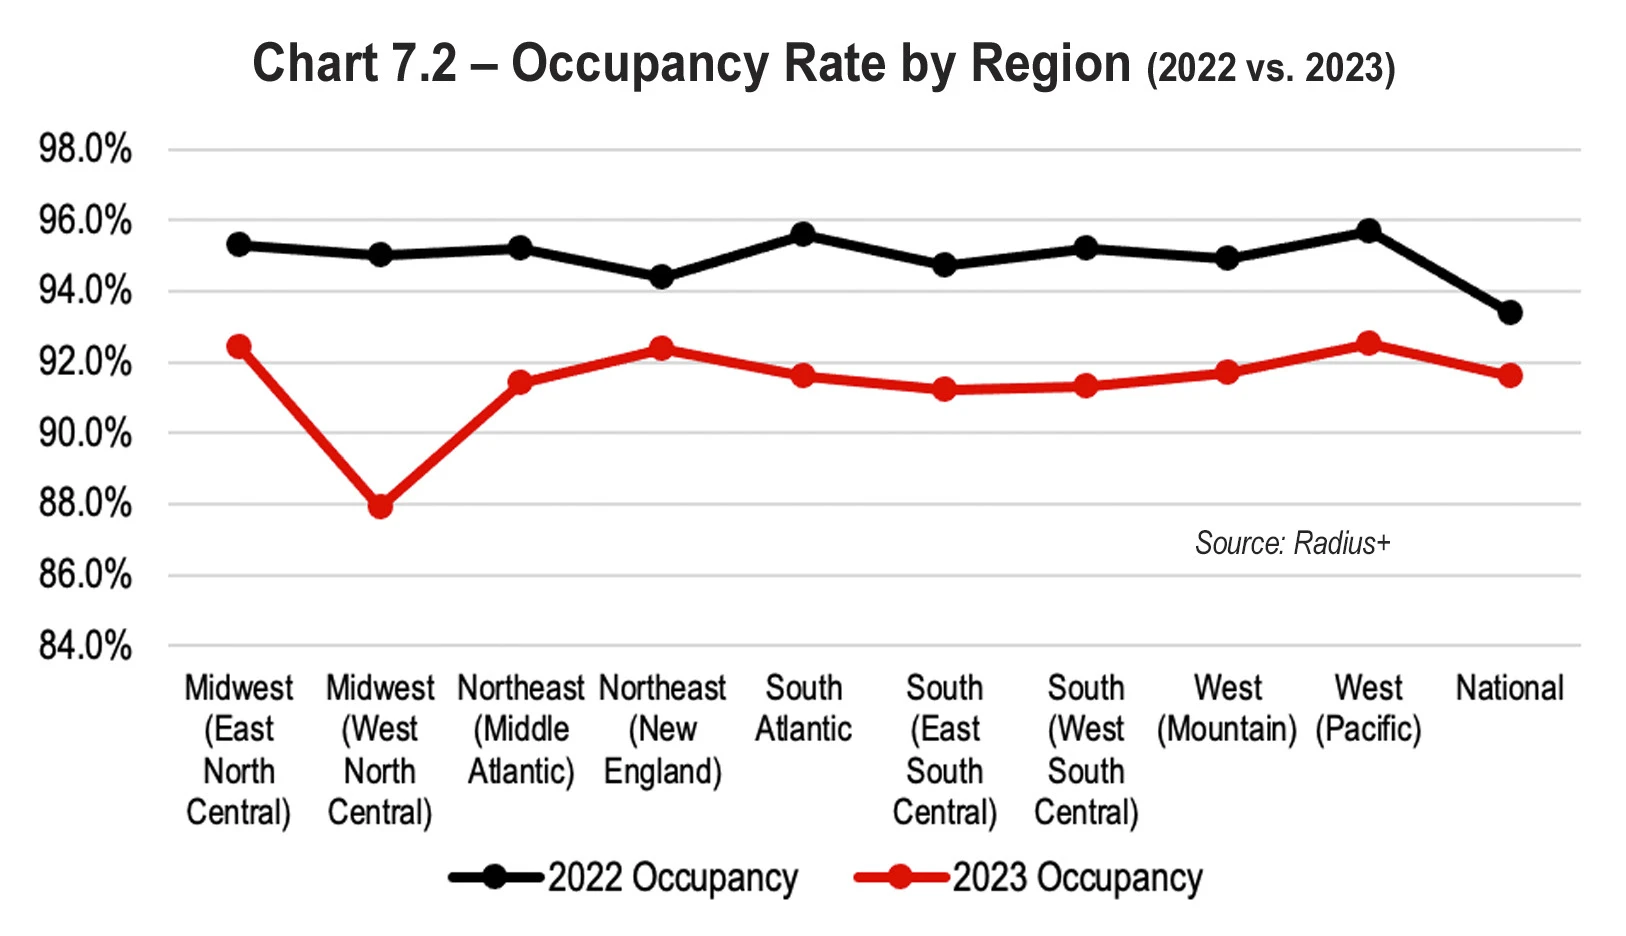
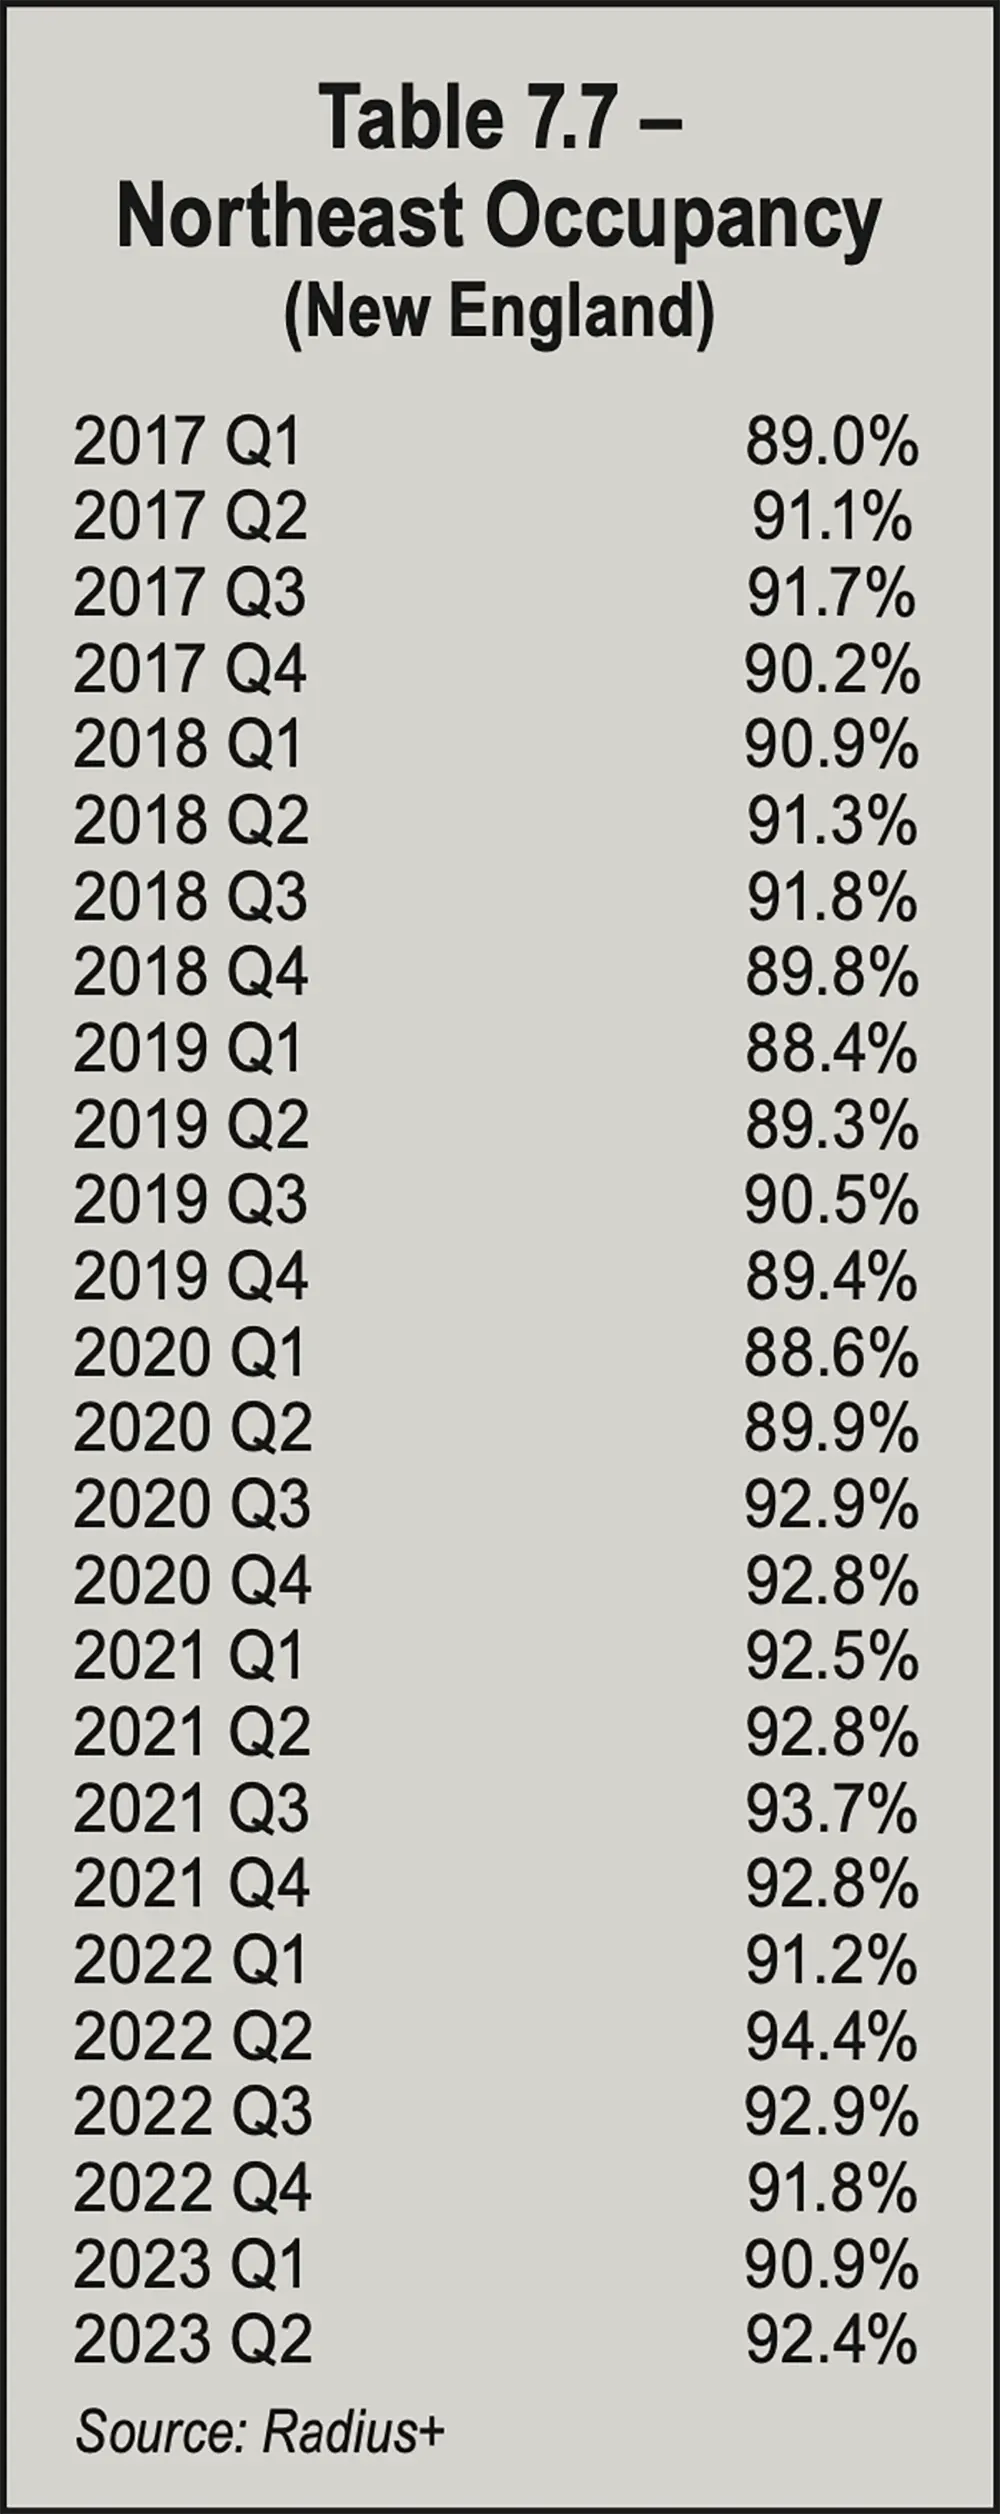
As shown in Table 7.3 and Chart 7.2 on the opposite page, occupancy fell in Q2 2023 to 92.4 percent from 95.3 percent in Q2 2022 in the Midwest region’s East North Central area. It fell to 87.9 percent from 95 percent in the Midwest’s West North Central area. It dropped to 91.4 percent from 95.2 percent in the Northeast region’s Middle Atlantic area and decreased 2.0 percent to 92.4 percent from 94.4 percent in the Northeast region’s New England area. It fell 4.0 percent to 91.6 percent from 95.6 percent in the South Atlantic region, which is not divided into subregions. The rate declined 3.5 percent to 91.2 percent from 94.7 percent in the South region’s East South Central area and fell 3.9 percent to 91.3 percent from 95.2 percent in its West South Central area. Occupancy rates also dropped in the West, with the Mountain area reporting a 3.2 percent decrease (91.7 percent from 94.9 percent) and the Pacific area experiencing a 3.5 percent decrease (92.5 percent from 95.7 percent).

Table 7.3 - 2022 - 2023 Occupancy by Region*
Table 7.3 and Chart 7.2 also show that in Q2 2023, the highest rate was 92.5 percent in the West region’s Pacific area, higher than the national rate of 91.6 percent. The lowest rate in Q2 2023 was 87.9 percent in the Midwest’s West North Central area. The highest rate in Q2 2022 was 95.7 percent in the West region’s Pacific area. The lowest rate in Q2 2022 was 94.4 percent in the Northeast region’s New England area. Occupancy rates decreased in Q2 2023 from Q2 2022 in every region. The largest decrease was 7.1 percent in the Midwest’s West North Central area. The Q2 2023 national rate of 91.6 percent was a 1.8 percent decrease from 93.4 percent in Q2 2022.
The Midwest
As Table 7.4 below shows, going back to Q1 2017’s 89 percent, the Midwest’s East North Central area had a high occupancy of 95.3 percent in Q2 2022. The lowest occupancy for the period was 88 percent in Q1 2018. Q2 2023’s 92.4 percent rose 1.7 percent from the prior quarter’s 90.7 percent but fell 0.2 percent from 92.6 percent Q4 2022. As is typical, occupancy rose from Q1 to Q2 and from Q2 to Q3 throughout the period (except when it fell slightly from Q2 to Q3 2021 and fell 2.7 percent from Q2 to Q3 2022). The rates fell from Q3 to Q4 throughout the period except when it remained at 92.6 percent in 2022. Q1 fell from Q4 five times during the period and rose once in Q1 2021 from Q4 2020. Occupancy rates in the Midwest’s East North Central area from Q1 2017 through Q2 2023 were in the 90s for 21 quarters and in the 80s for five quarters. The greatest quarterly increase was 3.1 percent from Q2 to Q3 2020. The greatest quarterly decrease was 1.9 percent from Q4 2022 to Q1 2023.

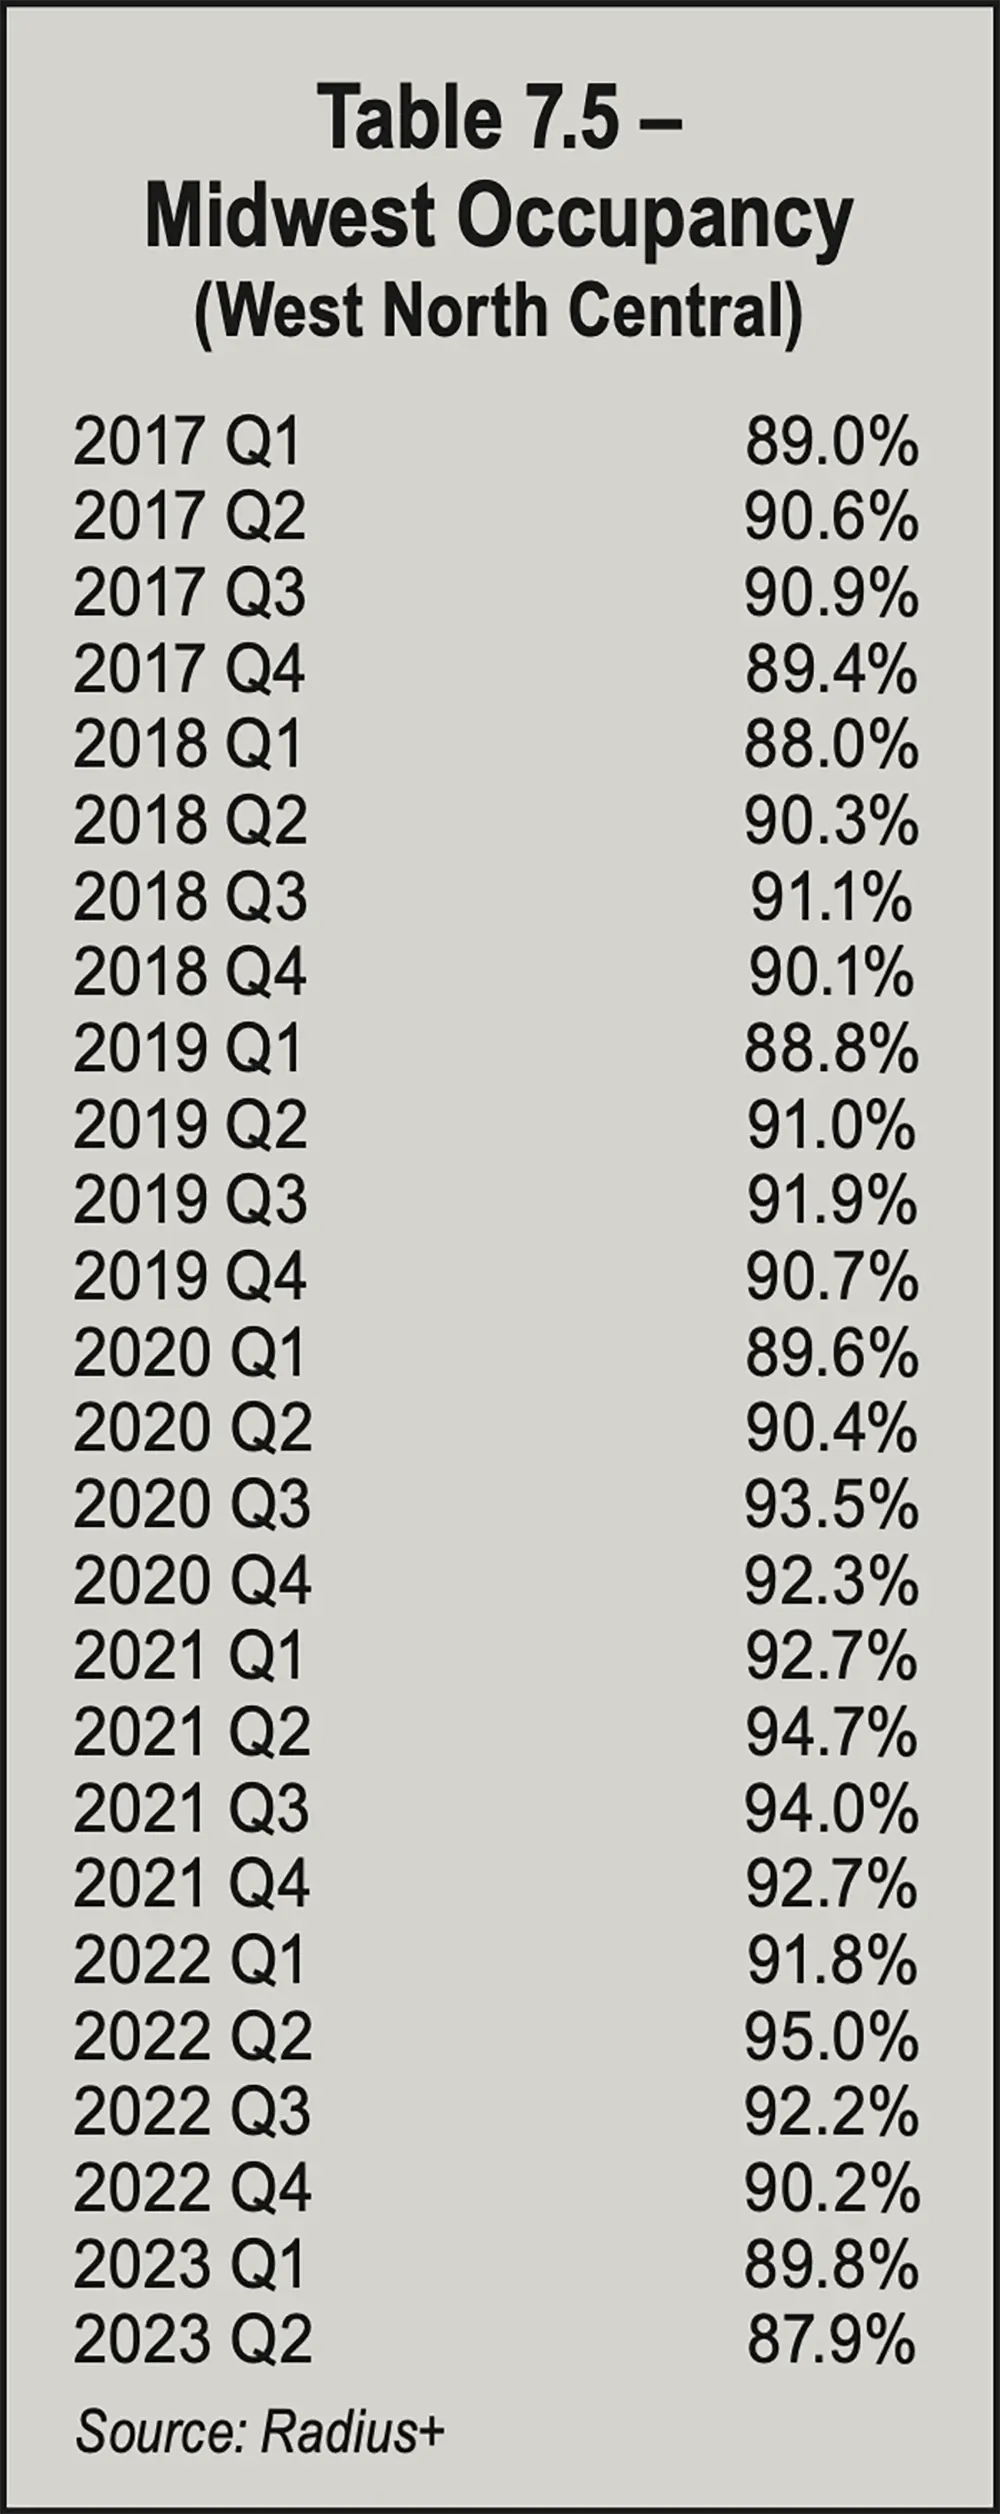
The Midwest’s North Central area’s occupancy rates from Q1 2017 through Q2 2023 were in the 90s for 19 quarters and in the 80s for seven quarters. Q2 2022 showed the highest quarterly increase, at 3.2 percent, from Q1 2022. The greatest quarterly decrease was 2.8 percent from Q2 to Q3 2022. See Table 7.5 on page 65.

Chart 7.2 - Occupancy Rate by Region (2022 vs. 2023)
The lowest rate in Q2 2023 was 87.9 percent in the Midwest’s West North Central area. The highest rate in Q2 2022 was 95.7 percent in the West region’s Pacific area.
Chart 7.3 on page 65 compares occupancy rates in the Midwest’s East North Central and West North Central areas from Q1 2017 through Q2 2023. The areas’ rates were identical in every quarter during the period through Q2 2021. Occupancy for Q3 2021 in the East North Central was 94.5 percent, 0.5 percent higher than the West North Central’s 94 percent. For Q4 2021, occupancy was 93.9 percent in East North Central and 92.7 percent in West North Central. Occupancy during Q1 2022 was 92.4 percent in East North Central and 91.8 percent in West North Central. Occupancies increased a few percentage points in Q2 2022 to 95.3 percent in East North Central and 95 percent in West North Central. They dipped down again in Q3 2022 to 92.6 percent in East North Central and 92.2 percent in West North Central. In Q4 2022, the East North Central’s rate stayed at 92.6 percent, whereas the West North Central area experienced a 2.0 percent decline to 90.2 percent. Both Midwest areas reported occupancy drops in Q1 2023, down to 90.7 percent in the East North Central and 89.8 percent in the West North Central. The last quarterly comparison, Q2 2023, shows the East North Central at 92.4 percent and the West North Central at 87.9 percent.
Table 7.4 - Midwest Occupancy (East North Central)
Table 7.5 - Midwest Occupancy (West North Central)
Chart 7.3 - Midwest Occupancy Comparison
Chart 7.4 - Northeast Occupancy Comparison
The Northeast
Table 7.6 on the opposite page shows the Northeast’s Middle Atlantic area had 95.2 percent occupancy in Q2 2022, the highest rate for the period from Q1 2017, when the rate was 90.1 percent, to Q2 2023, when the rate was 91.4 percent. Q2 2023 rose 1.0 percent from the prior quarter and fell 0.3 percent from Q4 2022.

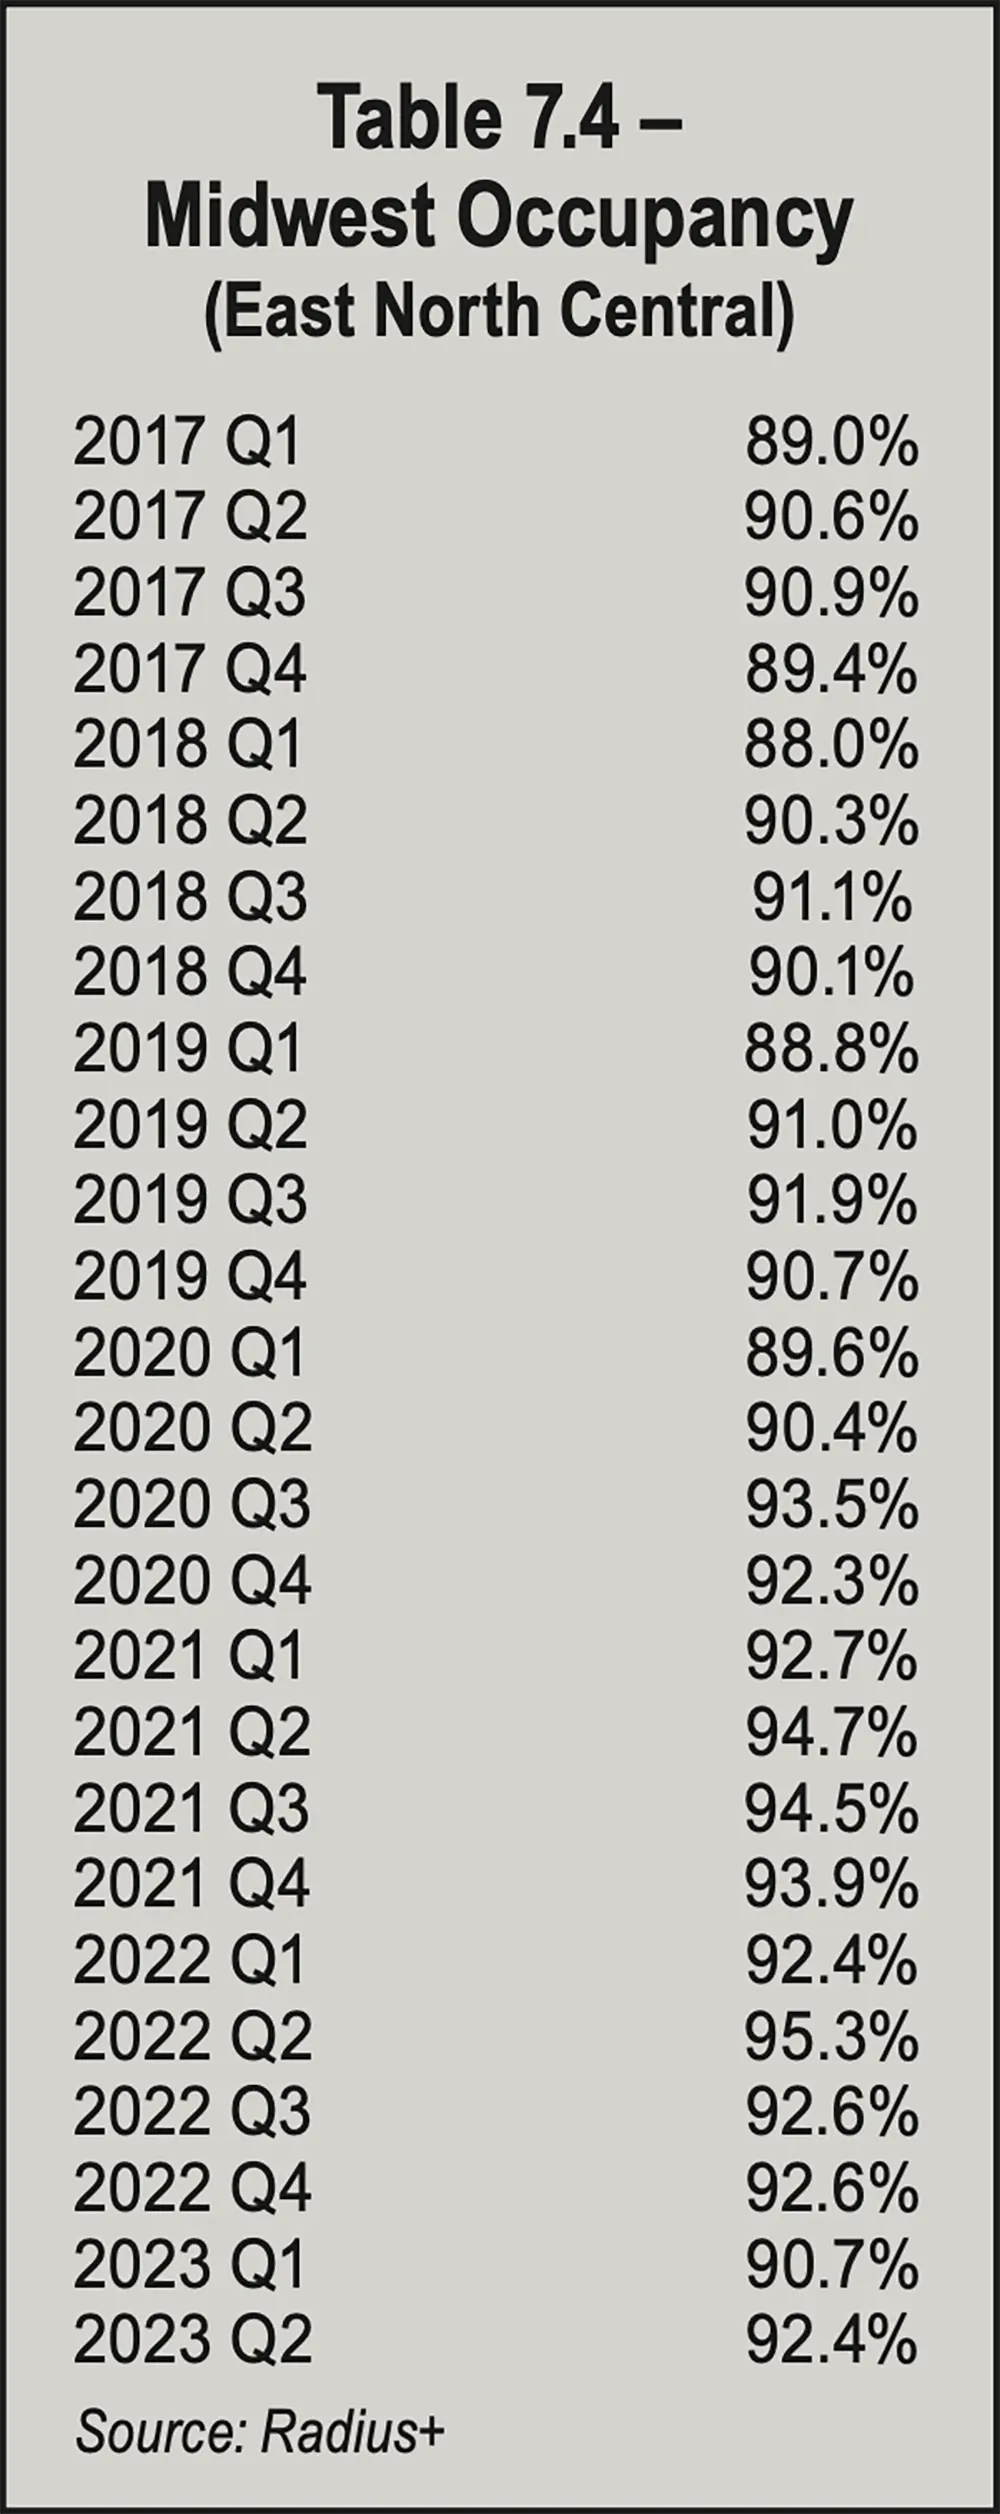
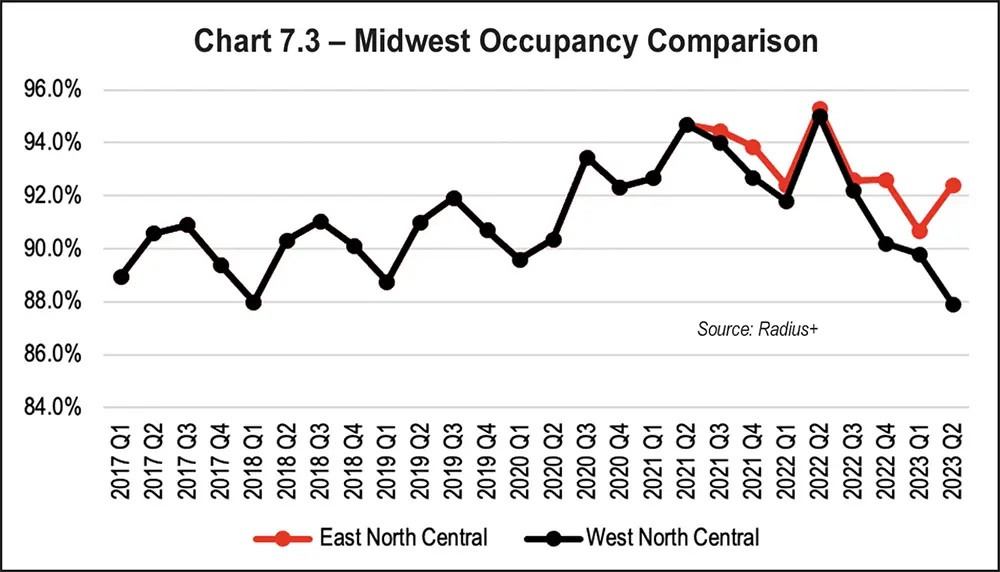
The lowest rate for the period was 89.2 percent in Q4 2019, one of three quarters in the 80s for the period, along with 89.9 percent in Q1 2019 and 89.4 percent in Q1 2020. All other quarters in the period were in the 90s. The greatest quarterly increase, 3.1 percent, was from Q2 to Q3 2020. The greatest quarterly decrease, 2.6 percent, was from Q2 to Q3 2022.

From Q1 2017 through Q2 2023, occupancy rates rose from Q1 to Q2 and Q2 to Q3 (except when it fell from Q2 2022 to Q3 2022) and fell from Q3 to Q4.

From Q4 to Q1, occupancy increased twice (2019 to 2020 and 2020 to 2021) and decreased three times (2018 to 2019, 2021 to 2022, and 2022 to 2023). It remained unchanged once (2017 to 2018).

Table 7.7 on page 66 shows the Northeast’s New England area’s high rate for the period was 94.4 percent in Q2 2022. The low rate was 88.4 percent in Q1 2019. Q2 2023 rose 1.5 percent from 90.9 percent the prior quarter and rose 1.1 percent from 91.8 percent in Q4 2022. Occupancy rates rose from Q1 to Q2 and from Q2 to Q3 (except in 2022) and decreased from Q3 to Q4 throughout the period. Q1 fell from Q4 five times and rose once. Occupancy rates were in the 80s for seven quarters and in the 90s for 19 quarters.

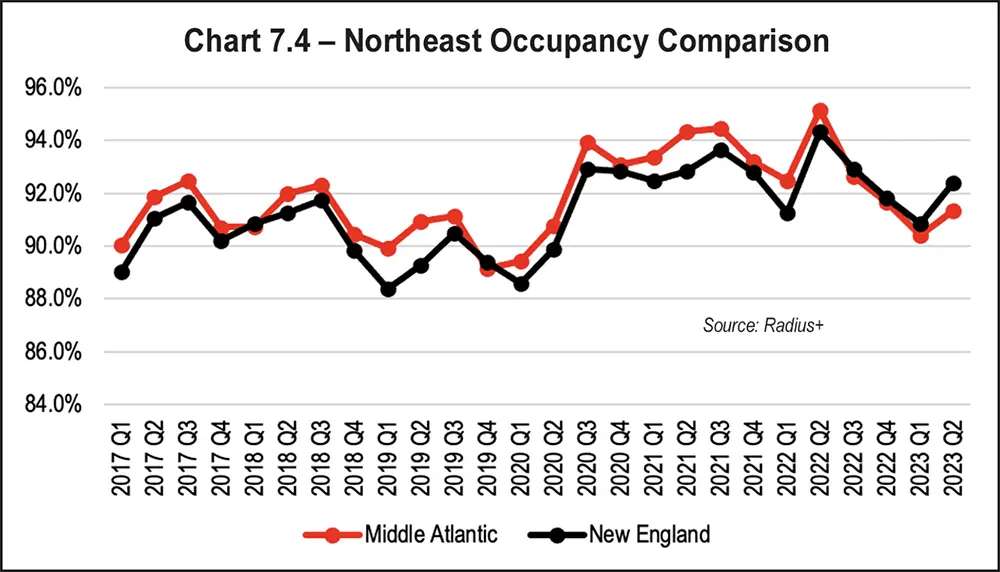
As Chart 7.4 on page 66 shows, occupancy rates in the Middle Atlantic were higher than in New England in 20 quarters and lower in six quarters (Q1 2018, Q4 2019, and Q3 2022 through Q2 2023).

The South Atlantic
As Table 7.8 shows on page 67, the South Atlantic region, which is not divided by subregions, had its highest occupancy rate, 95.6 percent, in Q2 2022, for the period from Q1 2017, when the rate was 90 percent, through Q2 2023, when it was 91.6 percent. The lowest rate was 89.3 percent in Q1 2019. Q2 2023’s 91.6 percent rate rose 0.7 percent from the prior quarter’s 90.9 percent but fell 0.8 percent from 92.4 percent in Q4 2022. The largest quarterly increase in the period was 2.4 percent; that happened twice, from Q1 to Q2 2022 and from Q2 to Q3 2020. The largest decrease was 2.8 percent from Q2 to Q3 2022. For the entire period, rates increased from Q1 to Q2 and Q2 to Q3 (except when it fell from Q2 to Q3 2022). From Q3 to Q4, rates decreased six times and increased once. From Q4 to Q1, the rate fell five times and rose once. During the period, occupancy rates hit the 90s in 21 quarters and the 80s in five quarters.
Table 7.6 - Northeast Occupancy (Middle Atlantic)
Table 7.7 - Northeast Occupancy (New England)
The South
Table 7.9 on page 67 details the South region’s East South Central area. It shows the highest occupancy rate for the period Q1 2017 through Q2 2023 was 94.9 percent in Q2 2021. The lowest rate was 88.8 percent in Q1 2019. Q2 2023 posted a 91.2 percent rate, up 1.9 percent from the prior quarter’s 89.3 percent and up 0.9 percent from Q4 2022’s 90.3 percent. The greatest quarterly increase was 2.5 percent (Q1 to Q2 2022). The greatest quarterly decrease was 2.5 percent from Q2 to Q3 2022.

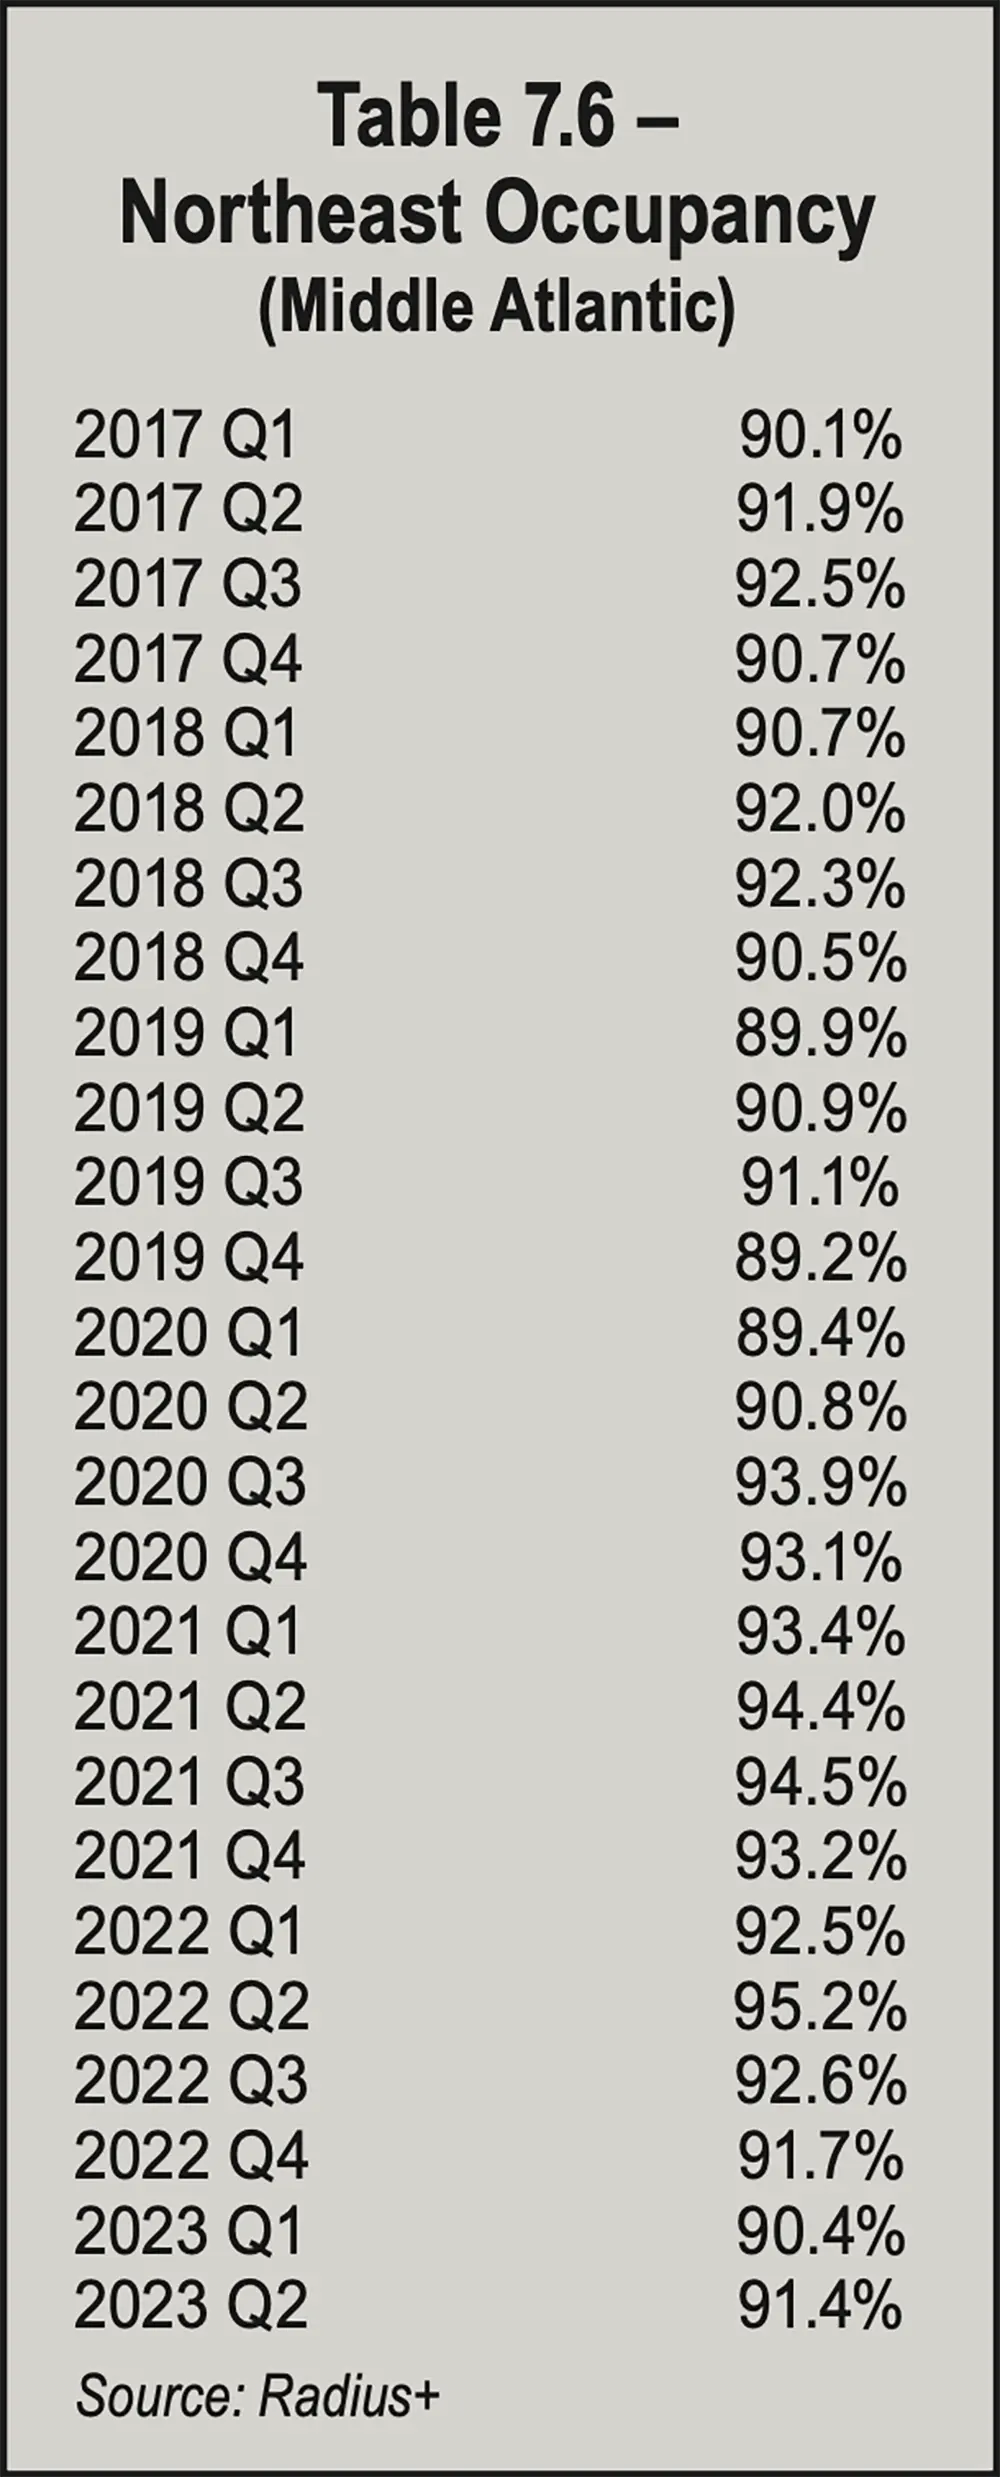
Occupancy rates increased throughout the period from Q1 to Q2. Rates rose from Q2 to Q3 three times (2017, 2019, and 2020) and fell three times (2018, 2021, and 2022). Rates fell from Q3 to Q4 except in 2020, when they rose. From Q4 to Q1, the rate fell four times, rose once, and was unchanged once. Occupancy was in the 90s for 19 quarters and in the 80s for seven quarters.

Flagging home prices and sales decrease self-storage occupancy rates, put a damper on development, and increase the time required to both develop and stabilize properties. A housing market that isn’t transacting could prolong the trend of decreasing occupancies across the nation.
Table 7.8 - South Atlantic Occupancy
Table 7.9 - South Occupancy (East South Central)
Table 7.10 - South Occupancy (West South Central)
Table 7.11 - West Occupancy (Mountain)
Table 7.12 - West Occupancy (Pacific)
As shown in Table 7.10 on page 67, the South’s West South Central area posted an 88.8 percent occupancy rate in Q1 2017. From that quarter through Q2 2023, the highest rate was 95.2 percent in Q2 2022. The period’s lowest rate was 88.4 percent in Q1 2019. The greatest quarterly increase was 2.6 percent from Q1 to Q2 2022. Q2 to Q3 2022 showed the largest decrease (2.7 percent). Throughout the period, occupancy rates rose from Q1 to Q2 and from Q2 to Q3 except when it fell in 2021 and 2022. Q3 to Q4 fell five times and rose once in the period. For the whole period, occupancy rates were in the 90s for 16 quarters and in the 80s for 10 quarters.

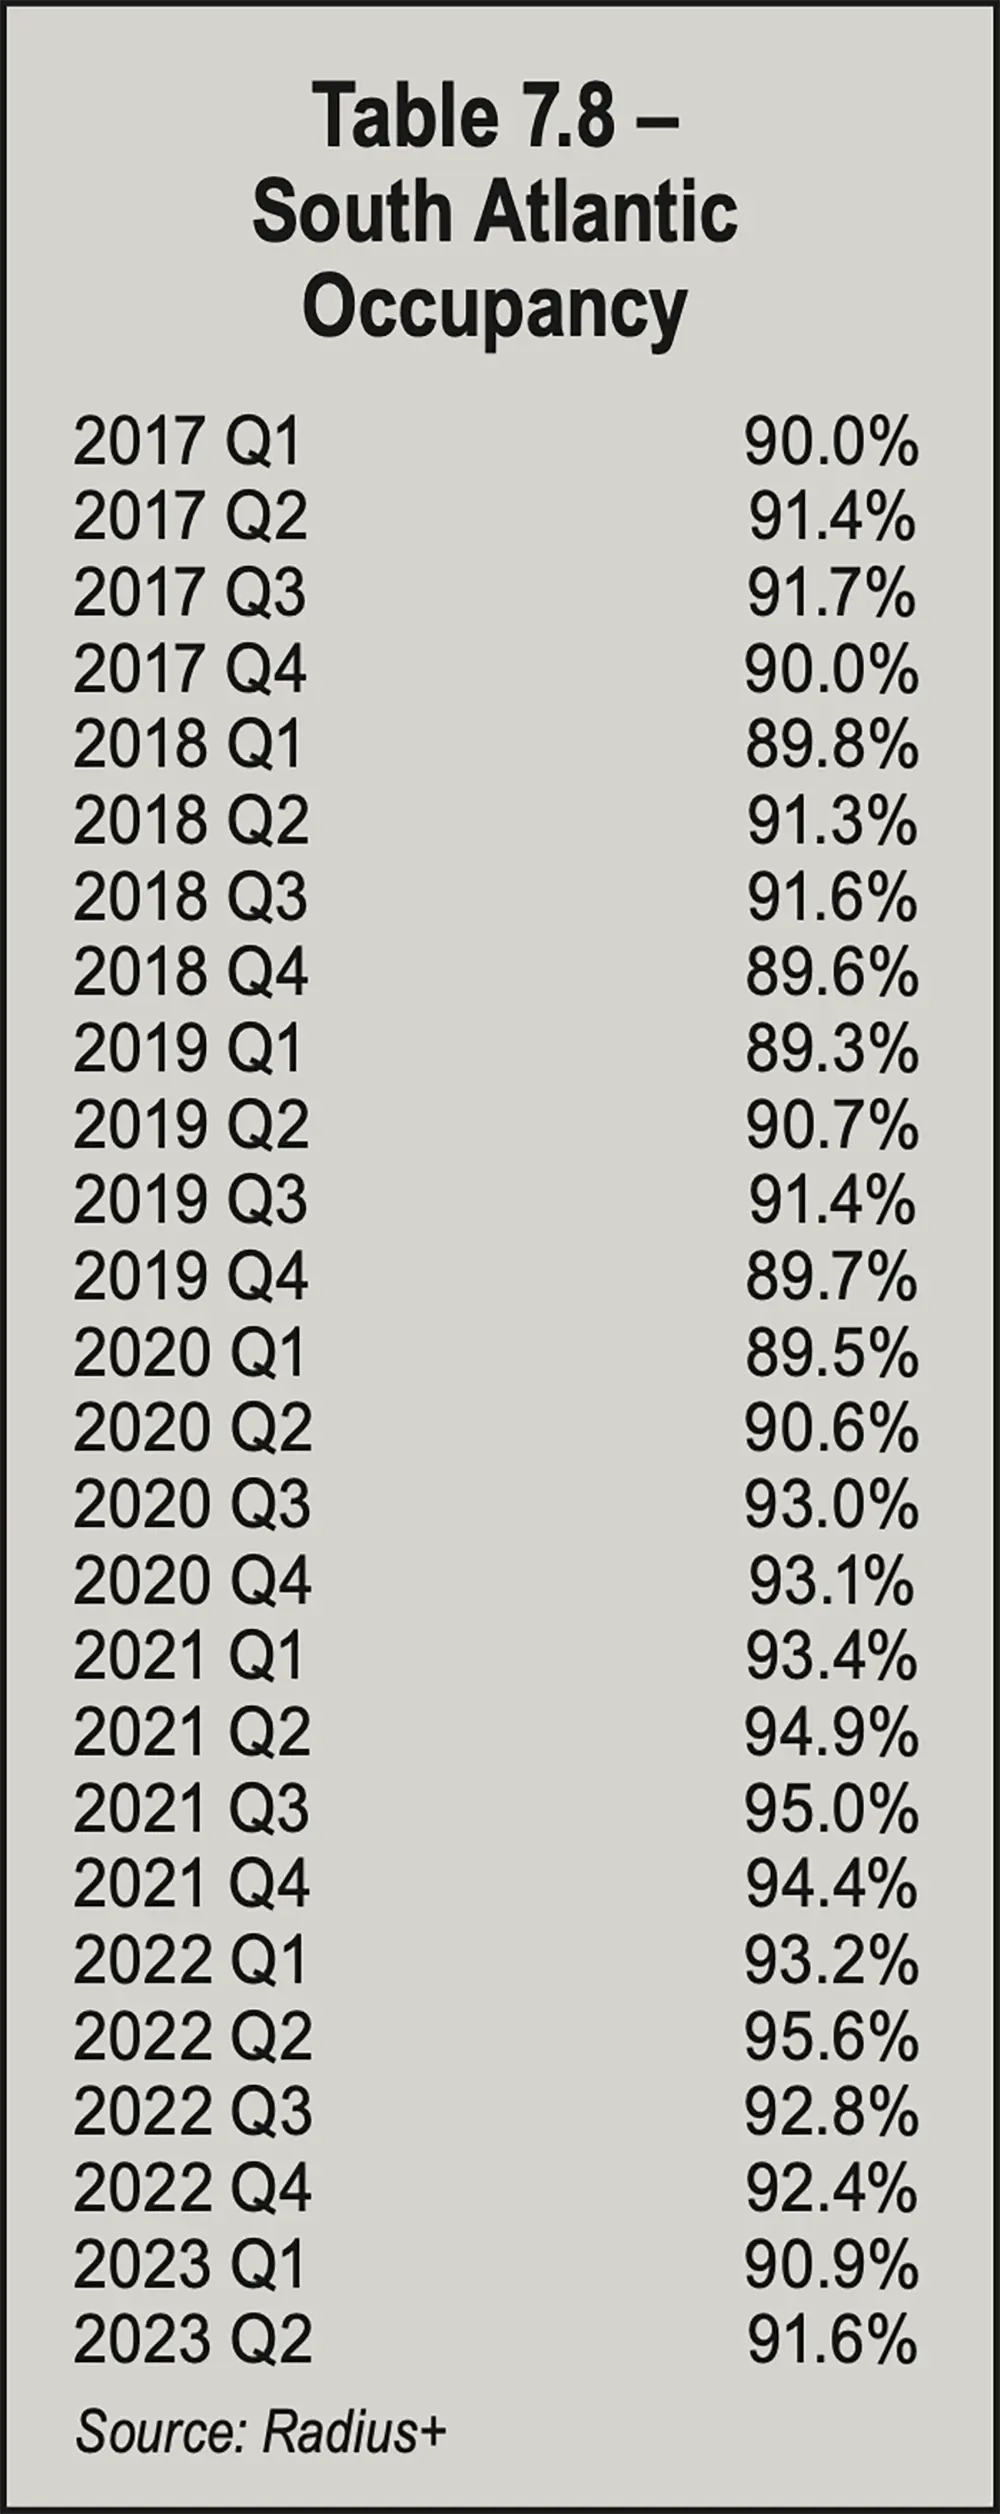
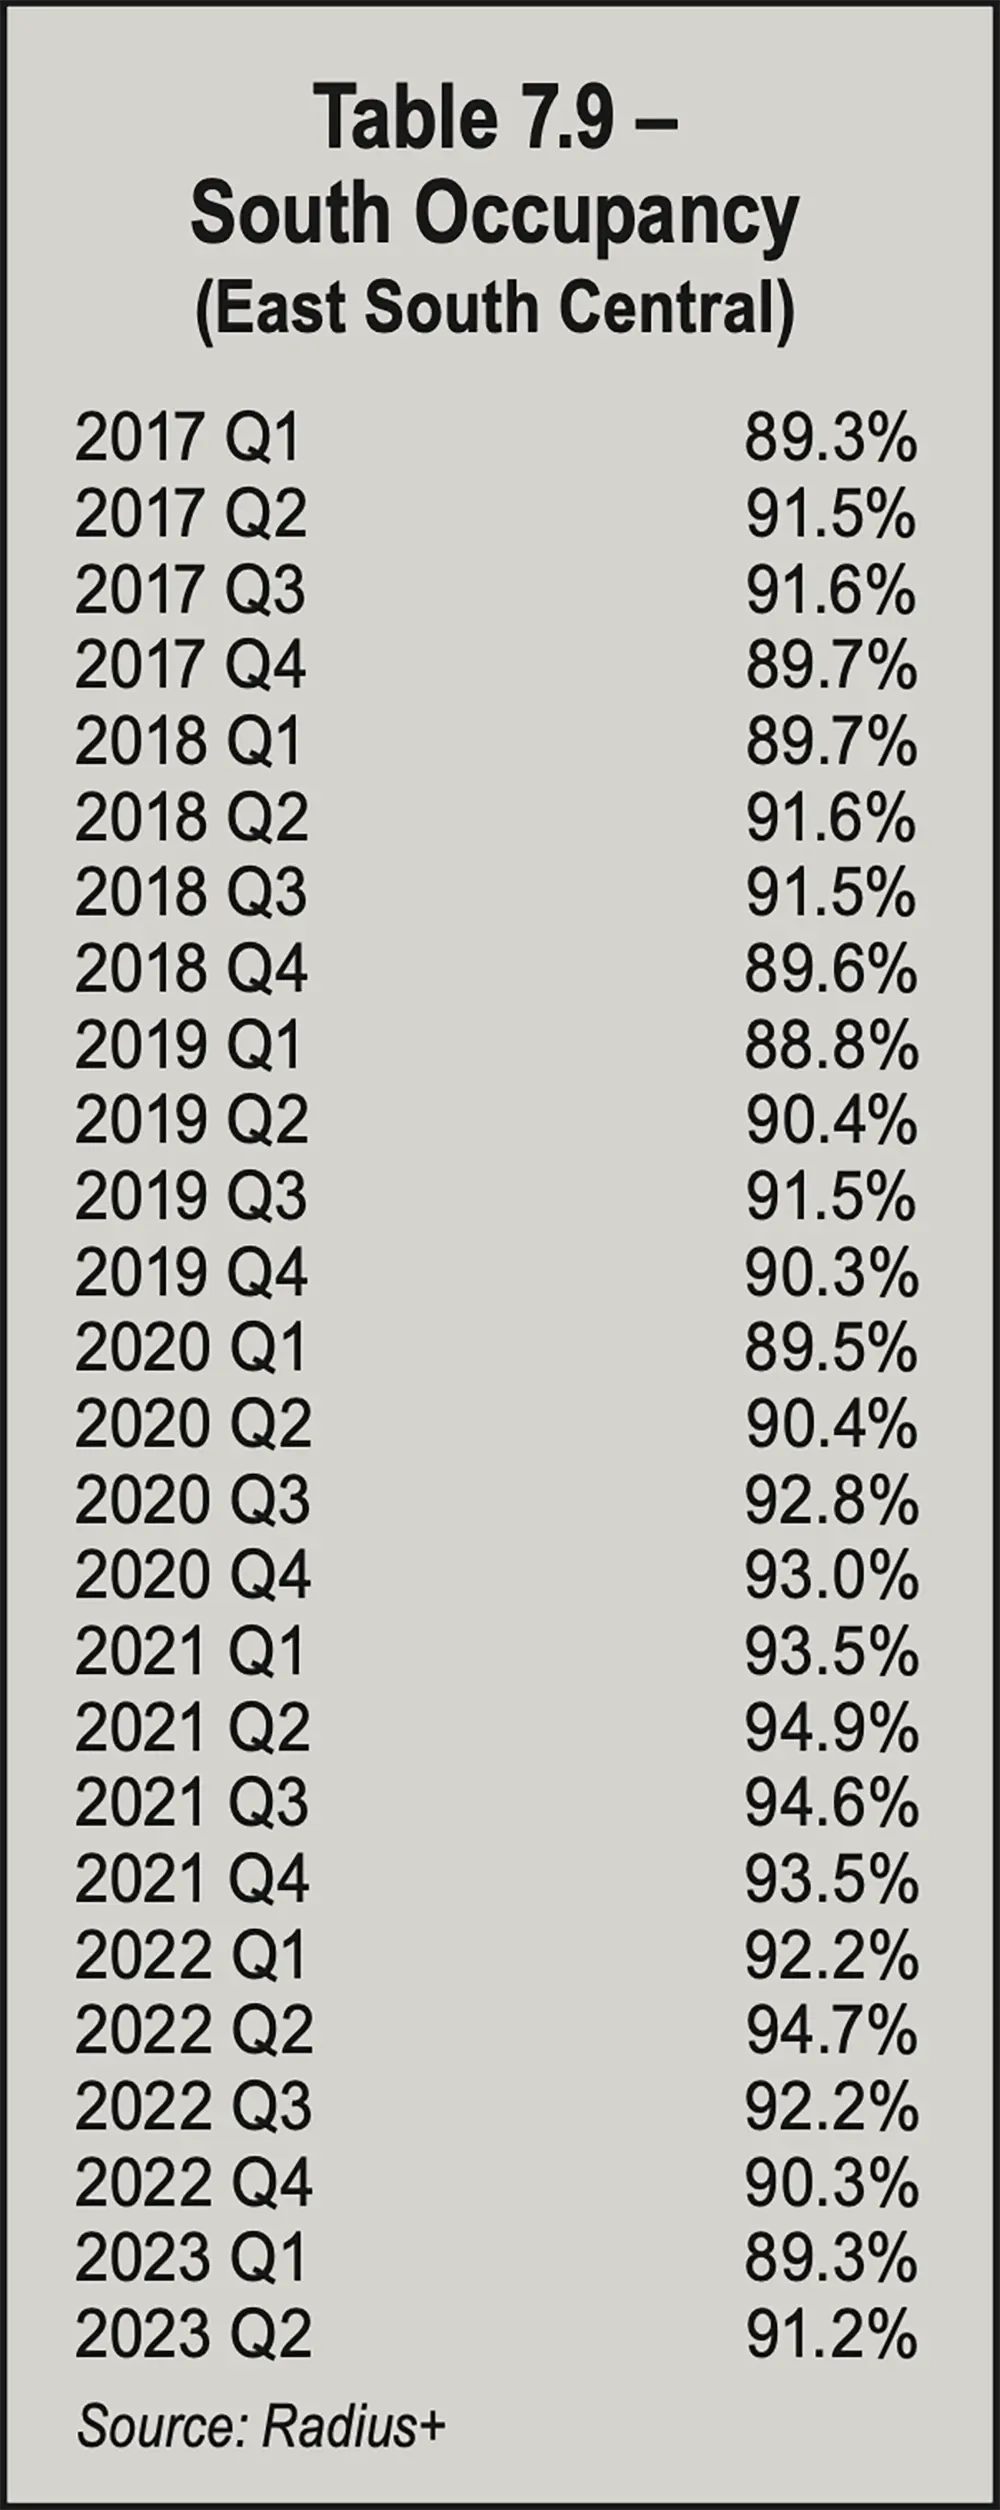
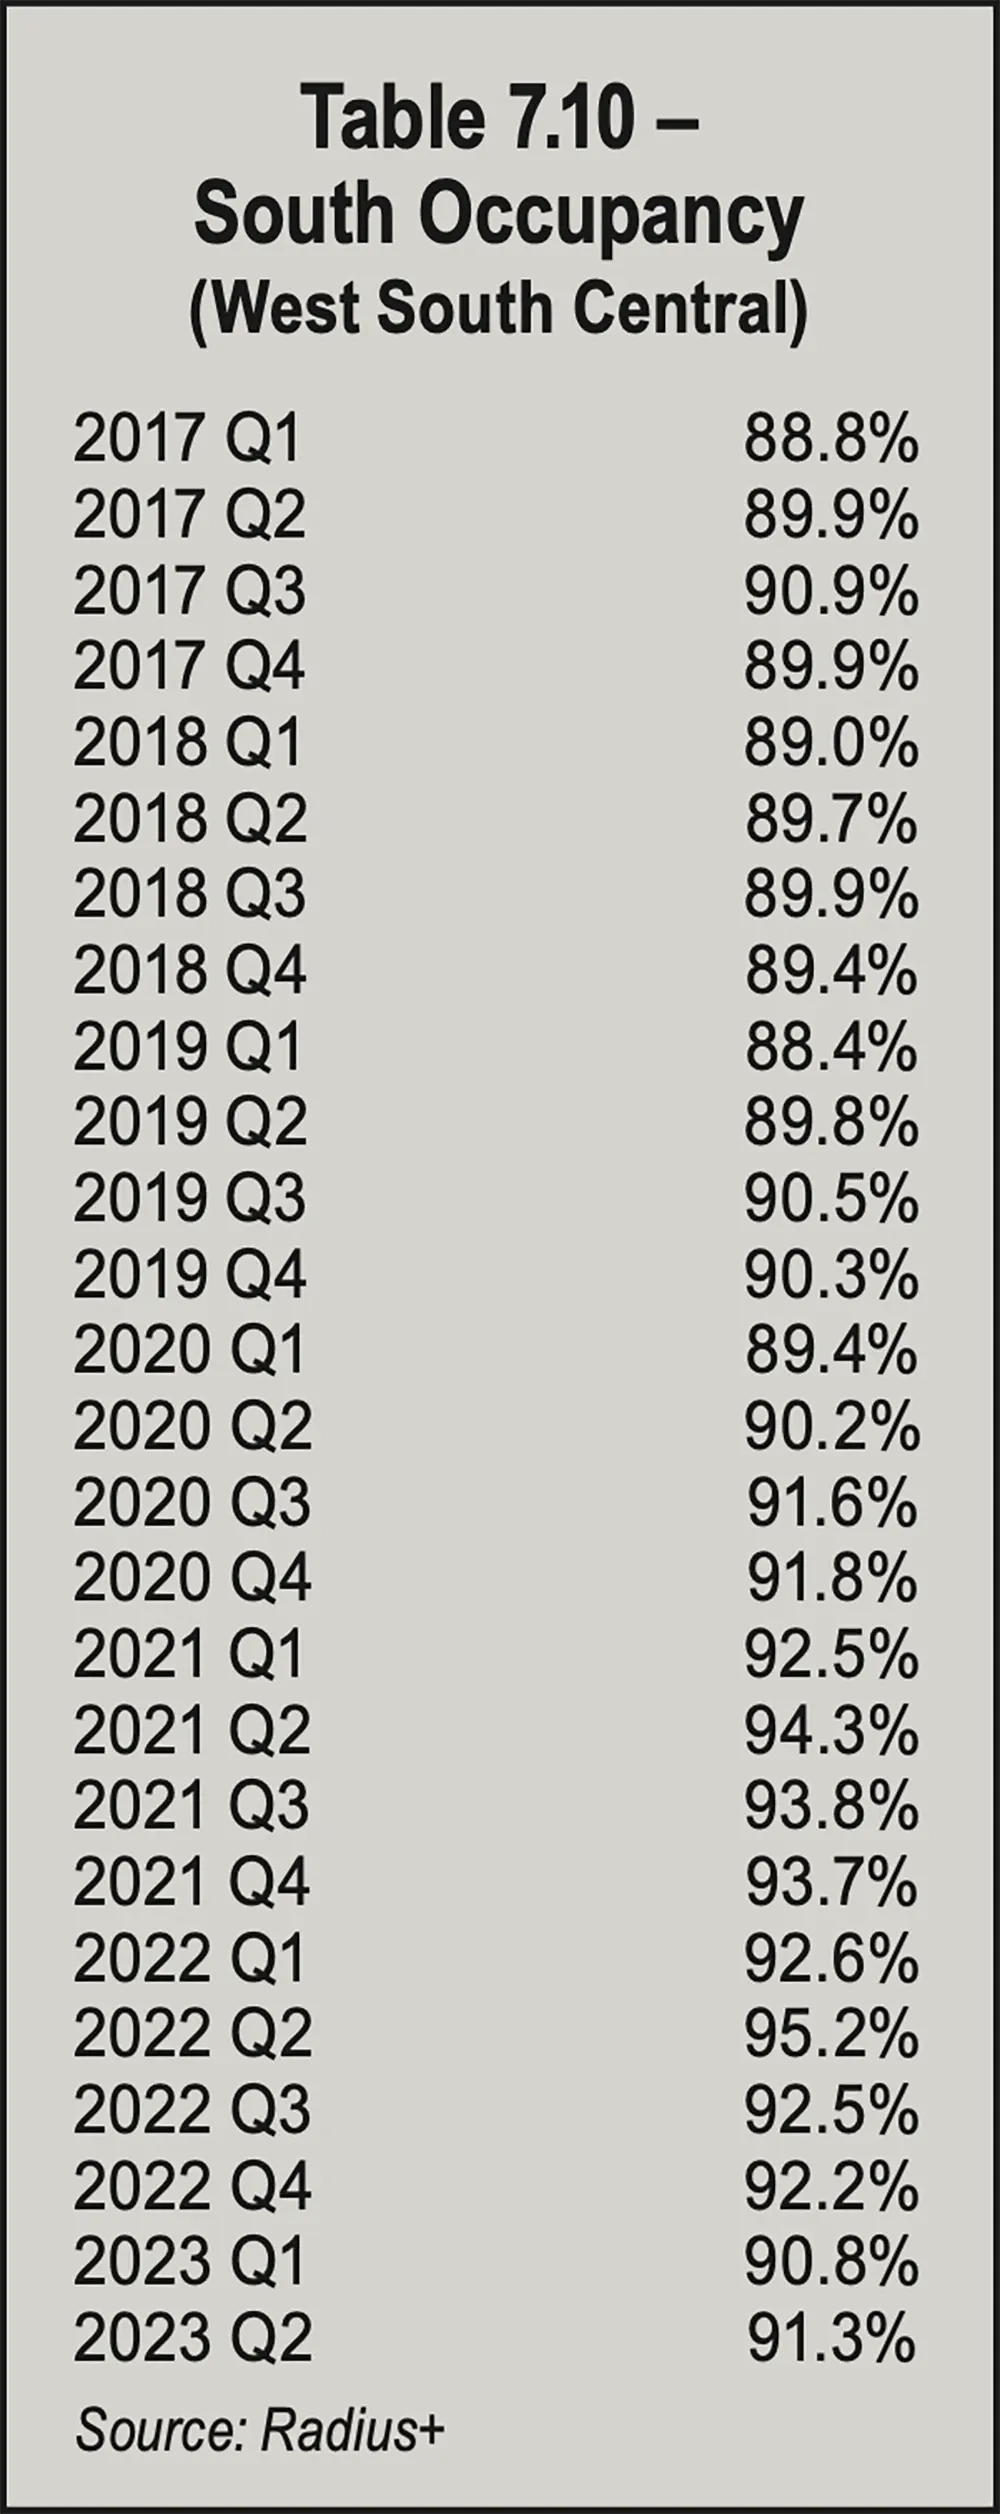
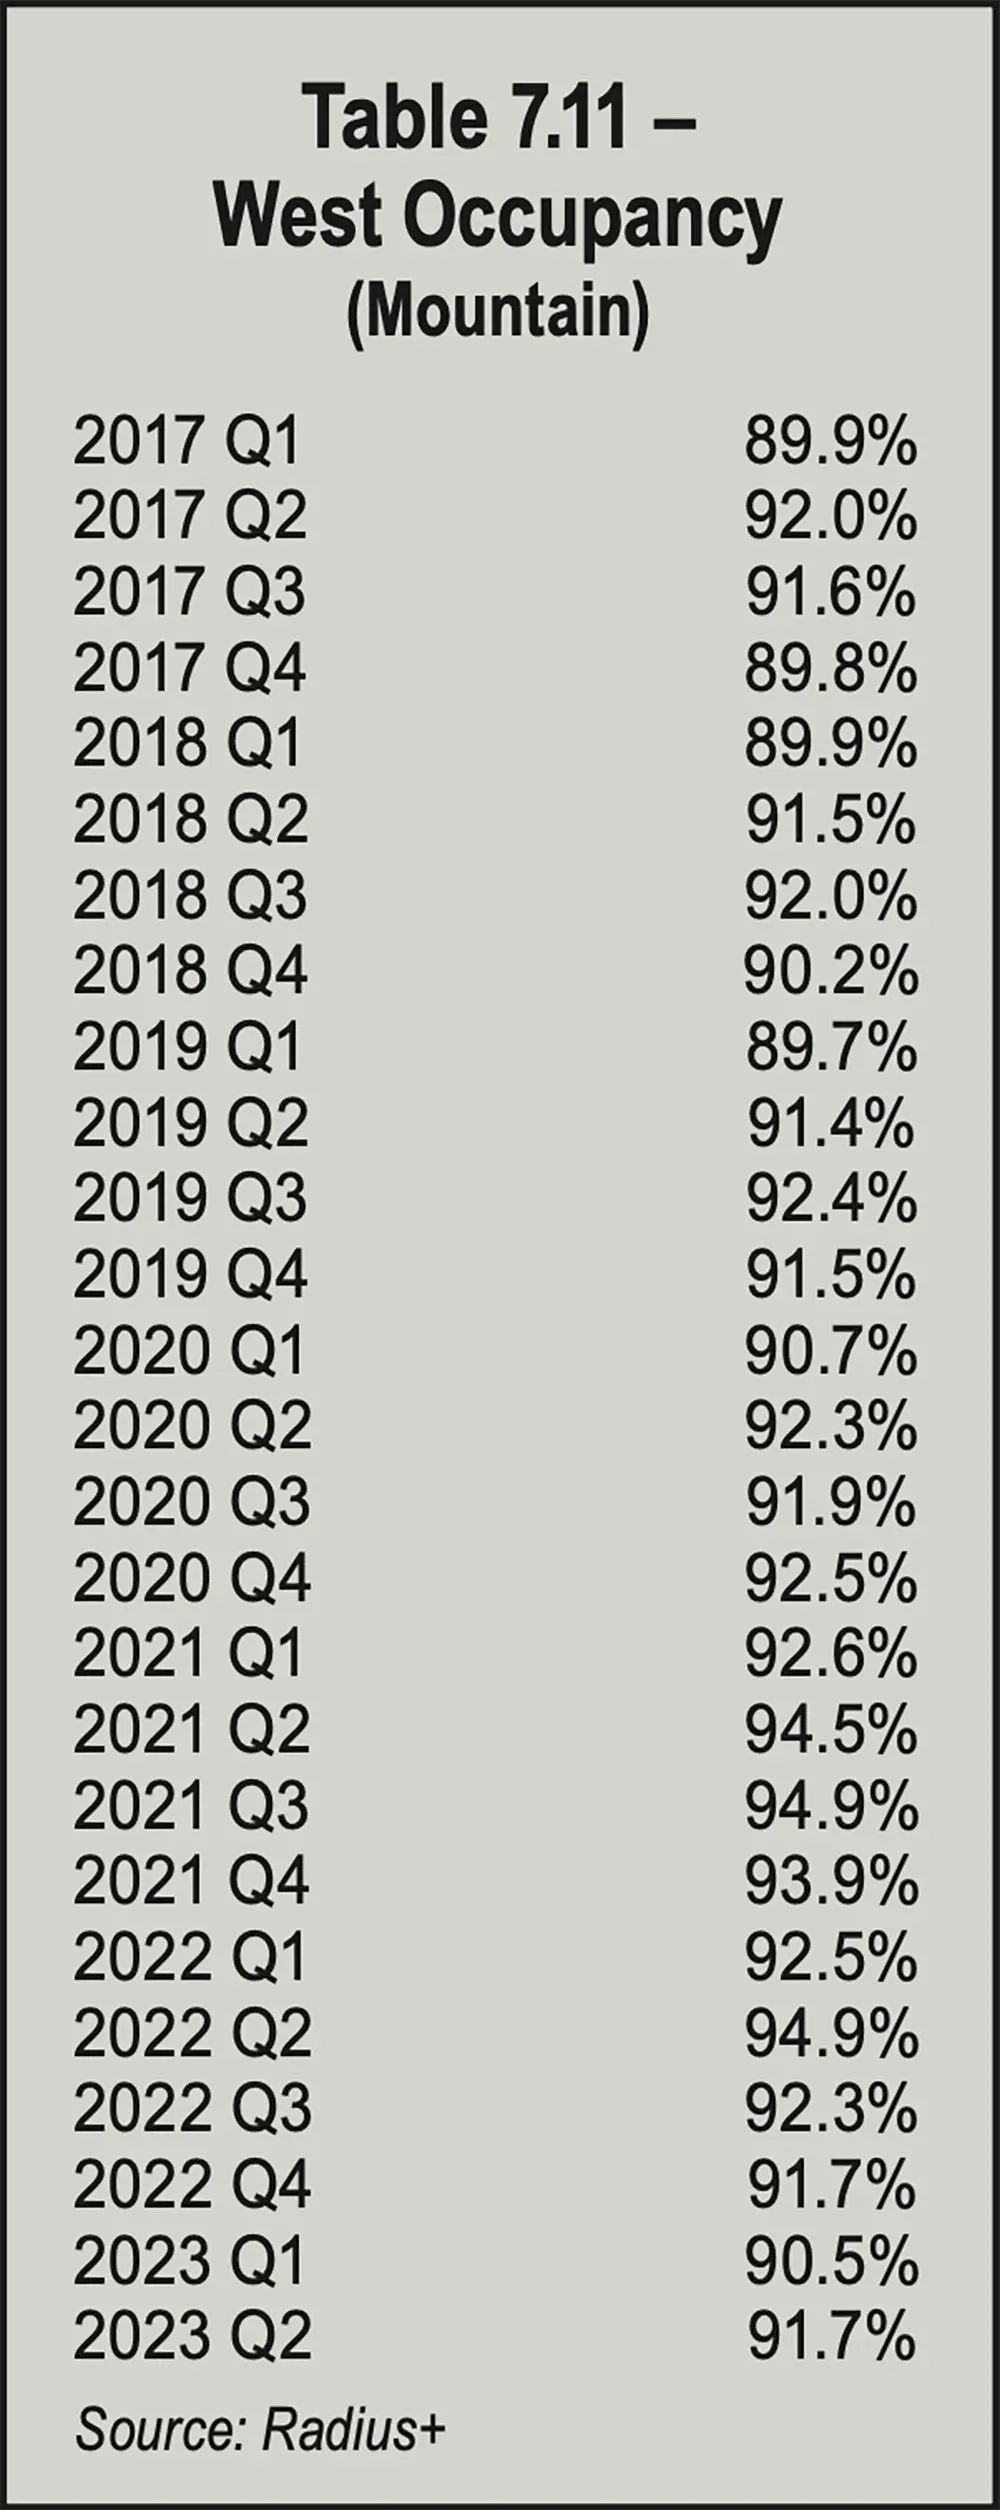
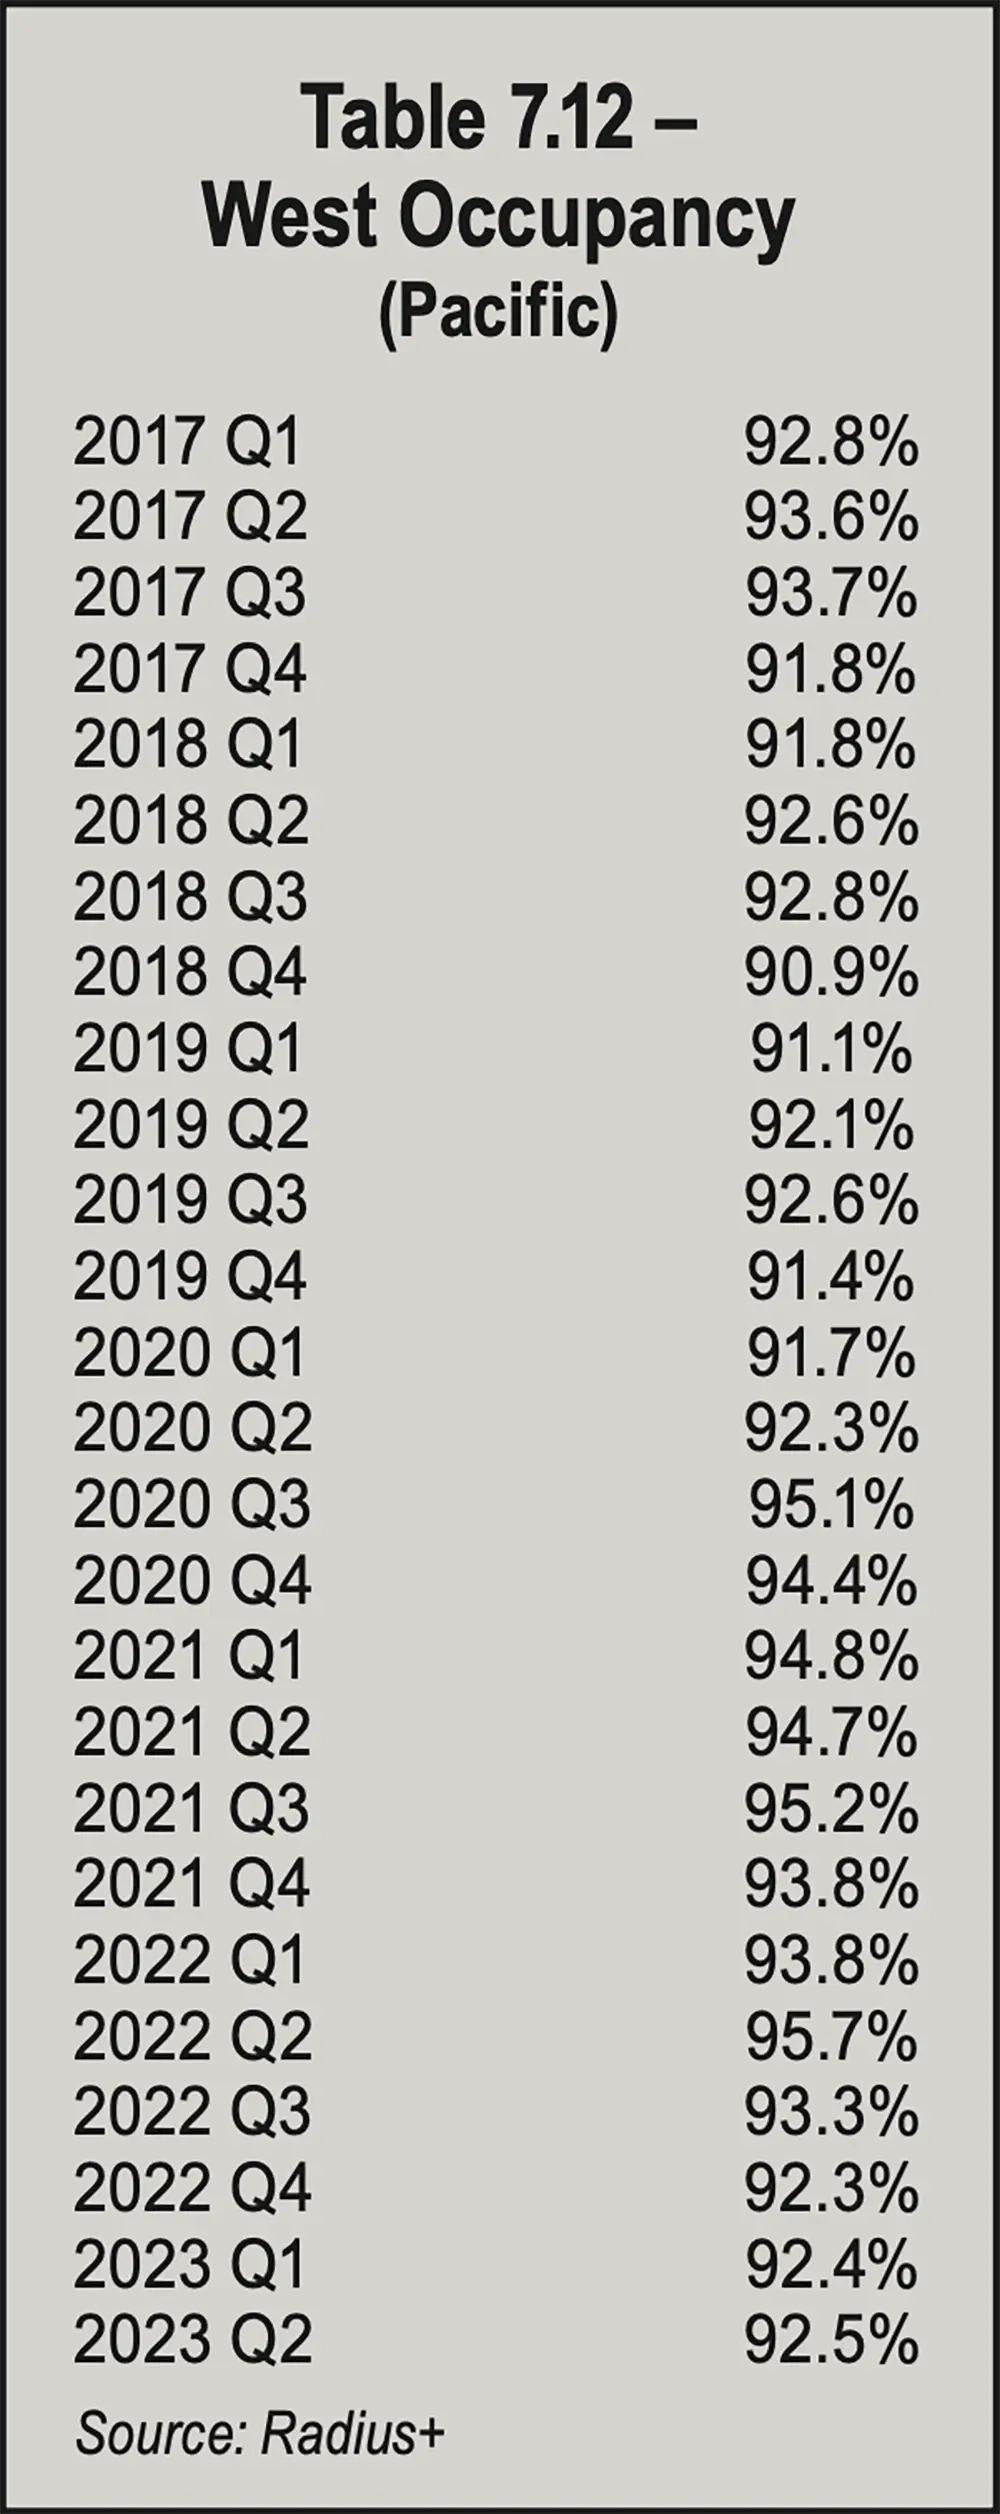
Chart 7.5 on page 67 shows that for the period from Q1 2017 through Q2 2023, the East South Central area had higher occupancy rates than the West South Central 17 quarters and lower rates in eight quarters. The rates were the same (90.3 percent) in Q4 2019.

The West
Chart 7.5 - South Occupancy Comparison
As Table 7.11 on the opposite page shows, between Q1 2017 and Q2 2023, the highest occupancy rate in the West region’s Mountain area was 94.9 percent (Q2 2022 and Q3 2021). The lowest rate was 89.7 percent in Q1 2019. The rate in Q2 2023, 91.7 percent, rose 1.2 percent from Q1’s 90.5 percent and was unchanged from Q4 2022’s 91.7 percent. The greatest quarterly increase in the period was 2.4 percent from Q1 to Q2 2022, whereas the greatest decrease was 1.8 percent (Q3 to Q4 2017 and Q3 to Q4 2018).

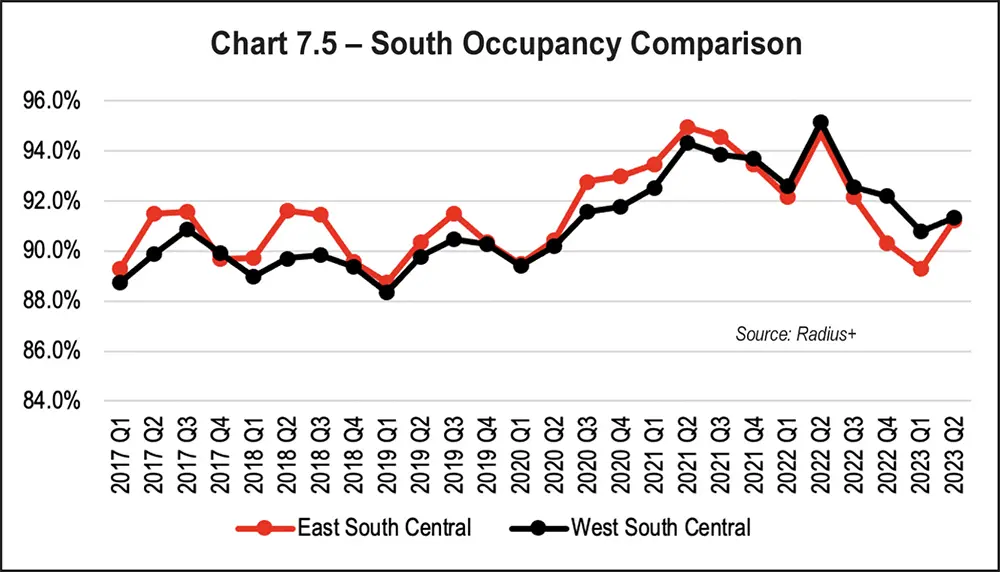
For the entire period, rates increased from Q1 to Q2, increased three times and decreased three times from Q2 to Q3, decreased five times and increased once from Q3 to Q4, and decreased three times and increased three times from Q4 to Q1. For the whole period, occupancy rates were in the 80s in four quarters and the 90s in 22 quarters.

Occupancy rates from Q1 2017 through Q2 2023 in the West region’s Pacific area, shown in Table 7.12, peaked in Q2 2022 at 95.7 percent. The lowest rate was 90.9 percent in Q4 2018. Q1 2017 had a 92.8 percent rate. Q2 2023’s 92.5 percent rate was the result of two quarterly increases of 0.1 percent (from 92.4 percent in Q1 2023 and 92.3 percent in Q4 2022. The greatest quarterly increase was 2.8 percent from Q2 to Q3 2020. Q2 2022 to Q3 2022 had the greatest quarterly decrease (2.4 percent).

Throughout the period, occupancy rose from Q1 to Q2, except in 2021. Rates rose from Q2 to Q3, except when they fell in 2022. Rates fell from Q3 to Q4 throughout the period. Rates rose from Q4 to Q1 four times; they remained unchanged from Q4 2017 to Q1 2018 (91.8 percent) and Q4 2021 to Q1 2022 (93.8 percent). Occupancy rates were in the 90s in all quarters. See Table 7.12 on the opposite page.

Chart 7.6 on the opposite page compares the Mountain and Pacific areas of the West region. It shows the Pacific area had higher occupancy rates from Q1 2017 through Q2 2023 in every quarter except Q4 2019, Q4 2021, and Q2 2020 (tied at 92.3 percent).

Chart 7.6 - West Occupancy Comparison
Ongoing Occupancy Pressure
Flagging home prices and sales decrease self-storage occupancy rates, put a damper on development, and increase the time required to both develop and stabilize properties. A housing market that isn’t transacting could prolong the trend of decreasing occupancies across the nation. But only time and data will tell how long they’ll the shrinking rates will continue.