simple terms, an appraisal is “the act or process of developing an opinion of value of an asset” (The Appraisal of Real Estate, 15th Edition). A self-storage appraisal is simply the economic model or methodology of developing an opinion of value. Appraisal has evolved as the asset class has become significantly more sophisticated in recent years. Therefore, the focus of this section is on key points to analyze when appraising or arriving at an opinion of value.
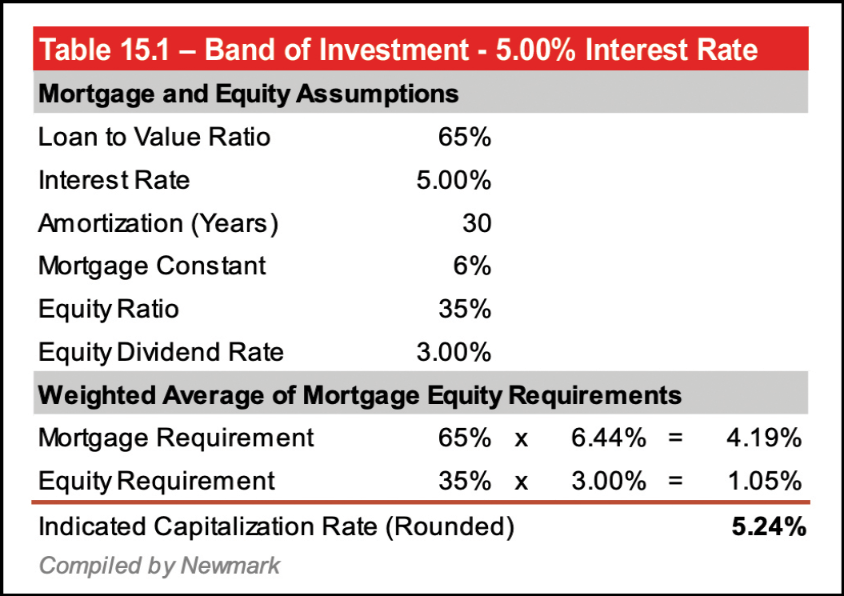
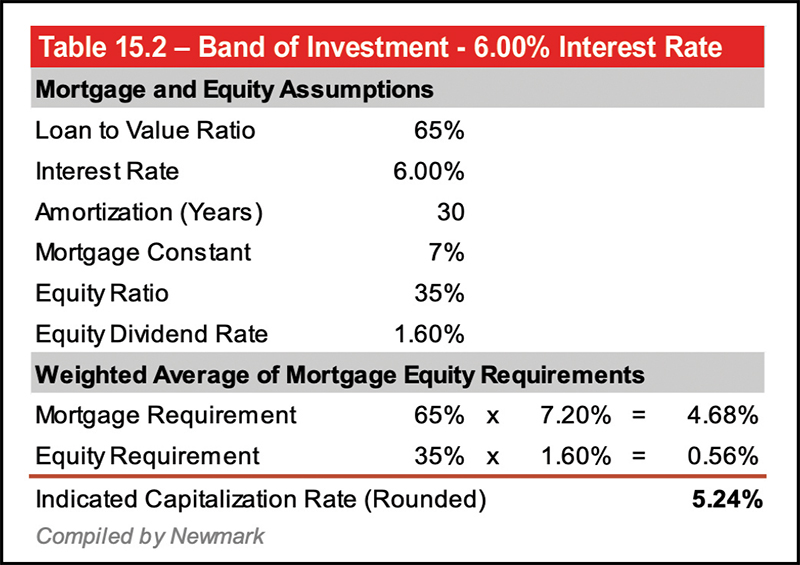
This modeling explains why self-storage cap rates lag interest rate increases; investors are willing to accept lower returns (dividend or cash on cash) on equity. As shown in the example, a 100 bp increase to the interest rate results in a 50 percent decrease to the equity return. Investor underwriting has changed over the last year to include negative leverage, or a negative return in the first year or two of the holding period. As a result, cap rate and yield rate modeling has changed in Discounted Cash Flow analysis for the sector.
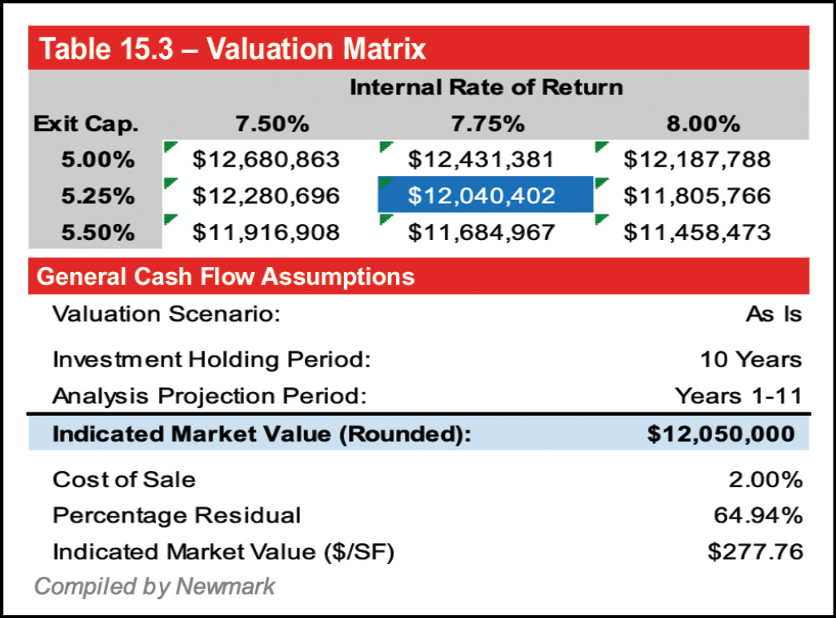
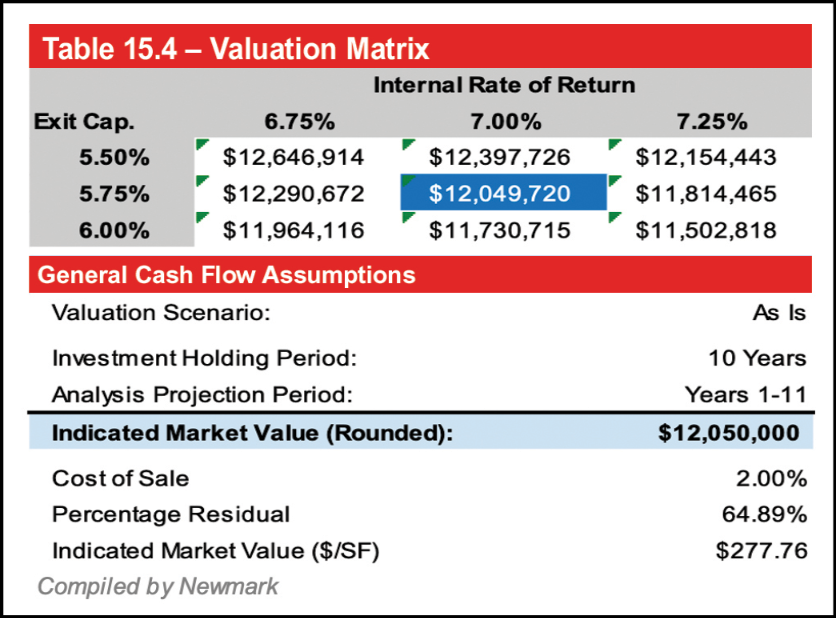
As shown in Table 15.3, the Valuation Matrix with a 7.75 percent shows a typical spread between the cap rate (5.00 percent) and yield rate approximal to the compound rate of growth of NOI. As more institutional investors from other sectors have entered self-storage, modeling for self-storage is reflecting other sectors that have a compressed yield rate and a higher terminal cap rate (75 bp spread to 5.00 percent cap rate) as shown in the Valuation Matrix with a 7.00 percent Internal Rate of Return (yield rate).
As demonstrated, the modeling is different, but the valuation indication does not change. These revisions reflect the market response to dynamic macro-economic conditions. Self-storage is a good hedge against inflation, and the R word for the sector is not recession but resistance (to recession). As a result, more equity is still seeking to store capital in self-storage than product available. The Band of Investment reflecting a 50 bps increase in interest rates is presented on page 141.
- Identification of the Problem (for appraisal, usually identifying the assignment)
- Scope of Work Determination
- Data Collection and Property Description
- Data Analysis
- Application of the Approaches to Value
There are three specific approaches to value that reflect distinct methods of data analysis: the Cost Approach, the Sales Comparison Approach, and the Income Capitalization Approach. The use of two or three of these approaches are then reconciled into a final opinion of value. For self-storage, the primary investment criteria are based on cash flow. As a result, the income capitalization approach is emphasized in self-storage valuation and will be analyzed first.
As to historical trends, a review of the subject property financials is best. An example is presented in Table 15.7 below.
Notice the pattern of Effective Gross Income or EGI. From 2019 to 2020, it increased $64,495, an increase of 20.19 percent. From 2020 to 2021, EGI increased only $616, or less than 0.10 percent. The trailing twelve months (TTM) is not as good an indicator as calendar years due to seasonality and can be skewed. Given this history, an increase of $14,836 or 3.86 percent is concluded in the Year-1 Forecast.
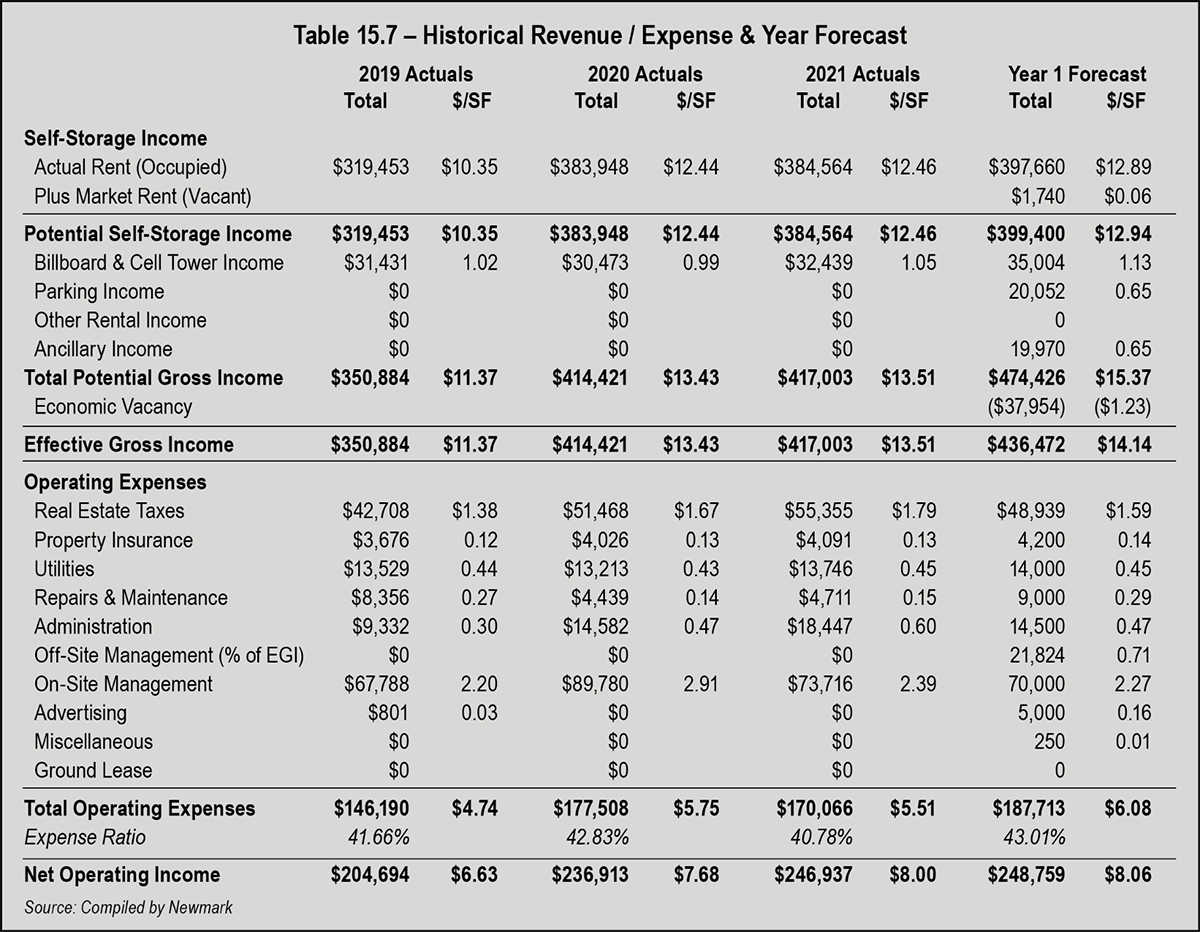
Another test of reasonableness to forecasting collected income or EGI is the Cost of Occupancy (COO). The COO is the average annual rent of a unit (total rent collected divided by occupied units) compared to average annual household income. In general, a ratio near 2 percent suggests rent upside. Alternatively, a ratio above 3.5 percent suggests less upside. In this case, the COO is 1.58 percent, suggesting continued upside in collected rents. As one person noted, some people spend more on coffee than the COO of a self-storage unit. So, who would bother to spend a Saturday moving out of a unit for a savings of 7 percent to 9 percent?
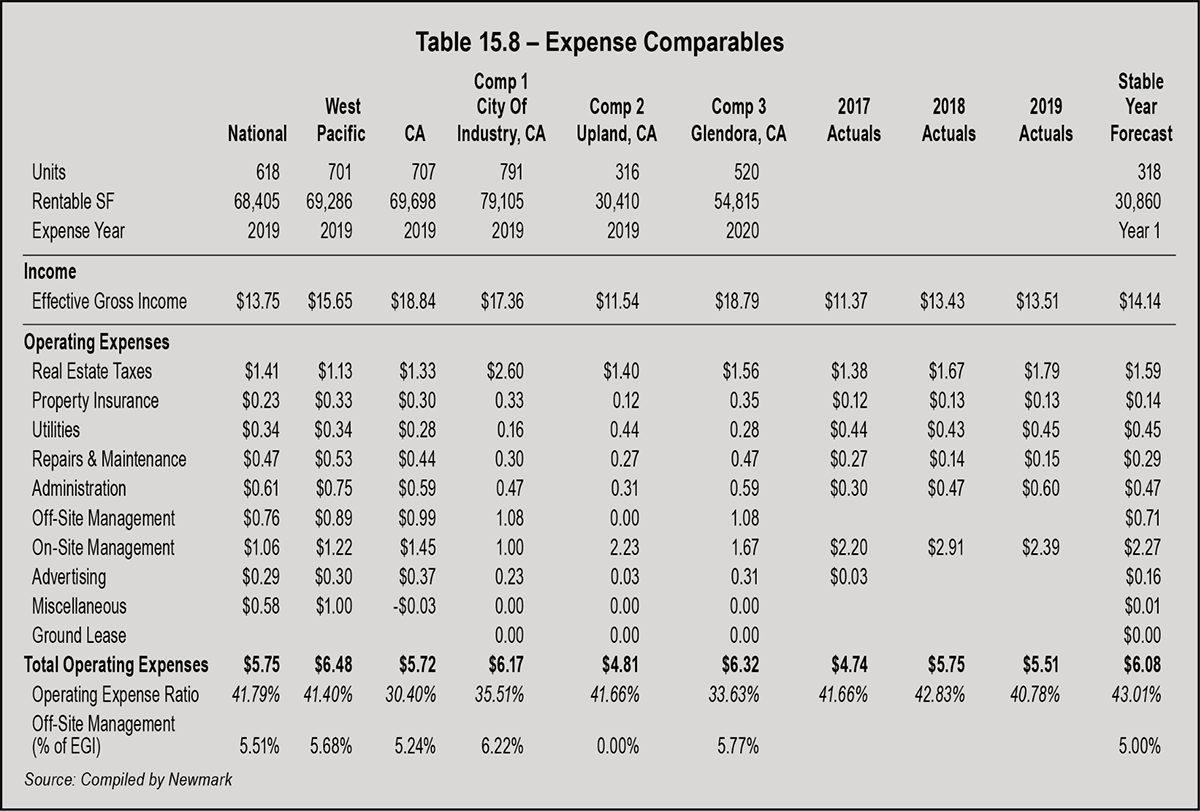
Operating expenses historically at the subject property should be compared to national data, such as the Self-Storage Expense Guidebook (also published by Modern Storage Media) and expense comparables. Data should be analyzed by square footage and as a ratio of EGI. An example is presented in Table 15.8 below.
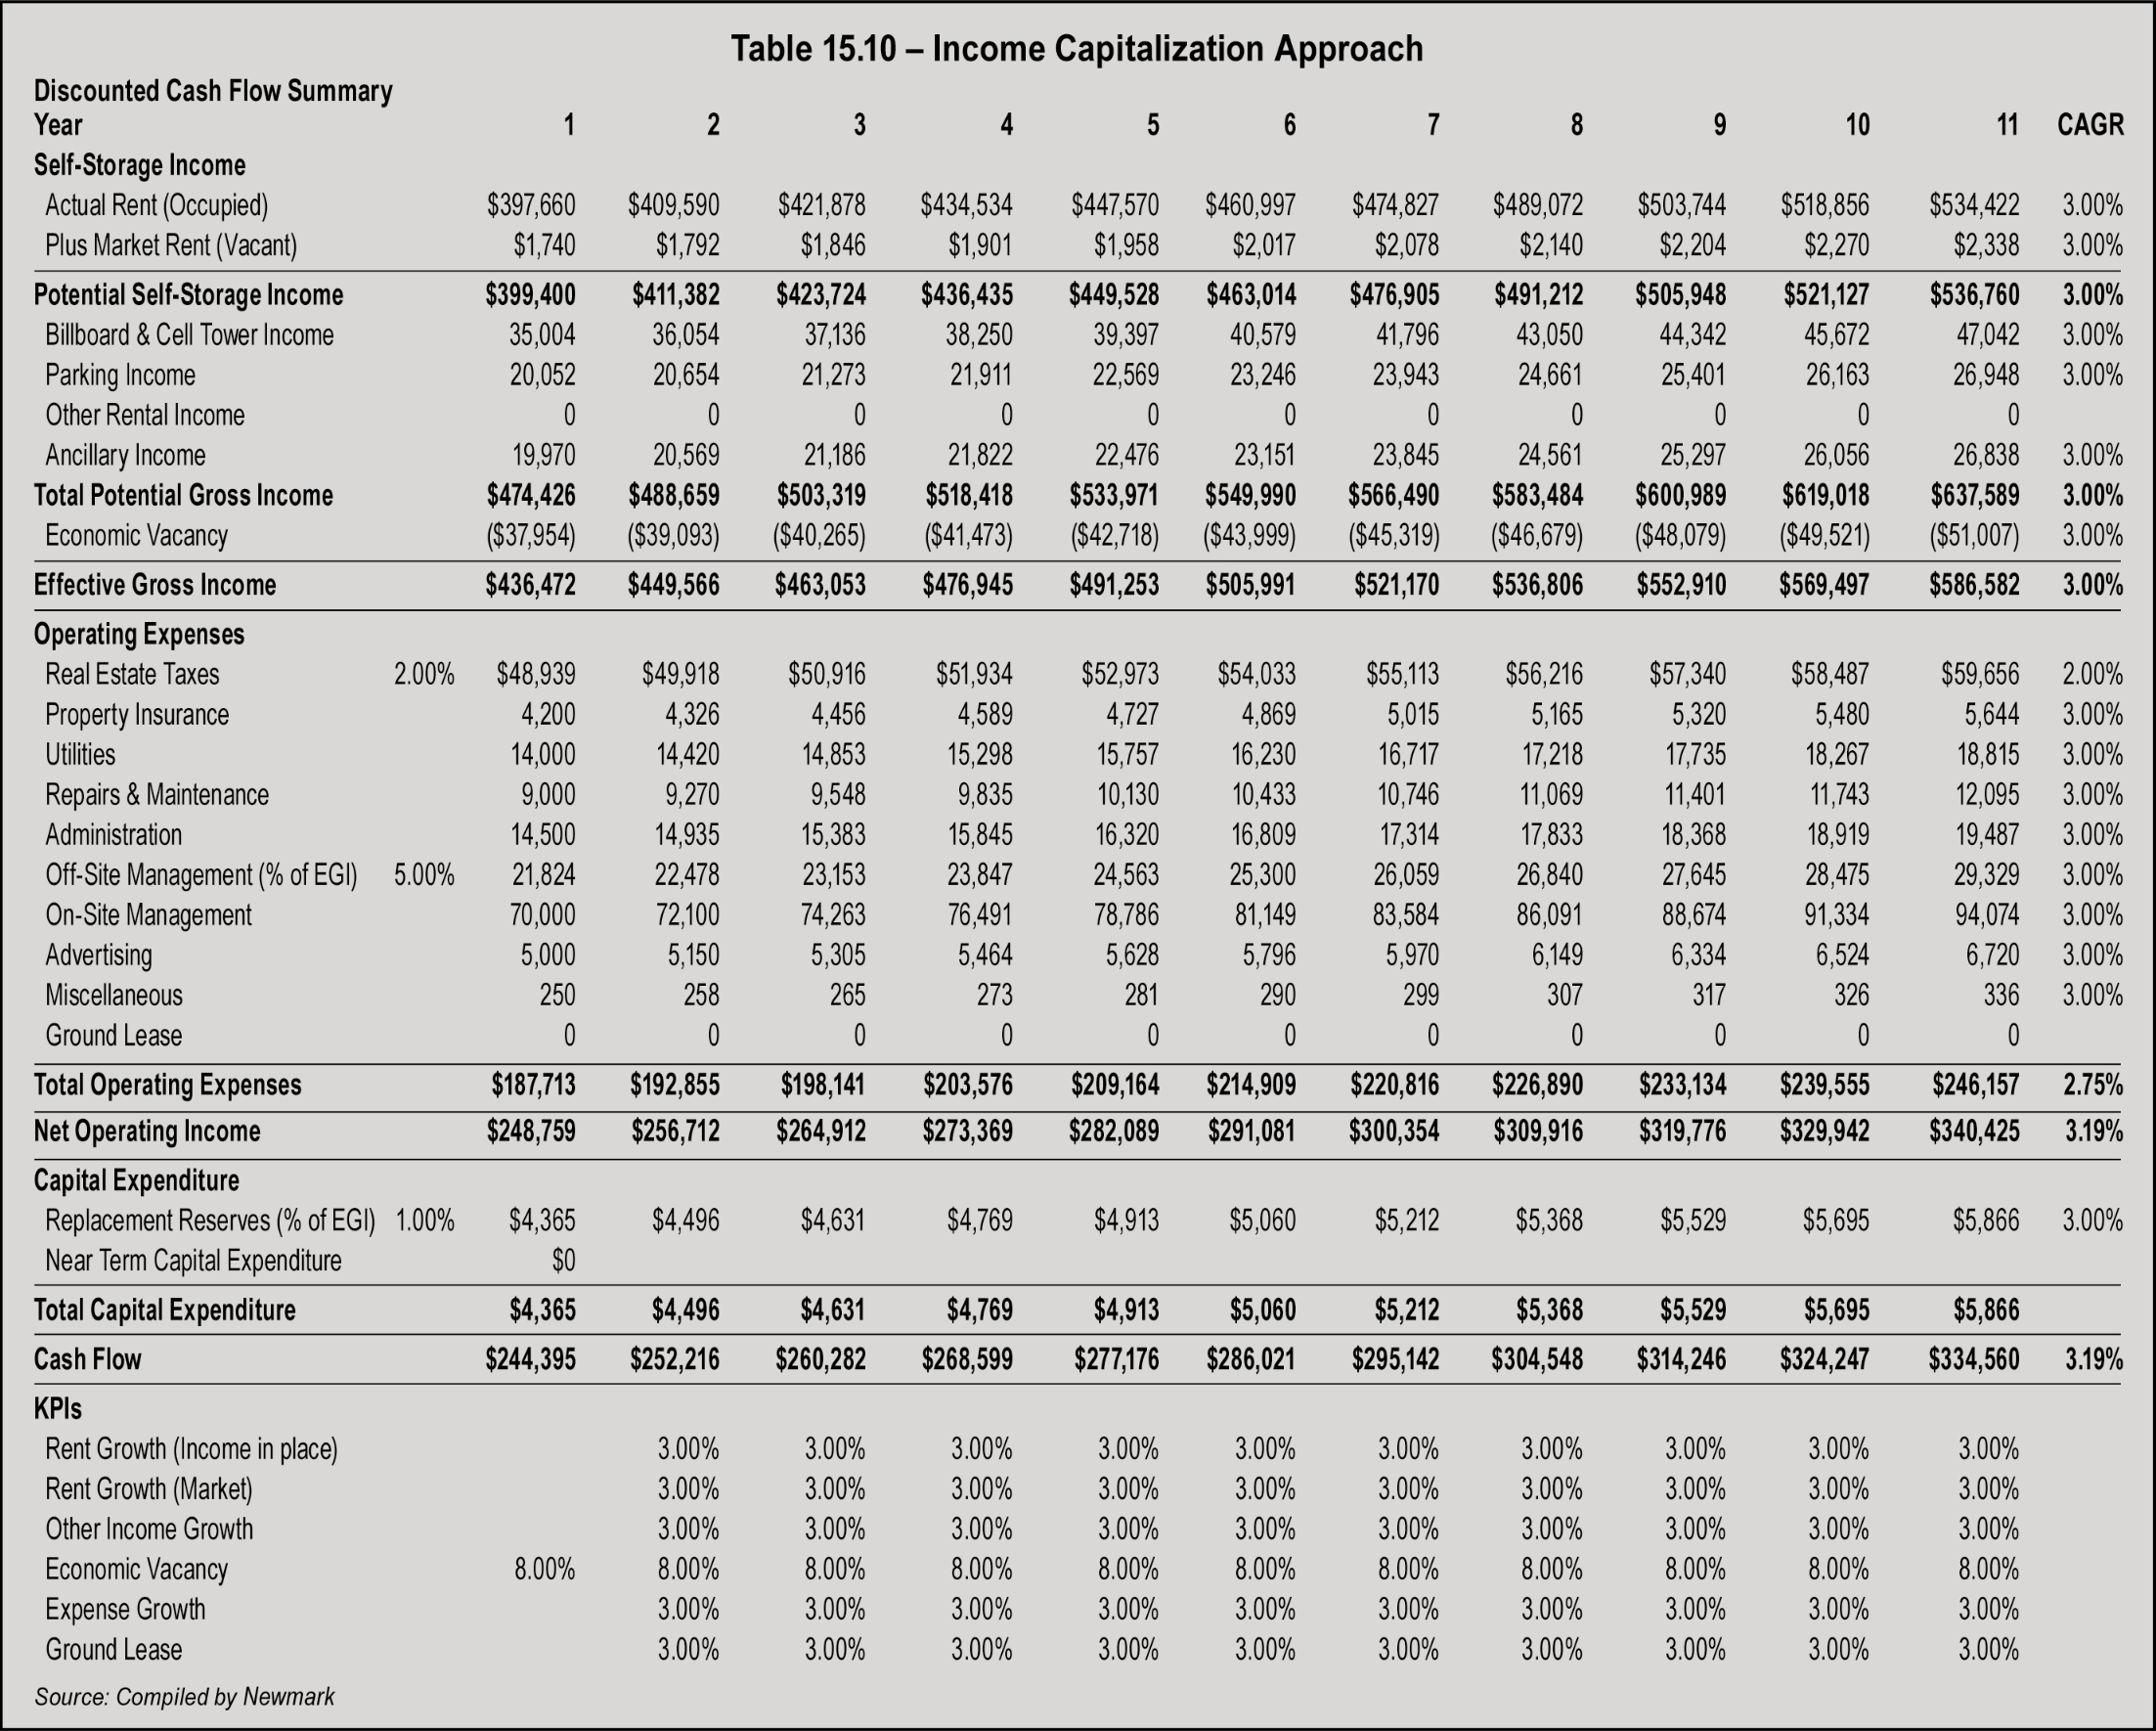
- Relationships – A 10-year discounted cash flow model is the primary decision maker in over 85 percent of investors surveyed. (Please visit www.modernstoragemedia.com to see published Investors Surveys). As outlined earlier, this is because of the increasing sophistication of the self-storage sector. It accounts for both cash flow (equity dividend) and appreciation (yield) during a typical 10-year holding period.
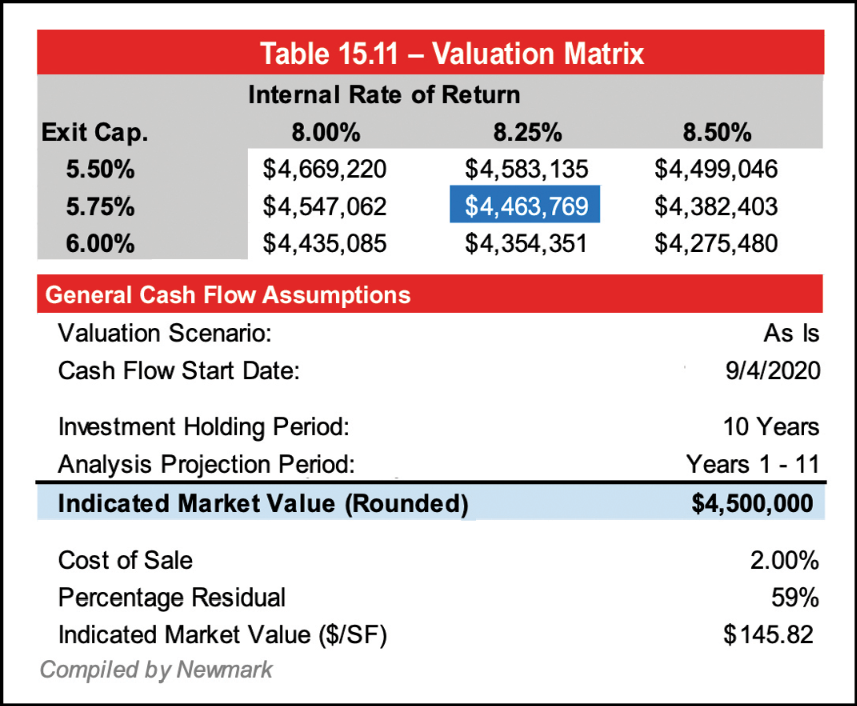
- The relationship of the cap rate and Internal Rate of Return (IRR) or discount rate should be within 50 basis points of the compound rate of the net operating income during the holding period. In this example, the net operating income is forecast to increase at 3.19 percent. With a cap rate of 5.5 percent, an IRR of 8.25 percent is within the 50 bps parameter. Alternatively, since last year, a compressed IRR can be used with an increased terminal cap rate.
- As a test of reasonableness, the relationship of cash flow to appreciation can be examined. In this example, the reversion or appreciation component represents 59 percent of total value, with the balance being attributed to cash flow. In an ideal market, the balance is 50 percent/50 percent. But in appreciating sectors and markets like this self-storage example, the reversion or appreciation component may be as much as 65 percent. Conversely, in down markets, the cash flow may be emphasized as much as 65 percent with only 35 percent of total value being attributable to appreciation.
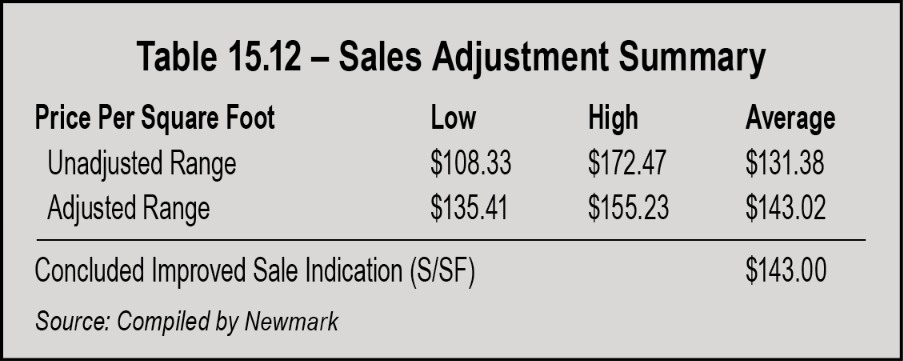
- Unit of Analysis – The appropriate unit for comparison in the sales comparison approach is the price per square foot of rentable area. For self-storage, the price per unit can be easily skewed due to variances in unit mix. For example, a price per unit analysis shows a higher range. Therefore, the price per square foot of rentable area is considered most credible.
- Economic Characteristics – One of the most under-utilized adjustments particular to self-storage is economics characteristics. Since cash flow is the driver of investment decisions in the asset class, economic characteristics should be among the most important adjustments. Economic characteristics include attributes associated with a trade area beyond the location adjustment. For self-storage, this adjustment considers whether the conditions of the comparable trade area can be classified as oversupplied, undersupplied, or at equilibrium. Net operating income per square foot can be one benchmark tool; however, it is not a mathematical relationship and must be used with great care. Another measure of this variable relates to unit rent. For example, the operation of the business generates the net operating income applied to the real estate. In general, there is a correlation between higher rent and higher value. As a result, an adjustment for economic conditions is considered. Unfortunately, precise data and a direct relationship are difficult to isolate. Looking at net operating income as a benchmark, and considering the other adjustments, an adjustment can be derived.
- Adjustment Summary – The total range of adjustments should always decline after the adjustment process, or what is the point of the exercise? In the following example, the range is narrowed from 90 percent to 15 percent. An example is presented in Table 15.12 below.
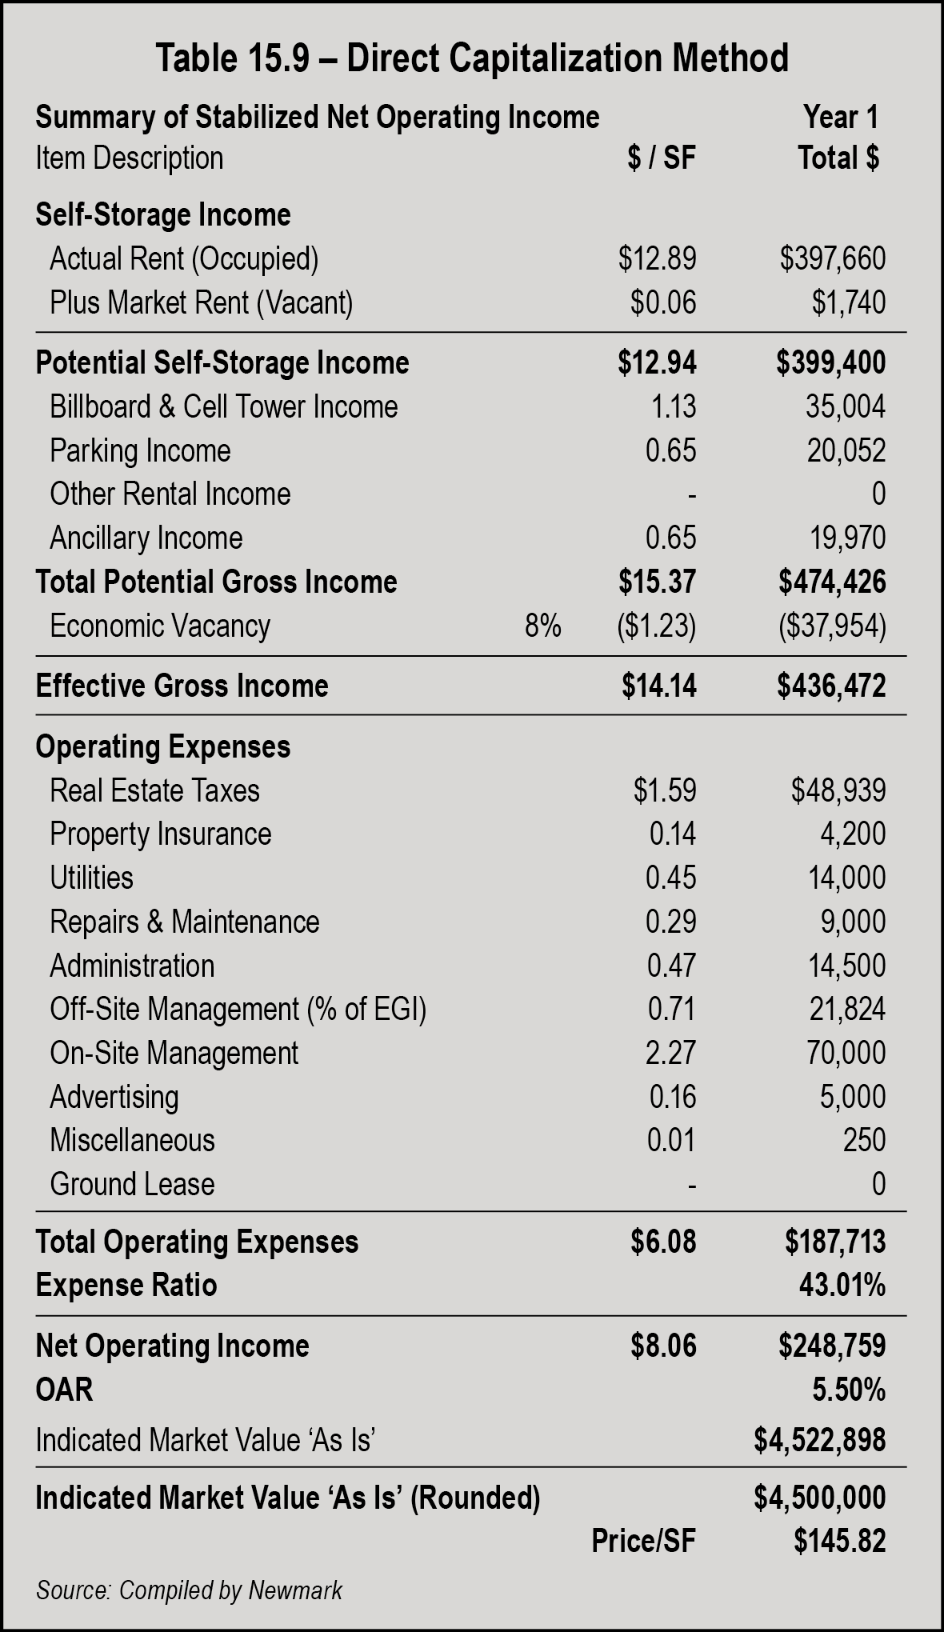
- Effective Gross Income Multiplier (EGIM) – The EGIM tests the reasonableness of the forecast year-one cash flow to the concluded cap rate. Using the formula 1-expense ratio/EGIM (or value divided by effective gross income), expense ratios can be compared to concluded cap rates. In general, the lower the expense ratio the higher the cap rate.
- Secondary Approach – For self-storage, the sales comparison approach is secondary. Because of the emphasis and impact of cash flow and relatively low sales volume in many markets, the price elasticity of self-storage can be very large. As previously discussed, the market emphasizes cash flow and the income approach significantly more than the sales comparison approach.
- Applicable and Relevant – The cost approach is best used for newer properties due to the challenges of estimating depreciation. However, some lenders want an estimate of remaining economic life to ensure the building is economically viable during the amortization period of a loan. This can create challenges and highest and best use questions of a self-storage property. Some investors like to purchase below replacement cost, but this metric can be difficult to quantify due to the wide range of replacement cost estimates, particularly as costs are currently fluctuating due to supply chain problems. Therefore, the applicability and the relevance of the cost approach warrants careful consideration to a credible opinion of value.
- Land Valuation – Self-storage land can be difficult to entitle or obtain zoning approval. Municipalities prefer other property types that generate more jobs or retail sales tax revenue. Therefore, if land sales utilized in an appraisal are not purchased and entitled for self-storage, the land component of self-storage can be undervalued. In general, self-storage land approximates a range of 10 percent to 40 percent of total property value but is typically in a narrower range of 25 percent to 35 percent.
- A cost approach for self-storage typically represents a value upon completion. Depending upon the local market, it may be appropriate to add absorption costs for stabilization (rent loss and some profit for time during lease-up).