Section 17 Industry Development
S

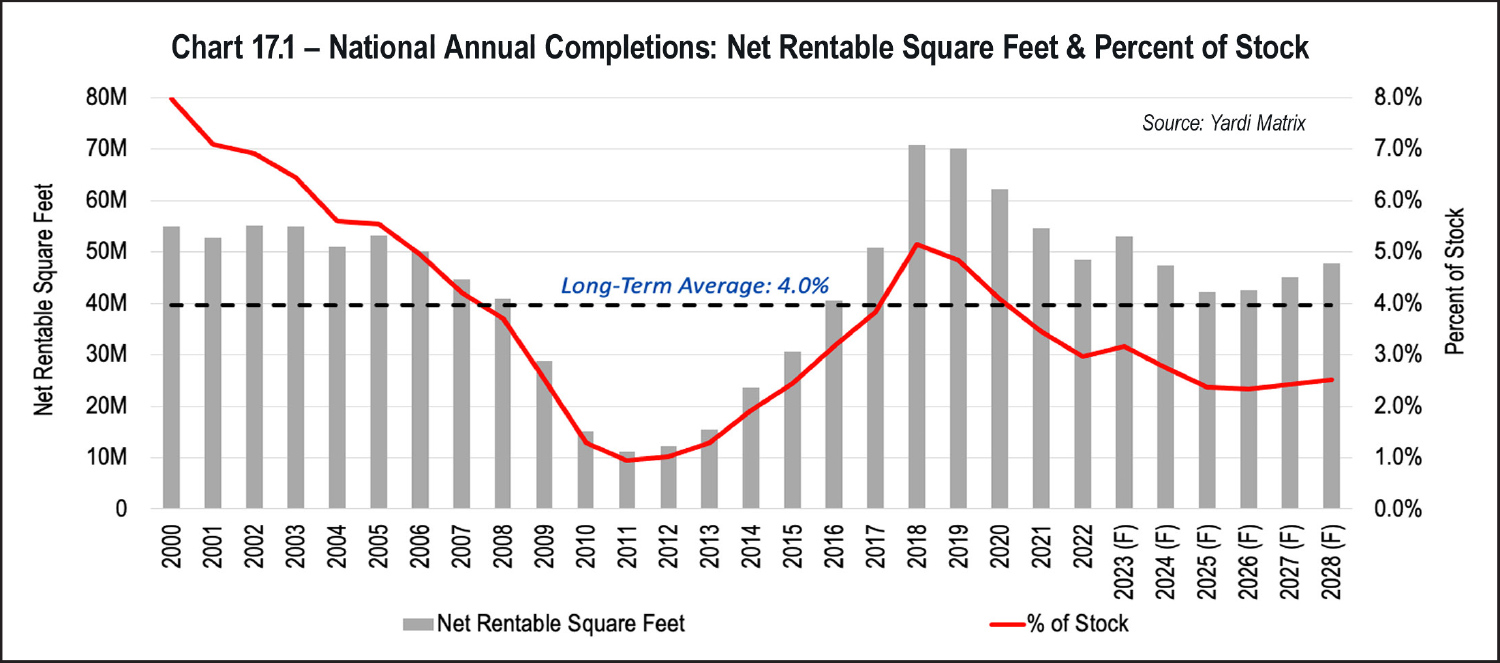
elf-storage development has been appealing to many industry investors, owners, and operators over the past few years, following years of minimal development from 2009 until 2016 and solid fundamentals. Development activity sunk as low as 12 million net rentable square feet annually in 2011 and 2012, or around 1 percent of existing supply. As net operating income grew much faster than most other property types during this period, development activity started to pick up in the middle of the last decade and reached a peak in 2018 and 2019 with over 70 million net rentable square feet per year, or over 5 percent as a percent of stock. With over 4,598 properties or 415 million net rentable square feet delivered since 2017, this has been one of the most active development cycles in the history of the industry. Despite the new supply, the industry has managed to maintain occupancy levels over 90 percent, a testament to strong demand patterns that for years have outpaced new supply. Looking forward, Yardi Matrix projects supply will remain elevated, yet as a portion of existing supply, annual deliveries will be below the long-term average of 4 percent. See Chart 17.1 below.

Chart 17.1 - National Annual Completions: Net Rentable Square Feet & Percent of Stock
Table 17.1 – Top Self-Storage Developers Since 2017
Chart 17.2 - Developers Since 2017 by Numbers of Developments
Despite the supply and demand imbalance, strong performance, and plenty of interest in self-storage development over the past several years, it remains a challenging investment strategy to pull off at scale. Laborious land assembly and acquisition, contentious site and zoning review, delayed inspection and final approvals, rising construction costs, and sometimes elongated lease-ups and unpredictable market rents are all barriers to development, and it takes an experienced and savvy company or individual to be successful at it. Still, since 2017, self-storage development has been surprisingly fragmented, with local and regional players doing most of the heavy lifting. Data from Yardi Matrix shows that since 2017 there has been a total of 2,313 different entities and individuals that have built a self-storage property. Chart 17.2 at the left shows that 39 percent of all developments have been completed by an individual or company with only one project, and more than 60 percent of developments were undertaken by an entity with less than five projects over the past six years. Less than 9 percent of new properties have been completed by a company with 50 or more developments, and only three companies have accomplished this feat (Amerco Real Estate [dba U-Haul], Public Storage, and Johnson Development Associates), while 15 companies have built 20 or more new stores accounting for roughly 15 percent of total stores built this cycle. See Table 17.1 above.
Table 17.2 Top Buyers of Properties Built Since 2017
A few of the largest national owners/operators have avoided creating new construction and development divisions to go after development in a significant way and participated in development in limited capacity, for instance, as a joint venture partner with a partial interest or engaging in a pre-sale, including CubeSmart and Extra Space. Others, like National Storage Affiliates, have stayed out of development completely. Many of the top developers have been development-focused companies without an acquisitions portfolio, like Johnson Development Associates, SAFStor, and Northpoint Development. Still others are small- to mid-sized national operators, like The William Warren Group (dba StorQuest), The Sterling Group (dba Mini Mall), or Madison Capital Group (dba Go Store It), or regional owners/operators like All Storage, The Carrol Companies (dba Bee Safe Storage), or Stein Investment Group (dba Space Shop Self Storage).
Most of the top buyers of newly built properties have been REITs, making up 38 percent of sales activity in this cohort of properties since 2017. Some of these acquisitions were conducted through joint ventures with large financial firms …
Table 17.3 Top Managers of Properties Built Since 2017
Of the 4,598 stores delivered since 2017, over 32 percent of them have since been sold, many of them in large portfolio transactions like the Public Storage/NorthPoint Development portfolio sale in early 2021, in which NorthPoint sold 22 stores to Public Storage, 20 of them developed since 2017. Other stores developed since 2017 were sold as part of larger portfolios, like the $1.5 billion Public Storage/All Storage transaction in December 2021 that included 20 stores developed by All Storage in Dallas/Ft. Worth. A few developers have sold off all or most of their stores developed since 2017, either one-off sales or portfolio sales, to recycle the capital on other developments. Sales of newly developed properties have been a significant part of the transactions market the past few years. Of the nearly 5,000 self-storage properties sold since 2020, 26 percent of them have been built since 2017. These properties have supported higher pricing in recent years, selling for an average price of $176 per net rentable square foot versus an average of $137 per square foot for properties built before 2017 (excluding the StorageMart/Manhattan Mini portfolio).
Chart 17.3 – Development Lenders by Number of Construction Loans
Top buyers of properties built since 2017 are shown in Table 17.2 on the opposite page. Most of the top buyers of newly built properties have been REITs, making up 38 percent of sales activity in this cohort of properties since 2017. Some of these acquisitions were conducted through joint ventures with large financial firms, and many were part of portfolio sales. Other large buyers of new developments include NexPoint Group, which acquired Jernigan Capital and their portfolio of newly built properties in November 2020. Prime Group has also been one of the most active buyers; it closed on $2.5 billion early in 2023 for their third fund, the largest such fund raised for self-storage investment in history. Other top buyers include large national and regional owners/operators like Strategic Asset Management (dba SmartStop Self Storage), Andover Properties (dba Storage King USA), and Madison Capital, as well as large private equity groups like KKR and Harrison Street Real Estate Capital.

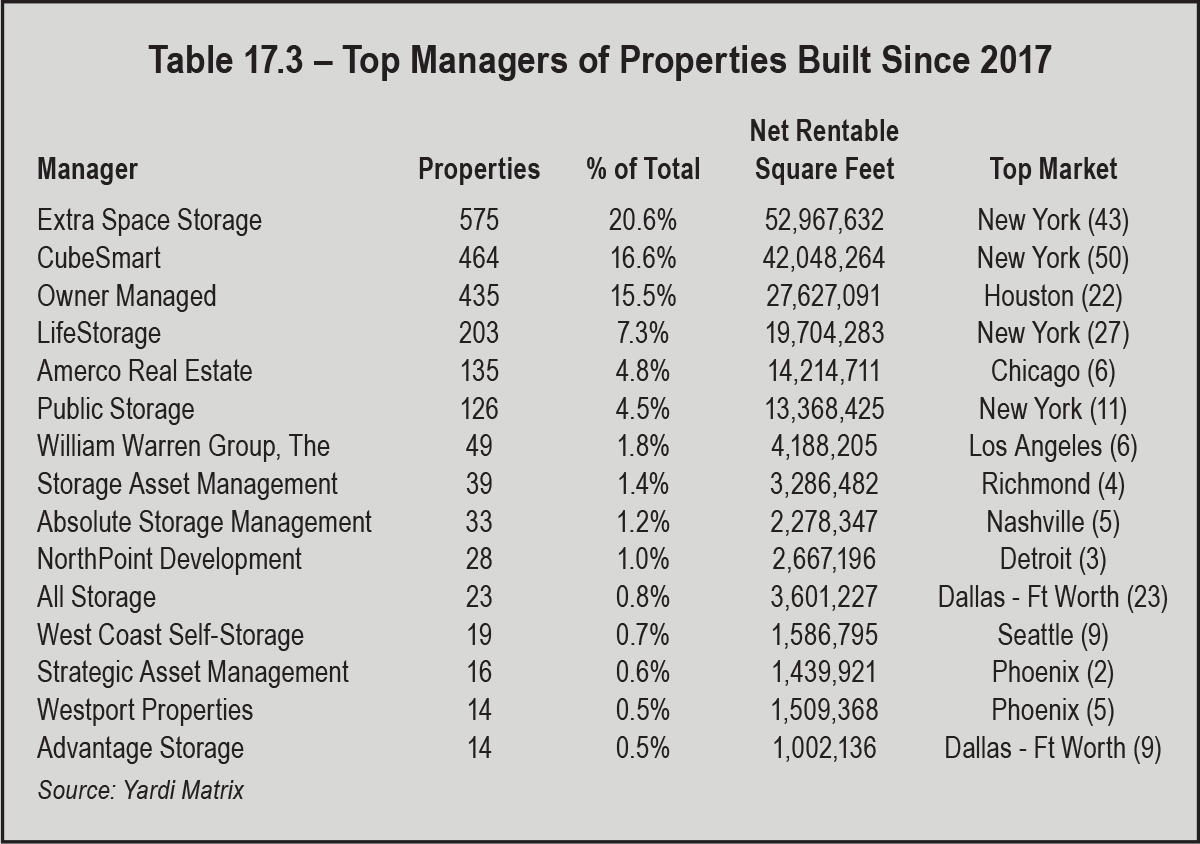
Many developers have enlisted larger operators, usually the self-storage REITs, to assist with planning and to lease up the properties for a variety of reasons. Many times, lenders to self-storage developers will request third-party management, and the REITs have responded by rapidly expanding their third-party management platforms. The self-storage REITs have managed nearly 50 percent of all properties delivered since 2017. This has resulted in consolidation of management in the industry, with the REITs expanding their third-party management portfolios by 198 percent, from 767 stores in Q4 2016 to 2,289 stores in Q2 2023. CubeSmart and Extra Space have largely been the operator of choice for many developers; they have by far the largest third-party management platforms, managing a total of 1,705 properties for third parties as of Q2 2023. In many cases, this has helped these companies build market intel, sometimes in new markets and submarkets for them. It also has helped companies gain access to off-market deals, acquiring the third-party managed stores from developers during or following their lease-up. New York has been one of the most active markets for development this cycle, and the REITs have been the manager of choice for new stores there. See Table 17.3 above.

Yardi Matrix also tracks loan data for the 30,000-plus self-storage properties in the database, including 3,650 construction loans made since for developments completed from 2017 onward.
Yardi Matrix also tracks loan data for the 30,000-plus self-storage properties in the database, including 3,650 construction loans made since for developments completed from 2017 onward. Of these 3,650 loans, about 80 percent have matured, while 12 percent are for developments still under construction. Combined, these construction loans total about $23.8 billion in lending activity since 2016. Chart 17.3 shows lenders by number of loans, and Table 17.4 ranks the top lenders by loan volume. This does not include “Private Lenders” and other loans for which we do not have lender information (about 4 percent of total loans). Although there are fewer construction lenders than developers, about 873 companies tracked, construction lending activity has also been scattered among a wide variety of types and sizes of banks, trusts, REITs, and other financial institutions.
Table 17.4 - Top Construction Lenders Since 2017
Although construction lending is less fragmented than development activity, there are only three banks that have made more than 50 construction loans for self-storage over the past few years (Truist Bank, Live Oak Bank, and Renasant Bank), accounting for only 6.3 percent of total loan volume. A majority of lending activity has come from companies with between three and 25 separate construction loans, accounting for 53 percent of total volume. For developments currently under construction, the three largest lenders since 2017 are still active, but the lenders with the most loans for properties under construction are SouthState Bank and Bank OZK with 10 construction loans each. The three largest banks in the U.S. (JPMorgan Chase, Bank of America, and Citibank) have made only six total tracked construction loans to self-storage projects over the past few years, accounting for $62.4 million of volume, or just 0.3 percent of total volume. The fourth-largest bank in the country, Wells Fargo, has also been the fourth-largest lender to self-storage developments, with nearly $400 million in volume; over 91 percent of these loans have closed. See Chart 17.3 and Table 17.4.

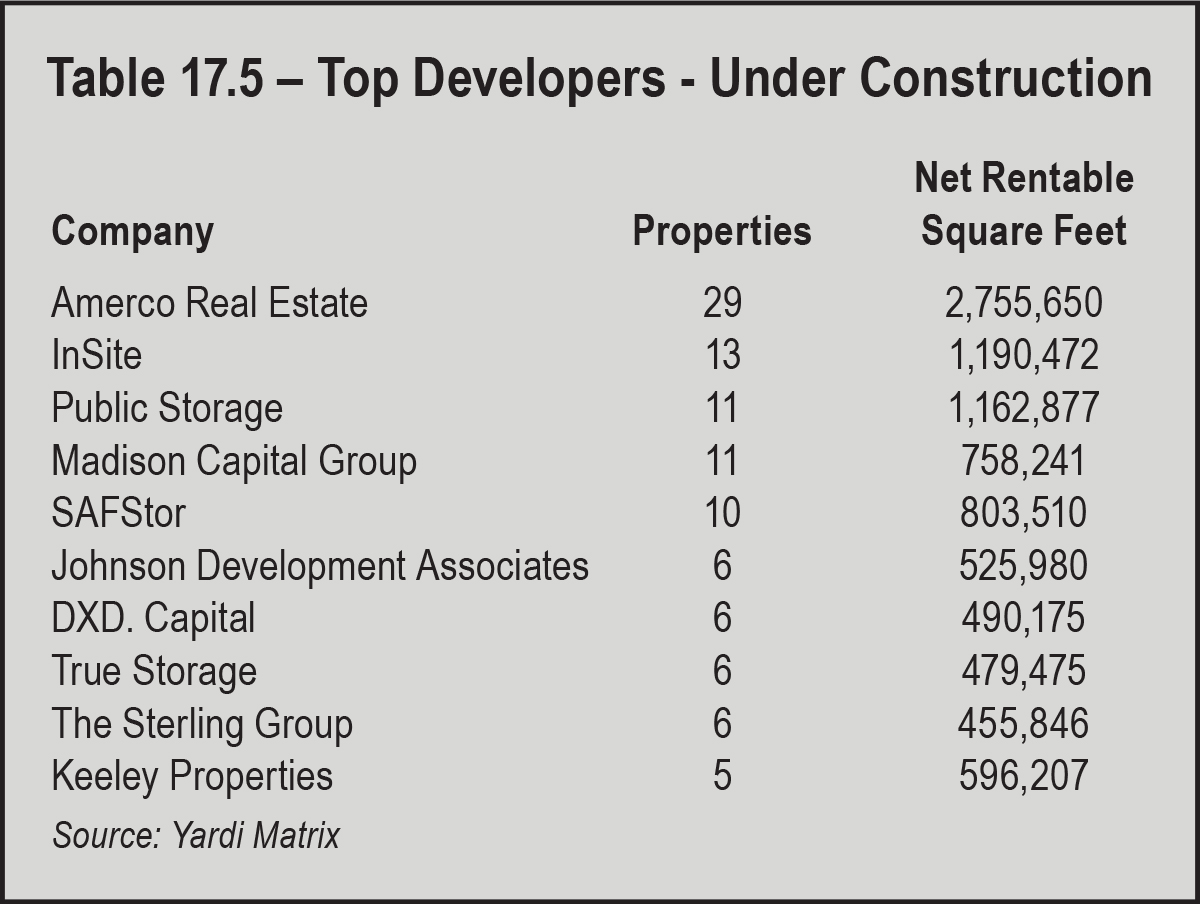
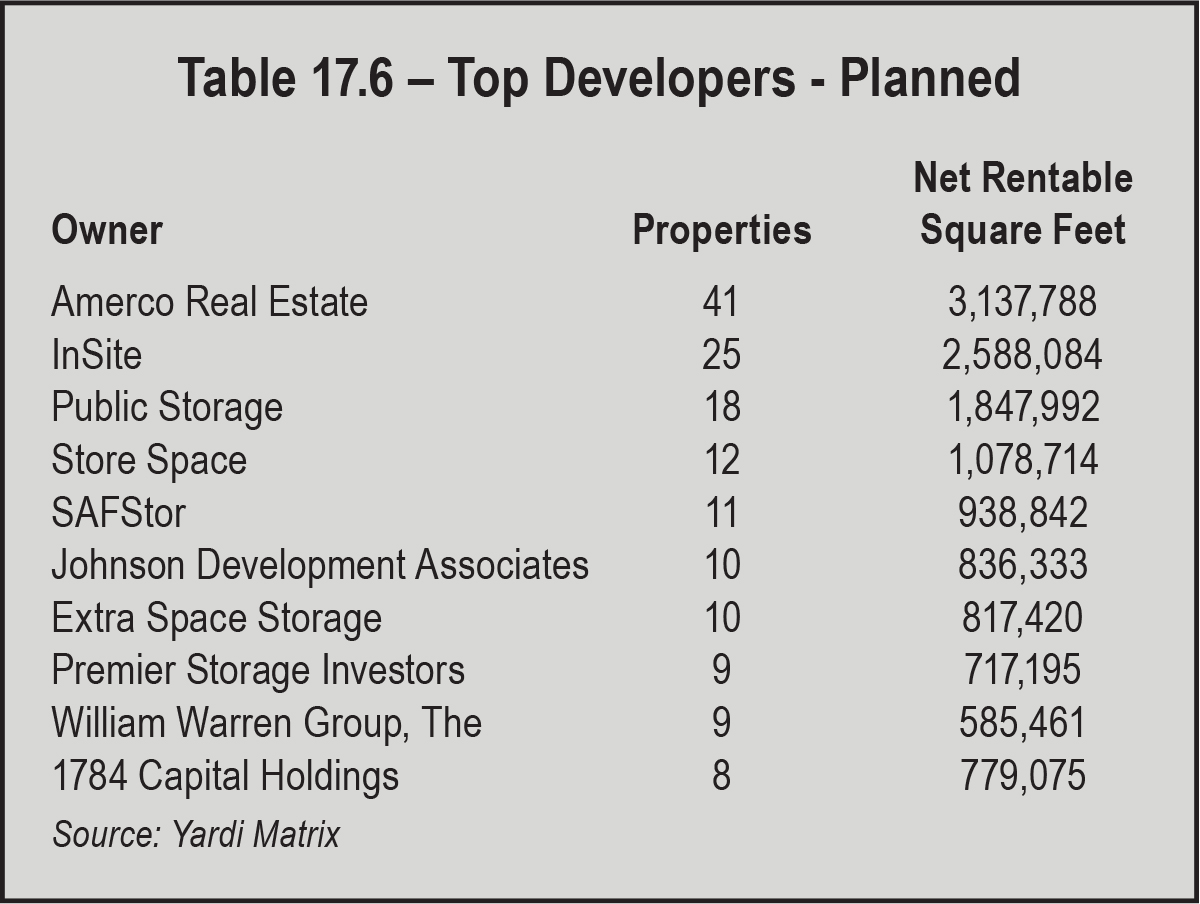
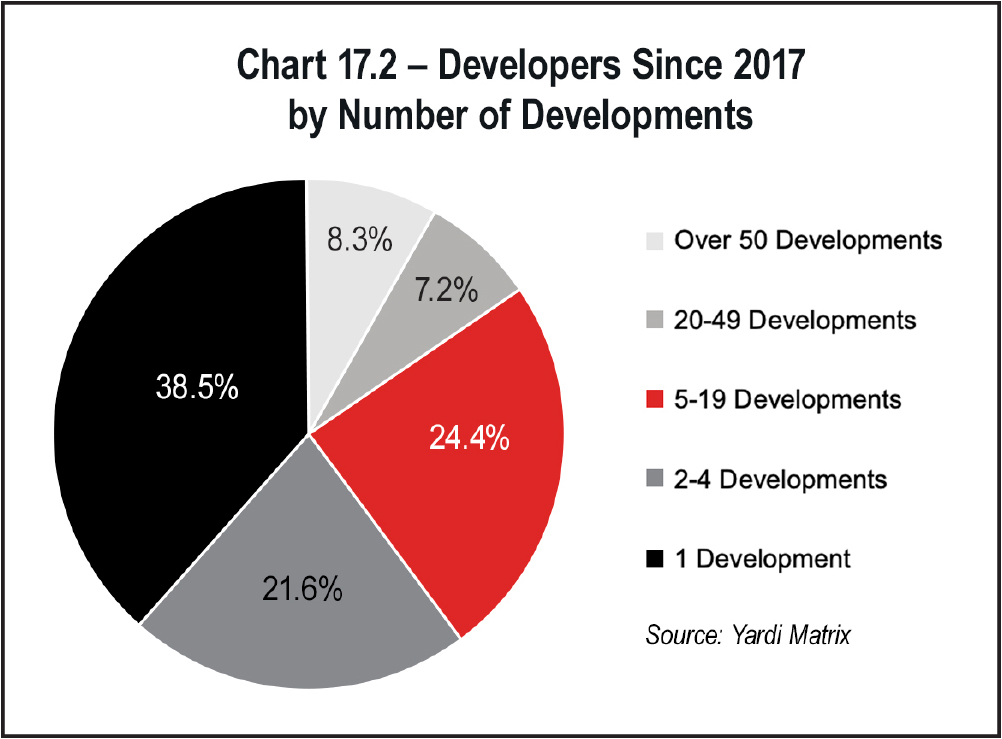
Looking forward, much of the supply under construction or in planning today is still coming from smaller development shops and individuals with limited experience in the sector. The largest developers today include some of the same companies that were top developers over the past few years, as well as newer upstarts that have recently raised large amounts of capital, like InSite (dba SecureSpace Self Storage), DXD. Capital, and Store Space. The development landscape nationally is still incredibly fragmented, with nearly 60 percent of 696 ground-up developments or conversions under construction coming from developers with only one project under construction, and 76 percent of new developments under construction coming from a developer with three or less projects. Of the 1,544 planned self-storage developments, over 64 percent are from a developer with one project; 84 percent are from developers with less than five developments in planning. Again, Amerco, InSite, and Public Storage are the leading developers with projects in planning, and no other developer has more than 12 properties planned. See Tables 17.5 and 17.6 below.

Table 17.5 – Top Developers - Under Construction
Table 17.6 – Top Developers - Planned