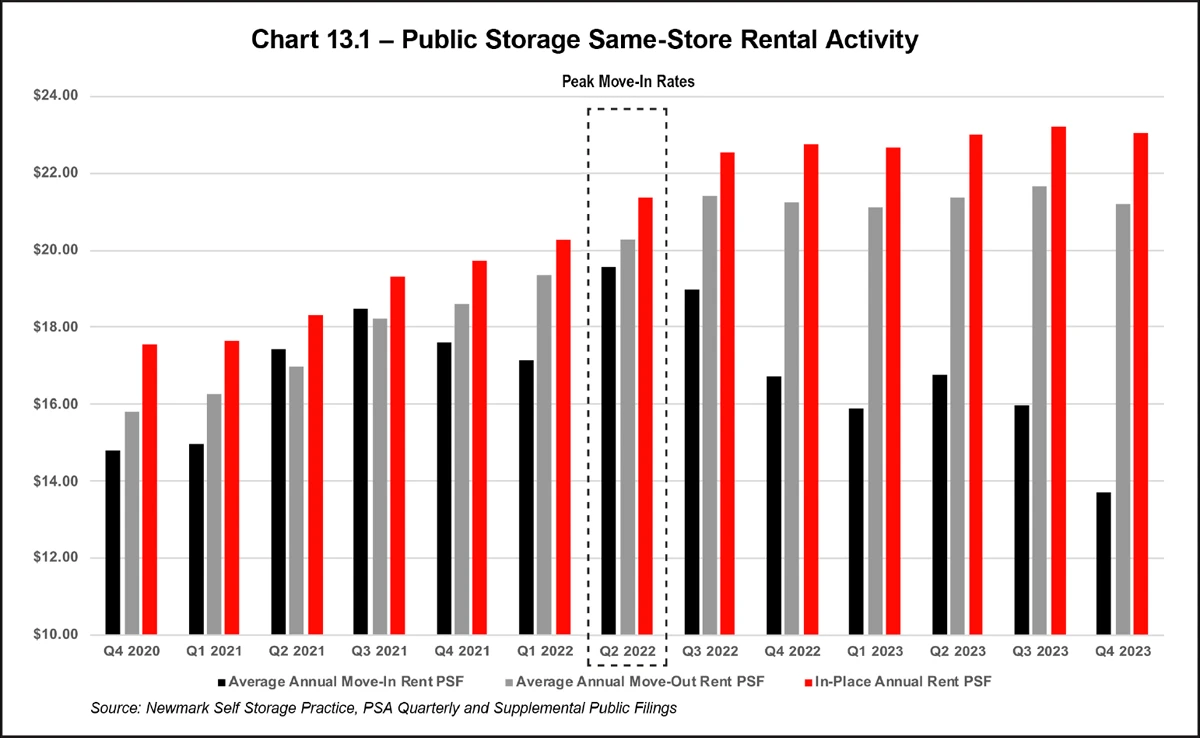
espite uncertain macro-economic conditions, investor interest in the self-storage asset class remains high. Self-storage is resilient to both inflation and recession and is considered by many market participants to be a safe haven. For example, self-storage has outperformed other CORE sectors of real estate, such as apartments and industrial property, over the long run, according to NAREIT data. Investor expectations are changing due to expectations of improved operational and lending conditions in 2024, as well as stable to decreasing cap rates. It is interesting to note that Chart 13.1 Public Storage Same-Store Rental Activity research by Newmark Self Storage Practice, PSA Quarterly and Supplemental Public Filings: 2Q 2022 to 3Q 2023, self-storage rental income growth or actual rents increased 9.80 percent, while street rates or asking declined 18.40 percent.
In “Self-Storage Economics and Appraisal,” market conditions are outlined as the core of self-storage economics. It is described as an analysis of the market conditions that affect value using both qualitative and quantitative techniques. One tool, benchmarking, can be a starting point of analysis. For example, a measure of the total self-storage supply per person in the local trade area can be benchmarked to core-based statistical area (CBSA) data published by the Almanac. Another tool, the Cost of Occupancy (COO), can measure rents as a ratio of average household Income to CBSA data also published in the Almanac.
Investor expectations are changing due to expectations of improved operational and lending conditions in 2024, as well as stable to decreasing cap rates.
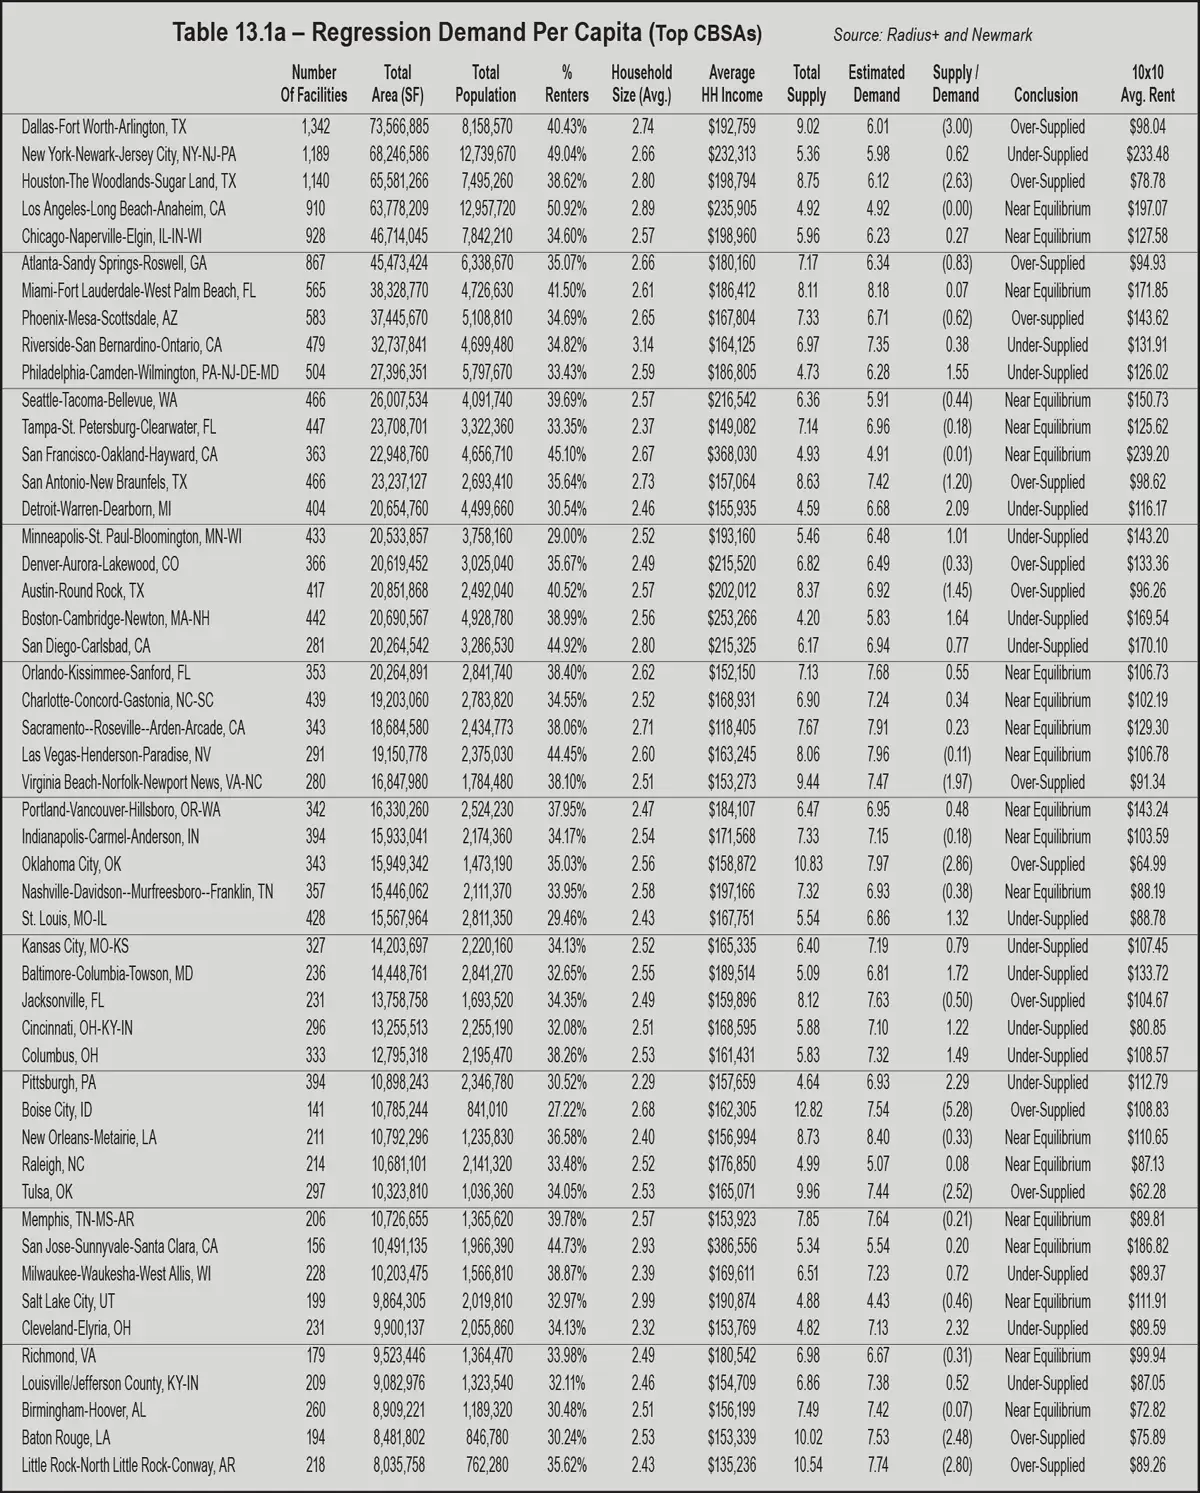
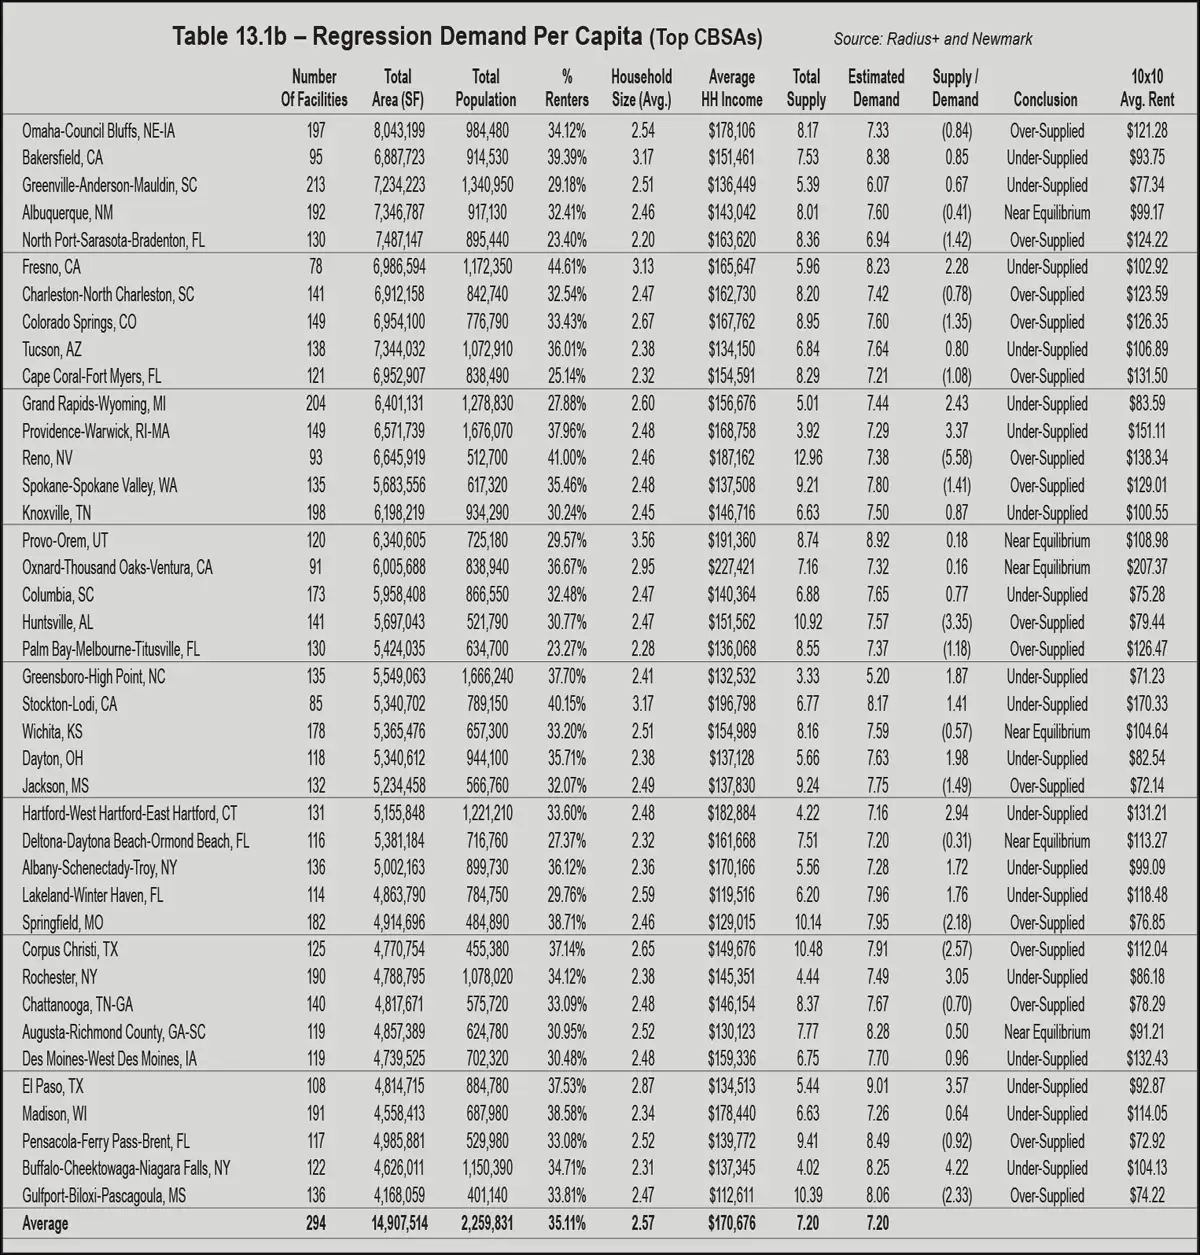
Determinants of the self-storage market relate to the forces of supply and demand, as is the case with other types of real estate. The analysis of demand generators, however, is focused on four key variables:
- Population
- The percentage of renters
- Average household size
- Average household income
A simple econometric model can be used to estimate self-storage demand. Table 13.1 shows the results of regression analysis using a proprietary model registered with the Library of Congress. However, this data can be easily duplicated in spreadsheet software or statistical packages. In the multiple regression model, the dependent variable is square feet of self-storage per person. The independent variables are the demographic variables by CBSA: population, percentage of renters, average household size, and average household income. Testing these variables for relationships and rank indicates a moderate correlation with a multiple r coefficient of 0.45333 and an r-squared of 0.22484. Comparing existing supply to demand can be used as a benchmark to determine if a CBSA is undersupplied, oversupplied, or at equilibrium.
- Market participants report cautious optimism for the sector in heading into 2024. Cap rates increased only 7 basis points from the prior quarter to a current average stabilized rate of 5.75 percent. Many pointed out continued strong ECRI (Existing Customer Rate Increases) despite declining street or asking rates. The prevailing view, according to the survey, is improved operating, interest rates (lower), and investment activity in 2024.
- Discounted cash flow modeling is more important than ever for investment and underwriting decisions. While it appears rental rates have kept pace with inflation, a “return to normal” is likely in 2024 regarding rent rate growth. Expenses will be closely monitored with concerns of rising utility and tax accounts. Remote or less on-site management and contactless customer rentals will increase as cost cutting tool of operations.
- Supply chain problems have restricted self-storage development that resulted in a conservative pace of new product in 2023. Although supply chain is easing, city processes with permits and entitlements are not getting easier. Lenders are more conservative, and with the higher cost of funds, some projects that were feasible less than a year ago may be marginally feasible or not feasible in 2024. As a result, supply and demand fundamentals should remain strong for the sector over the next several years.