Section 5 Customer Traits
J

ust as self-storage technology and business practices are changing, the self-storage customer is evolving as well. You need to know who your customers are to do business with them. Knowing your customer base makes your marketing effective, helps you provide the features and amenities your prospects are willing to pay for, and increases your success in renting space.

The Self Storage Association (SSA) provides a valuable service to the industry by conducting national demand studies. These studies date back to 2014, with the most recent study released in 2023. This is the main source of data referenced throughout this section.

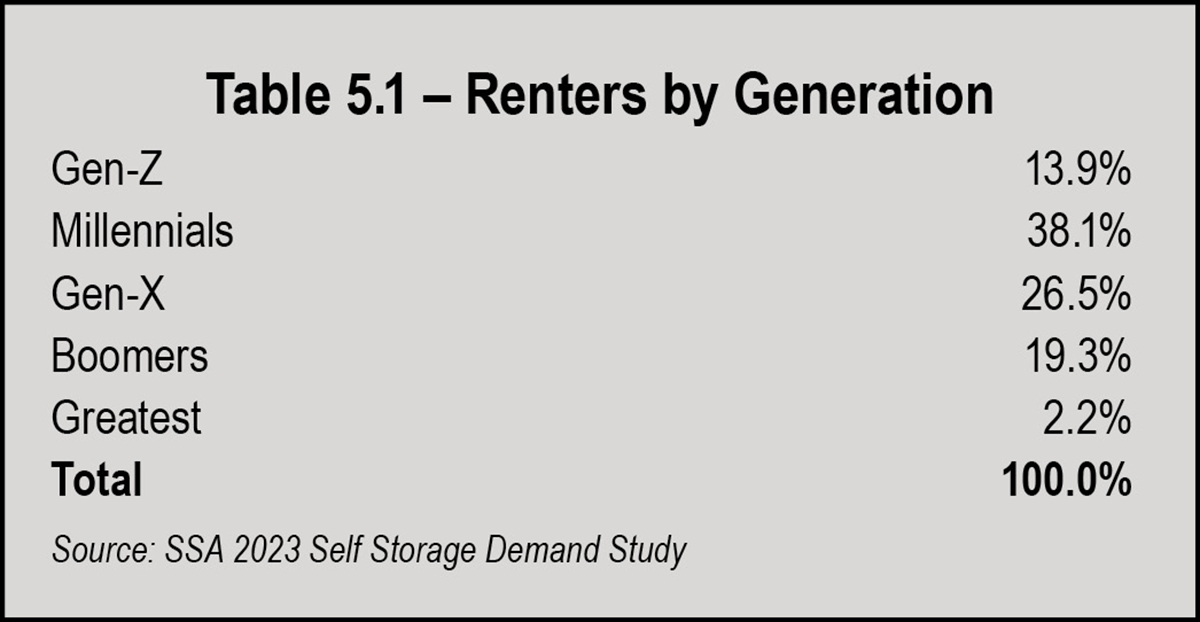
Comparing the SSA’s 2023 Self-Storage Demand Study to the pre-pandemic study of 2019 shows that some national trends continue moving in the same direction, like overall tenant mix. However, there are some very important changes, such as the profile of storage customers by generation.

Chart 5.1 – Tenant Mix
While knowledge of national trends is important, knowing who lives and works within one, three, and five miles of the facility is critical, because storage is a local business. These national trends will shed light on customers in your market, but using more granular sources to get local data is necessary. You can get a lot of this information from realtors who use data sources on number of households, income, poverty, and other helpful statistics.
Tenant Mix
Self-storage customers in the past year came from the same four groups (residential, business, military, and student), with residential renters representing the vast majority at just over 80 percent. See Chart 5.1 below.

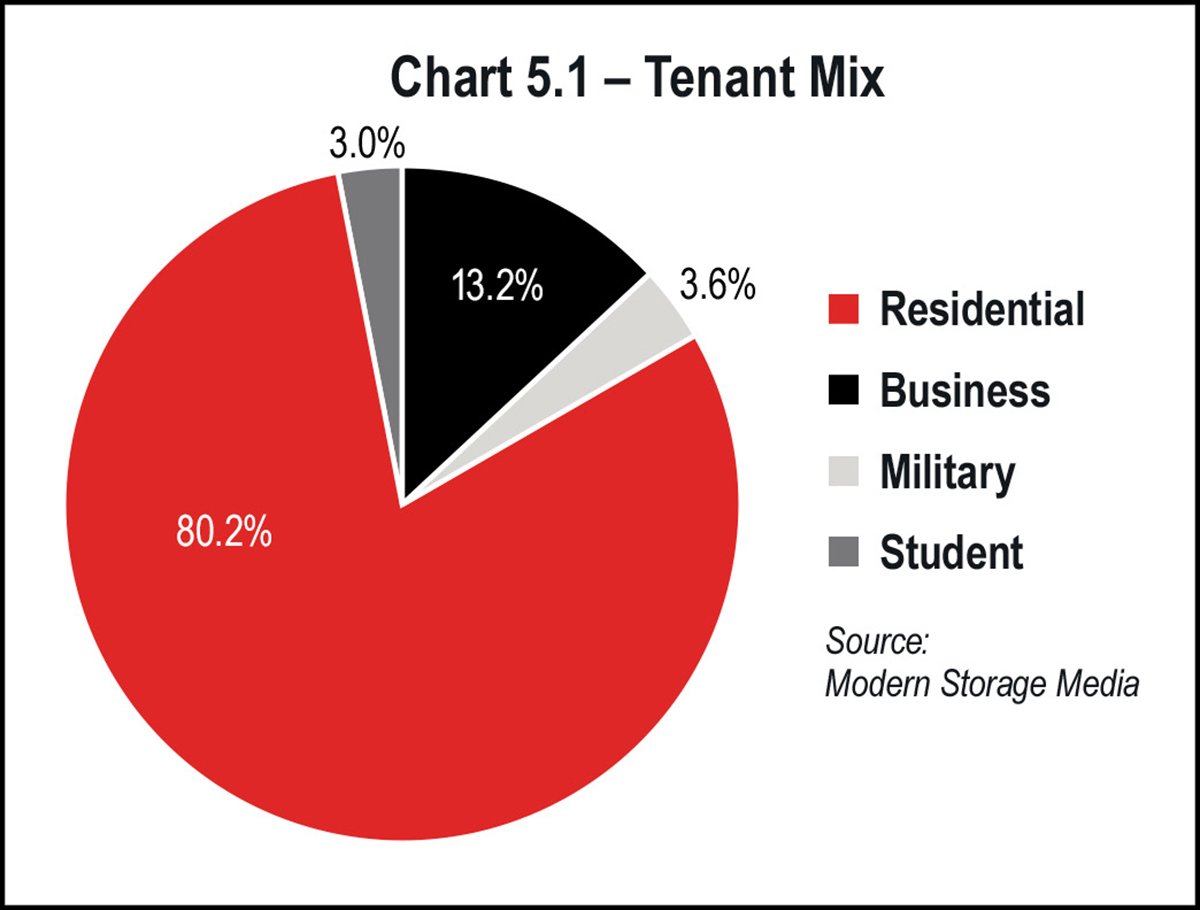
Between 2019 and 2023, there was very little change in any of these categories. Businesses renting space decreased slightly, but so did the overall number of businesses in operation in the U.S.

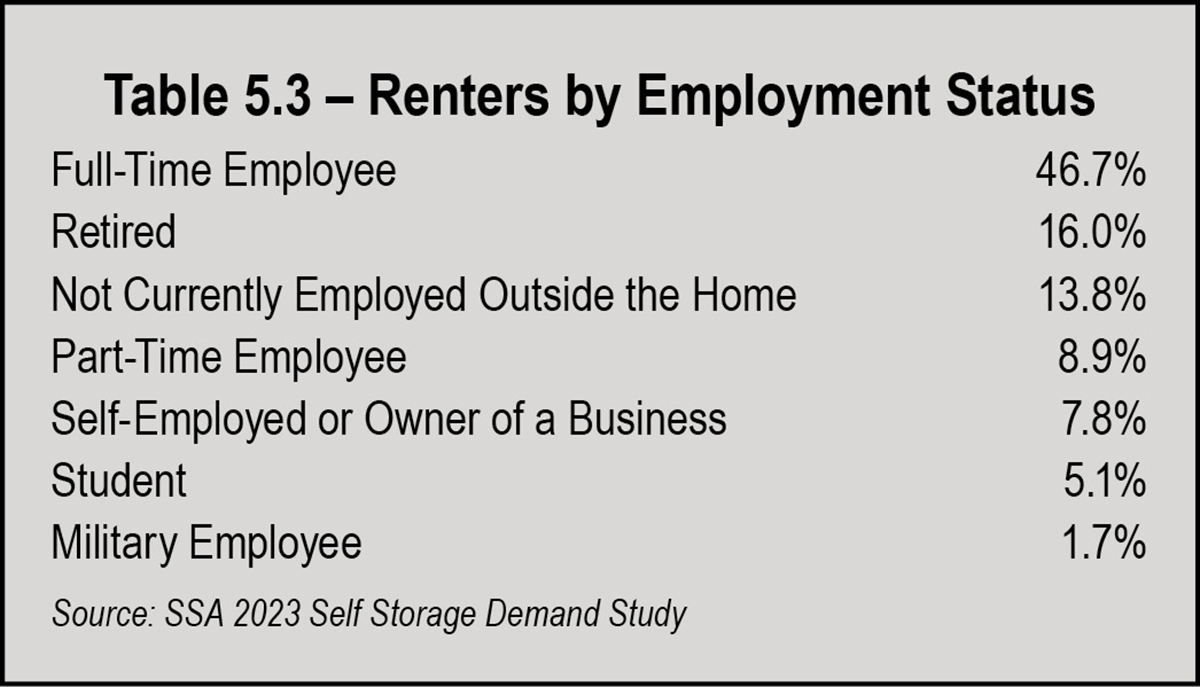
Of course, tenant mix varies by facility. Those near military bases or universities will have higher percentages of military or student renters.

While knowledge of national trends is important, knowing who lives and works within one, three, and five miles of the facility is critical, because storage is a local business. These national trends will shedlight on customers in your market, but using more granular sources to get local data is necessary.
A strong small business community in your market area should provide a greater number of commercial tenants. Commercial tenants are a particularly attractive segment because they pay on time, usually with autopay; they tend to stay longer, increasing the lifetime value of the customer; and they are much less likely to go into foreclosure. Marketing to attract these customers can include strategic alliances, wherein you meet and interact with businesses most likely to store or refer customers. These include realtors who need storage for items used to stage houses for sale; any businesses requiring file storage, though digital storage has caused this market segment to decline; small businesses in need of space store inventory; drug reps who need secure, climate-controlled storage for samples; service providers who need to store equipment, materials, and supplies; package delivery services in need of last-mile storage; etc. Your local chamber of commerce and Better Business Bureau can be good sources of information on businesses in your market area.
Where Renters Live
Renters are most likely to be from the suburbs, although this demographic shrunk from 51.2 percent in 2019 to 48 percent in 2023. Likewise, urban renters decreased from 36.4 percent in 2019 to 34.7 percent. The most significant change was in rural renters, increasing from 12.3 percent to 17.3 percent between 2019 and 2023.
Chart 5.2 – Renter Community Type
Chart 5.3 – Renter by Region
In terms of renters by region, the Sun Belt states still lead the way, representing 42.9 percent of all renters in the U.S. Overall, there is very little change in these statistics over the past four years.
Customer Gender
Data on renters by gender shows an 8 percent shift since 2019: 8 percent fewer renters are female, and 8 percent more renters are male. This trend is more visible among older generations of renters, who show even wider gaps between male and female renters (76 percent of Greatest Generation renters are male and 57 percent of boomers). In addition, data is now being tracked for non-binary renters as well.
Chart 5.4 – Renter by Gender
Generational Trends
Since its inception, self-storage catered to baby boomers. However, generationally speaking, the great shift in renters has occurred, with the boomers now coming in a distant third at only 19.3 percent of all renters. Millennials, once thought to be very unlikely self-storage customers, now comprise the largest demographic at a whopping 38.1 percent. Gen-Z accounts for 13.9 percent of renters. That means, in 2023, on average, over half of renters were 42 or younger.

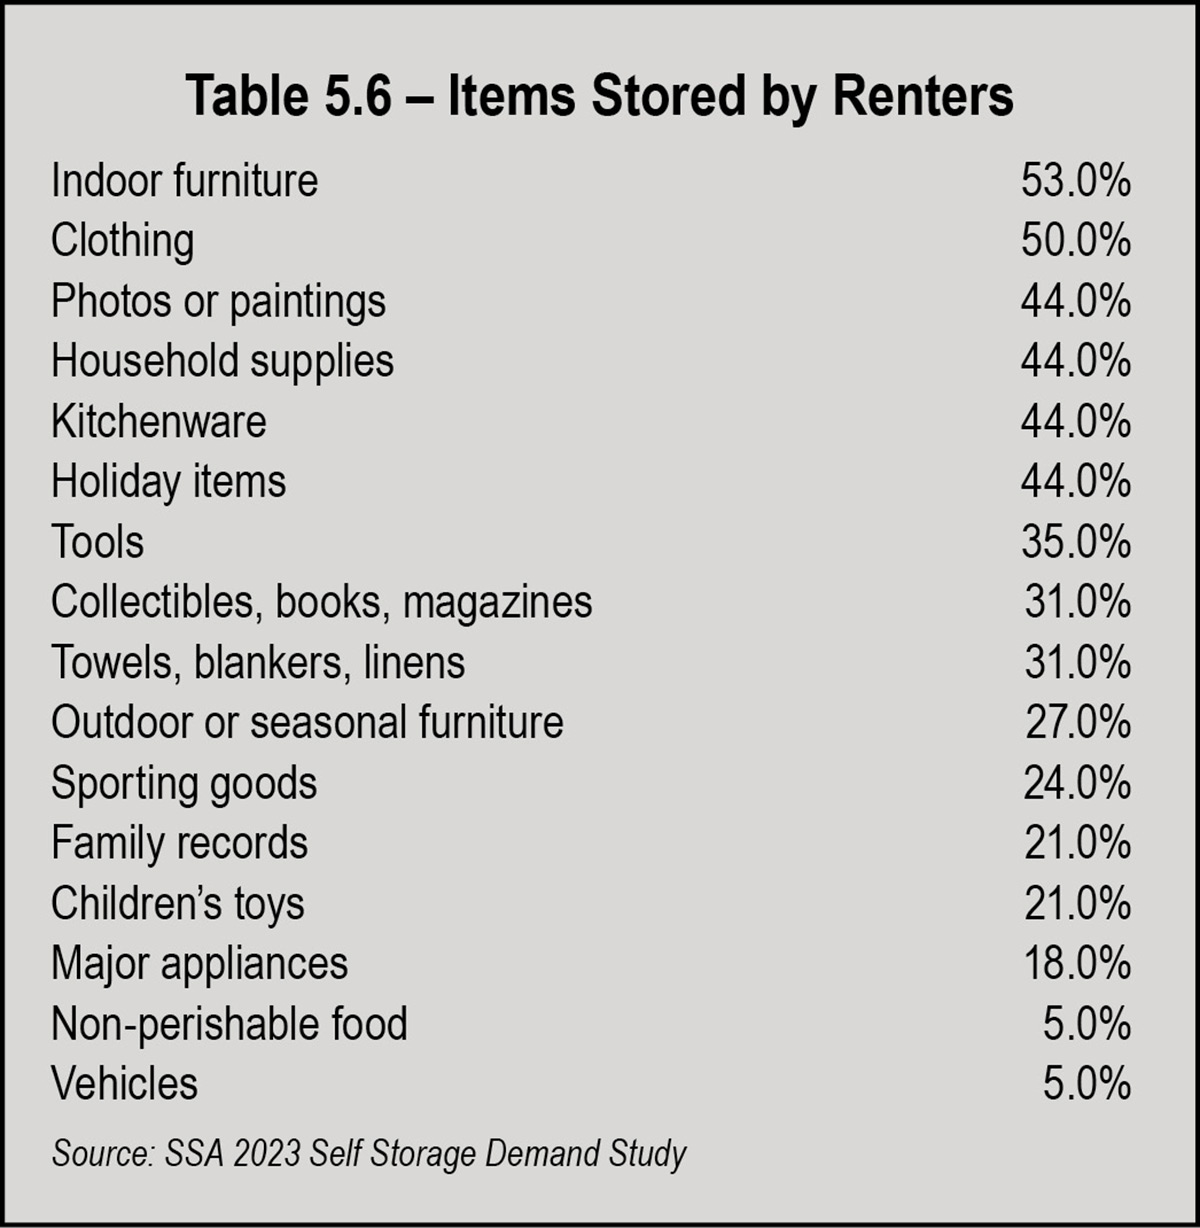
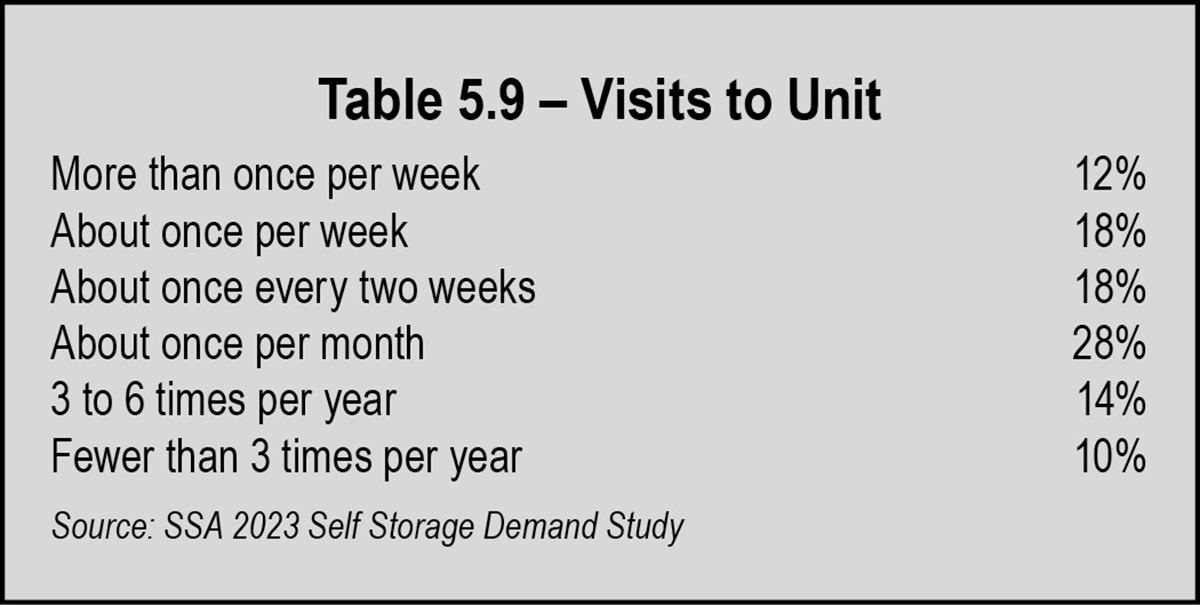
Younger generations use storage differently than older generations. For millennials and Gen-Zs, it is an extension of their home, to accommodate their lifestyle and provide extra space as residences become smaller. Because it’s an extra closet, or a lifestyle extension, these customers go to their storage unit more frequently. Whereas boomers rarely “visited” their boxes of memories from generations gone by and kitchenware, millennials and Gen-Xers pick up and return their kayaks or snowboarding equipment several times a month and/or swap out furniture, clothing, and even children’s toys between residences and storage.

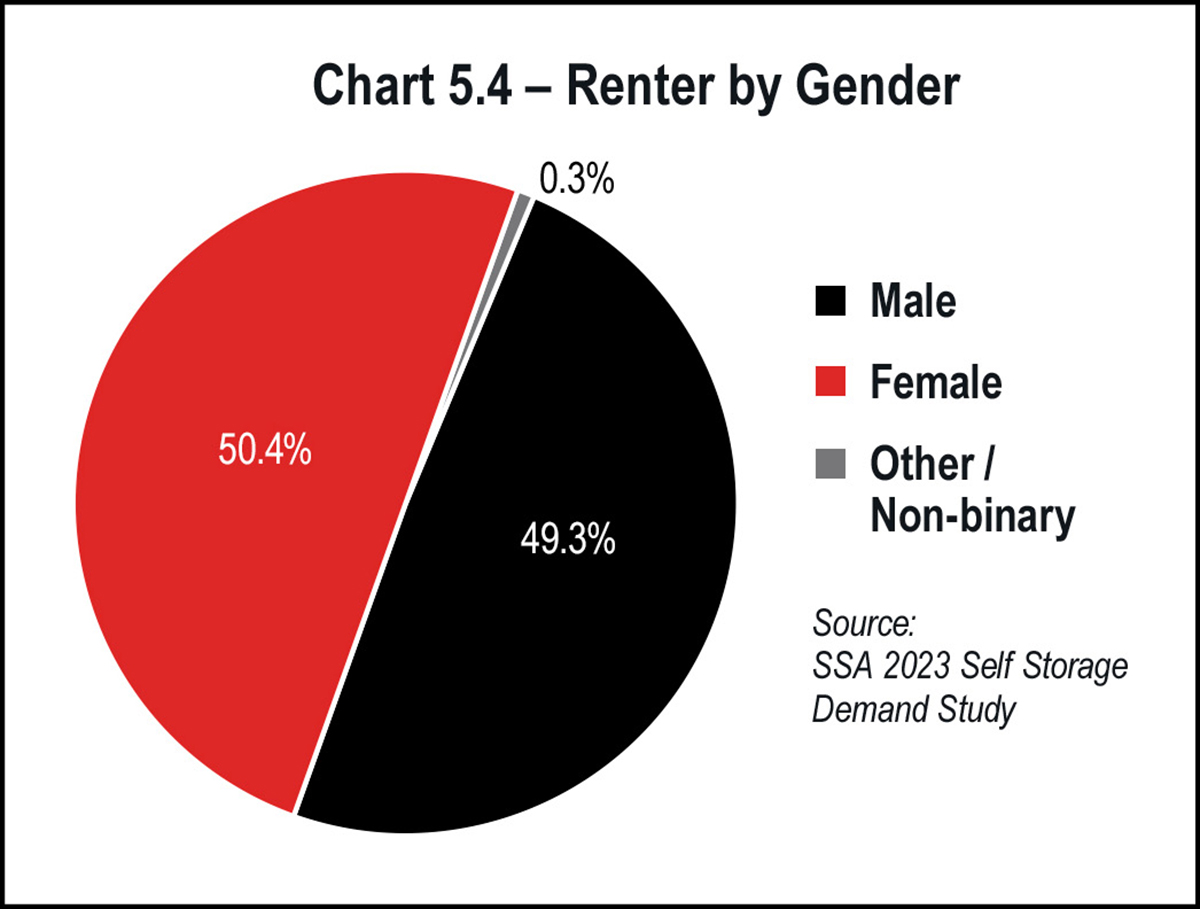
Overall, younger renters are more likely to be:

  • Female
  • Racially diverse, particularly Hispanic
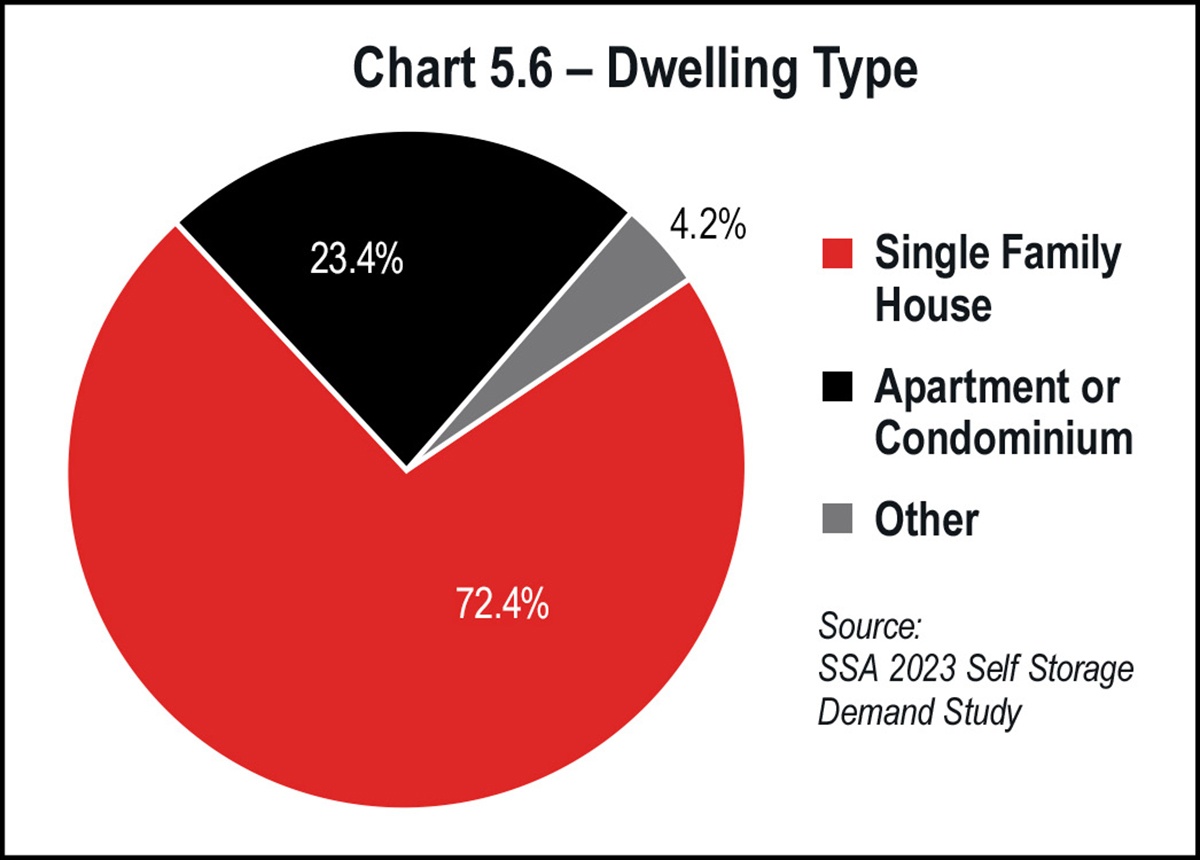
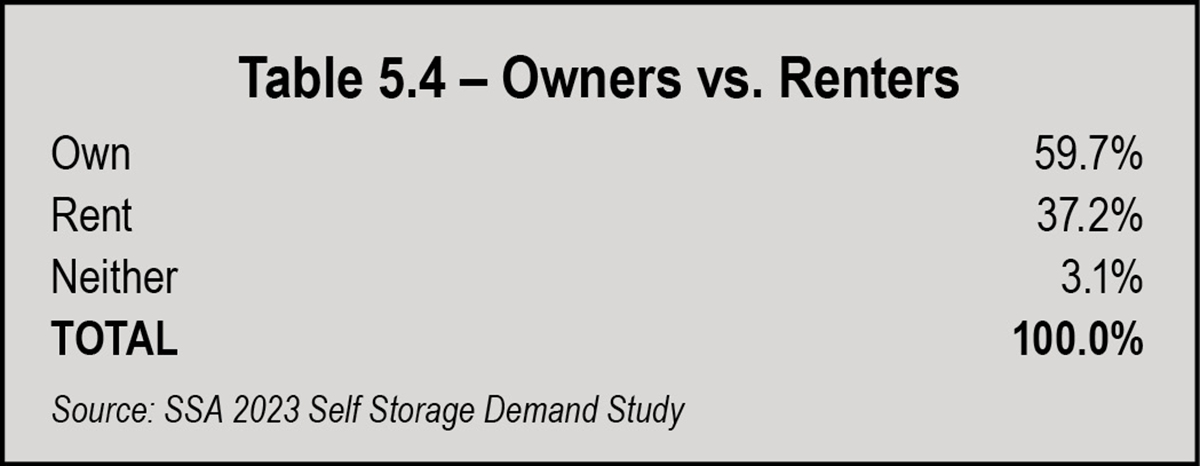
  • Living in rental properties
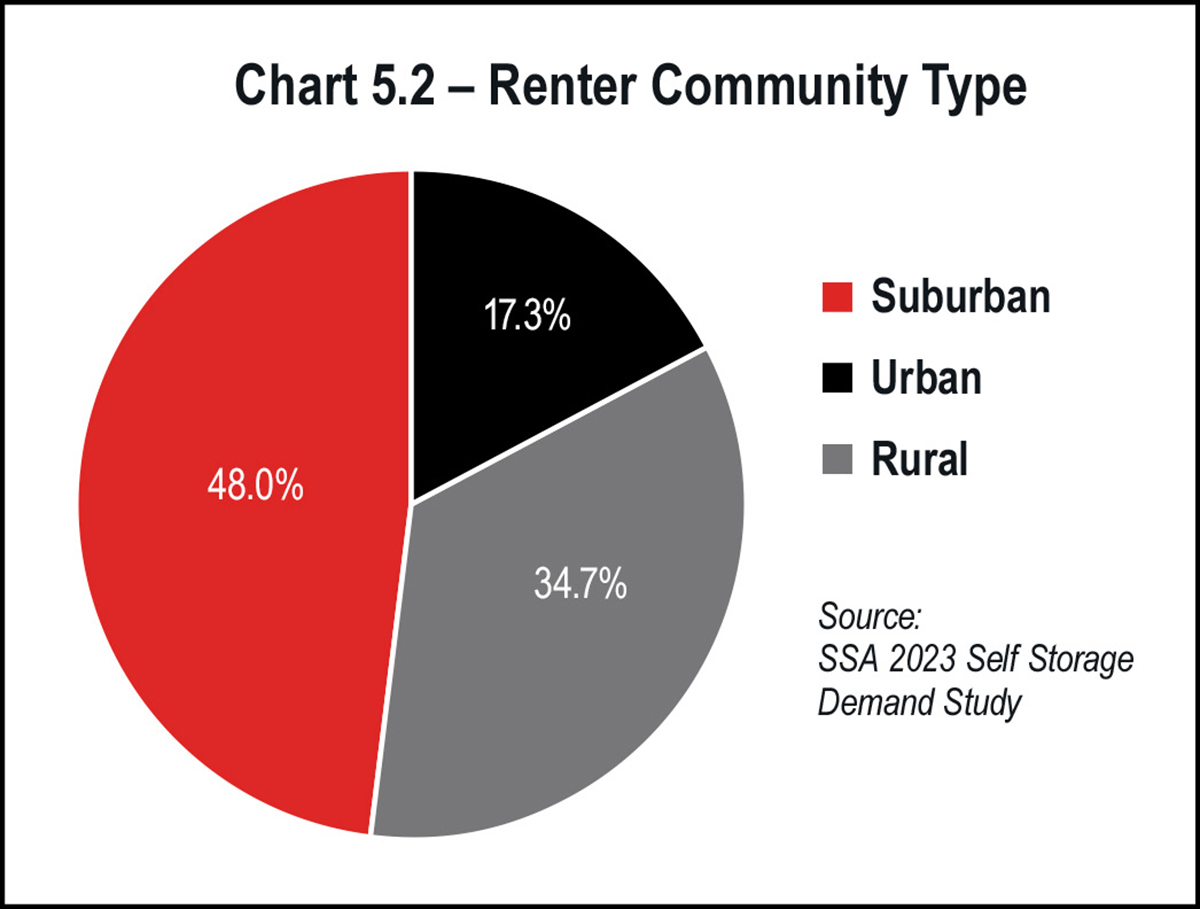
  • Living in urban areas, though more renters overall live in the suburbs

They tend to:

  • Rent smaller units (10-by-10 or smaller) that cost less
  • Buy merchandise such as boxes and packing equipment and rent a truck
  • Be unwilling to travel farther distances to their storage units
  • Be more likely to walk, bike, or take public transit to their units
  • Visit their units more than older generations
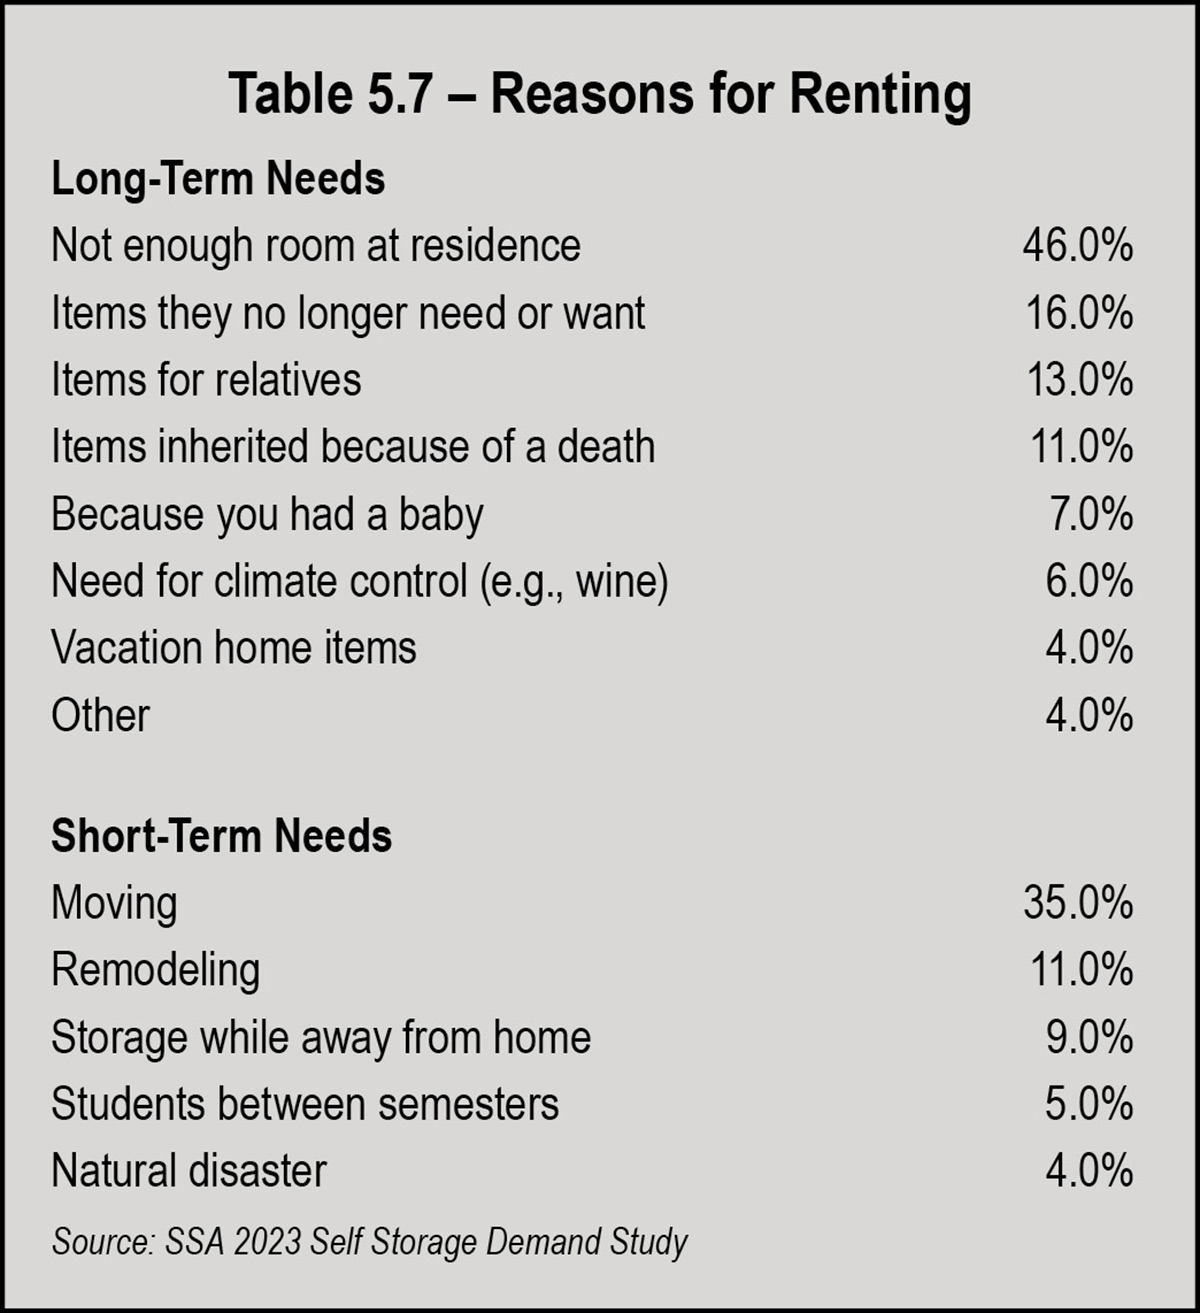
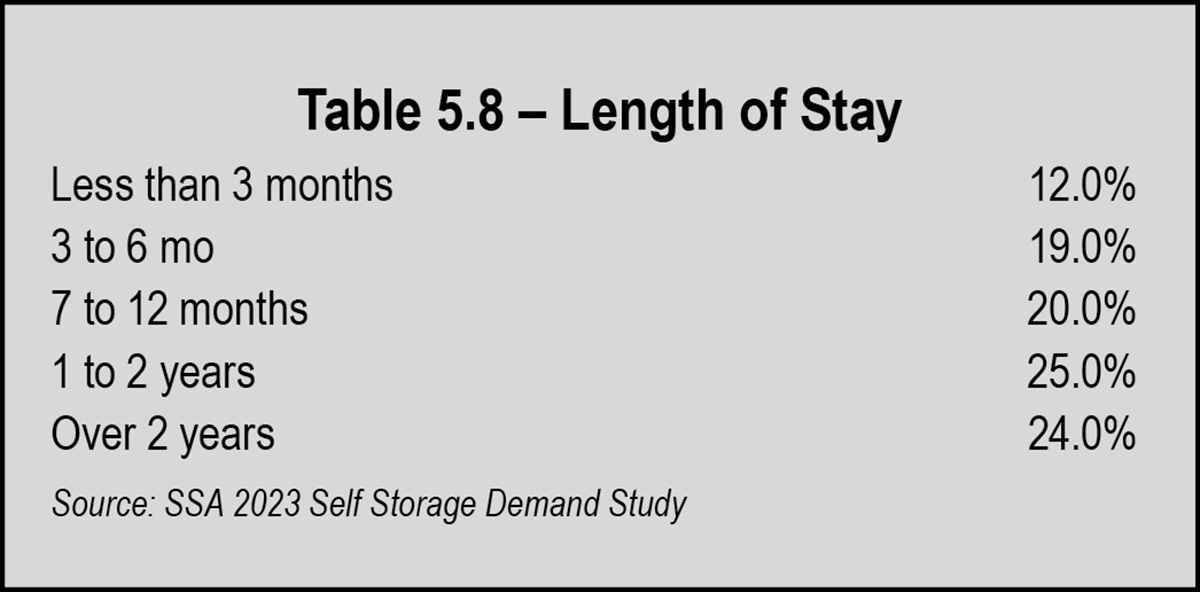
  • Be short-term renters, compared to older generations, but they still account for a significant portion of long-term renters because they store items they don’t have room for at their primary residence
Table 5.1 - Renters by Generation
Younger generations research, find, and rent storage online on their phones. They are least likely to visit a facility before renting. Rather, they rely heavily on facility websites for information, which demonstrates how important it is for self-storage facilities to have an easy-to-navigate online presence. They want more flexibility in contracts, pricing, and means of payment. They value features such as fire sprinklers, temperature and humidity controls, and security more than older generations.

Overall, younger generations tend to be more demanding in terms of the features and amenities they say they want; however, the important caveat is that pricing remains the most significant consideration across all generations. After price, the top five most important features have remained constant since 2020: anytime access to unit, drive-up access, electronic gates at entrance, pest control, and close to residence.

Features and Amenities Customers Want
Another change between 2019 and 2023 is that renters in general are more willing to pay more for features such as anytime access; pest control; overall security, including alarms and fire sprinklers in units and electronic access control.

Across all generations, renters still tend to rent from the first facility the contact, though this trend is softening as the consumer becomes more price sensitive and is therefore willing to shop around.

Automations and conveniences such as automatic and online payment by credit card continue to rise as features desired by renters.

Table 5.2 - Renters by Household Income
Renters By Income
At 21.4 percent, the largest group of renters have a household income in excess of $125,000. In fact, over 47 percent of renters have a household income above the median income in the U.S. ($74,300, according to the most recent data from the U.S. Census Bureau). About 13.7 percent make between $100,000 and $125,000; and just over 12 percent are earning between $75,000 and $100,000.

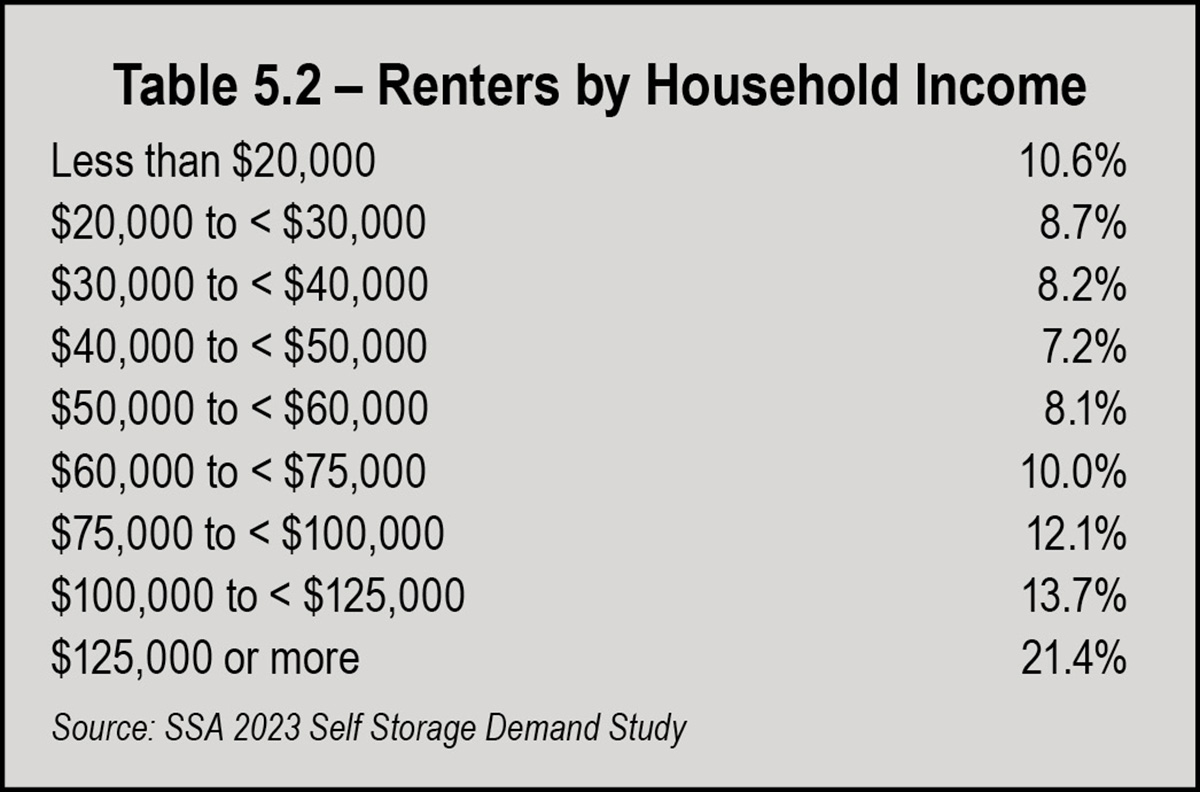
On the other end of the income spectrum, approximately 10.6 percent of renters have household incomes of less than $20,000. This segment falls within the U.S. poverty level (a family of three is $23,030, or $13,590 for an individual, according to the most recent Census data).

Approximately 42 percent of renters fall between the poverty level and the median U.S. income, with household incomes of $20,000 to $75,000. Renters below the median U.S. income will be more sensitive to rate increases.

Table 5.3 - Renters by Employment Status
Renters By Employment Status
More data that is not a surprise: More renters are full-time employees (46.7 percent) than any other category. Most data by employment type was stable over the past four years, but retired renters decreased from 20 percent to 16 percent, although the retirement age population increased. Also, renters not currently employed outside the home increased from 10.7 percent to 13.8 percent. See Table 5.3 below.
Renters By Marital Status
Some change in marital status is evident among self-storage renters. Consistent over time is the leading category of renters: currently married, at almost 52 percent. However, the percentage of never married renters increased from 31 percent to 33 percent, and those previously married decreased from 18 percent to about 15 percent.
Renters By Dwelling Type And Home Ownership
Most of the data in this category is stable, with a vast majority (72.4 percent) of renters living in a single family house. In 2023, 23.4 percent lived in an apartment or condominium, down from 25.7 percent in 2019. Showing the effects of the pandemic, the demographic of renters with “other” dwelling types almost doubled from 2.2 percent in 2019 to 4.2 percent in 2023, likely reflecting those who moved in with parents or children to combine households.
Chart 5.5 – Marital Status
Chart 5.6 – Dwelling Type
Interestingly, renters who own their own homes increased from 55 percent in 2019 to almost 60 percent in 2023. Those who live in rental properties declined from 42.3 percent in 2019 to 37.2 percent in 2023. Similar to the trend mentioned above, renters who neither own nor rent increased from 2.7 percent to 3.1 percent, again likely reflecting households that combined during the pandemic. See Table 5.4 below.
Renters By Education Level
There were no big changes in education level of self-storage renters between 2019 and 2023. Renters with a college degree, at 32.4 percent, represent the largest demographic, while those with no high school diploma represent the smallest at 1.5 percent. See Table 5.5.
Items Stored
More people are storing more things now, as opposed to before the pandemic. The 2023 Self-Storage Demand Study indicates that consumer self-storage penetration continues to rise, reaching a high of 11.13 percent of U.S. consumers in 2022. Data from the study also shows higher rates of storing almost every item, as compared to the 2019 study. More than half of consumer renters store clothing and indoor furniture, which both increased 10 percent over the past four years. Renters are storing more items than ever before.
Table 5.4 – Owners vs. Renters
Table 5.5 – 2023 Renters by Level of Education
Reasons for Renting Units
Consumers rent self-storage space for both long-term and short-term needs. The most significant reason for long-term storage is that renters don’t have enough room in their homes for their belongings. This accounts for 46 percent of long-term rentals. Surprisingly, 16 percent of renters store items they no longer want or need, yet they feel the need to store them. Another 13 percent store items for relatives and 11 percent store items inherited because of a death.
Table 5.6 – Items Stored by Renters
Table 5.7 – Reasons for Renting
Among short-term needs, moving and remodeling lead the way, accounting for 35 percent and 11 percent respectively.
Length Of Stay
Length of stay did not change significantly over the past four years. About 25 percent of renters stay one to two years, and 24 percent stay over two years. Statistically, renters stay longer than they intend.
Table 5.8 – Length of Stay
Table 5.9 – Visits to Unit
Frequency Of Visits To Units
About 28 percent of renters visit their units once a month. Prior to the pandemic, the number of renters visiting their units more than once a week climbed to 17 percent, but it is back down to 12 percent in the 2023 data. Younger generations, millennials and Gen-Z, tend to visit their units more frequently than older generations.