ength of stay by customer type and region; type, size, and number of units rented; and the journey customers take to find and rent from you are relevant factors in operating your self-storage business. Understanding these dynamics informs operational decisions such as marketing, staffing, and use of technology and services.
Length of stay for businesses renting space is significantly longer than other types of renters. As Chart 9.2 shows, 47.5 percent of businesses stay longer than two years, vs. 24 percent of all renters. The longer a renter stays, the fewer new renters you have to acquire, so your overall cost of acquisition goes down. Combine that with the facts that business customers are more likely to pay on time, on autopay, and not enter into foreclosure, and it is easy to see why this market segment is very attractive to self-storage operators.
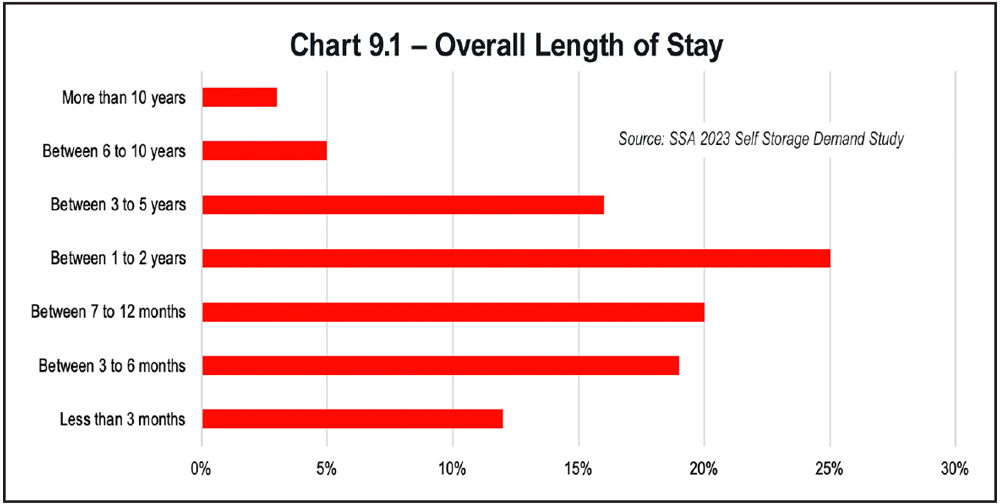
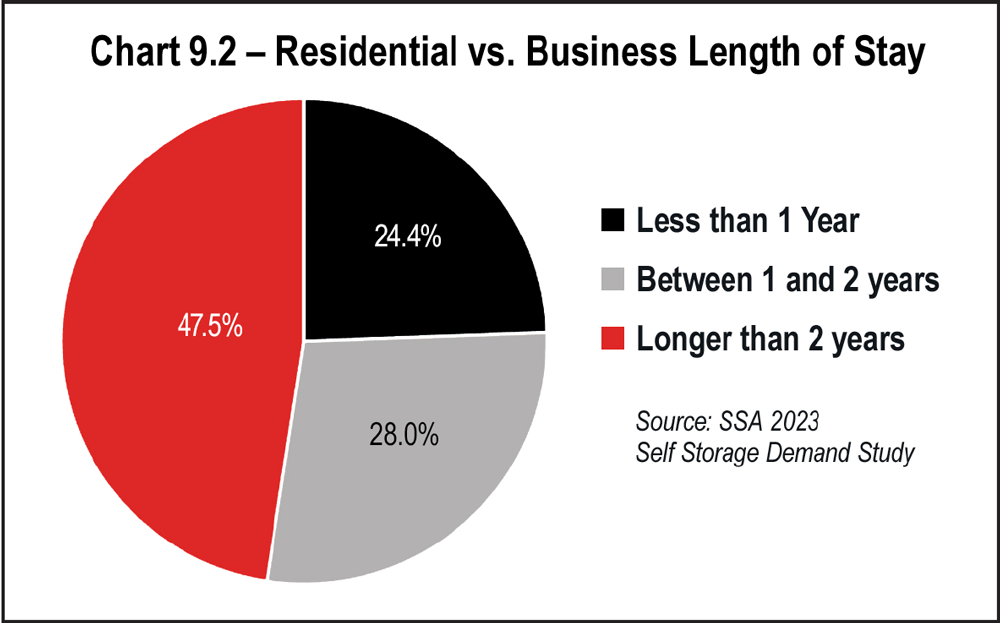
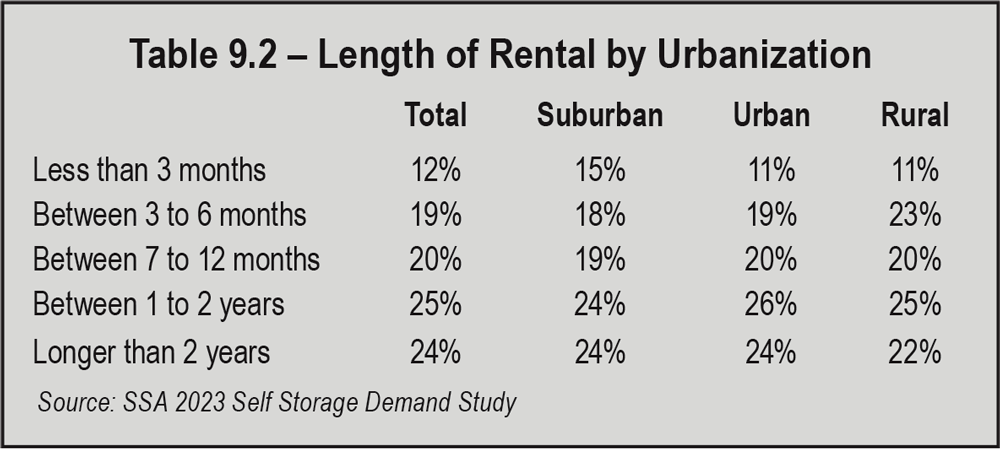
Table 9.2 evaluates length of stay by urbanization. Urban, suburban, and rural markets all mirror the national statistics, although slightly more urban renters (15 percent) stay for less than three months, as compared to the national average of 12 percent.
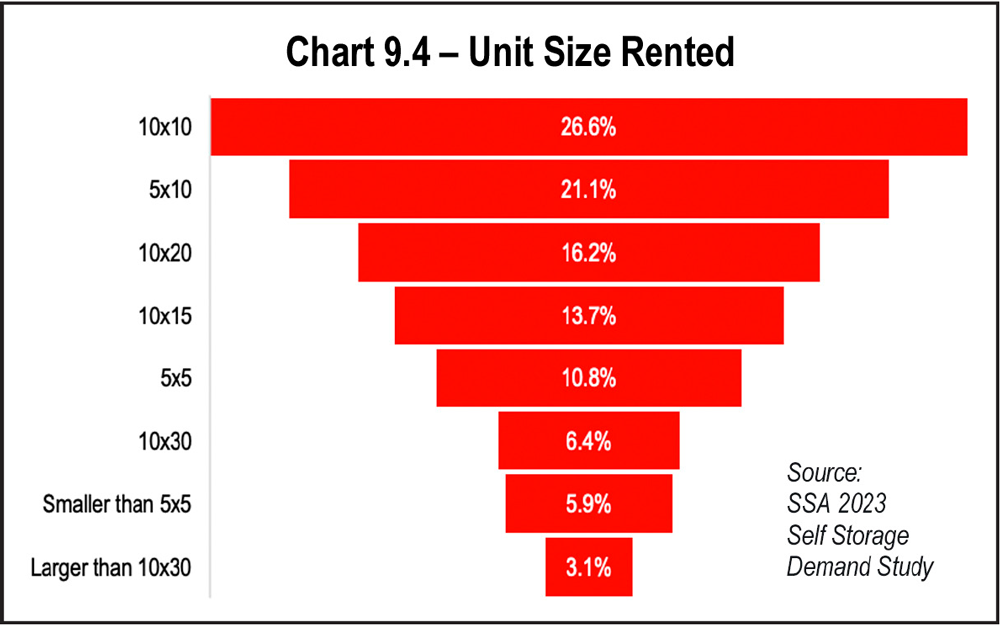
Like the SSA’s 2019 Self Storage Demand Study, the 2023 Demand Study shows that the most popular unit size was still 10-by-10; the next most popular size is 5-by-10. However, more recently, both data and operators indicate that larger unit sizes are in greater demand. This trend is visible as you go further down the list of sizes. In 2023, third and fourth place go to larger units (10-by-20s and 10-by-15s). By comparison, 5-by-5 was the third most popular in 2019. See Chart 9.4.
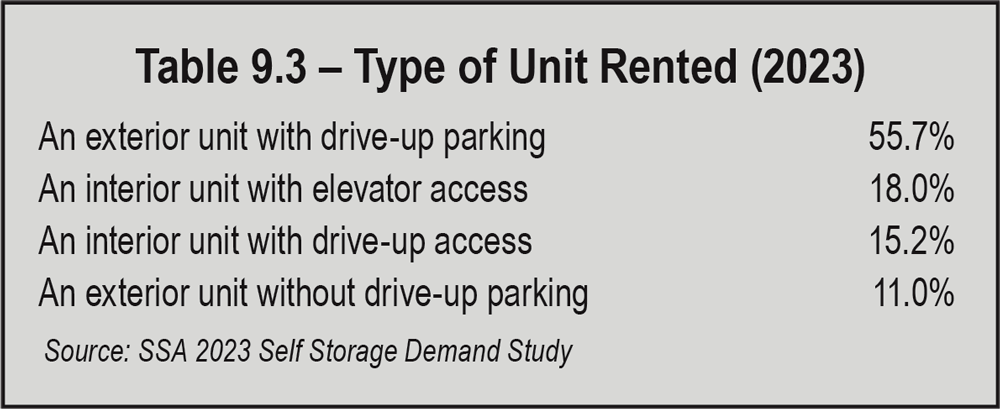
The number of different unit types have expanded over time. In the early days of self-storage, virtually all spaces were exterior, drive-up units. As the asset class matured, the consumer was provided more options. Many new, Class-A facilities are multistory buildings with climate-control space.
The most popular unit type is constant over time: exterior units with drive-up access, accounting for 55.7 percent of rentals. There are not significant changes in unit type rented when comparing pre-pandemic to post-pandemic data.
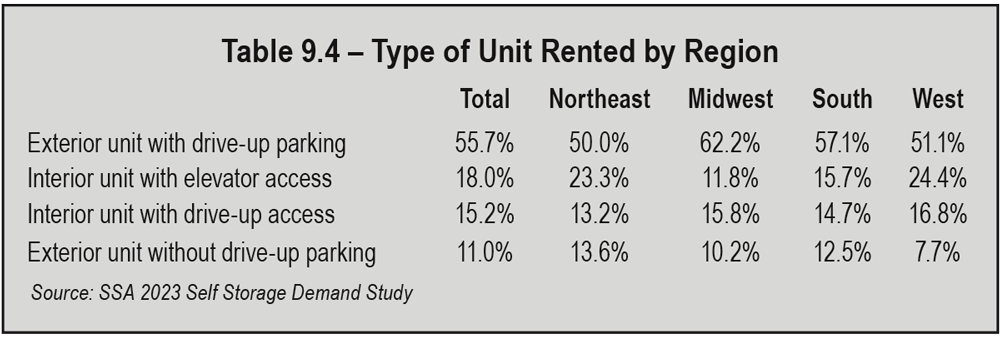
Breaking down rentals by region, while exterior units with drive-up parking are the most popular in every region, interior units with elevator access are more popular in the West than other regions. Overall, there is more interior space rented in the West than in any other region. In fact, the West has the most interior space and the least exterior space rented than any other region, while the Midwest is the opposite, with the least amount of interior space and the most amount of exterior space rented.
As more new supply is added to the market, much of which will be multistory, interior access, climate-control space, interior units are likely to account for a greater percentage of rentals.
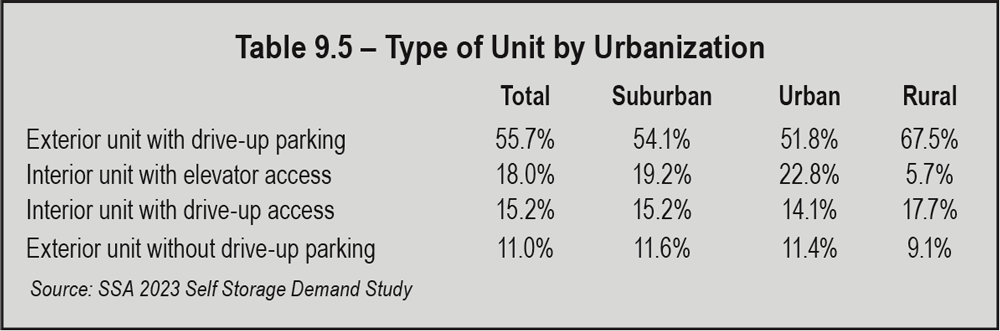
Comparing type of unit rented by urbanization, exterior space rented exceeds interior space across the board in urban, suburban, and rural areas. Urban areas have the most interior space and the least exterior space rented, and rural areas are the opposite.
Self-storage has two fundamental characteristics that are worth considering. First, it is a commodity. Self-storage is not something people shop for “for fun.” They find it when the need it. Being top of mind when people need space is your challenge.
A second important facet of the self-storage business is that is, at its core, real estate. It’s real estate with a transactional business operating on it. That’s a mix that makes the asset particularly valuable as a cash producing, appreciating asset with a book of business.
In real estate, everyone knows what the three most important factors are: location, location, location. That holds true for self-storage because drive-bys are the No. 1 source of rentals. People see your self-storage facility while driving to or from work or home.
This underscores the importance of having a location with a high traffic count. The greater the number of cars driving by every day, the more visibility you have, and the more you are on the mind of the prospect when they develop a need for space. Remember, self-storage is a commodity. People “discover” your facility when they need storage, even if they have driven by your store hundreds of times.
The newest data on how renters find self-storage facilities reveals something interesting: the second most likely way to be found by prospective renters is now online search (Google, Bing, other search engines). Throughout the history of the industry, word-of-mouth referrals has been second to drive-bys as a source of leads. Referrals have now been overtaken by online searches. See Chart 9.5.
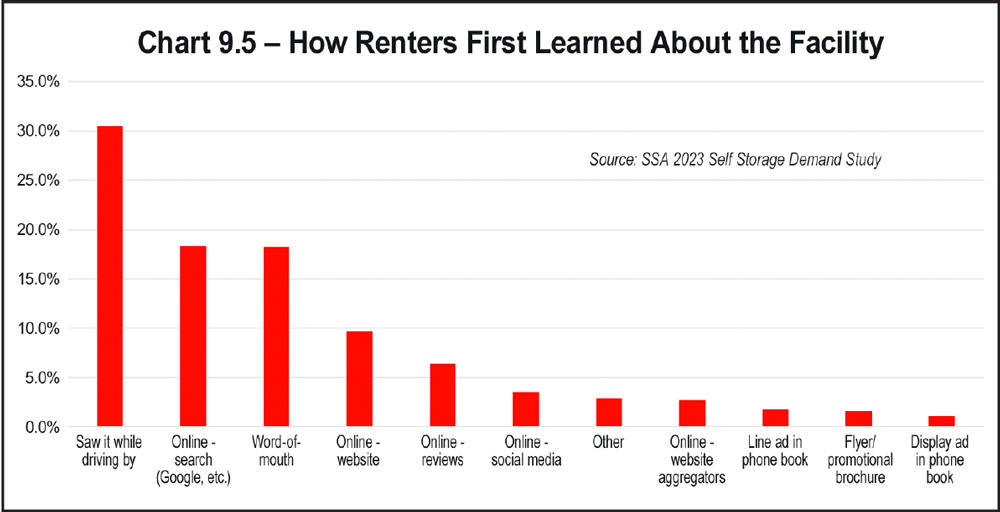
- “Saw it while driving by” refers to the consumers’ most common routes: driving to and from work and home.
- “Word-of-mouth” means referrals from family, friends, and co-workers.
- “Online – search” connotates the use of search engines: Google, Bing, and others.
- “Online – website” refers to your facility’s website or a related website, but not an aggregator like SpareFoot, which is the next category.
- “Online – website aggregators” refers to sites that pull together multiple sources of rental information.
- “Online – social media” is Facebook, Pinterest, YouTube, etc.
And as you can see, there are still two categories for the phone book, which refer to display ads and simple listings, or line ads. Believe it or not, in some markets, the Yellow Pages and mailers are still successful marketing tactics.
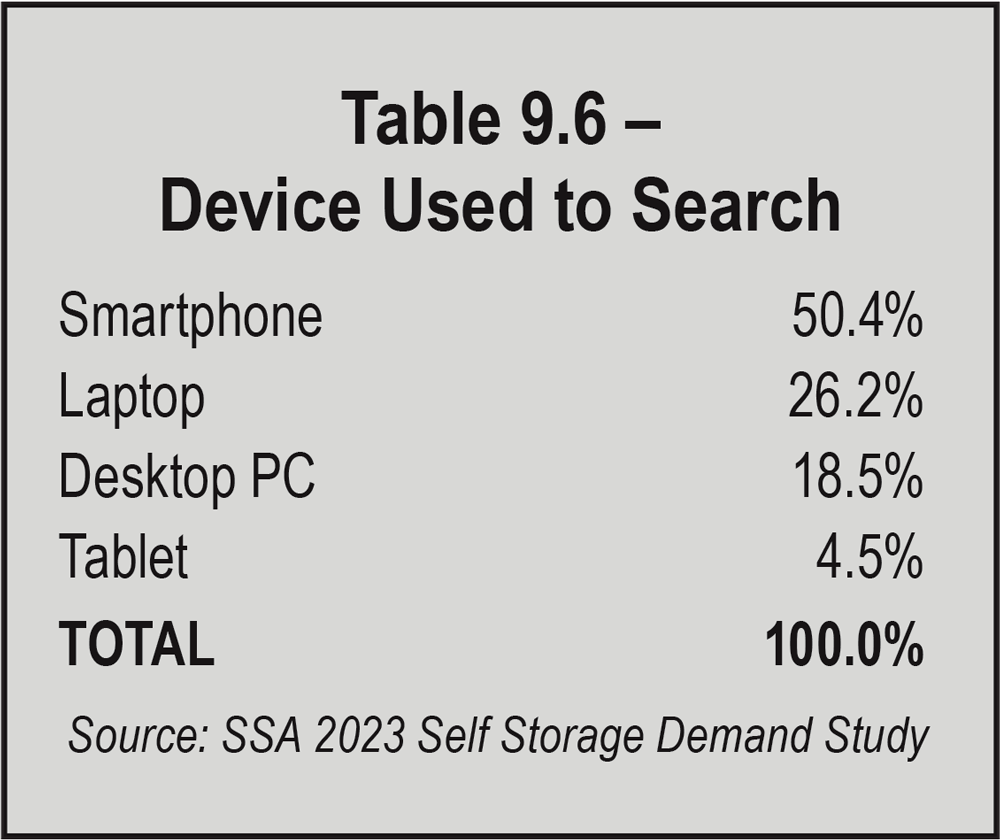
When they search online, over half of renters do so on their smartphones, especially Gen-Zs, millennials, and Gen-Xs. Laptops and desktops come in at 26 percent and 19 percent, and these searchers are more likely to be boomers. See Table 9.6.
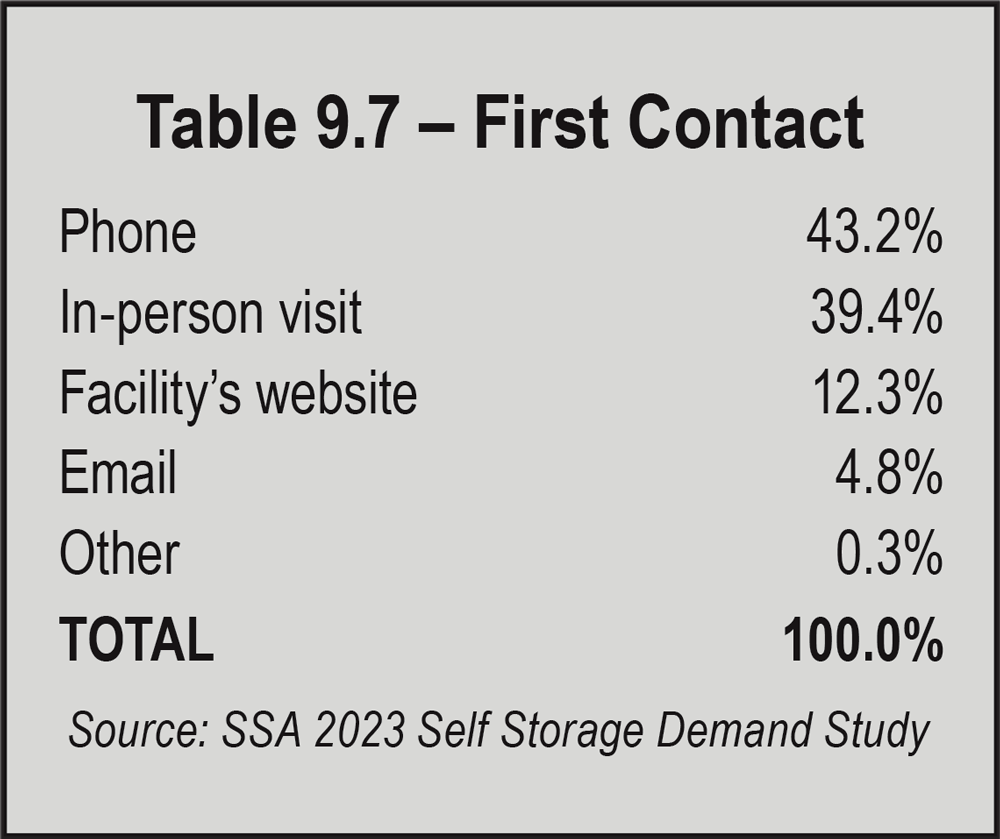
Now the consumer contacts you. How they reach out to you tells you a lot about how to run your facility. Even today, when fewer and fewer people actually want to talk to you, the phone is still the most popular channel of communication. As Table 9.7 shows, a phone call is the leading way consumers contact a facility. This holds true for all generations, even Gen-Z.
A fun fact about first contact: Prior to the 2023 Self Storage Demand Study, in-person visits were the No. 1 form of first contact. Falling four percentage points, it is now No. 2.
What do consumers want to know when they contact you? Price comes first, followed by unit size and availability. Clearly, you have an advantage if your website shows this information prominently. The team answering your phone needs to master this information, as well as being skilled at phone sales. See Table 9.9.
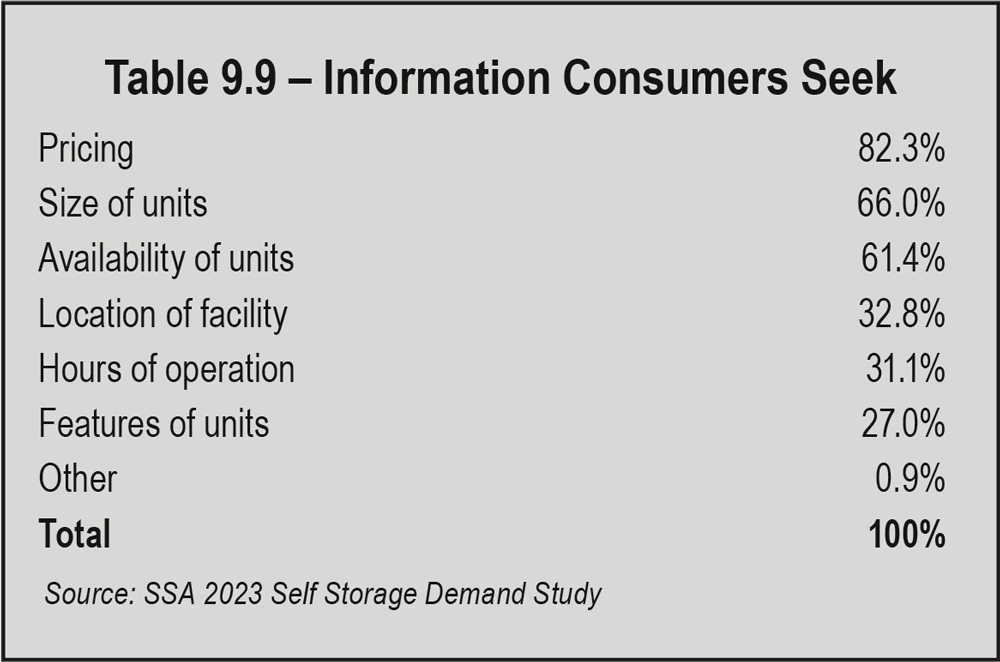
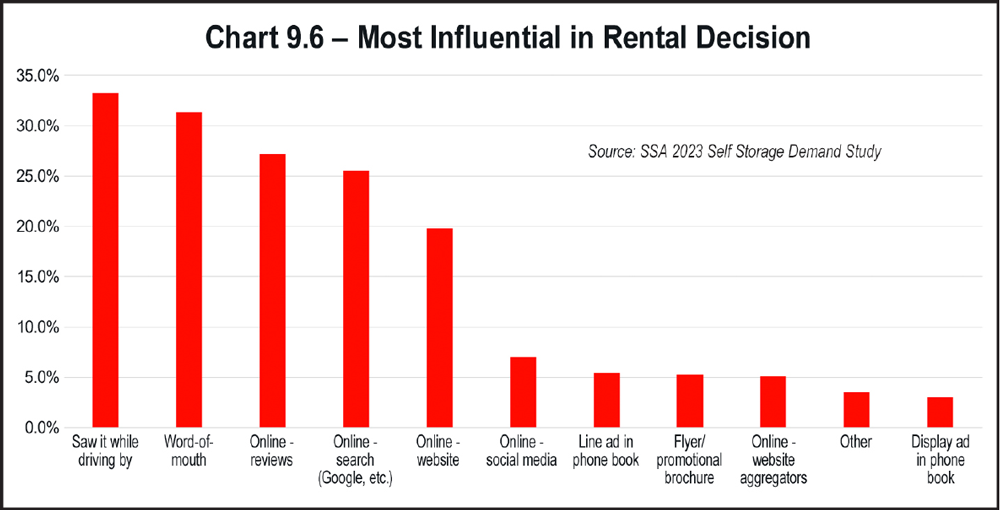
Of course, features and amenities are very important, and we’ll discuss that shortly. But first, we will focus on promotional efforts, advertising, and circle back around to your location. Of these factors, which are the most influential in the rental decision?
According to the 2023 Self Storage Demand Study and all the previous studies, driving by the facility has the greatest influence on a consumer’s decision to rent space. This emphasizes once again the age-old adage in real estate: It’s all about location. Being conveniently located and visible to drive-by traffic are critical to the success of your business. People rent space because they see the self-storage facility while driving to or from home or work.
Chart 9.6 answers the question, “What are the most influential factors in a consumer’s rental decision?” First place goes to location, as we just discussed. Second place goes to word-of-mouth, and third place goes to online reviews.
But remember, if you ask, “How did the renter first learn about your facility,” first place again goes to location, but second place goes to online search, and word-of-mouth comes in third, as shown previously in Chart 9.5. All this information is important to understand how people find you and how they decide you are the best place to rent.
If you are buying an existing facility, understanding consumer expectations will help you bring your new acquisition up to consumer standards with a capital expenditure (CapEx) project as soon as you close the transaction. Doing all CapEx improvements up front means putting them in your financial package (including your proforma and your loan) and doing the projects as soon as you close, so you can immediately add value to your new asset and raise rates.
If you already own the asset, you can still add new features consumers desire in a CapEx project, adding value to your asset. CapEx projects should already be included in your facility budget over time. Falling behind consumer expectations will cause your rental rates to decline beyond market pressures as facilities in your vicinity modernize and offer valued features and amenities you do not have. Keeping up with the Joneses is a time-tested business strategy when it comes to meeting consumer expectations.
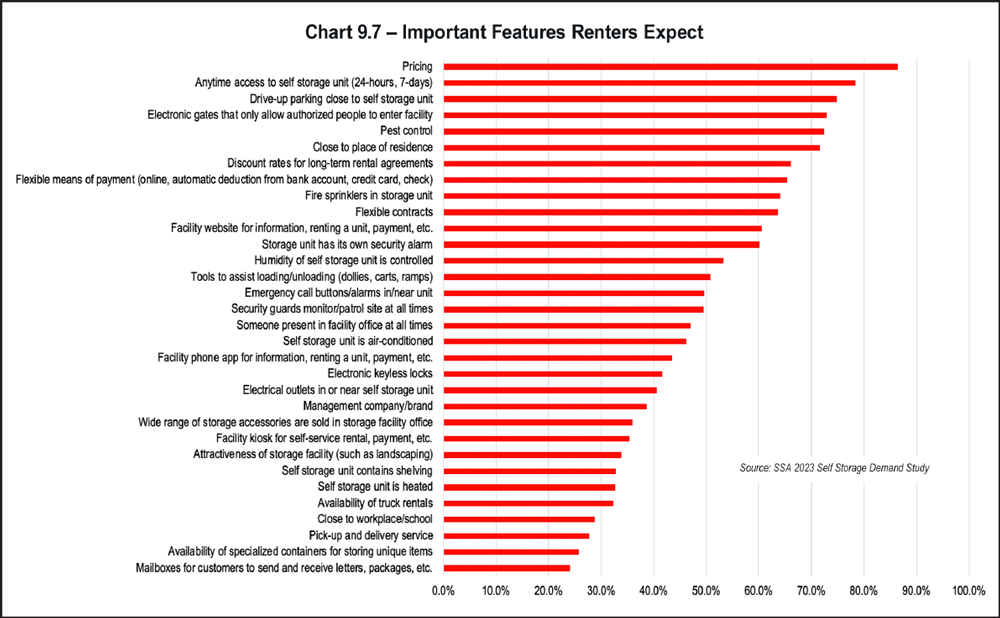
In terms of features expected, price is at the top of this list. Price has been and remains the most important decision-making factor for self-storage renters. Next in consumer expectations are anytime access, drive-up access, electronic gates, pest control, and proximity to residence.
Chart 9.7 tells you what consumers expect, but let’s take a different perspective on this list. What are renters willing to pay extra for? That is shown in Chart 9.8.
The features high on this list are opportunities for you to up-charge, adding revenue to your bottom line, like the way airlines charge more to board early and check baggage. With the introduction of dynamic pricing to the self-storage industry, operators are able to differentiate price based on which features are in greatest demand. Units close to the elevator are more popular than ones that are a long walk away. Some renters prefer not to use the elevator at all. Hence, good-better-best pricing means units close to the elevator and on the first floor garner higher rent.
Differentiated pricing adds revenue to your business without additional cost of customer acquisition. The features high on the list in Chart 9.8 are worth considering. Determining the feasibility of each one for your facility and calculating the return on investment (ROI) can be used to determine your next CapEx project, as well as where to beef up your operating expenditures (OpEx).
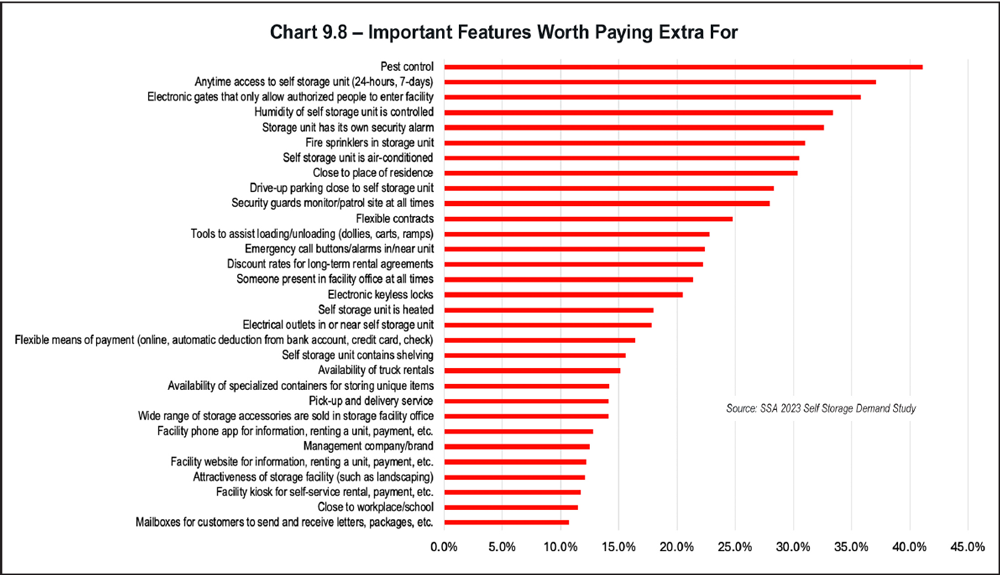
Second on consumers’ list of what they are willing to pay extra for is anytime access. That means they will pay a fee to access their unit before or after regular access hours, up to 24 hours a day, 7 days a week. This is a fee that can be added to rent every month, without generating additional cost. You can even have a graduated fee schedule that goes up as access hours and days increase. Bakers need to access their trucks at 5:00 a.m. Builders need access to equipment by 6:00 a.m. Residential renters who don’t want to plan visits to their unit to bring and retrieve stored items want access at any hour of the day or night. All of these levels of access can have a different fee.
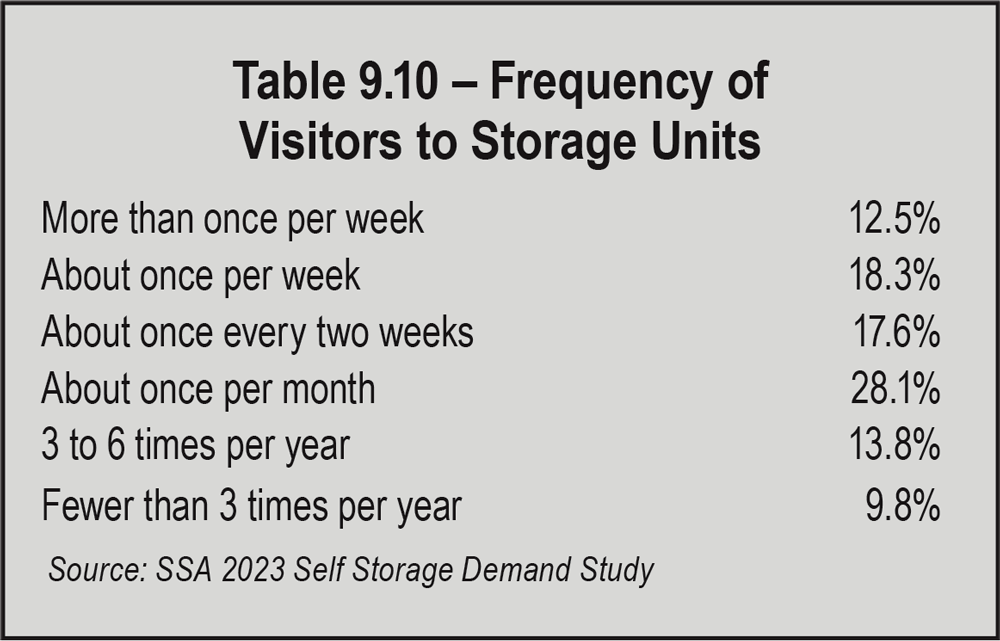
How often renters visit their units is another factor that underscores the value of being close to where your customers live. The most common number of storage unit visits is once a month, followed by every two weeks. Notably, the number of renters visiting their units more than once a week decreased 5 percent between the pre- and post-pandemic demand studies. Currently, about 12.5 percent of renters visit their units more than once a week, and they are most likely to be in the younger generations. See Table 9.10.
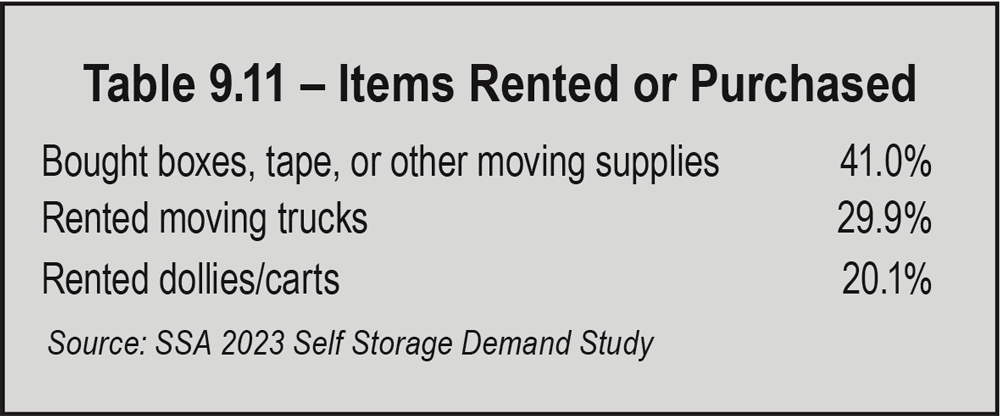
In Table 9.11, note that renting moving trucks comes with payroll costs. If you are in lease-up and have on-site staff, the ancillary income generated could be sufficient to cover payroll, but this calculation must be done carefully to be sure it is a profitable option for your business.
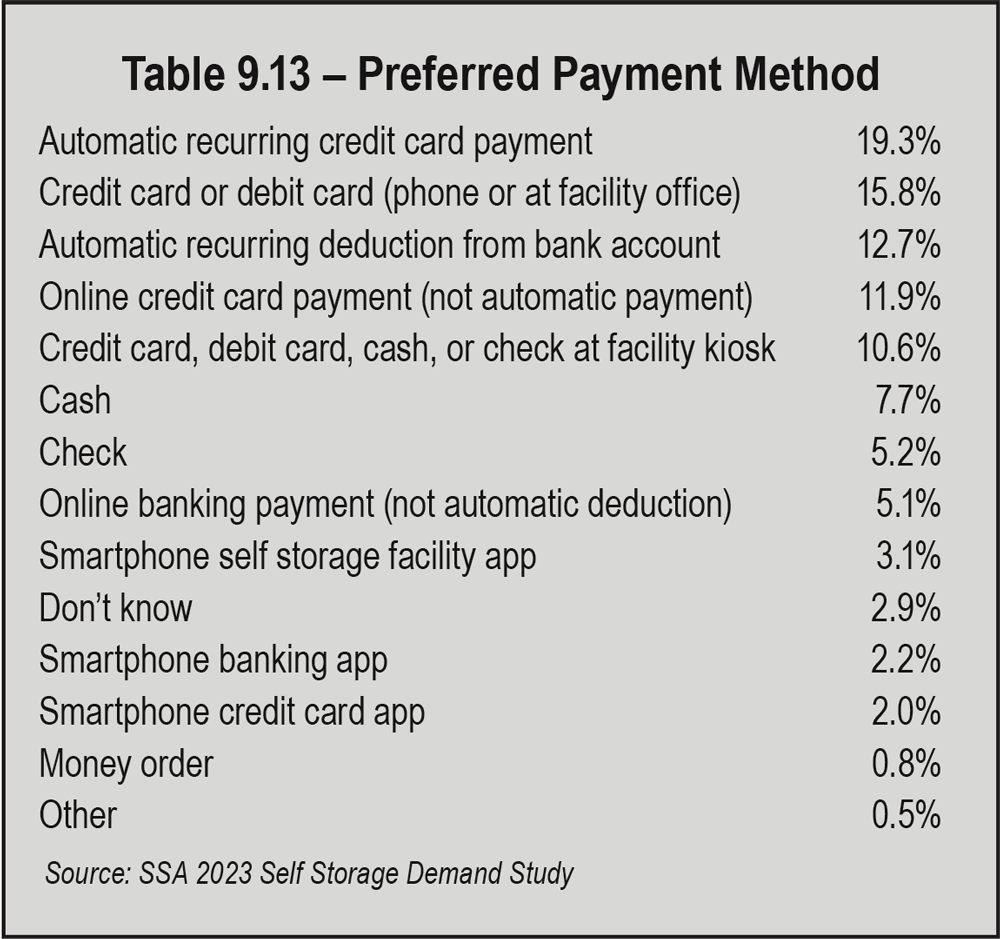
How does your customer want to pay? The preferred method of payment is automatic payment with credit card, followed by consumers who prefer to call or visit every month to pay with a credit or debit card.
Automatic deduction from bank account rose six percent since 2020, showing the largest growth. Autopayment makes renters’ lives easier, and autopayment directly from a bank account is the least costly method.
Shown in Table 9.13, renters want flexibility in payment type, especially true for Gen-X or millennials. All of these options are valuable choices to offer your renters because they make it easier to collect monies due.
When it comes to site information, there is a plethora of detail. Mastering the details of the customer journey and consumer demand will improve your operational decisions from marketing to staffing, including selection of technology and services. All of this adds to your bottom line, helping you serve up what your customers want at prices they are willing to pay.