he year 2023 began with economic uncertainty and widespread concerns that a recession was looming. Then, in the spring, the failure of three high-profile regional banks caused further apprehension within an already skittish banking industry as well as within the public. By the last quarter, however, anxiety over rising interest rates and mounting inflation was soothed with better-than-expected indicators of an economy on the mend.
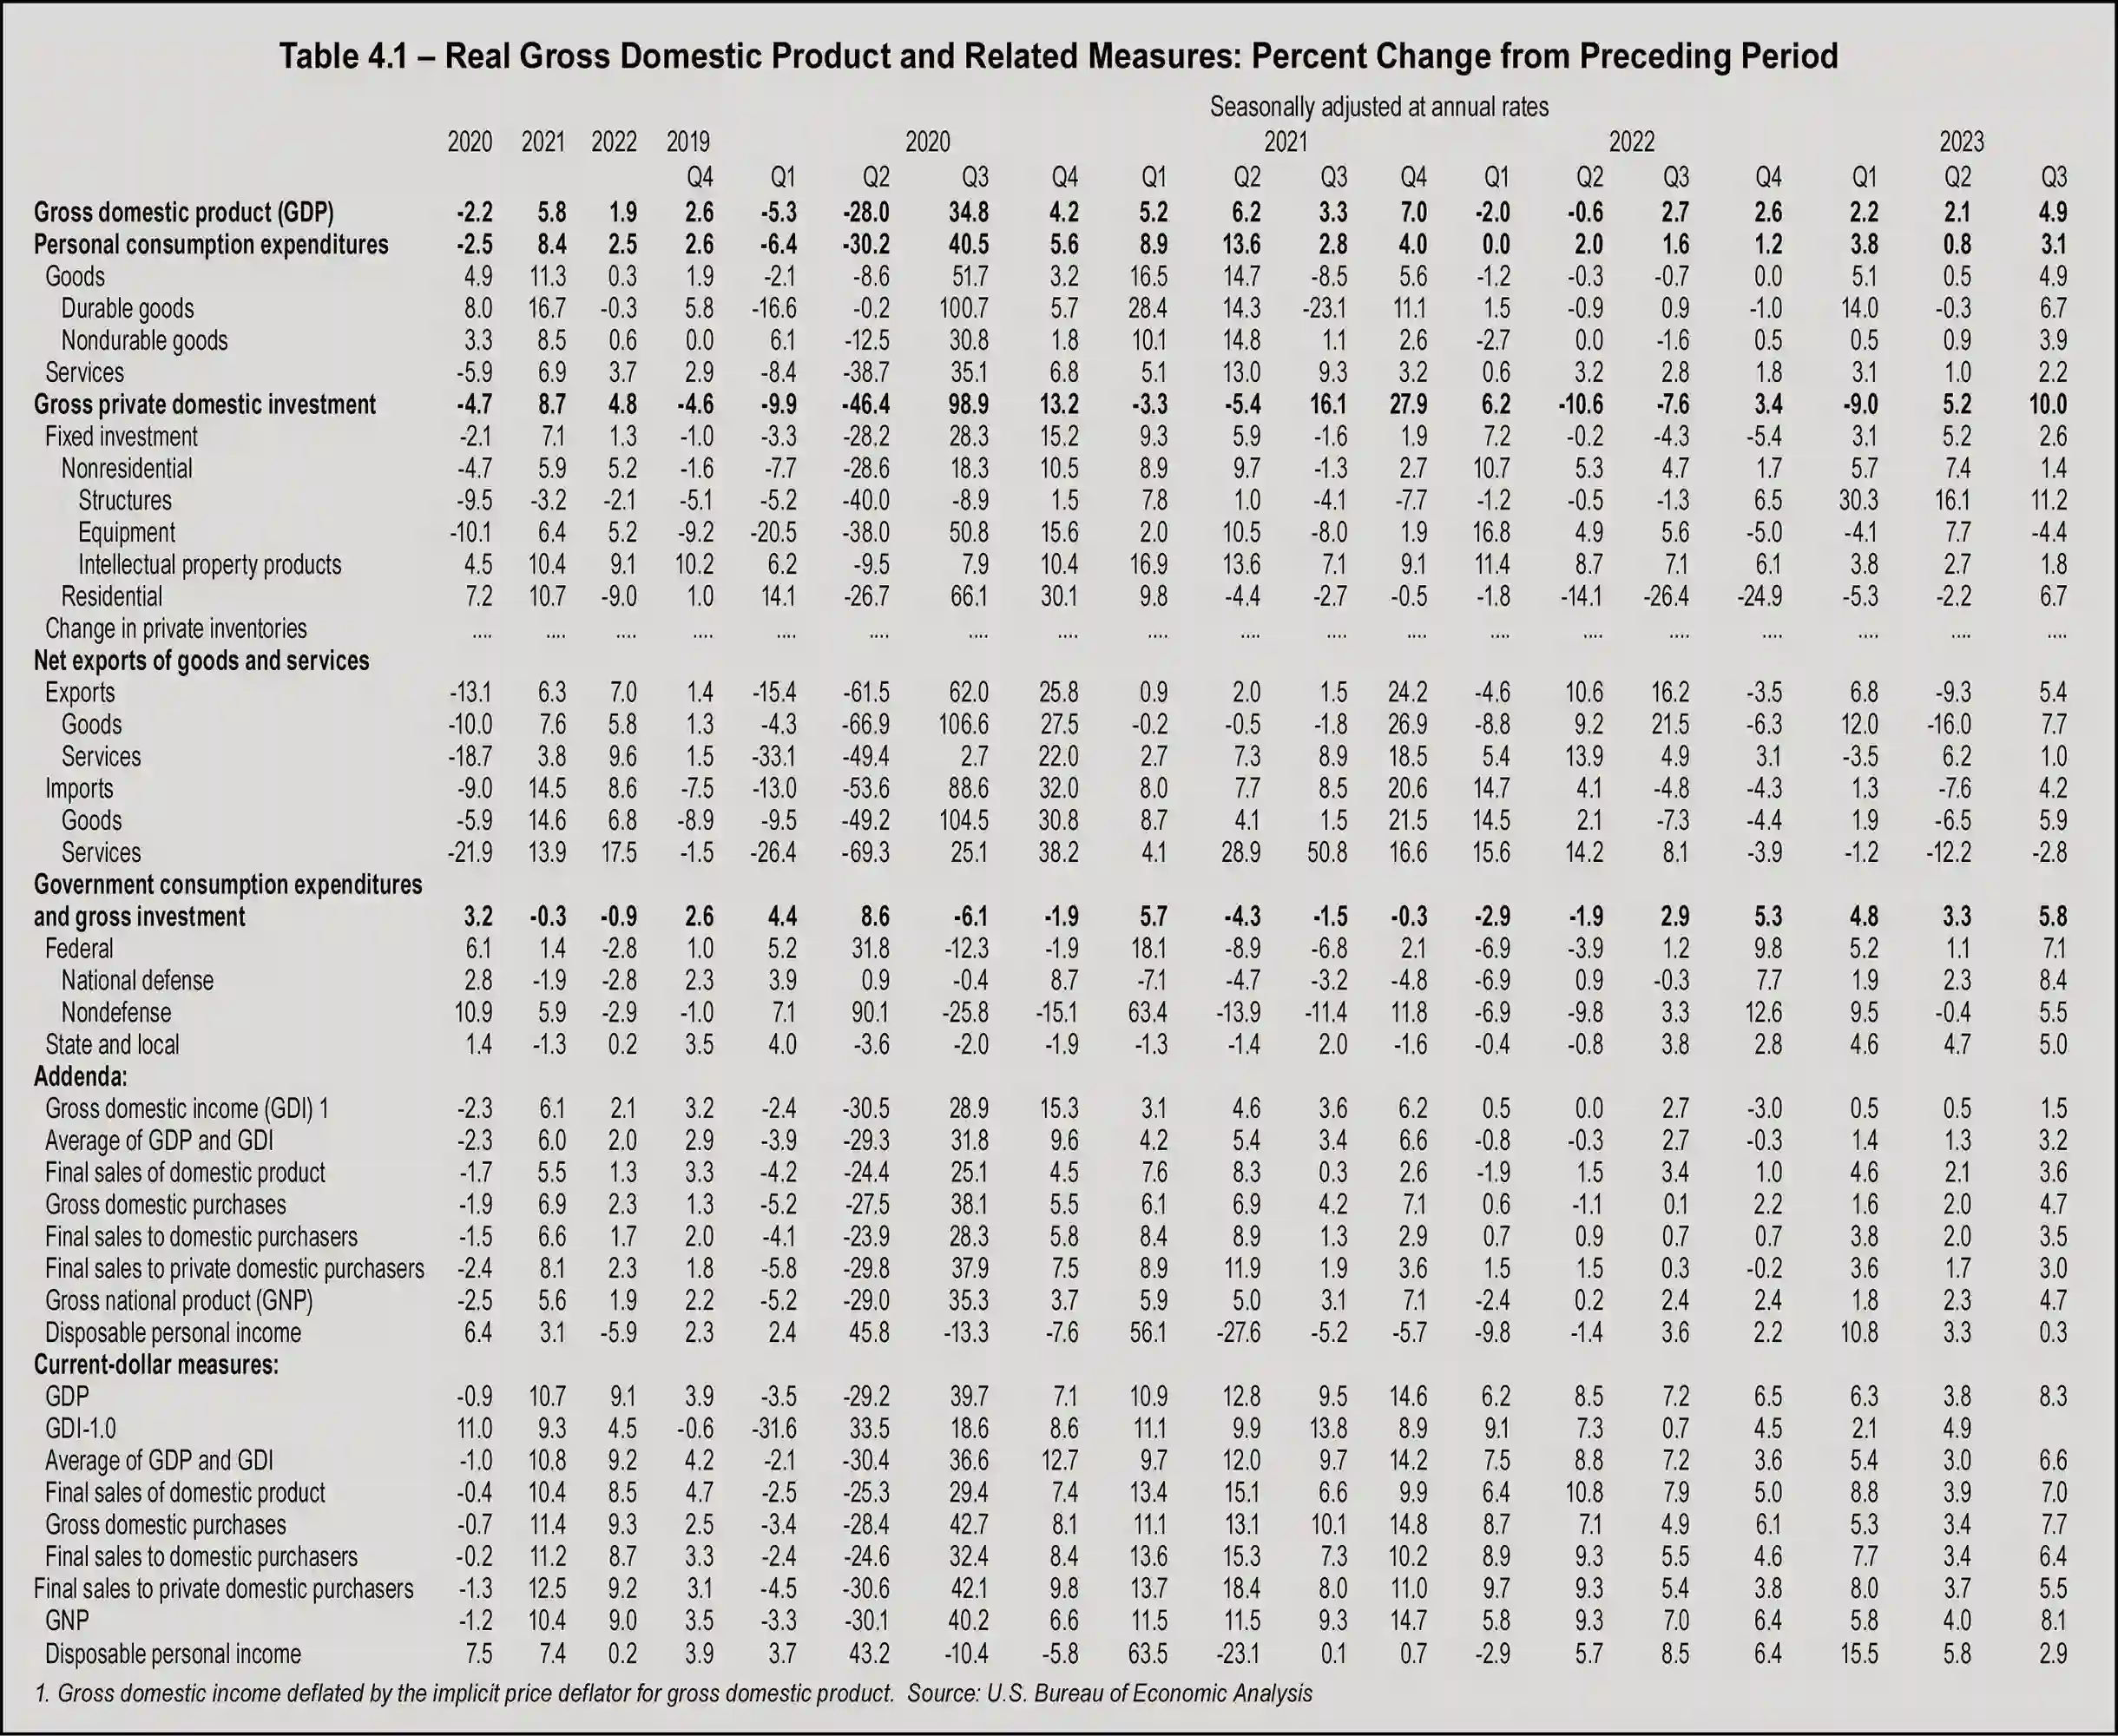
Strong consumer spending, fueled by extra money saved during the pandemic, created a surprising boost in the third quarter Gross Domestic Product (GDP) estimates. The Bureau of Economic Analysis (BEA) estimated that real GDP increased at an annual rate of 5.2 percent in the quarter. The year ended with a 2.8 percent real GDP growth, an impressive outcome considering the dismal forecasts early in the year.
The BEA attributed the increase to increases in consumer spending, private inventory investment, exports, government spending, residential fixed investment, and nonresidential fixed investment. The bureau also reported respectable increases in current-dollar personal income, disposable personal income, and personal savings.
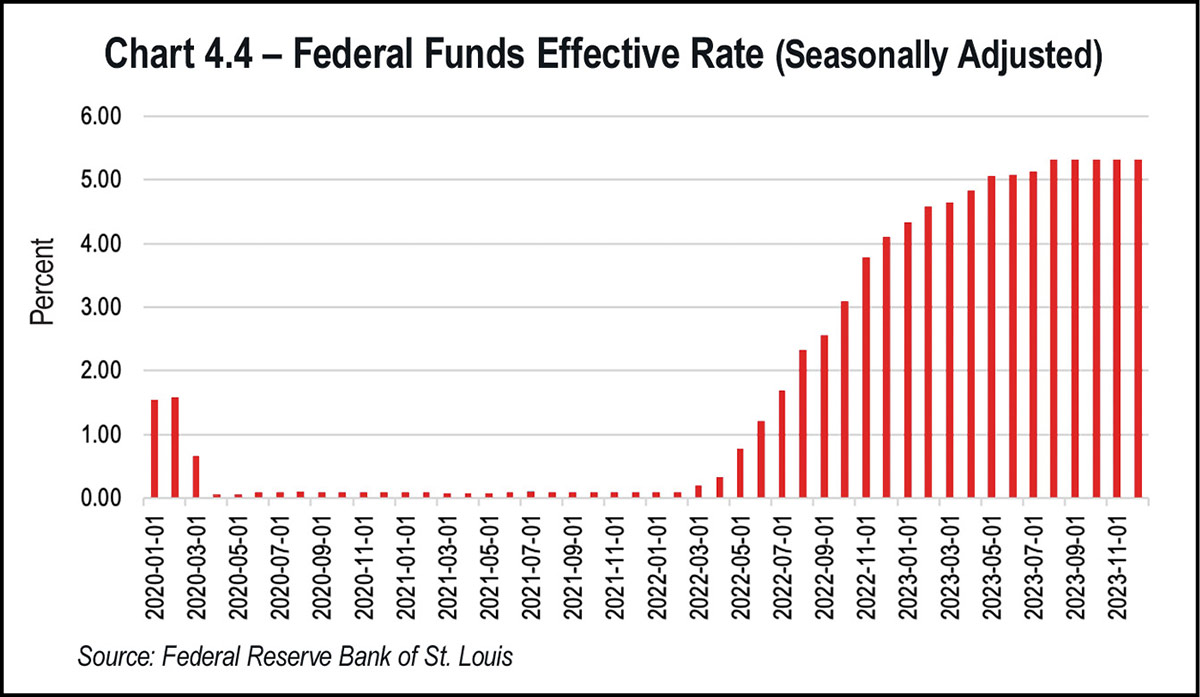
Inflation, which had reached as high as 9.1 percent in June 2022, also began slowing after the Federal Reserve (Fed) took on an aggressive strategy and raised the policy rate/overnight rate by 5.25 percent beginning in March 2022. Hopes that this action would cool down the economy enough to slow down inflation seemed to be realized. In December, the Fed announced that further rate hikes were unlikely, and hinted at the possibility of three rate cuts in 2024. The news provoked a rally in the markets, with the S&P 500 ending the year with a gain of more than 24 percent and the Dow with a 13.7 percent gain and a new record high.
The soft landing in a year that began with gloomy predictions caused many to marvel at the resiliency of the U.S. economy.
Other economic indicators for the third quarter 2023, as reported by the BEA, include a current-dollar GDP increase of 8.3 percent at an annual rate, to a level of $27.61 trillion. The price index for gross domestic purchases increased 2.9 percent.
The personal consumption expenditures (PCE) price index increased 2.6 percent in the third quarter. Current-dollar personal income increased $196.2 billion, disposable personal income increased $143.5 billion (or 2.9 percent), and real disposable personal income increased 0.3 percent. The personal saving rate, which is personal saving as a percentage of disposable personal income, rose by 4.2 percent in the third quarter.
Corporate profits are a critical economic indicator. The BEA reported that profits from current production (corporate profits with inventory valuation and capital consumption adjustments) increased $108.7 billion in the third quarter of 2023. Profits of domestic financial corporations increased $9.0 billion in the third quarter, and profits of domestic nonfinancial corporations increased $90.8 billion. These numbers suggest that U.S. companies were able to adjust to the new reality of higher wages and higher borrowing costs.
However, the year ended with mixed signals. The Conference Board Leading Economic Index® (LEI) for the U.S. declined by 0.5 percent in November 2023 to 103.0 percent, following a decline of 1.0 percent in October. In a press release, The Conference Board announced that the LEI contracted by 3.5 percent over the six-month period between May and November 2023, a smaller decrease than its 4.3 percent contraction over the previous six months from November 2022 to May 2023.
The release further stated that stock prices made virtually the only positive contribution to the index in the month. In the fourth-quarter rally, REITs outperformed the broader market when the Dow Jones Equity All REIT Index closed with a 17.9 percent total return, while the S&P 500 closed with an 11.7 percent return. The strong fourth quarter allowed U.S. real estate investment trust stocks an 11.3 percent return for 2023 overall. The sector underperformed the S&P 500’s 26.3 percent return in 2023.
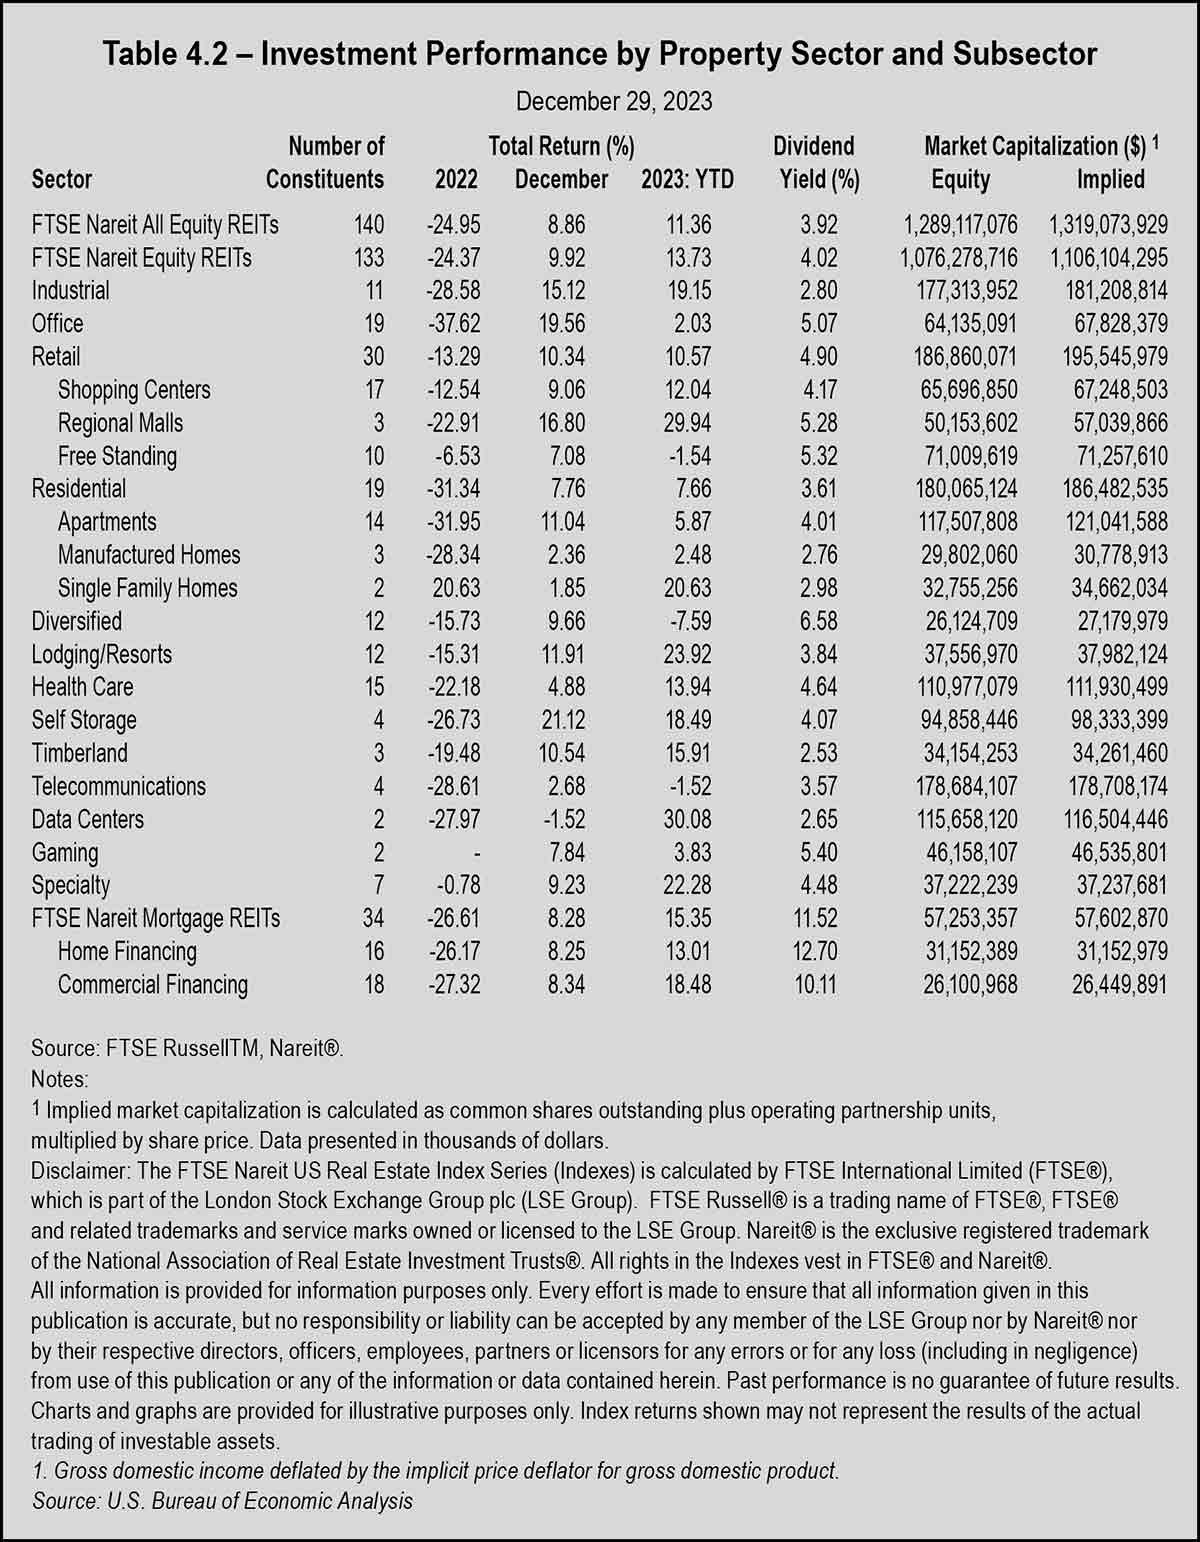
Topping the fourth-quarter REIT returns was The Dow Jones US Real Estate Regional Malls Index, closing at 34.3 percent. The self-storage REIT index was the second-best performer of the quarter with a 22.6 percent return, and the office REIT index came in third with a 22.4 percent return.
Among the self-storage REITs, Extra Space Storage Inc. recorded a return of 33.3 percent, with National Storage Affiliates close behind at 32.5 percent. CubeSmart logged a 22.9 percent return, and Public Storage closed the fourth quarter with a 17 percent return. The one-year return for Extra Space was 13.8 percent, while National Storage closed the year with an annual return of 21.8 percent.
The situation reached a climax in 2022, when the all items index increased 9.1 percent for the 12-month period ending June 2022—the largest 12-month increase since November 1981. The pressure put on consumers and business owners who had to pay higher prices for just about everything created widespread dissatisfaction with the economy and a dismal outlook. This, in turn, affected consumer spending, business hiring practices, and several other aspects of corporate and consumer behavior.
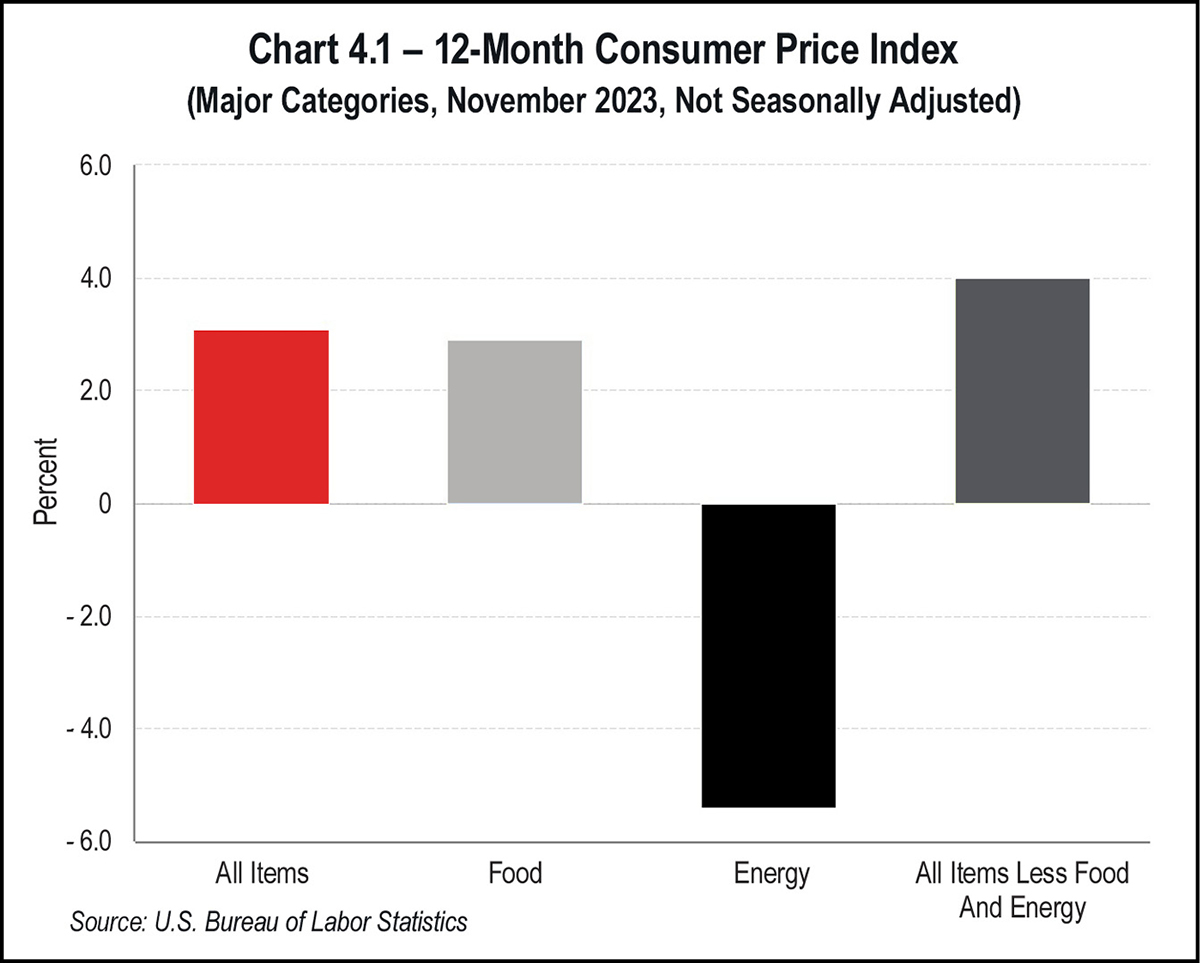
In December, the U.S. Bureau of Labor Statistics (BLS) released 12-month percentage change numbers for the Consumer Price Index through November 2023. The Consumer Price Index for All Urban Consumers (CPI-U) increased 0.1 percent in November on a seasonally adjusted basis. Prices for all items less food and energy rose 4.0 percent over the 12-month period. Energy prices decreased 5.4 percent for the period, while food prices increased 2.9 percent over the previous year.
Prices for energy commodities fell 9.8 percent over the year, led by an 8.9 percent decrease in gasoline and a 24.8 percent decrease in fuel oil. In commodities less food and energy commodities, prices for new vehicles rose 1.3 percent, while prices for used cars and trucks fell 3.8 percent. In services less energy services, prices for shelter rose 6.5 percent, while medical care services prices fell 0.9 percent over the year.
The inflation relief came partly from supply improvements. Although demand for many goods and services increased in the second half of 2020, supply was limited by disruptions in supply chains and by production shortfalls fueled by workforce shortages. Since the demand for goods and services increased at a faster rate than the market could supply, the result was higher prices.
Although the rate of inflation cooled in 2023, it was still higher than the modest 2 percent target rate the Fed prefers. The prices consumers paid for basic goods and services were still higher than in 2019, with no indication that the costs may return to previous levels. This hardship on consumers was a factor in consumer sentiment as the year began; however, the year ended with consumer sentiment on the rise.
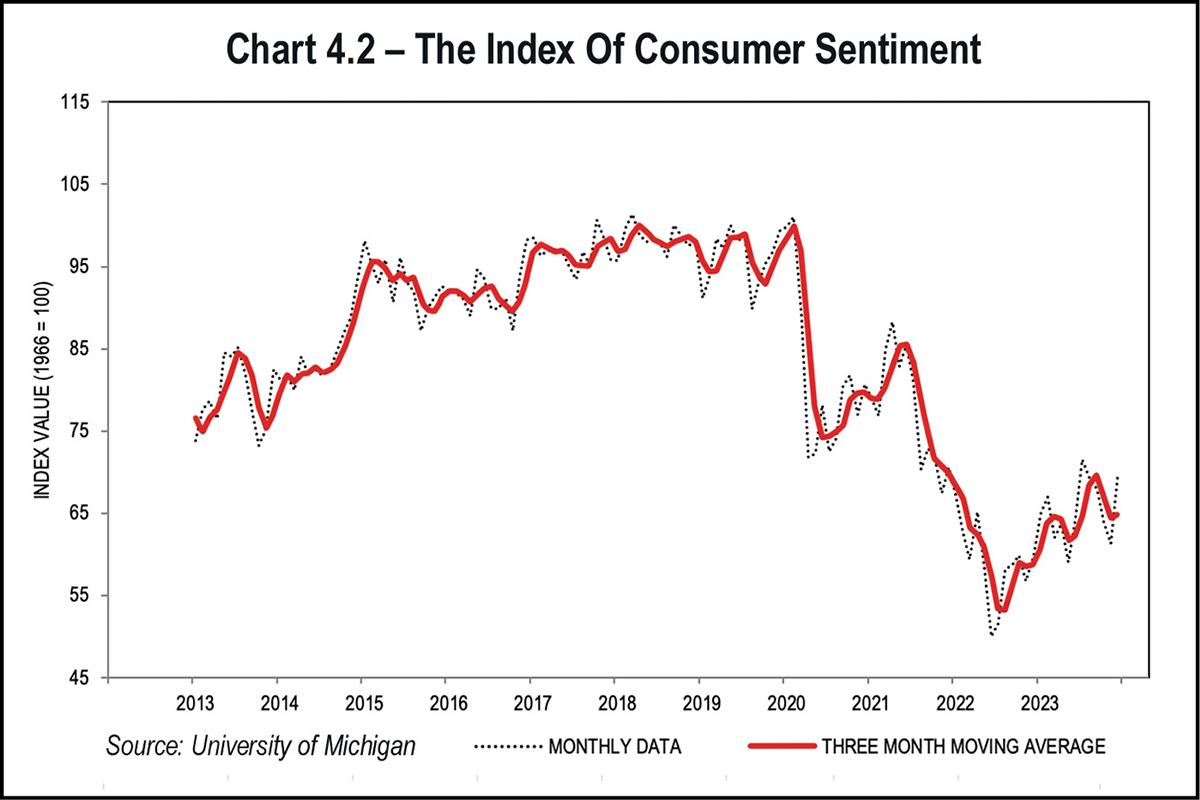
In another measure of consumer sentiment, The Conference Board’s Consumer Confidence Index® increased to 110.7 in December, marking a five-month high as the year ended. The index rose 9.7 points from November—the largest monthly increase in nearly three years. The Present Situation Index, which is based on consumers’ assessment of current business and labor market conditions, rose to 148.5 in December from 136.5 in November. The Expectations Index, which measures consumers’ short-term outlook for income, business, and labor market conditions, climbed to 85.6 in December from 77.4 in November. This was significant because a level of 80 or below for the Expectations Index historically signals a recession within the next year.
Personal income increased by $81.6 billion (0.4 percent at a monthly rate) in November, according to BEA estimates. Disposable personal income (DPI), personal income less personal current taxes, increased by $71.9 billion (0.4 percent). Personal consumption expenditures (PCE) increased $46.7 billion (0.2 percent). The personal saving rate—personal saving as a percentage of disposable personal income—was 4.1 percent for November.
The $46.7 billion increase in current-dollar PCE in November reflected an increase of $58.8 billion in spending for services and a decrease of $12.1 billion in spending for goods. The largest contributors to the increase in services spending were housing and utilities, food services, and accommodations. Within goods, the leading contributor to the decrease was a decrease in the price of gasoline and other energy goods.
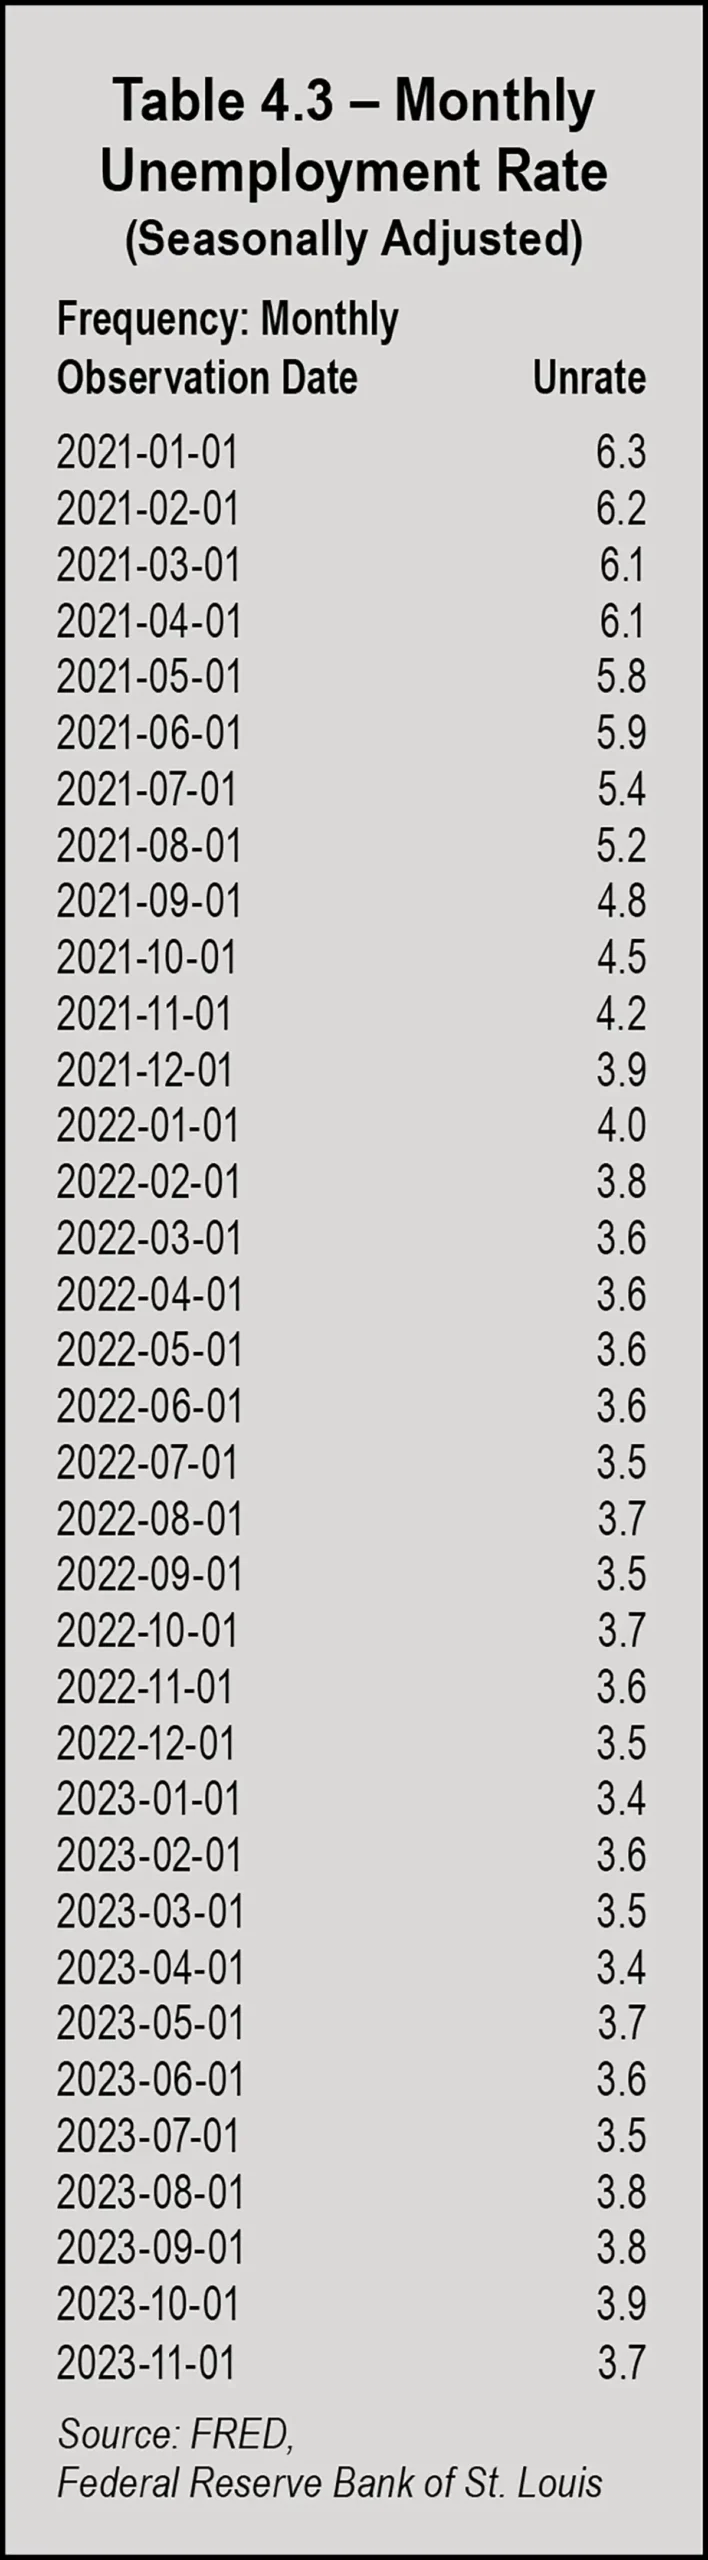
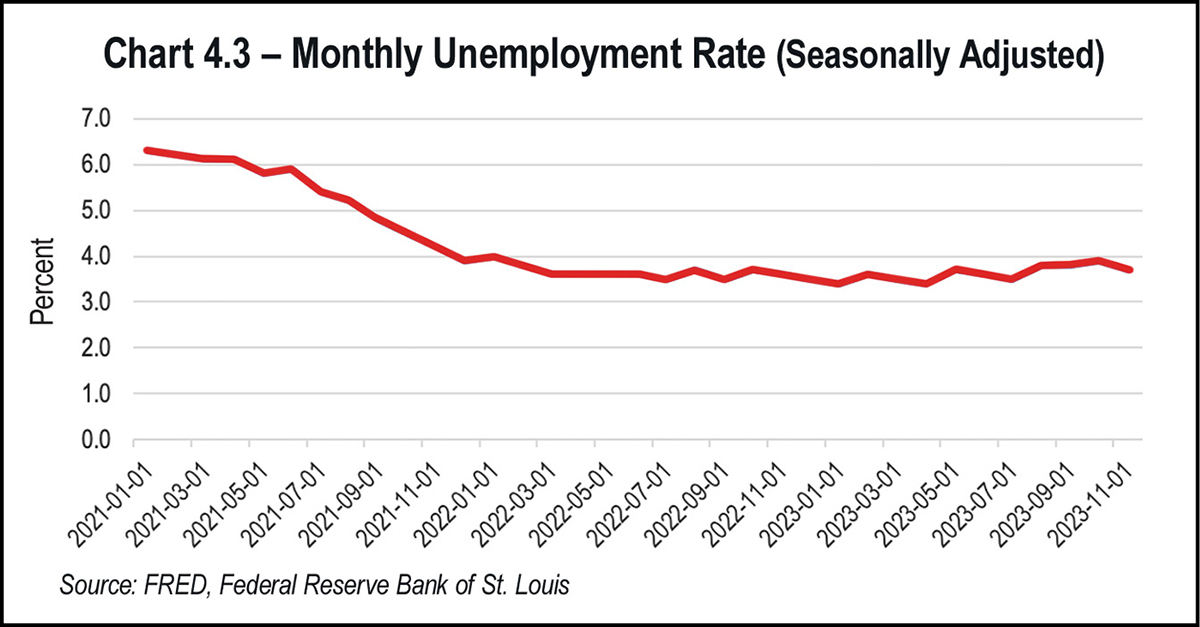
Total nonfarm payroll employment increased by 199,000 in November 2023, which was below the average monthly gain of 240,000 over the prior 12 months. Job gains in November reflected increases in health care and government employment, as well as manufacturing.
Health care added 77,000 jobs, which was above the average monthly gain of 54,000 over the prior 12 months. Government employment increased by 49,000 in November, slightly lower than the average monthly gain of 55,000 over the prior 12 months. Employment in manufacturing rose by 28,000 in November, reflecting an increase of 30,000 in motor vehicles and parts as workers returned from a strike. Employment in manufacturing showed little net change over the year.
Retail trade employment declined by 38,000 in November and showed little net change over the year. Employment in transportation and warehousing decreased as a category, but it reflected a gain in air transportation that offset a job loss of 8,000 workers from the warehousing and storage category. In November, employment in transportation and warehousing had declined by 61,000 since a peak in October 2022.
According to ManpowerGroup, 77 percent of employers were struggling to fill job vacancies in 2023. The U.S. labor shortage sat at 75 percent, just under the global average. Data also suggested that 57 percent of employers offered more flexibility at work when it comes to location (hybrid or remote) and hours, offering part-time schedules and flexible hours. Other strategies for dealing with a labor shortage included hiring older workers, training existing employees for higher-level jobs, and outsourcing.
The U.S. Chamber of Commerce conducts research on the trends on job openings, labor force participation, quit rates, and more. In May 2022, the Chamber surveyed unemployed workers who lost their jobs during the pandemic to gain insight on why they had not returned to work. Key findings included:
- Two thirds (66 percent) of Americans who lost their full-time job during the pandemic said they were only somewhat active or not very active at all in searching for a new job.
- About half (49 percent) were not willing to take jobs that do not offer the opportunity for remote work.
- More than one-fourth (26 percent) said it will never again be essential for them to return to work.
- Nearly one in five had altered their livelihood, 17 percent had retired, 19 percent had transitioned to homemaker, and 14 percent were working part time.
- Almost one-fourth (24 percent) said government aid packages during the pandemic had incentivized them to not actively look for work.
- Younger respondents, aged 25 to 34, were prioritizing personal growth over searching for a job at the time; 36 percent said they were more focused on acquiring new skills, education, or training before re-entering the job market.
An aging workforce opting for early retirements has had a significant impact on the labor force. By October 2021, the pandemic had driven more than 3 million adults into retiring before they had originally planned. The number of adults 55 and older no longer in the workforce had reached 50.3 percent by the third quarter of 2021. Because the average age of the population is steadily increasing, this trend will likely continue.
Many workers left jobs in 2023 to find better opportunities. More than 34 million Americans quit their jobs over the year; however, the hiring rate has outpaced the quit rate since November 2020.
By July, the prime rate had risen to 8.5 percent, creating havoc in many industries but hitting commercial real estate particularly hard when the cost of capital reached its highest level in over two decades. The year ended with the prime rate remaining at 8.5 percent. The favorable self-storage lending climate buyers and developers had enjoyed for several years ended at a time when more than $200 billion in fixed-rate CMBS debt was set to mature over the following 18 months.
Industry experts predict that the self-storage industry will go through a tough adjustment period as rates become normalized. The expectation is that in 2024 or 2025, rates will adjust closer to the historical average.
Consumers, too, were hit hard by rising interest rates. The average credit card rate rose from 16.34 percent in March 2022 to nearly 21 percent. Consumers ended the year with $100 billion more in credit card debt. Mortgage rates jumped from around 3 percent to nearly 8 percent, while rates for auto loans reached 7.72 percent and federal student loan rates rose from 3.73 percent to 5.5 percent.
In December, the Fed announced that it didn’t foresee any further rate hikes and hinted at four rate cuts in 2024. The markets rallied as a result of the announcement, and U.S. equities closed not far from all-time highs. The Fed’s median Summary of Economic Projections shows the federal funds rate falling three-quarters of a percentage point to 4.6 percent by the end of 2024 and to 3.6 percent in 2025.
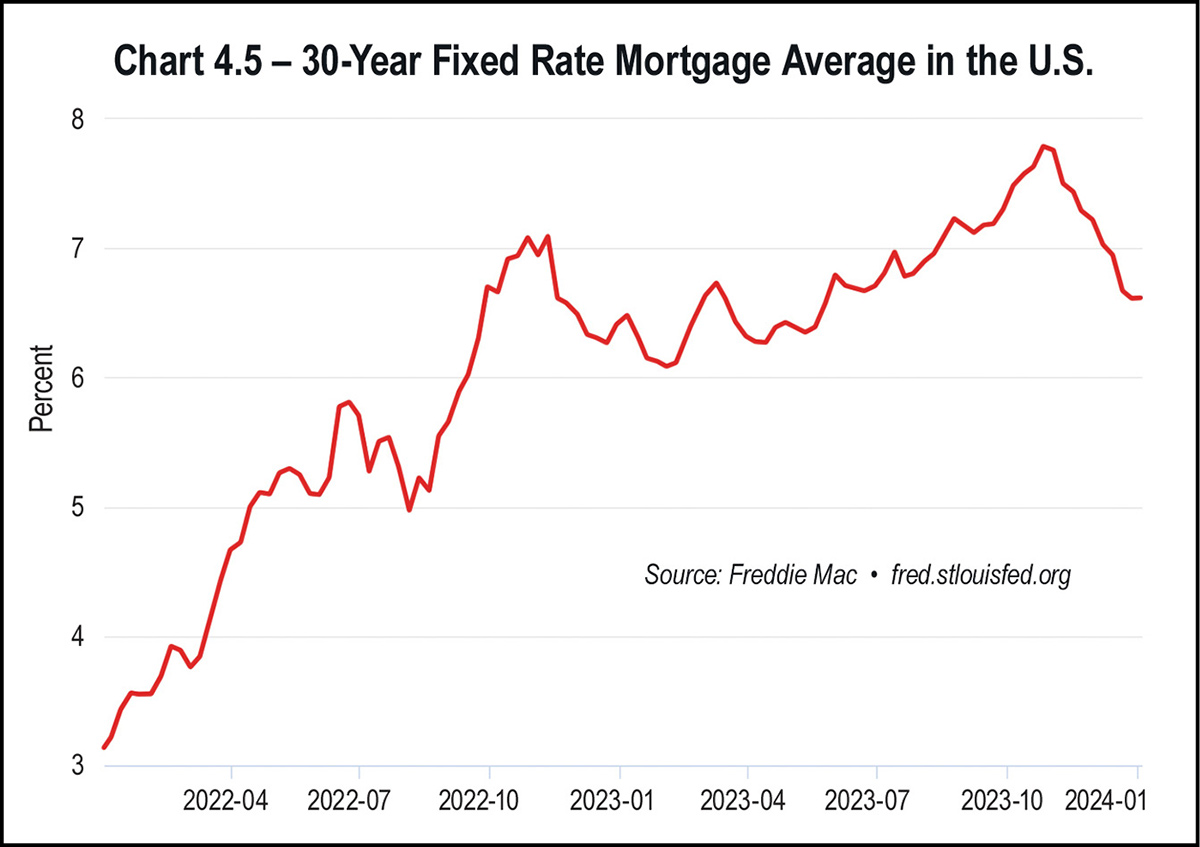
In early January 2022, the 30-year fixed mortgage rate stood at 3.22 percent and escalated until it reached a high of 7.79 percent in October. With median home prices over $400,000, purchasing a home became unfeasible for many would-be buyers. Average monthly mortgage payments reached an all-time high of $2,735 in mid-October.
By August, when rates topped 7 percent, homebuyers needed to earn over $114,000 annually to afford a median-priced home. U.S. families with two people had an annual median income of $75,143 in 2023. In addition to income barriers, banks also tightened lending requirements, forcing first-time buyers out of the market.
Some relief came when the Fed announced the end of its rate cuts and mortgage rates began to fall. By Dec. 28, 2023, the average rate for a 30-year fixed loan was 6.61 percent after reaching a high of 8.45 percent in October. For 15-year fixed-rate loans, December’s rate dropped to 5.95 percent. Mortgage rates, however, are just one hurdle would-be buyers face. As Sam Khater, Freddie Mac’s Chief Economist, noted in a press release, “While lower mortgage rates are welcome news, potential homebuyers are still dealing with the dual challenges of low inventory and high home prices that continue to rise.”
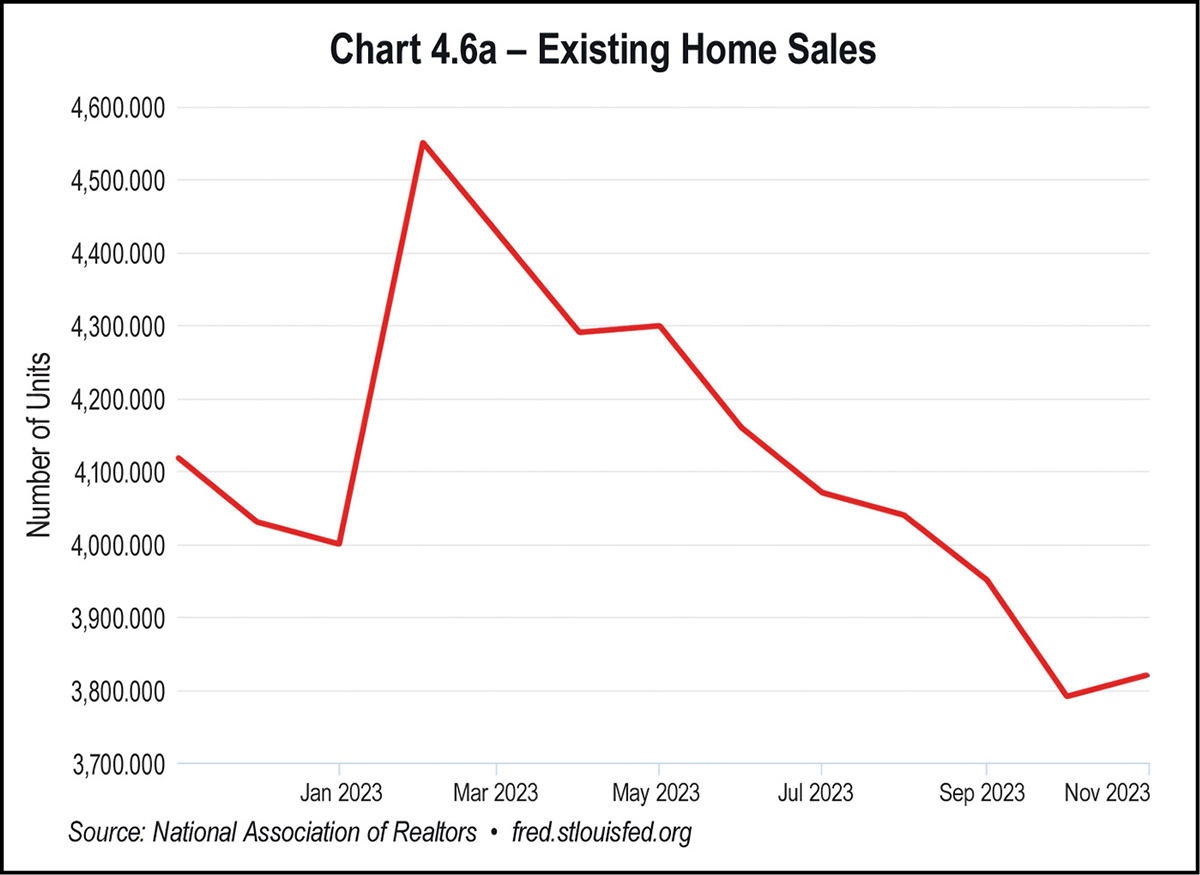
The year began with a median home price of $361,200 in January 2023 and peaked at $410,000 in June, after which median home prices began to fall. At the end of November, the median home price was $387,600, nearly $30,000 higher than the median home price in November 2022 of $358,200, but better than the year’s $410,000 high. The record highest median home price was seen in June 2022 at $413,800.
Home prices and other negative factors affecting the market resulted in both new and existing home sales plummeting in 2023, following a previous drop in 2022. In September 2023, total home sales were down 10 percent on a year-over-year basis; the National Association of Realtors (NAR) reported that existing home sales were at their lowest level in 13 years.
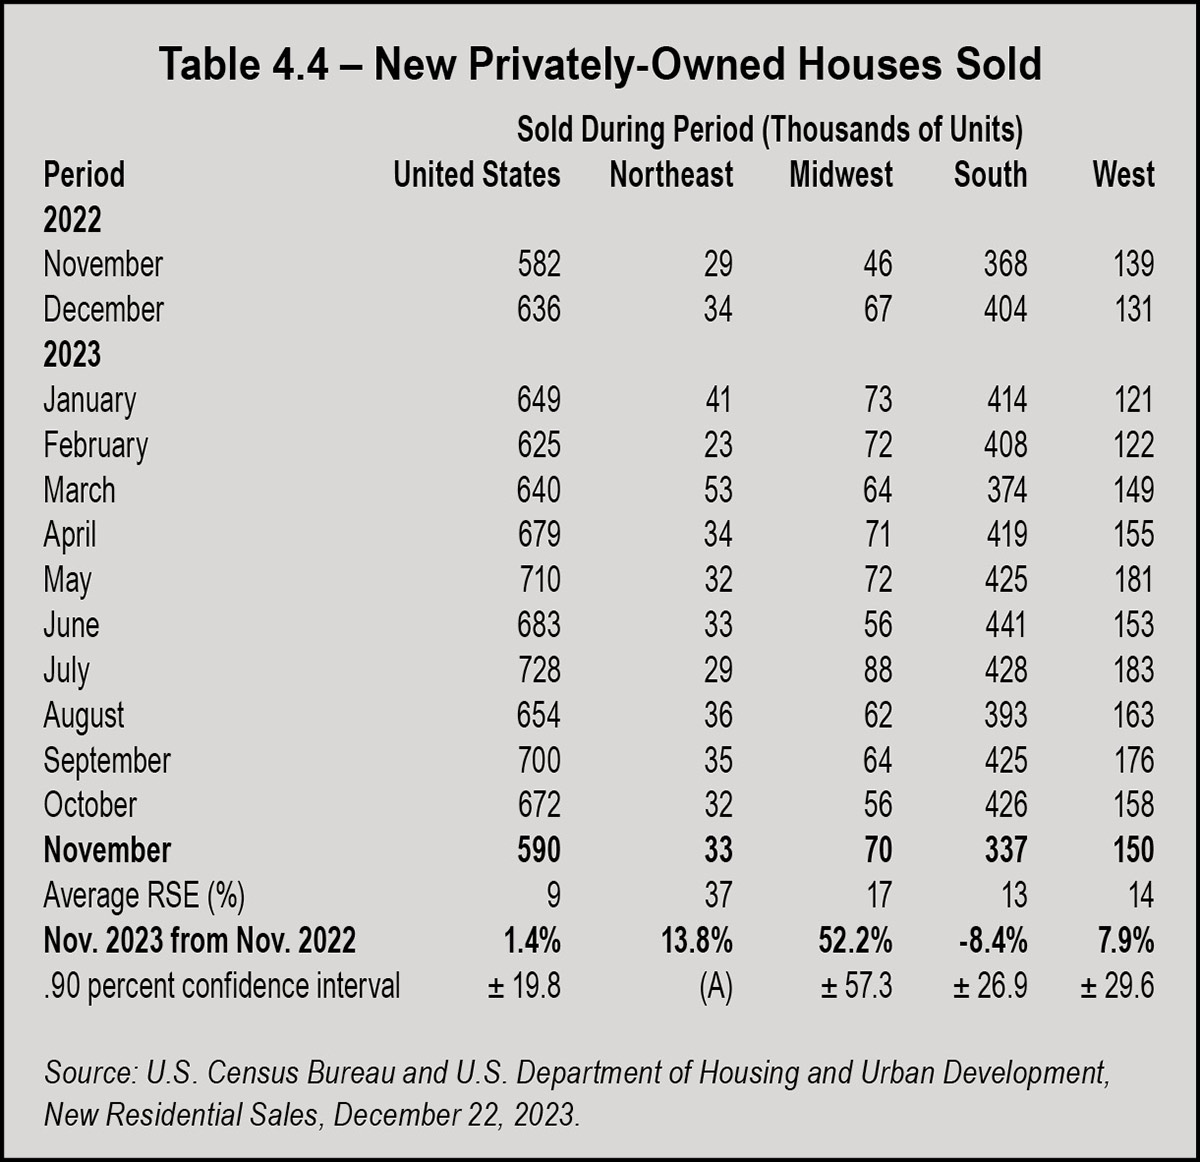
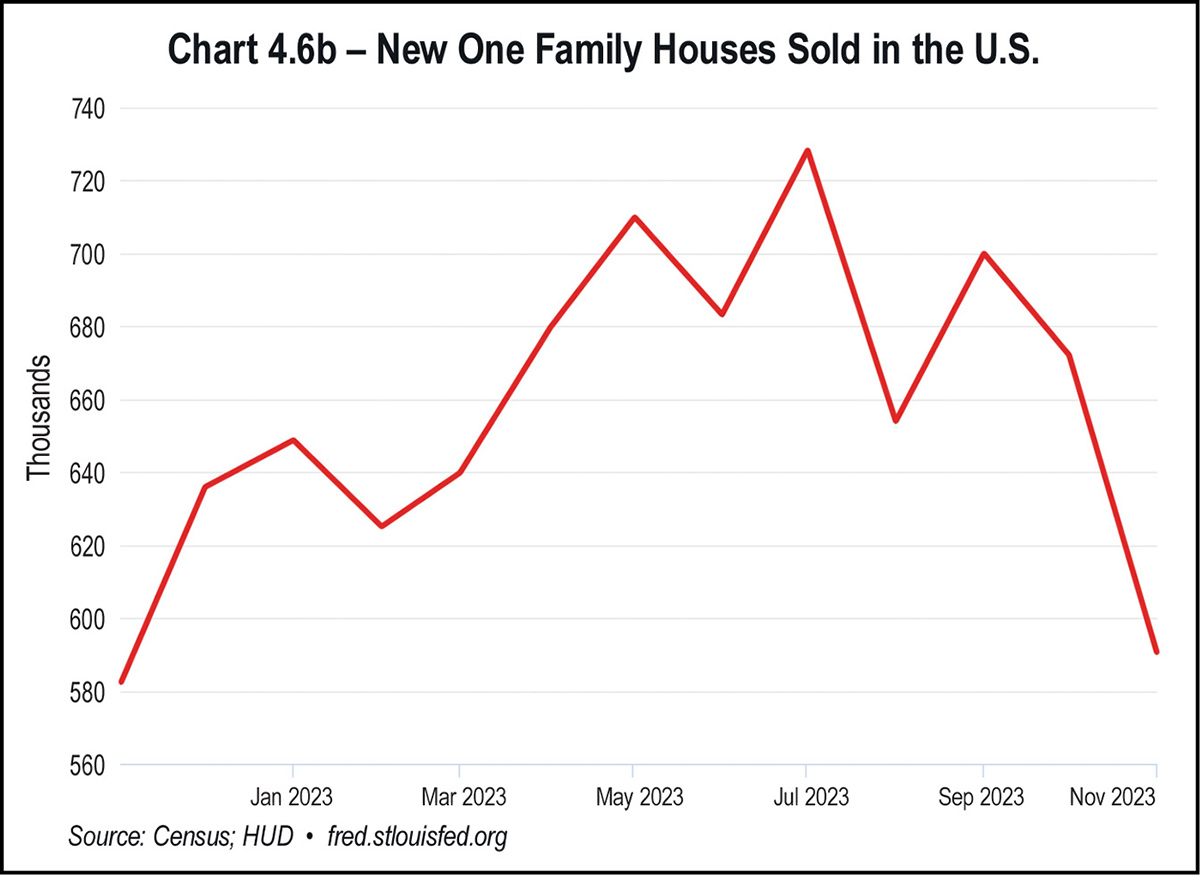
Although the share was larger, selling was a challenge. The National Association of Homebuilders reported that in October, 32 percent of builders cut home prices at an average price discount of 6 percent. Even after price cuts, November sales of new single-family houses were down 12.2 percent from October. With decreased demand, builders have had no incentive to return to previous construction levels.
The numbers of new home sales dropped consistently throughout 2023, with month-over-month decreases ranging from 10 percent to 25 percent. Existing home sales drops were even more precipitous, ranging from 16 percent in August to 33 percent in January. Although down from previous periods, Dallas and Houston remained the top MSAs for new home sales.
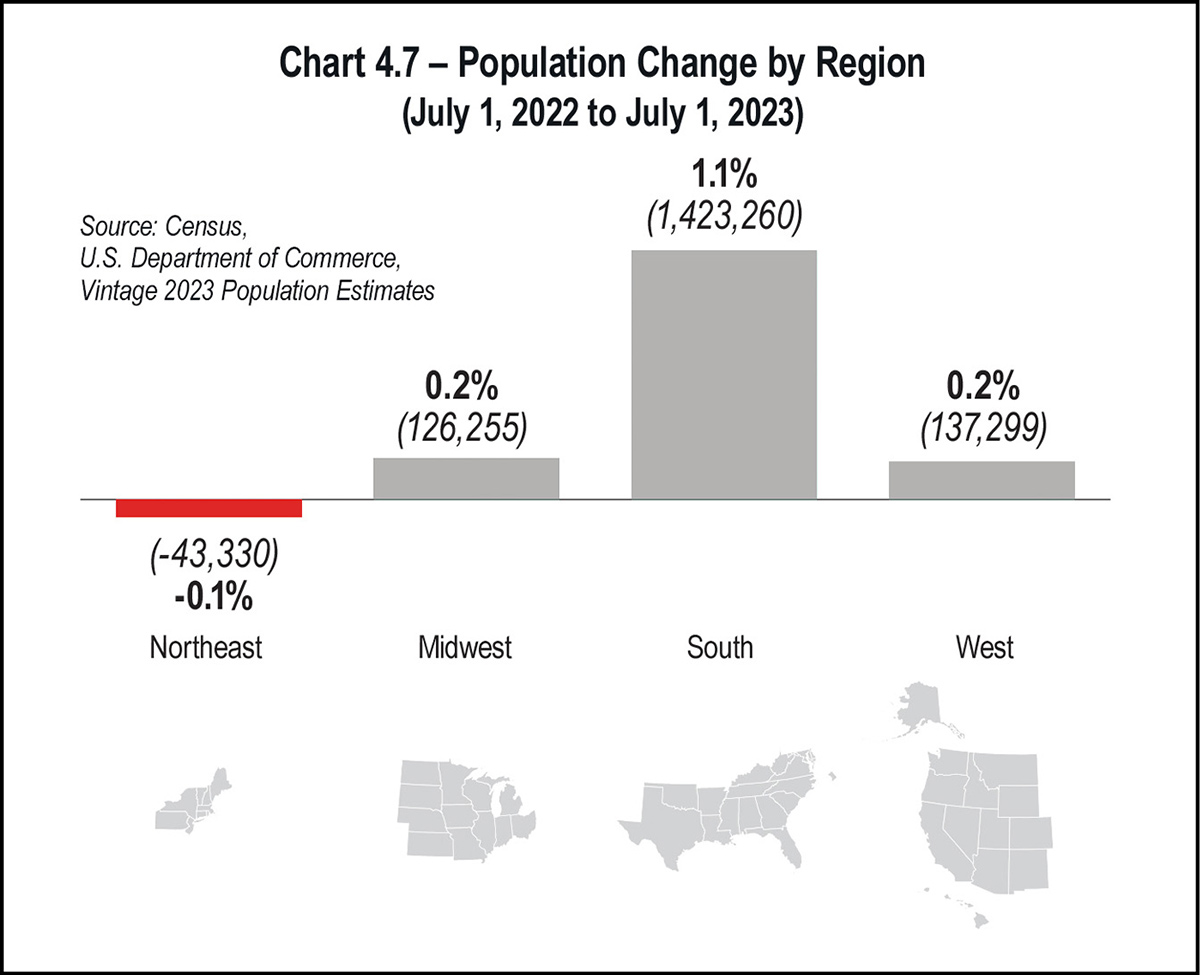
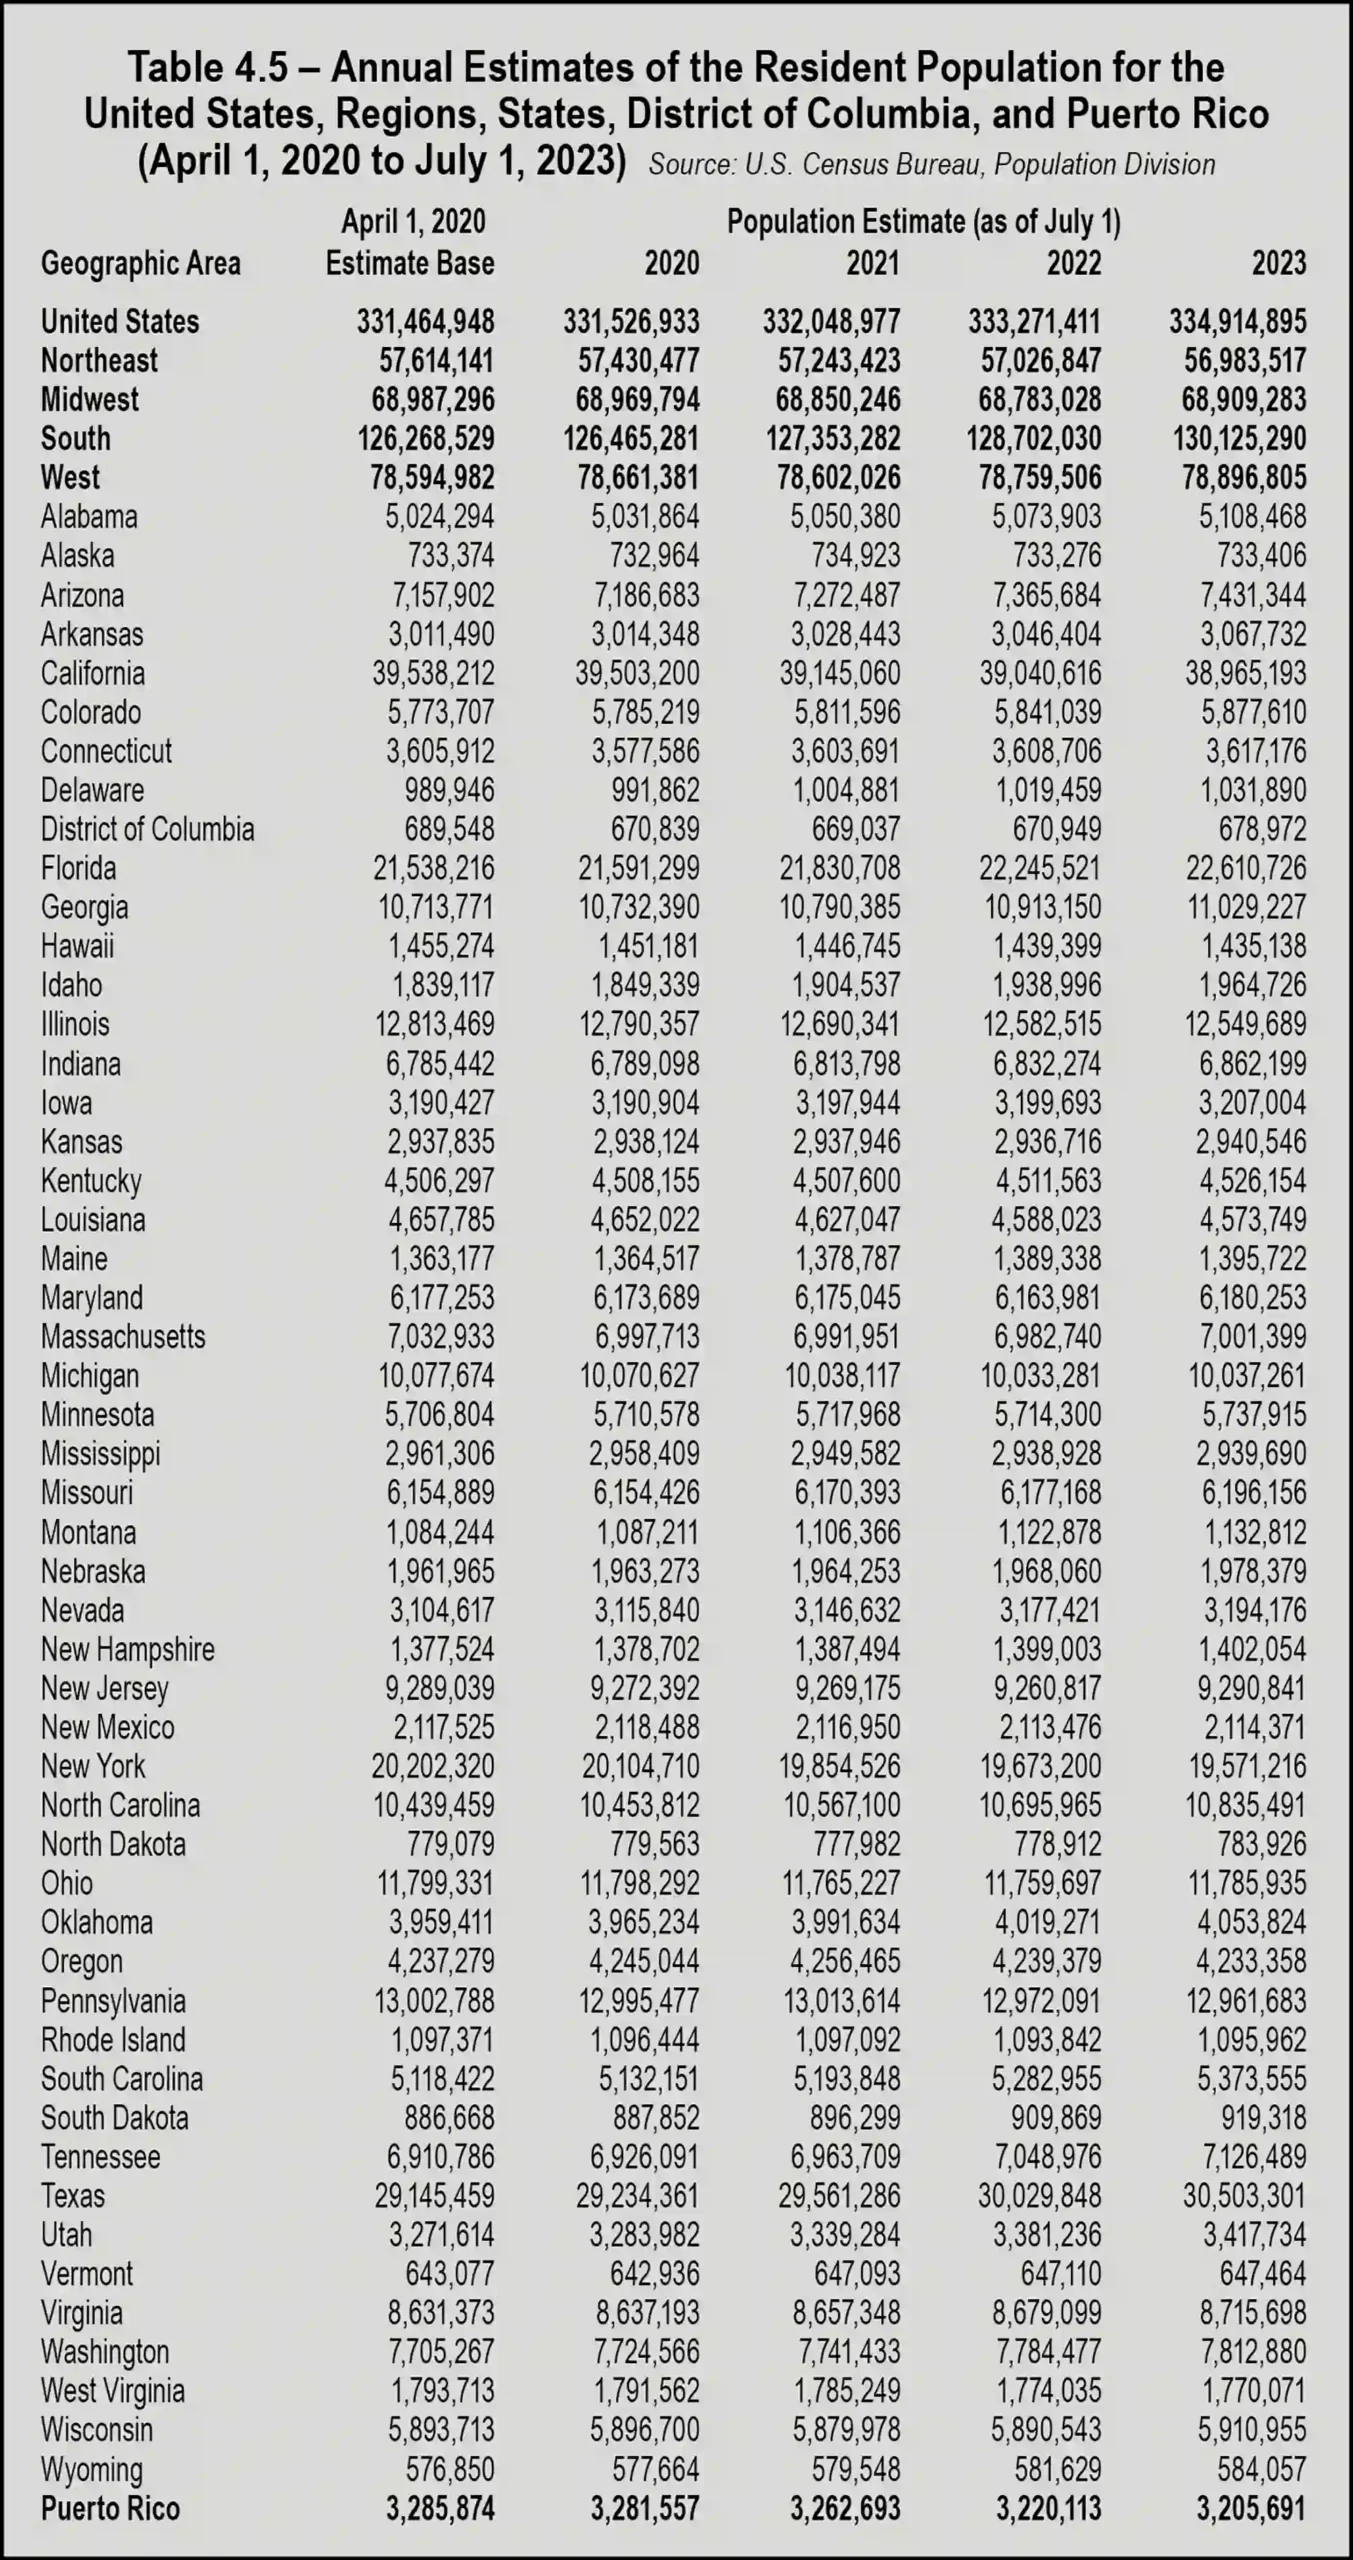
After declining in 2020 and 2022, the population in the Midwest had a slight gain of 0.2 percent, or just over 126,000 residents. The Census Bureau attributed the Midwest’s population rebound to a lower rate of outmigration to other regions, increased international migration, a slowdown in population loss in Illinois, and growth in Indiana, Minnesota, and Ohio.
The West added 137,299 people to the region, following an addition of 157,480 people in 2022. Fewer Western states experienced population loss in 2023, with Alaska and New Mexico gaining population again after losing population the prior year. California, Oregon, and Hawaii continued to lose population.
All population numbers provided by the bureau include only those counted in the Census; the figures don’t account for all of an estimated 17 million undocumented immigrants living in the U.S. The rising number of undocumented immigrants has corresponded with lower numbers of legal immigrants in recent years. The United Nations’s net legal migration rate for the U.S. per 1,000 people fell from 6.48 in 1998 to 2.748 per 1,000 in 2023. This translates to approximately 934,300 net legal migrants entering the U.S. over the year—a drop in legal net immigration of nearly 58 percent.
The significance of lower numbers of legal immigrants is that it can mean higher potential costs to the U.S. economy. For example, funding the Social Security program depends on legal immigration, particularly as the number of U.S.-born workers entering the labor force continues to decline. Traditional Social Security is funded through payroll taxes, through the taxation of benefits, and with interest earned on the program’s asset reserves. The system relies on new workers opting in each year, including legal immigrants.
The Census Bureau’s Current Population Survey showed that the total foreign-born or immigrant population (legal and illegal) had reached 49.5 million in October 2023. The study estimated that 15 percent of the U.S. population is now foreign-born.
Another growing demographic is bringing new challenges for the U.S. economy. With families opting to have fewer children and improved health care leading to longer lifespans, the U.S. population is aging rapidly. U.S. Census Bureau statistics show that between 2000 and 2021, the national median age in the United States increased by 3.4 years from 35.4 years to 38.8 years.
In 2020, approximately 1 in 6 people in the United States were age 65 and over. In 1920, the proportion was less than 1 in 20. The number of Americans age 65 and older is projected to nearly double from 52 million in 2018 to 95 million by 2060, and the 65-and-older age group’s share of the total population will rise from 16 percent to 23 percent.
This means that the portion of the population of prime working age is shrinking, leading to a decline in productivity and creating greater strain on the federal budget. These factors have the potential to add to an already critical labor shortage and to stunt the nation’s economic growth. Moreover, it raises concern regarding a Social Security system that many agree is unsustainable.
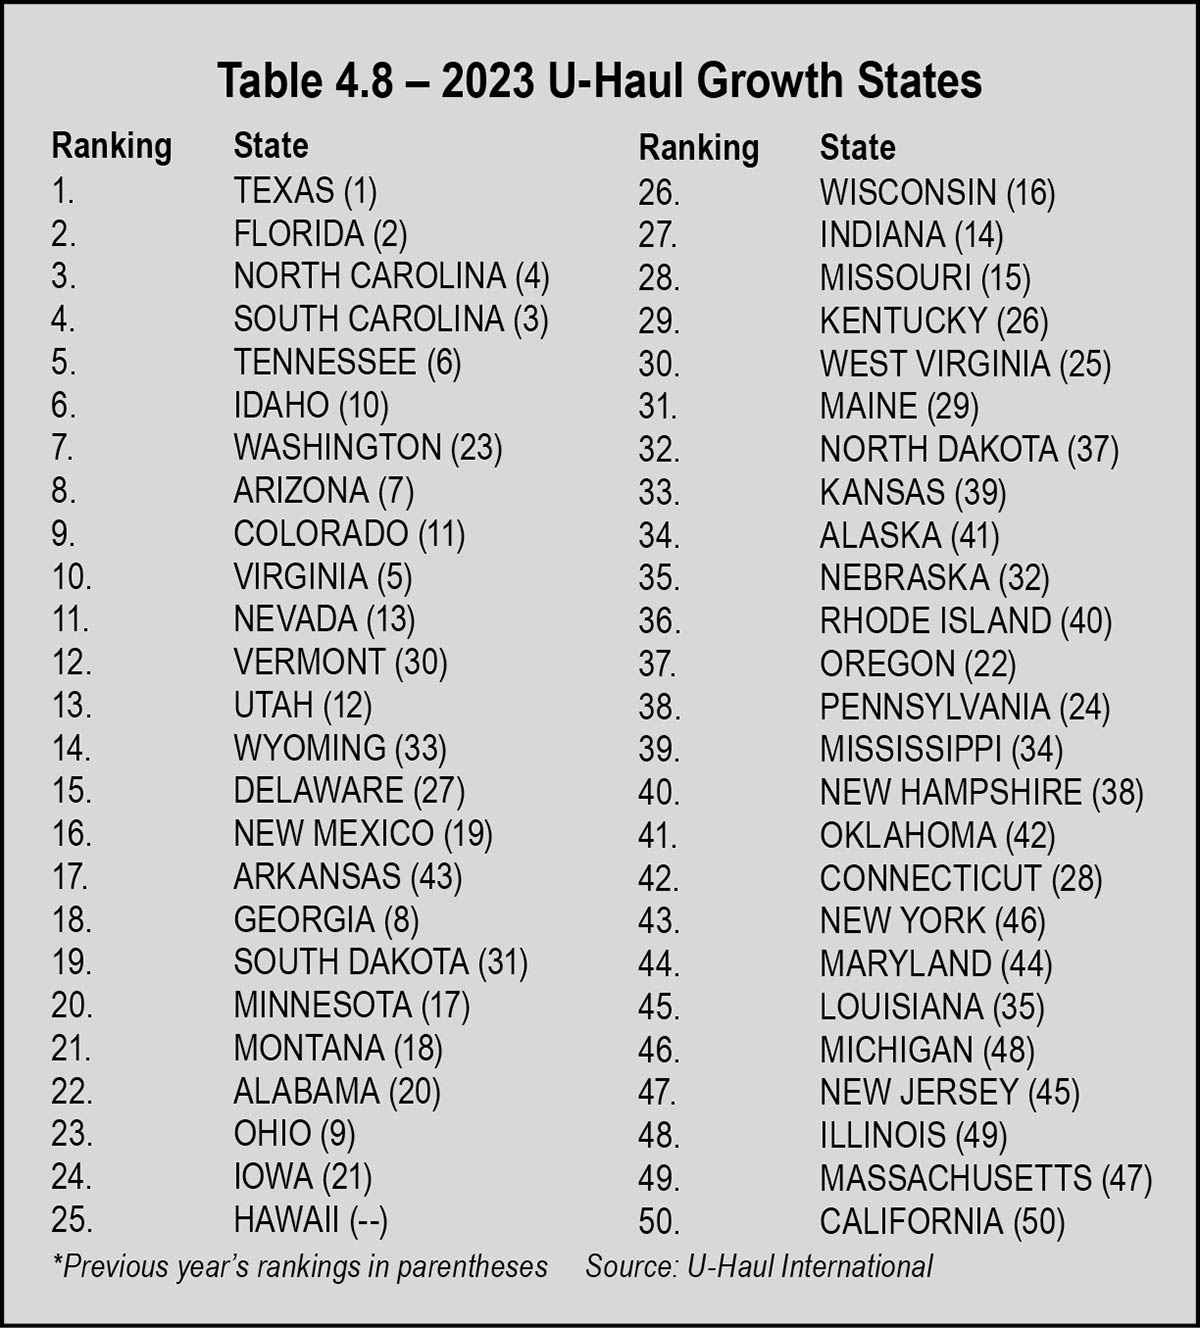
For the fourth year in a row, California showed the largest net loss of one-way movers. Following next in the bottom five states for growth are Michigan, New Jersey, Illinois, and Massachusetts; New York ranked in the bottom 10 at 43rd.
In a January 2024 press release, U-Haul International president John “J.T.” Taylor said the company saw the same geographical trends as in recent years, although not at the record-breaking levels they witnessed immediately following the pandemic.
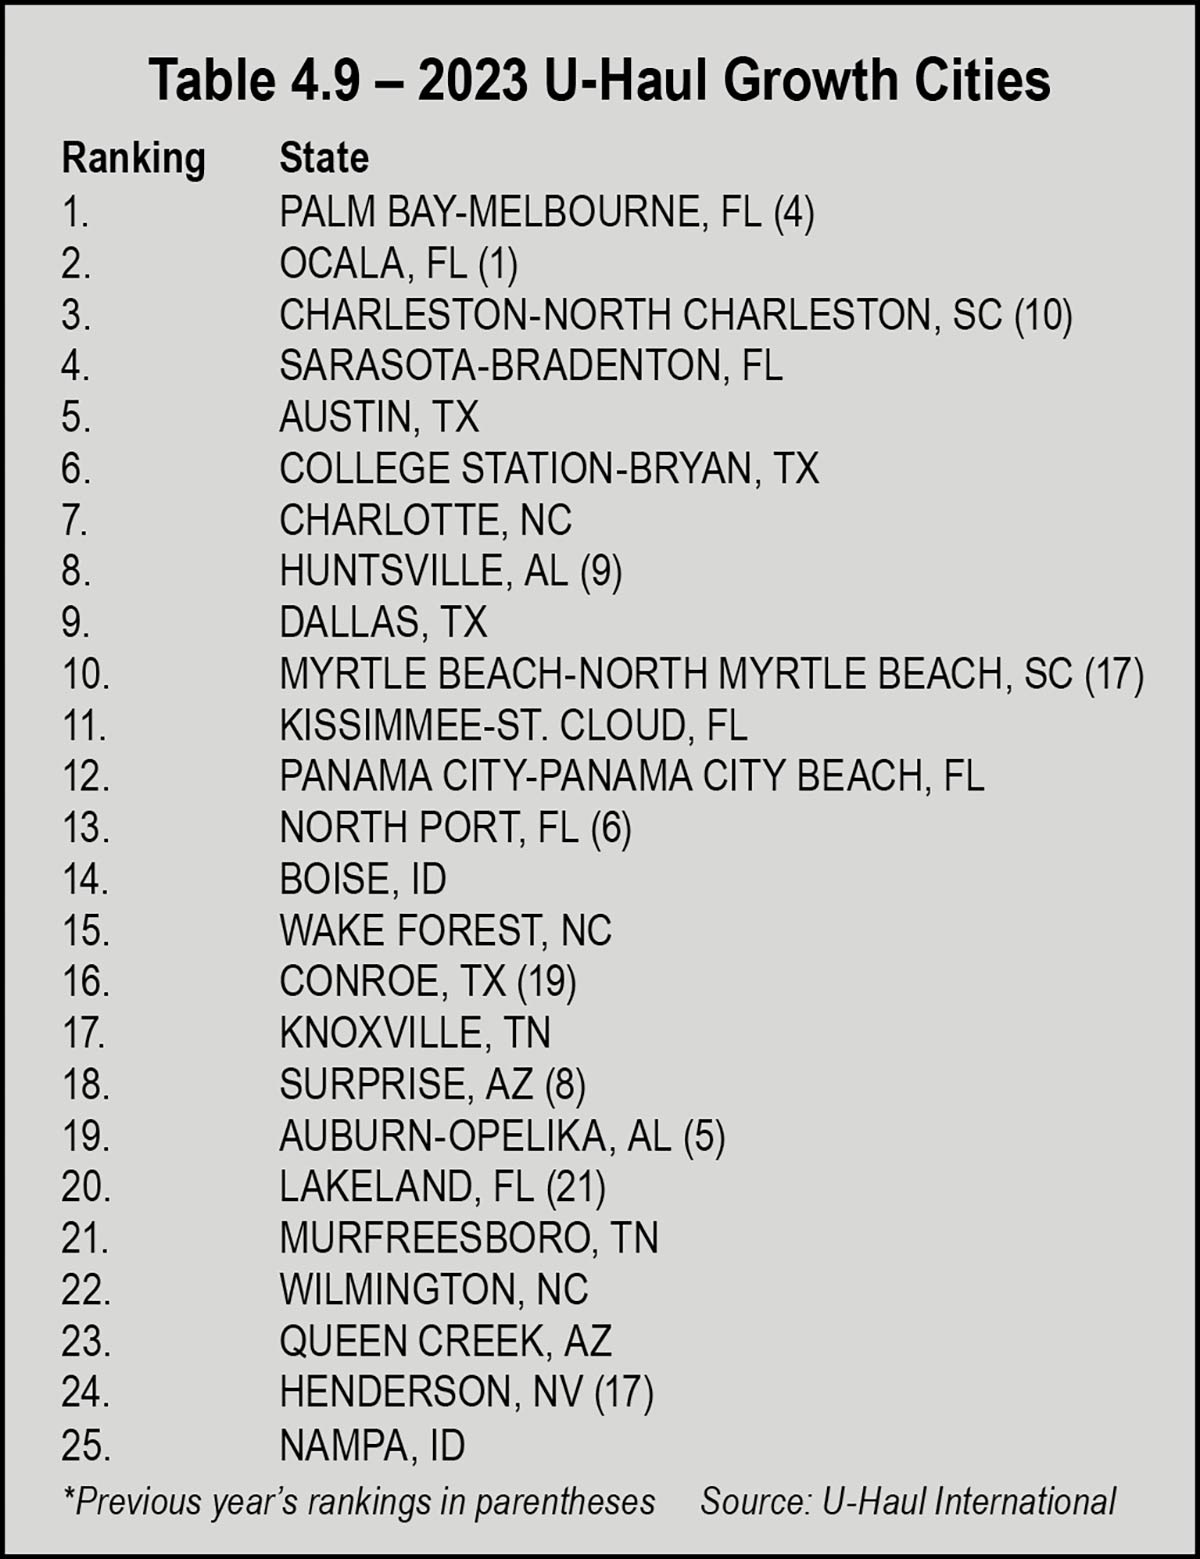
As for top growth cities, U-Haul reported that Florida destinations dominated the U.S. growth cities list again in 2023, with the Palm Bay-Melbourne market netting the largest number of movers in one-way U-Haul® equipment last year.
The U-Haul Growth Index found seven Florida markets among the top 25 growth cities in 2023. It marked the seventh year in a row the Sunshine State had the most cities represented. Florida had four markets among the top 25 in 2022 and 10 in 2021.
The Sarasota-Bradenton market ranked fourth, just behind Charleston-North Charleston, S.C. Austin was the fifth-ranked growth city, the first of three top-10 Texas destinations along with the College Station-Bryan market and Dallas.
Several factors influenced relocation decisions in 2023. An unprecedented portion of the workforce shifted to remote work during the pandemic, allowing people to seek more desirable locations without the necessity of looking for new work. Others retired and were no longer limited geographically by their jobs.
Affordability of housing and other essentials also prompted relocation from areas with a high cost of living, as did the desire to flee from areas with high state and local taxes. Movers also pursued better climates, better health care, and opportunities for better education. Relocating for better living conditions and lower housing costs accounted for 25.6 percent and 21.4 percent of moves, respectively.
In the November Survey of Professional Forecasters (SPF), conducted by The Federal Reserve Bank of Philadelphia, the consensus was that the outlook for the U.S. economy looked better than it did three months prior. The forecasters who were surveyed expect real GDP to increase modestly by 1.7 percent in 2024.
One economic risk, noted in a November press release by Kevin Kliesen, a business economist and research officer at the Federal Reserve Bank of St. Louis, is upcoming defaults across several loan categories. “Rising defaults and delinquencies could reduce profits in the bank and nonbank lending sector, raising the risk of financial instability,” Kliesen said. “In this vein, the possibility of increasing defaults in the commercial real estate sector in many large cities remains a concern.”
Kliesen predicts that the new year won’t bring the level of economic woes some have feared. “Looking into 2024, economic conditions are expected to deteriorate modestly, though real GDP growth and the pace of job gains are expected to remain positive, and inflation is expected to decline to around 2.5 percent,” Kliesen said in the November 2023 press release. “This outcome, should it occur, would seem to vindicate those who have long believed in the possibility of a soft landing for the economy.”