we turn the page on 2023 and reminisce on one of the most volatile lending climates in more than a decade, a compelling case can be made that 2024 will be brighter. There is no sugar-coating the sharp rise in interest rates over the last two years and its stifling effect on transaction volume and the availability of debt. 2023 brought the first wave of debt-related stress the self-storage industry has seen in some time. This materialized for borrowers who needed to refinance out of low interest rate debt into an interest rate significantly higher than the loan they repaid. However, with the Treasury index dropping 100 basis points between Halloween and Christmas, there are signs of optimism rippling through the capital markets. While there are a lot of unknowns hanging in the balance, 2024 might bring much needed relief and afford borrowers a slew of compelling opportunities to finance their assets.
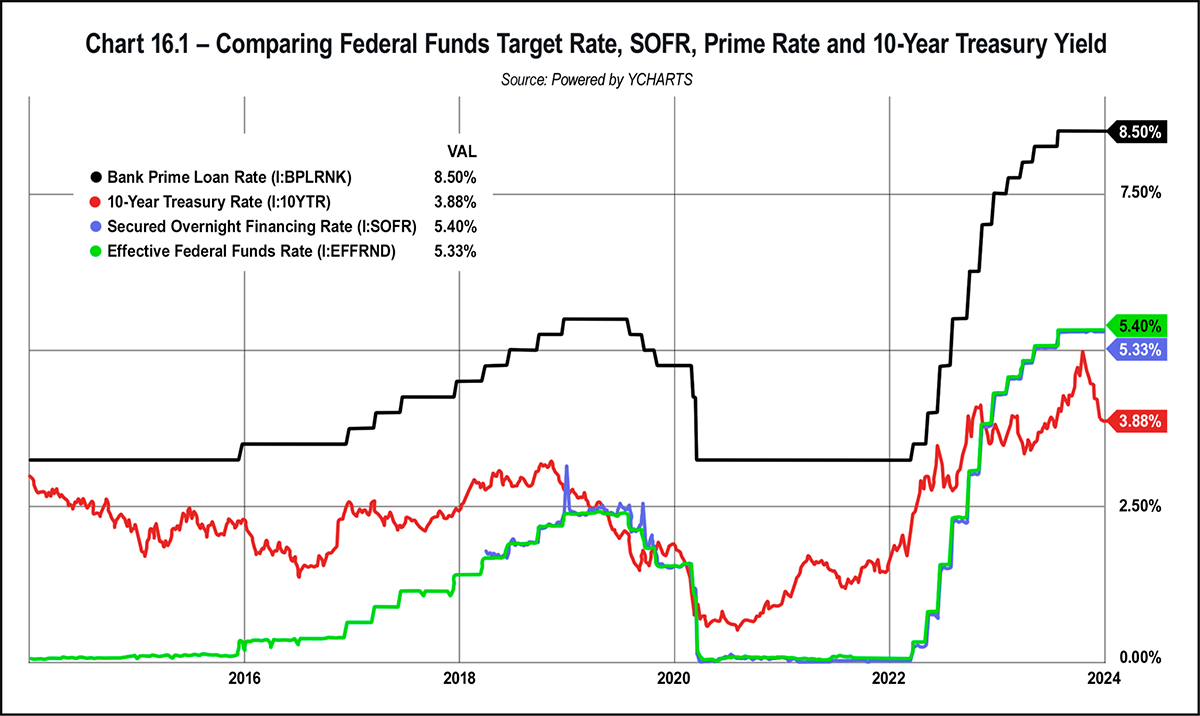
Understanding prevailing interest rates are among the most critical prerequisites for a borrower seeking financing. To put the coming year into perspective, a brief review of rate movement in 2022 and 2023 through the lens of the Federal Funds target rate is a good proxy of recent activity in the debt markets. The target rate was held near zero to spur economic recovery following the Financial Crisis in 2008. Finally, in December 2015, the target rate was increased, a milestone followed by several hikes thereafter. The onset of COVID-19 prompted an emergency meeting in March of 2020, when the Fed Funds rate was cut back down to 0.0 to 0.25 percent. This near-zero level persisted until March 2022 when the Fed began an aggressive campaign to curb rampant inflation. The Fed raised rates seven times to end 2022 at a range of 4.25 percent to 4.50 percent.
The Fed policy action of 2022 bled into 2023, albeit at a slower pace. The Fed hiked rates at four of the first five meetings for a total of 1 percent in an ongoing effort to win the battle against inflation. Between March 2022 and July 2023, the benchmark index increased 525 basis points (5.25 percent), marking the fastest increase since another inflationary battle in the 1980s. The movement can be broadly described and summed up as follows: Debt became even more expensive in 2023 than it was in 2022.
page 149.
It remains to be seen how the Fed Funds Rate (and thus Prime and SOFR) will move across eight meetings in 2024. Still, as seen in Chart 16.1, the 10-year treasury rate has fallen more than 1 percent since hitting a recent peak near 5 percent in October 2023. At the last meeting of 2023, the Fed forecasted that the Fed Funds Target rate would decline approximately 1 percent in both 2024 and 2025, likely by way of several quarter point rate cuts. Accordingly, fixed interest rates trended lower to start the year. Numerous lenders who previously suspended new originations have resumed lending. As always, external forces and events may indirectly affect capital markets. The ongoing war in Ukraine, unrest in the Middle East, rising insurance costs, and a banking industry awaiting new regulation changes are significant drivers of volatility, to name a few.
- LTV = loan amount divided by appraised value
- Debt yield = net operating income (“NOI”) divided by loan amount
- DSCR = NOI divided by annual debt service
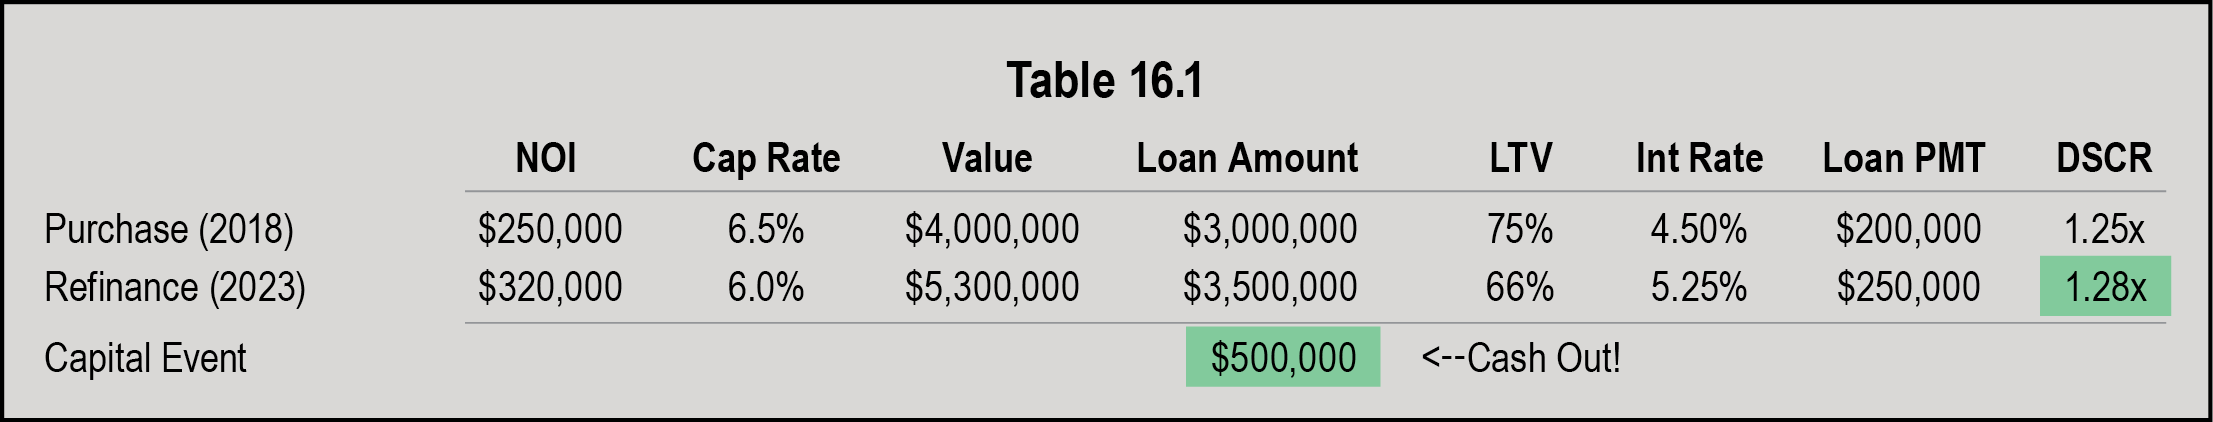
In times of rising interest rates, loan proceeds are more likely to be constrained by DSCR hurdles than either of the other two metrics listed above. For example, an asset with a $10 million valuation may not be eligible for a $7.5 million loan (75 percent LTV) if the in-place cash flow reports well below a 1.25x DSCR. The following capital stack example demonstrates the challenges faced in 2023 if refinancing was required rather than elective.
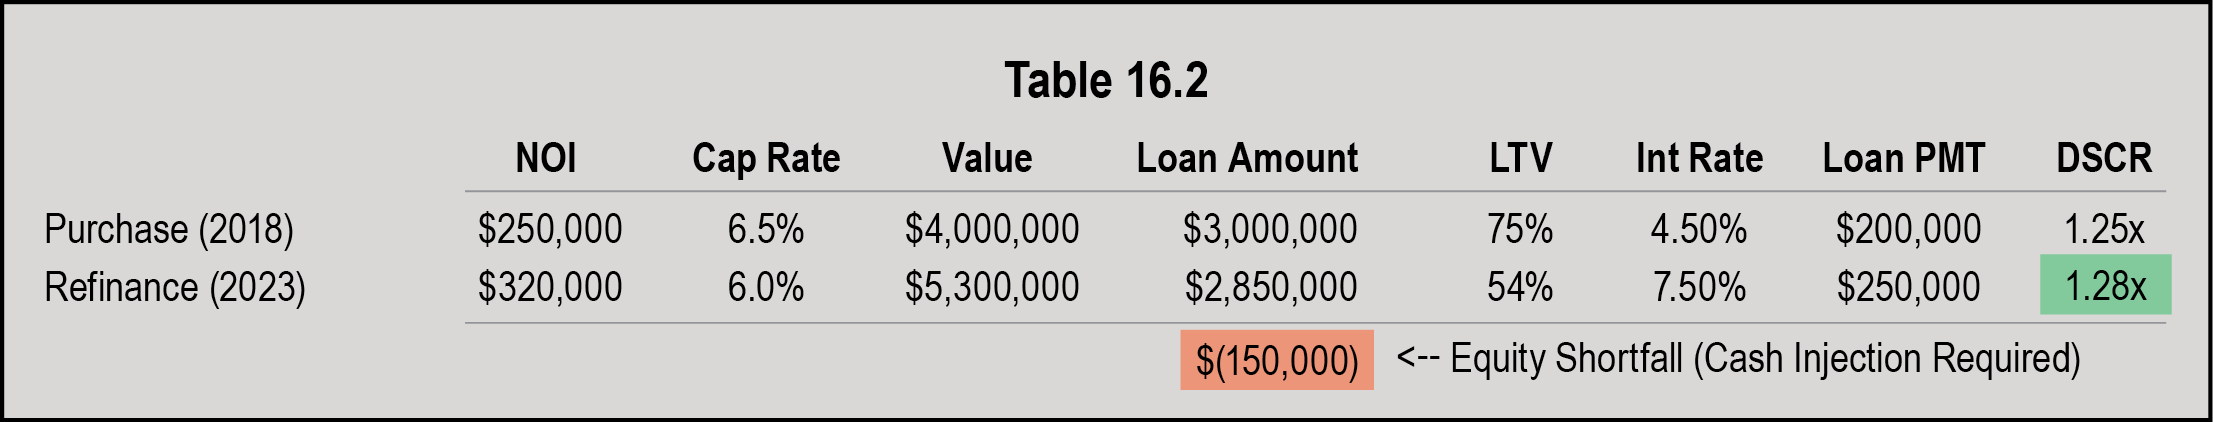
However, as readers are likely aware, the above situation did not unfold as planned. Rather, while values increased by virtue of lower cap rates and higher NOI in the years following acquisition, interest rates did not cooperate! Table 16.2 below demonstrates an equity shortfall situation that was fairly common this past year.
Not only does Table 16.2 illustrate an example of cash infusion required by means of an equity shortfall, but it also demonstrates a brutal reality regarding debt service payments. In both tables, total loan payment increased by $50,000 per year. However, in Table 16.2, this increase occurred in concert with a lower loan amount rather than a cash out.
A consequence of rising interest rates was a decline in property values by way of rising cap rates. Although cap rates did not increase in unison with interest rates, values were driven down in the last year. The transaction market was stifled with mismatched buyer and seller expectations. In addition, a softening of storage fundamentals has occurred in recent years, namely slower rate growth and lower occupancies. According to data from MJ Partners, Q3 2023 saw the REITs report same-store occupancies ranging from 88.5 percent to 94.1 percent, compared to 92.6 percent to 95.2 percent a year ago. Softness notwithstanding, if interest rates cooperate and begin to reverse course, 2024 could be a fruitful year for borrowers refinancing or acquiring property.
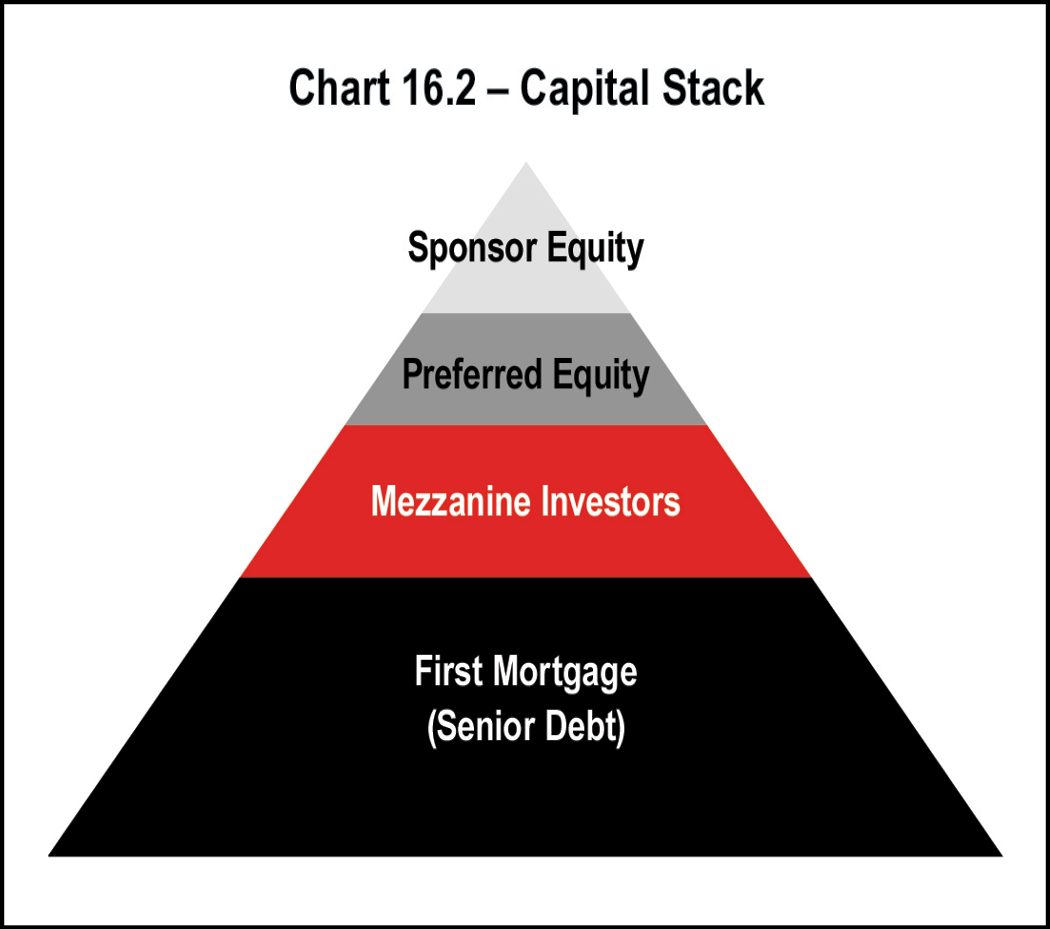
Chart 16.2 clarifies the capital stack; the pyramid shape is not purely coincidental. The level of risk and required rate of return effectively shrink from top to bottom. The top of the pyramid is the riskiest position as equity partners are last in line to receive proceeds. Meanwhile, senior lenders have priority on cash flow and inherently hold the least risky position. Lenders and equity stakeholders work hard to understand the risk profile of a deal going in, and price their offerings accordingly. Typically, the capital stack includes the following arrangement from greatest risk to least:
- Sponsor equity
- Preferred equity
- Mezzanine investors (hybrid debt and equity)
- First mortgage (senior debt)
The relative position of the stakeholders within the capital stack changes with the passage of time. As the mortgage principal is paid down, equity increases. Sponsor equity is subordinate to most debt. The value of sponsor equity can be calculated by subtracting the value of the higher priority positions from the asset’s market value.
The amount of equity a sponsor holds in an asset is important to a lender. A borrower with little or no equity stake in a property may have different interests than one with ample equity remaining, especially in the eyes of a lender. This does not discount long-term ownership where capital investments continue to be made into property to support and increase value.
Mezzanine debt and preferred equity are available in the market for larger transactions and under extraordinary circumstances. The pyramid graphic above shows these interests lodged between the senior loan and sponsor equity positions. Given that these loans are subordinate to senior debt, they are riskier and therefore command higher interest rates. Debt funds, which can serve as the senior lender or provide a level of hybrid debt, have become more popular lately.
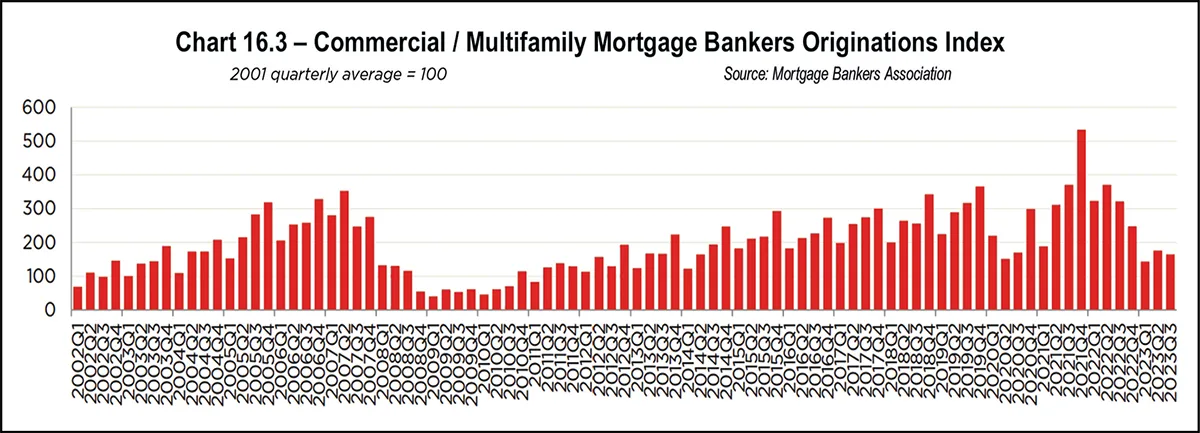
Total U.S. Commercial Mortgage-backed Securities (CMBS) issuance came back strong after the 2008 recession. However, the pandemic led to 2020 year-end CMBS issuance of just $56 billion. 2021 CMBS issuance rose to $109.8 billion, a 14-year high. At the end of quarter three 2023, total CMBS issuance sat at just $26.4 billion, less than half of the $63.3 billion through the same period a year earlier. This decline in volume underscores how rising interest rates hit the CMBS market particularly hard.
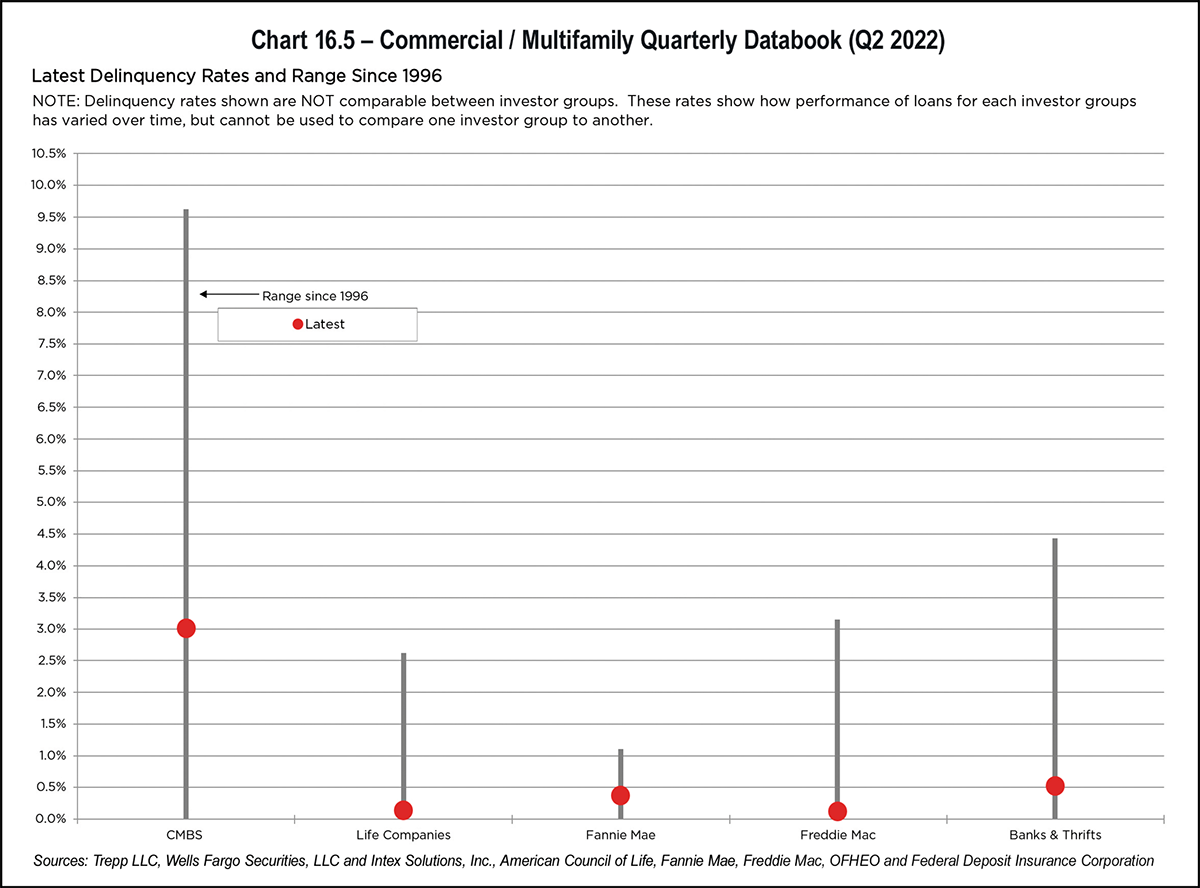
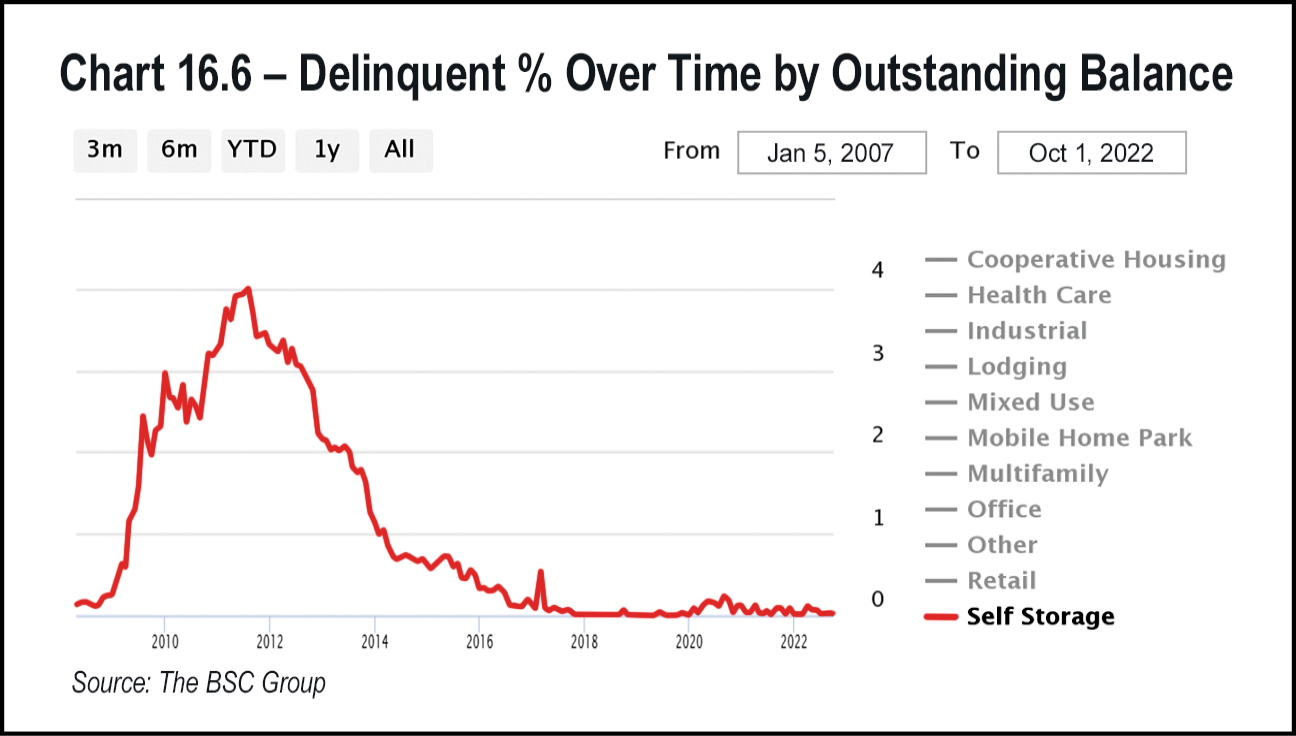
Self-storage reports favorable delinquency trends among its peers, outperforming all other property types. Per data historically available from the rating agency DBRS Morningstar, the delinquency rate for self-storage in the CMBS market peaked at 3.99 percent in 2011. This figure is still reported well below 1 percent and continues to outperform all other asset classes. Although nothing is perfectly recession-proof, industry experts have long speculated that self-storage is as close as it gets. Time will tell if this holds true, but storage enjoys demand drivers that work well in both good and bad times. See Chart 16.5 below and Chart 16.6 on page 154.
Since there is no cash flow during construction and breakeven doesn’t occur for some time after Certificate of Occupancy, construction loans are inherently more risky. Lenders increasingly look to make loans primarily to guarantors with strong balance sheets and significant development experience, in addition to requiring significant depository relationships.
It is important to arrange an upfront interest-only period until the property can cover amortizing debt service payments. This is coupled with an interest carry reserve until the property breaks even. One of the more costly flaws in development financing is underestimating the required lease-up time, a mistake which can, in a worst-case scenario, sink a development.
Lenders build debt service coverage tests into loan agreements and will stress test a project to see if it can cover interest-only payments after a predetermined number of months following completion. Eventually, lenders will test for principal and interest coverage. In addition to testing for project viability, this doubles as a lender safeguard.
The importance of thoughtful budgeting before beginning a project cannot be overstated. A feasibility study is essential; borrowers must go above and beyond to understand the market, including market rents and the competitive landscape, both in terms of existing and prospective projects.
Bridge lenders came into focus following the 2008 recession and were competing for deals more than ever before. In fact, bridge lenders were so inundated with storage deals that they had the luxury of setting more restrictive loan minimums. While these minimums can prove challenging for borrowers with smaller transactions, they are not uniform and shouldn’t discourage borrowers from seeking bridge debt.
Bridge loans are often non-recourse in nature and can be originated to include a fixed or floating interest rate, with flexible prepayment language. They will commonly involve three-year terms with extension options exercisable for a fee if the loans are performing. Rates vary significantly, but at the time of this writing, spreads range from roughly 300 and 600 basis points above SOFR. The loan fee structure is commonly referred to as “one in, one out,” because these lenders commonly charge an origination and exit fee of 1 percent of the loan amount.
Bridge loans are utilized for assets which are not producing stabilized cash flow; therefore, bridge lenders adopt a more forward-looking approach. In contrast to permanent lenders who are most concerned with in-place DSCR or Debt Yield, bridge lenders work carefully to understand the terminal or take out debt yield to inform their lending decision. One of the most significant shifts in bridge underwriting in recent years has been a move away from trended rent projections. In other words, lenders are not buying into double-digit rent growth to support the viability of a transaction. Instead, they will apply a stabilized vacancy to in-place rents or moderate rent growth over the loan term.
Assets requiring bridge loans are not in a position to cover interest-only debt service payments at origination, let alone amortizing payments. Consequently, bridge loans are structured with interest shortfall reserves to increase the likelihood of success of a borrower’s business plan. In some cases, these loans feature future funding components. Lenders may require additional collateral such as a cross-collateralization with another asset to get comfortable with the deal. This requirement provides additional credit enhancement for the lender. A bridge loan is not an appropriate long-term debt solution; however, it can be a flexible interim financing option. Even if interest rates decline in 2024, there is no doubt bridge loans will remain an important source of capital for certain storage borrowers.
Bank loans normally feature one- to five-year terms but can offer terms of 10 years or greater. Amortization schedules tend to be on the conservative side at 20 or 25 years. Despite historically being able to offer as high as 80 percent leverage, today it is rare for a bank to comfortably exceed 75 percent leverage given DSCR constraints.
Banks will generally require personal recourse guarantees on almost all loans; however, the amount of recourse may be reduced or eliminated for low-leverage loans and for institutional sponsors where active relationships exist. Transaction costs for bank deals are generally reasonable, and prepayment structures can be negotiated.
Credit unions have been an increasingly relevant financing source for self-storage borrowers in the face of rising borrowing costs. Credit unions are similar to banks with several key differences. Banks tend to be extremely relationship driven, while credit unions may be more transactional in nature. Some credit unions exhibit a greater willingness to lend outside of a predefined footprint and are comfortable lending without a preexisting relationship. Credit unions rarely have deposit requirements and may be in a position to offer better interest rates than other lenders given their status as not-for-profit institutions.
While credit unions have shined in the face of rising interest rates, this is not to assert that credit unions are better than banks. In fact, there are situations where credit unions fall short or simply are not an option for borrowers. Indeed, credit unions can be stricter on cash-out requests and are more likely to quote a tighter amortization period. Holding interest rates constant, shorter amortization schedules result in higher debt payments, even while accelerating principal paydown. Finally, most credit unions are not equipped to handle construction or other transitional deals that require draws and the carrying of interest.
During the pandemic, SBA financing was a great alternative for deals that would have otherwise landed in CMBS or another similar product. SBA products are priced over the Prime rate, which was quite compelling at that time but has since skyrocketed to 8.5 percent since March 2022. Both products were once routinely priced at a fixed rate over Prime, but banks originating SBA debt have primarily moved to a floating rate product recently. The floating rate product will benefit borrowers, assuming rates decline in 2024 and thereafter. The SBA maintains a maximum exposure per borrower of $5,000,000 (with some exceptions) on the government guaranteed portion. As a result, the 7a loan program typically maxes out at $5,000,000, while the 504 program, which includes a bank originated first mortgage in addition to the SBA piece, can handle larger transactions.
7a loans, similar to 504 loans, can be utilized to fund acquisition, refinance, and construction. These loans are commonly floating-rate products structured with a Prime-based interest rate that resets quarterly. 7a loans include a fully amortized 20- or 25-year schedule and have a 5 percent-3 percent-1 percent prepayment schedule; the 7a program notably features a more compelling prepayment schedule than its 504 counterparts.
In construction lending, it is becoming more difficult to finance projects through the SBA at desired leverage points. Although SBA loans technically provide leverage of up to 90 percent, many projects pencil only at lower leverage. This is a result of rising interest rates in conjunction with the SBA requiring that a project break even on an amortizing basis within 24 months of receiving the Certificate of Occupancy.
Interest rates for SBA loans are priced over Prime, ranging from 0 percent to 2 percent over, or 8.5 to 10.5 percent all in. Borrowers are subject to guarantee fees at a percentage of the loan amount on top of standard closing costs. SBA loans are document-intensive and time consuming to close. When applying, find a lender that is Preferred Lender Program certified. This allows the bank to approve loans on behalf of the SBA, which can speed up closing. A shift in SBA operating procedures was recently implemented which opens a previously closed door for borrowers planning to engage larger third-party management companies, such as a REIT. SBA loans have proven beneficial to many borrowers and will continue to be a useful option in 2024.
Interest rates for CMBS transactions, like most loan products, are computed by adding a risk spread premium to a benchmark index such as a U.S. Treasury rate. For example, if spreads were in the 3.0 percent range and the 10-year treasury rate is 4.0 percent, the corresponding rate on 10-year CMBS money would be 7.0 percent. CMBS interest rates are priced at 250 to 350 basis points over the applicable Treasury at the time of this writing. There is an option to buy down rate for a set fee (1 percent buys down the interest rate by roughly 15 basis points for a 10-year deal, while the same 1 percent buys down rate roughly 25 basis points for a five-year product). These lenders prefer primary-market deals, but they will compete for loans in secondary markets as well. Location is one of several qualitative factors that can impact base pricing in CMBS.
CMBS loans are 10-year fixed-rate loan products including a 30-year amortization schedule following any interest only associated with the loan; five-year CMBS loans are available but may carry a pricing premium. There has been a proliferation of five-year CMBS deals in direct response to market demand. This shift in conjunction with six months open prepayment at the end of the term increases flexibility and could continue to be a popular option as rates decline. Borrowers can utilize the CMBS loan product to achieve several structural advantages such as non-recourse, multiple years of interest only or to facilitate a cash out. Historically, borrowers could achieve 75 percent leverage, however, higher interest rates have put downward pressure on leverage as deals are commonly DSCR constrained. Finally, the CMBS loan is a product which can close quicker than many of its counterparts. All of the above traits are distinguished advantages of the loan type, but the CMBS product is not without its drawbacks.
Restrictive prepayment options limited to yield maintenance or defeasance are pitfalls of the product type. Defeasance is the act of replacing the collateral that generates the anticipated stream of debt service payments, often with a portfolio of varying maturity, multi-denomination securities. Defeasance can be difficult to execute given the time and complexity required to secure the replacement collateral. Both defeasance and yield maintenance penalties are less severe in a rising interest rate environment. In fact, the current interest rate environment may present a compelling opportunity for those looking to refinance a CMBS loan as the rates of the day are often significantly elevated compared to the rate attached to the loan being prepaid.
CMBS normally features higher closing costs and more rigid loan documents than other loan types. However, a few CMBS lenders offer competitive fixed closing cost programs between $25,000 and $32,000 all-in for loans up to $10 million as part of a small balance loan program.
Because CMBS loans are pooled together and sold as a securitized bond in the secondary market, the loan documents have many non-negotiable standard clauses and requirements. Additionally, the loans are most often serviced by a third-party, rendering any post-closing structural changes more challenging.
Given their conservative nature, Life Companies put an emphasis on stressing cash flow and cap rates, in addition to mandating higher going in DSCRs. It is no surprise that these loans are frequently constrained at lower leverage than their counterparts. Many Life Companies have historically preferred larger loans ($10 million and up) but will stretch down for the right deal to compete with other loan products.
Life Companies can quote terms ranging from five all the way up to 30 years, with a variety of amortization schedules available. Life Company products are often quite reasonable from a transaction cost standpoint, and these lenders can negotiate flexible prepayment terms. The lenders may offer a forward rate lock agreement with a signed application at their discretion. Given a core focus on conservative underwriting and low leverage, it may not come as a surprise that Life Companies’ interest rates are currently the lowest in the market. At the time of this writing, Life Company interest rates vary depending on the lender but are among the only products which can be originated with an interest rate in the 5s.
Life Company loan products have been a great source of capital for the self-storage industry, assuming storage properties meet the lenders’ criteria. It is worth mentioning that almost any structural feature one can think of could be a point of negotiation if the deal is favored by a Life Company. Because of the tremendous track record of self-storage against other property types, insurance lenders have and will continue to have an appetite for self-storage in 2024.
Many recent developments have been built based on operating projections that are no longer adequate to make monthly loan payments or achieve the expected stipulations given the increase in interest rates. Additionally, a softening of rents may lead to a decline in operating income for more stabilized assets, making it more difficult to pay debt service. Whether because of rising rates, delays in construction, increases in development cost, or downward pressure on rental rates, some deals will certainly end up “stuck in the mud,” and in need of some creative solutions. This is all in addition to the situation outlined in the capital stack example relating to stressed debt on stabilized assets.
Subordinate debt is a blanket term for additional financing with a lower priority to cash flow than the first lien mortgage. This type of debt can provide more capital and higher leverage to help bridge an equity gap. Subordinate debt lenders in the current market will take a capital position between the first mortgage cut off, reaching up to 85 percent LTV or sometimes even higher.
By reaching higher in the capital stack, subordinate lenders inherently assume greater risk and therefore expect a higher rate of return. Interest rates on subordinate debt available in the market today range from 10 percent to 20 percent. Subordinate debt lenders can be flexible and willing to structure payments to match the cash flow projections of the specific asset. For example, the debt might feature interest-only payments for several years before any amortization. In some cases, lenders offer interest only for the full term.
The two most common subordinate debt products are junior mortgages (B-Notes) and mezzanine financing. Mezzanine lenders provide subordinate debt that is secured against an ownership position in the borrowing entity, rather than the mortgaged property itself. Conversely, B-Notes take a secondary debt position secured by the mortgaged property as collateral for the loan. This mortgage is junior in priority to the first mortgage or senior note, (the A-Note), hence the nomenclature.
There are situations where cash flow erosion is dramatic enough that the available cash from operations no longer supports the debt service payments. In extreme cases, the corresponding value decline may be so severe that the sponsor’s equity is completely eroded. In these situations, the sponsor may be required to infuse new equity into the transaction. If the sponsor does not have the equity, one option is to seek joint venture equity. Joint venture equity is selectively available to owners in transactions where there is upside, stemming from a development or recapitalization scenario and resulting in enhanced cash flow and consequent value.
An experienced broker understands how to properly package a loan request and appropriately position the asset to the lending community. Lenders faced with a stack of potential deals are more likely to engage in a succinct, digestible presentation than a collection of scattered documents. A broker’s expertise is the result of being in the market every day and constantly evaluating available debt products offered by lenders.
Brokers charge for their services, but many borrowers will confirm that the fee paid to a competent broker is worth the peace of mind that comes with a smooth execution. Finally, in addition to aiding with the closing, hiring a broker also frees up borrowers to pursue value-add strategies such as acquiring new facilities or expanding existing ones.
There is room for improvement in both the underlying indexes and credit spreads to bring interest rates to a more palatable level. Even if interest rates do not drop significantly in 2024, opportunities remain to finance existing and new projects. Self-storage has historically thrived in the face of adversity. In fact, the asset class has reacted positively to material changes in economic conditions many times. Storage fundamentals have endured despite pullback from staggering growth post-pandemic. Although 2023 cultivated financing challenges via rising interest rates, there are numerous reasons to be cautiously optimistic in 2024.