Section 12 RV & Boat Storage
T

he RV/boat storage sector has come into the spotlight in recent years, as investors and traditional self-storage owners have been on the lookout for the next self-storage. Indeed, the sector has many of the same characteristics that have made self-storage attractive for years: a highly fragmented industry with low operating costs and high margins, strong and growing demand with limited supply, and high potential for income growth. Investor interest in the emerging niche asset class has led to increased transaction volume and pricing in recent years, while development, although picking up, has failed to keep pace with the increased demand for parking.

RV/boat storage is viewed as a subsector of the self-storage property type, as many traditional self-storage properties include parking spaces for RVs and boats, as well as commercial and personal vehicles. However, many of these properties lack the amenities and services that are in demand from the modern RV/boat owner. While some new supply in recent years has aimed to suit these needs, there does seem to be a supply and demand imbalance that presents a unique opportunity for investment and consolidation in the sector. Success investing and operating in RV/boat storage will rely on intimate market and trade area knowledge, as well as insight into the unique characteristics of the property type.

Chart 12.1 – Recreational Vehicle Sales and Growth
Part of the increased awareness of the sector is due to record consumer demand for RVs and boats in recent years; a variety of factors have led to increased interest in domestic travel and outdoor recreation. Nationally, RV registrations increased 22 percent between 2017 to 2021. RV sales dropped in 2022 to around 493,000 from 2021’s record level over 600,000, but remained well above the historical average of 360,000 sales per year going back to 2000. Boat shipments remain elevated and were at an all-time high in August 2023. All of this translates into higher demand for facilities to store vehicles, as many parts of the country do not allow owners to park RVs and boats at their homes or on streets. See Chart 12.1 at right.

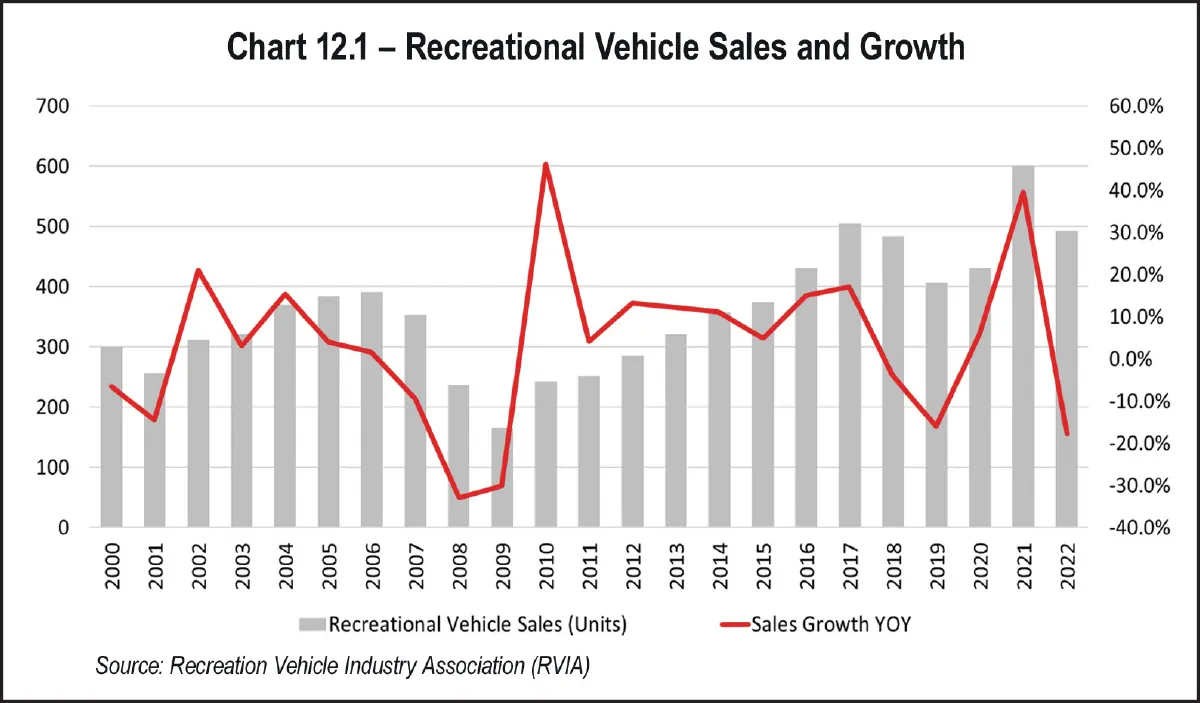
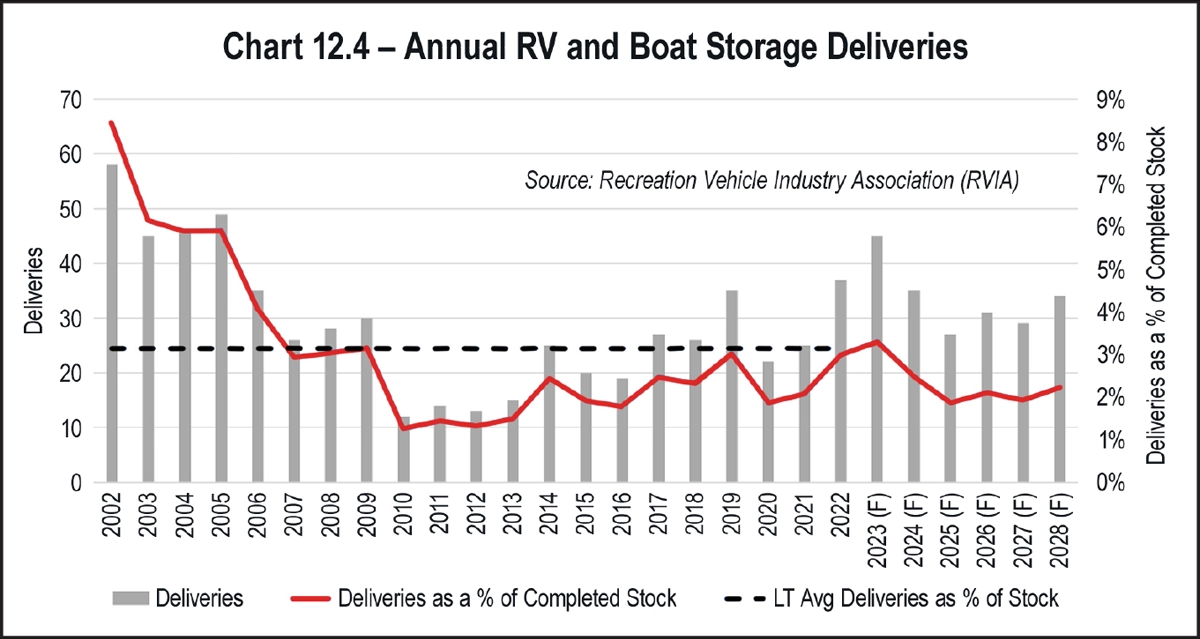
At the same time, development of RV/boat storage facilities has failed to keep up with demand due to unique supply constraints, including the amount of land needed to develop a facility, the cost of construction, and difficulty getting through the entitlement process. Yardi Matrix tracks 1,380 dedicated RV/boat storage properties in 42 states. Although RV registrations increased 22 percent from 2017 to 2021, the number of RV/boat storage facilities only increased 9.8 percent during this period. And although supply picked up in 2022, annual deliveries as a percent of stock has only averaged 2.6 percent for the last five years, below the average going back to 2000 and well below the average for traditional self-storage properties of 4 perent supply delivered annually.

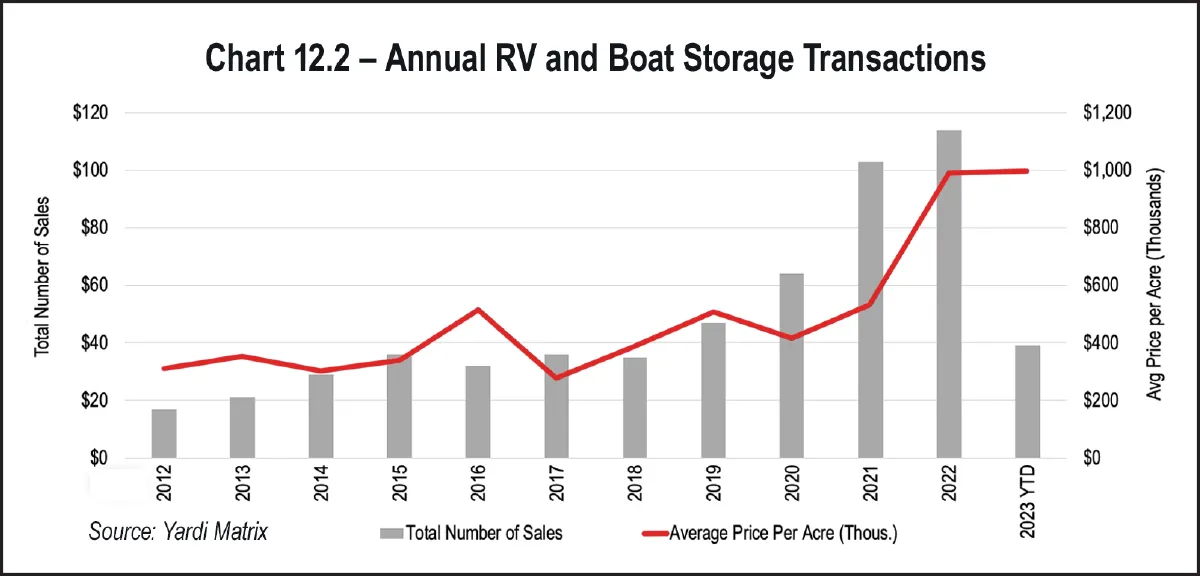
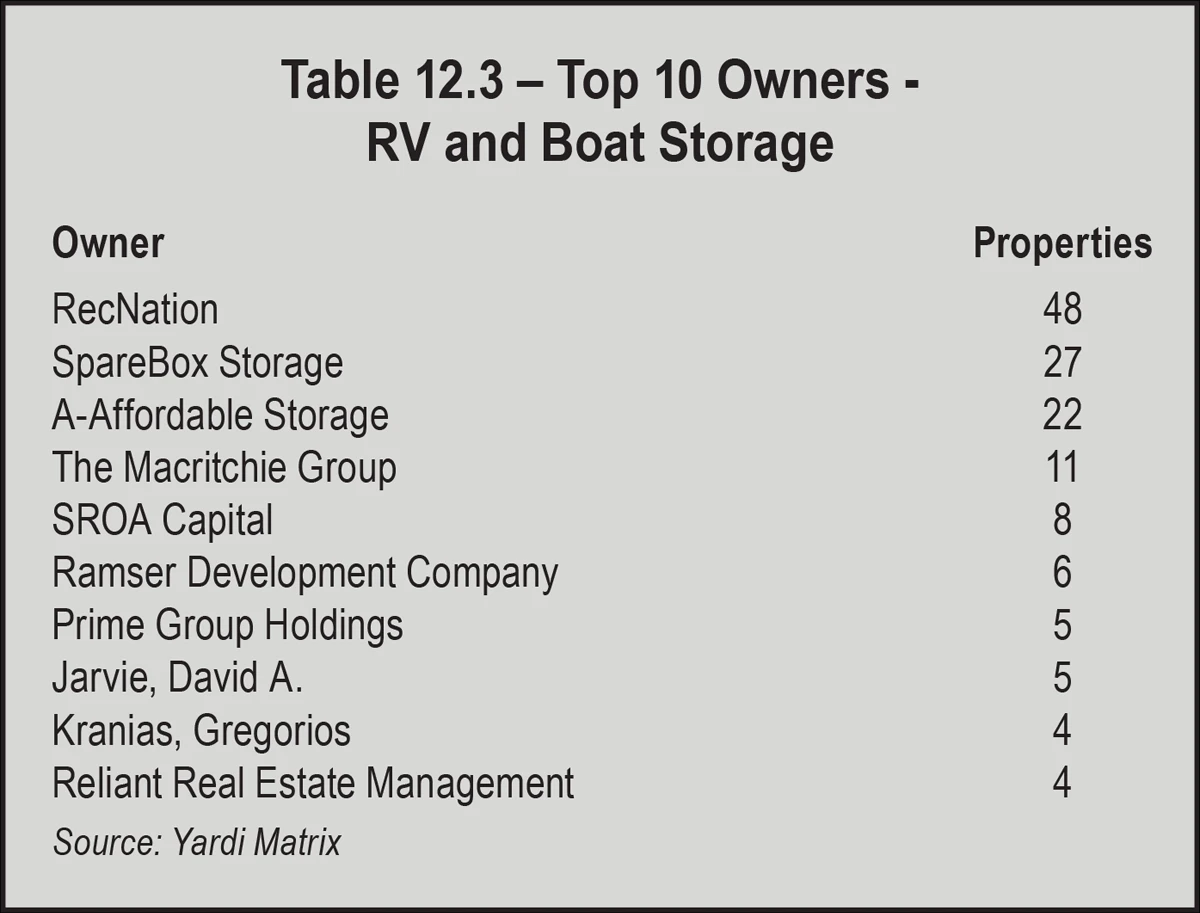
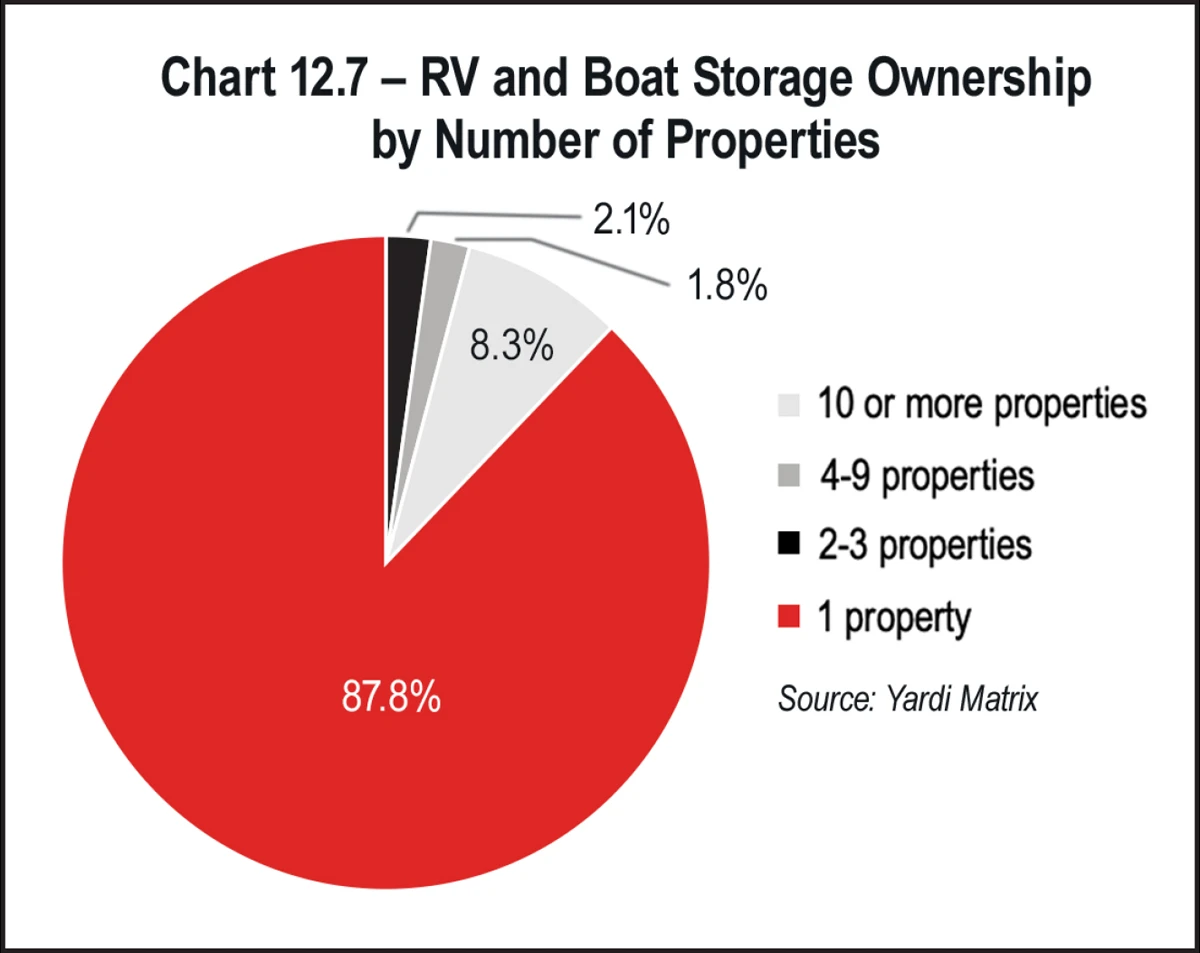
These supply and demand characteristics, and an overlap with self-storage, have drawn attention to the property type in recent years; transaction volume and pricing have soared in response. According to Yardi Matrix data, there was a record 114 RV/boat storage sales in 2022, and 103 in 2021, compared to an average of 42 sales per year from 2015 to 2020. The average sales price for RV/boat storage properties has risen to close to $1 million per acre in 2022 and 2023, compared to $428,000 per acre from 2015 through 2020. Much of the increase in volume and pricing recently has been from large owners/operators, who are mostly new entrants to the sector, aiming to build a national brand. Still, 88 percent of properties are owned by an individual or entity with a single property. This means the sector is ripe for consolidation and large investors and operators can take advantage of economies of scale and operational expertise. See Chart 12.2 below.

Chart 12.2 – Annual RV and Boat Storage Transactions
Regional Supply And Demand Factors
Like traditional self-storage, RV/boat storage supply and demand has regional differences and nuances that should be understood when choosing a market and location for investment. According to the RV Industry Association, ownership varies significantly by region, with the Western states counting 25 RVs registered per 1,000 residents, followed by the Midwest with 23 RVs registered per 1,000 residents and the Southeast with 15 RVs per 1,000 people. The Northeast has the fewest at 10 RVs per 1,000 residents. At a state level, RVs registered per 1,000 persons ranges from 4.5 in New Jersey to 117.2 in Montana. This data suggests that RV ownership corresponds with urbanization patterns and access to recreational amenities, and the concentration of RV/boat storage properties has similar regional variances. See Chart 12.3 below.
Chart 12.3 – RV Sales per 1,000 Residents by State
This is not to say that there is not demand for parking in the Northeast or more urban markets. In fact, six of the states with the strongest growth in RV registrations from 2017 to 2021 are in the Northeast, including New Jersey, which saw registrations grow 43 percent during this time period. Additionally, many urban and suburban markets have some of the strongest restrictions on RV and boat parking, while residents in states with the lowest population density and highest prevalence of RVs and boats may have more land available for parking on their property.

On the supply side, calculating RV/boat storage supply can be challenging since most RV/boat storage properties have very little, if any, enclosed parking space that shows up in property records. Of the dedicated RV/boat storage properties in Yardi Matrix’s database, only about half include enclosed parking spaces; a vast majority have mostly uncovered parking spaces. Additionally, many traditional self-storage properties include parking, which can make up a very small or very large portion of their rentable area. Data from a large self-storage operator shows that half of their properties include some parking for rent, averaging 4,844 net rentable square feet of parking at those properties. However, at a property level, parking net rentable square feet ranges from 100 square feet to over 200,000 net rentable square feet of parking. This makes sizing the overall market or calculating saturation for parking (i.e. parking spaces per household or rentable square footage per capita) extremely difficult to do.

Like traditional self-storage, RV/boat storage supply and demand has regional differences and nuances that should be understood when choosing a market and location for investment.
Using typical parking ratios and an average parking square footage for traditional self-storage properties, then applying them to Yardi’s database of dedicated RV/ boat storage properties and traditional self-storage properties that include parking for rent, we can make some inferences about parking supply and saturation by market. The RV & Boat Development Handbook estimates that roughly 35 percent of land can be used for parking, and Yardi Matrix research on a sample of properties confirms this estimate. Applying this ratio to land available for open or covered parking (total land square footage less enclosed square footage) and adding this to the estimated amount of enclosed parking space for Yardi’s 1,380 RV and boat storage properties gives us a total of 201 million net rentable square footage at RV and boat storage properties. For the 13,691 traditional self-storage properties offering parking spaces for rent in Yardi’s database, we can use the average of 4,844 parking square footage observed in the large operator’s data, which adds up to an estimate of 66 million net rentable square feet of parking. The result is an estimated 267 million net rentable square feet of parking nationally, with 75 percent at dedicated RV/boat storage properties and 25 percent at traditional self-storage properties.

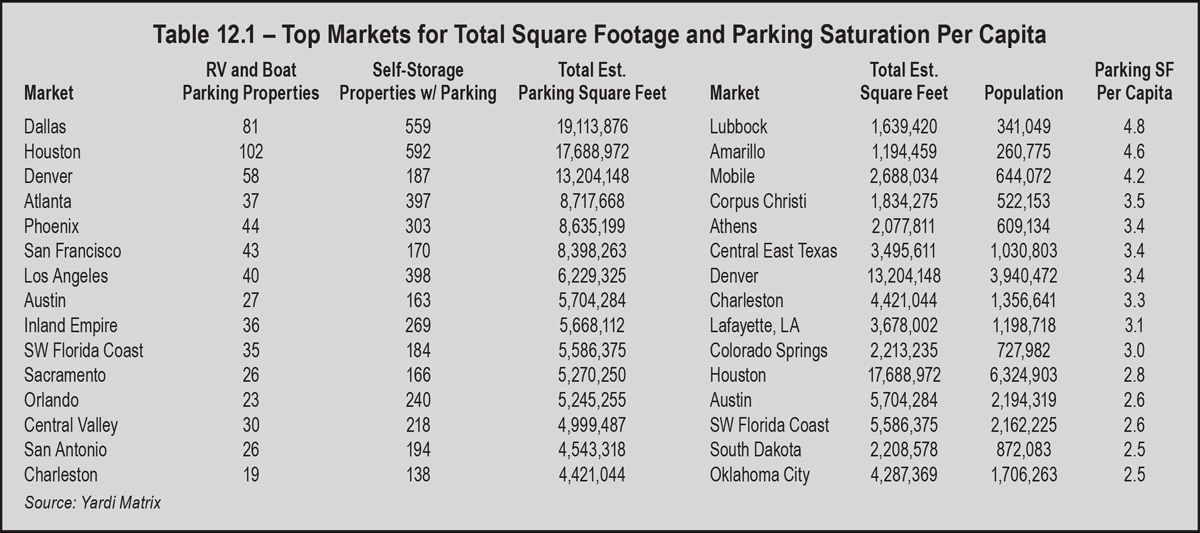
Using this methodology, the top markets for total square footage and parking saturation per capita are shown in Table 12.1 below. Dallas and Houston have the most net rentable parking square footage nationally with 19.1 million and 17.7 million square feet, respectively, distantly followed by Denver, Atlanta, and Phoenix. A few smaller markets have very minimal parking space, including Lafayette, Ind.; Honolulu, Hawaii; and Scranton, Pa., all with less than 100,000 net rentable square feet. Applying market population estimates, it seems smaller Texas and Sunbelt metros and Denver have the highest square footage per capita (all over three square feet per person), while New York, Philadelphia, and Baltimore are on the list of markets with the lowest parking saturation (under 0.25 square feet per person). This provides some context for rent levels, which are highest in some of the markets with the least supply, like Honolulu, Baltimore, and New York.

Table 12.1 – Top Markets for Total Square Footage and Parking Saturation Per Capita
New Supply
New supply has picked up in recent years, as developers have paid close attention to demand trends, and the more popular property types like apartments and self-storage have become more expensive. Nationally, Yardi Matrix forecasts there to be 45 new RV/boat storage facilities completed this year, equal to 3.3 percent of stock and up from 37 deliveries last year (or 3 percent of stock). Although new supply is picking up, supply as a percent of stock is still in line with the long-term average of 3.1 percent deliveries annually, and the increase seems warranted given the surge in demand in recent years. Despite declining RV sales recently, the return to the office may bring some RVs off the roads, notably in some more urban markets, and a weakening economy and higher interest rates may make it harder to resell an RV. Finally, similar to self-storage, Yardi’s forecast for RV/boat storage calls for slower supply growth after this year as interest rates and development cost increases continue to make it more difficult to develop. See Chart 12.4 below.
Chart 12.4 – Annual RV and Boat Storage Deliveries
Predictably, much of this new supply is following where people are moving or have moved in recent years. State-to-state and county-to-county migration reached new heights during COVID, fueling demand in the Sun Belt, particularly Texas and Florida, and in smaller secondary and tertiary markets. New supply in 2023 will be most significant in Dallas, which has 11 RV/boat storage projects set to deliver this year and could see slower rent growth because of the new supply. Besides Dallas, Denver, Phoenix, and San Antonio all have multiple stores (two) delivering this year, but only Phoenix has an ongoing multistore pipeline in the coming years. Phoenix could have 15 RV/boat storage properties delivered from 2024 through 2028, the highest long-term new supply of any market. Phoenix is followed by Southwest Florida Coast (North Port, Ft. Myers, Naples) with 10 properties forecasted to deliver over the next five years.
Since 2018, three markets have had their first and only RV/boat storage property deliver, while some high-growth markets (like Boise, Huntsville, and Nashville) have seen multiple stores deliver, more than doubling their store count.
Table 12.2 - Highest Parking Rates Relative to Self-Storage
Many other markets have one new project in the pipeline, representing a significant percentage of a low base. One example is Little Rock, which only has two existing RV/boat storage properties and could see some weakness from one new competitor delivering this year, but potentially not because the market already seems undersupplied. Other places, like Boise (four existing stores); Greenville, S.C. (six stores); Charlotte (eight stores); and Nashville (10 stores), should be able to absorb one new store delivering in 2023 as they have been magnets for domestic migrants in recent years.

Since 2018, three markets have had their first and only RV/boat storage property deliver, while some high-growth markets (like Boise, Huntsville, and Nashville) have seen multiple stores deliver, more than doubling their store count. Again, Dallas has had the most new supply, with 24 properties built since 2018, followed by Southwest Florida Coast and Phoenix with 10 new RV/boat properties each. Much of the new supply built recently is higher quality product, better suited for the needs of the modern RV owner. Over 75 percent of properties built since 2018 are paved, versus 53 percent of properties built before 2018. Nearly 50 percent of properties built since 2018 have covered parking spaces, versus only 27 percent of properties built prior to 2018. And 29 percent of properties built since 2018 have a dump station, one of the most in-demand amenities, versus only 16 percent of properties built before 2018. All of these data points suggest that much of the RV/boat storage nationally is underimproved and there is a vast opportunity for new supply to offer modern amenities. Additionally, there are many older properties that would benefit from renovations and the addition of some of the amenities that are in-demand today, like a dump station, air and water station, and washing bays.

Chart 12.5 – Parking Asking Rents vs. Self Storage - Top Unit Sizes*
RV/Boat Storage Rents
Yardi Matrix tracks asking rates monthly at a majority of the RV/boat storage and self-storage properties with parking in its database. The time series chart (Chart 12.5 on the opposite page) shows a composite of the most common parking space configurations, including 10-by-20, 10-by-25, 10-by-30, 12-by-30 and 12-by-40, both climate-controlled and non-climate-controlled units, compared to the average for the six most common self-storage unit types. Composite rents are a simple average of these unit types and expressed as an annualized per square foot number. As of September 2023, annualized rents per square foot of $6.14 for parking spaces were approximately 64 percent below rents of $15.98 for the most common self-storage unit types, and further below for dedicated RV/boat storage properties since they are more likely to be unpaved and uncovered.

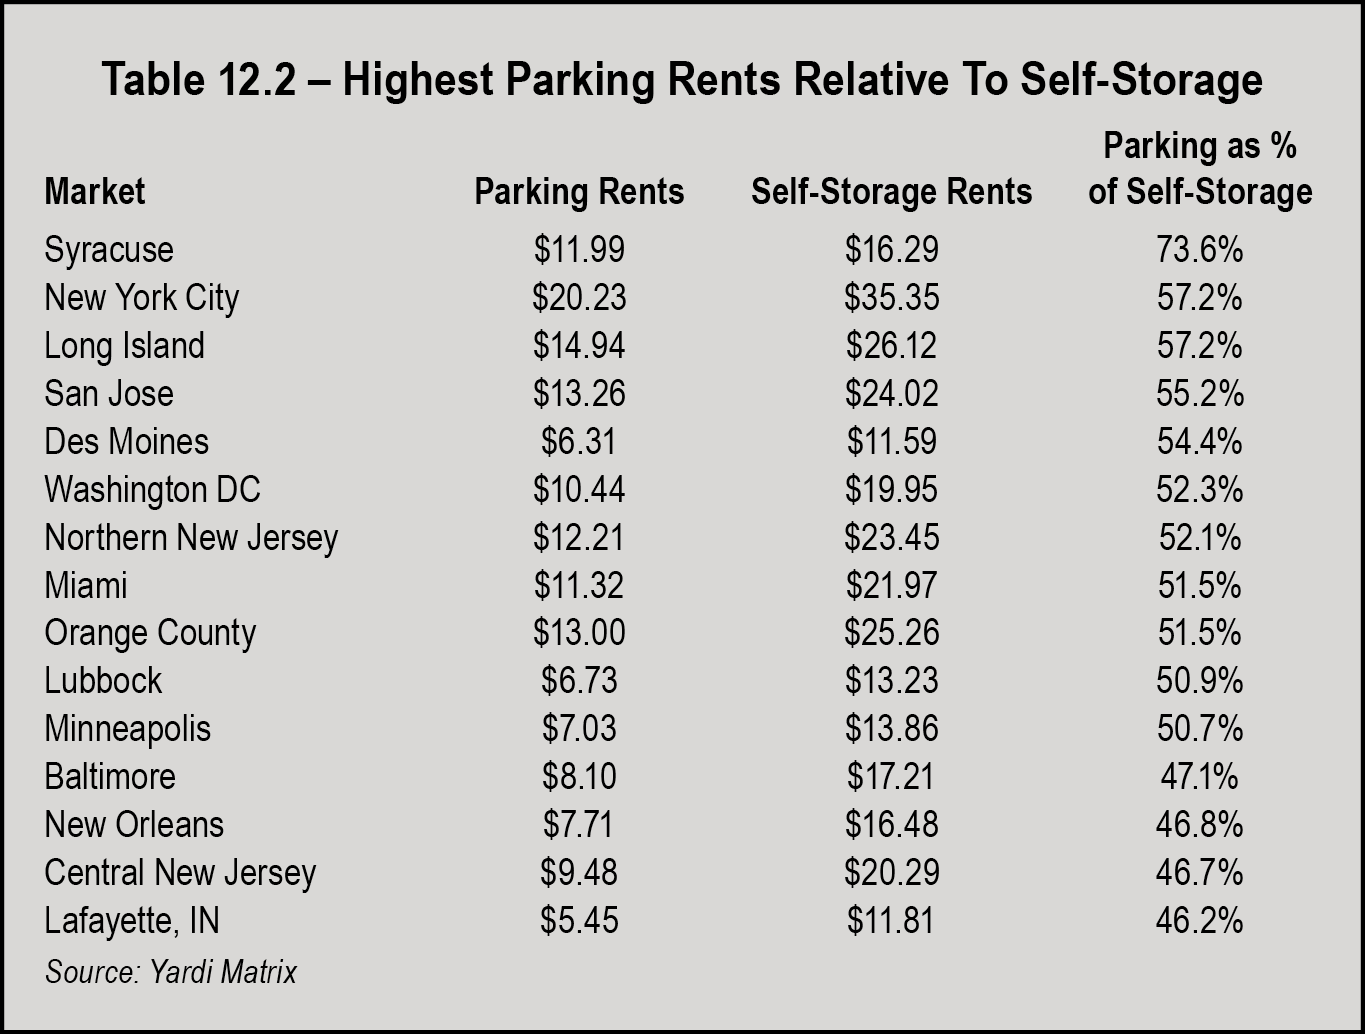
At a market level, the difference in parking rents versus traditional self-storage can be much lower or higher depending on local supply and demand factors. Table 12.2 below shows the markets with the highest parking rents relative to traditional self-storage. Parking rates are usually highest versus traditional self-storage in markets with limited parking supply, places like New York, San Jose, Miami, and Orange County. Other markets, like Des Moines, Lubbock, Minneapolis, and Lafayette, have relatively low self-storage rates and/or low levels of supply and solid demand.

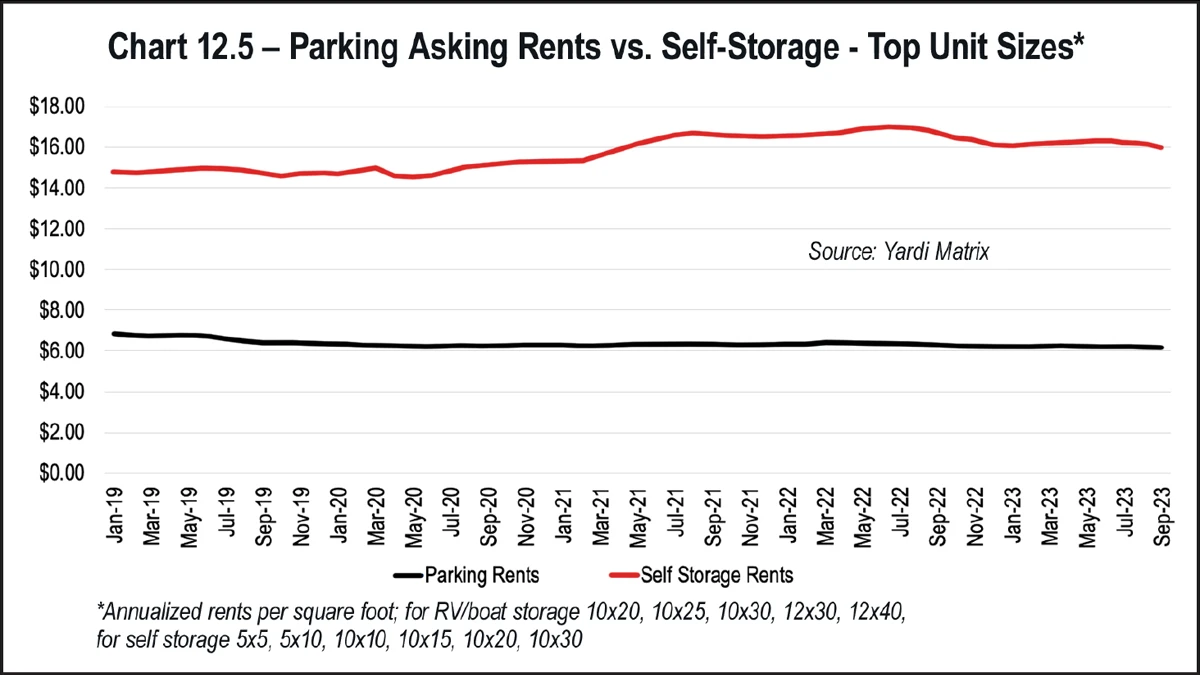
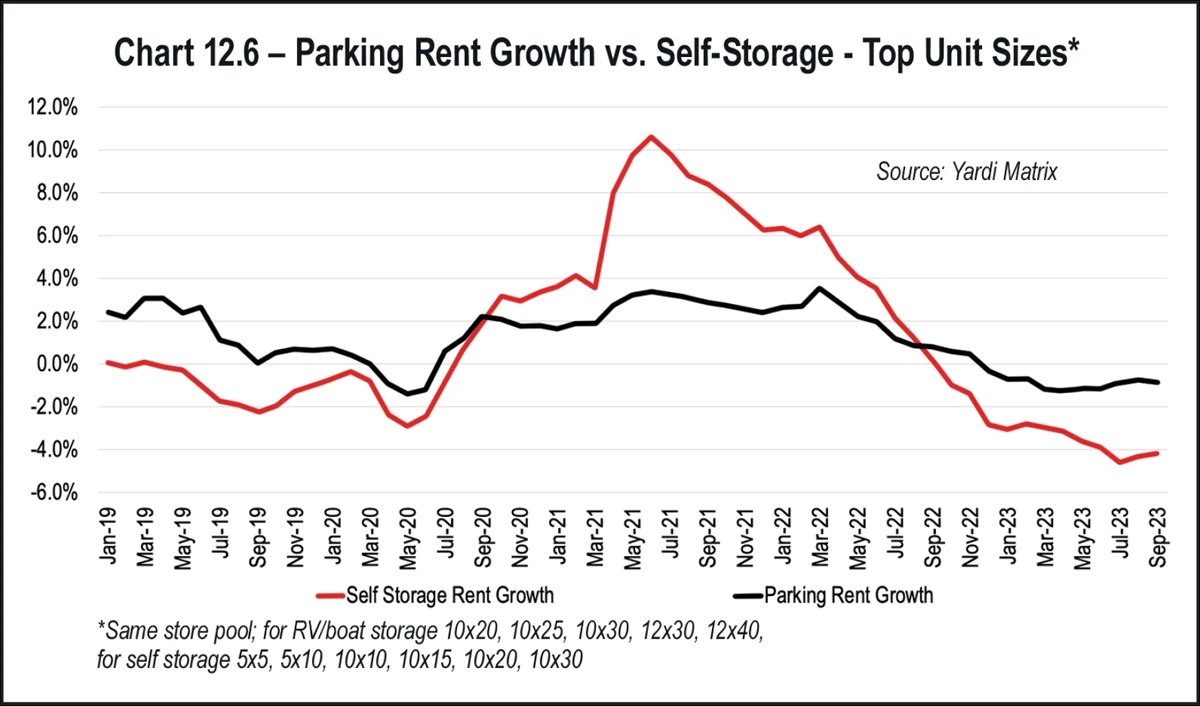
Rents for parking have drifted down over the past several years, partly the result of greater dedicated RV/boat storage coverage. Parking rents also did not experience the same dramatic increase during COVID that self-storage did when the sector was benefitting from surging demand from record-high migration. However, recently same-store rent growth for parking spaces has not experienced the same widespread declines that self-storage has experienced; instead, it’s been more flat and steady, catching the attention of developers and investors. Parking rent growth has outpaced traditional self-storage since September 2022. As of September 2023, parking rents were down 0.8 percent year-over-year versus -4.2 percent for self-storage. Parking rents have actually increased in a number of markets, including many smaller markets and in New York and Charlotte. See Chart 12.6 on page 126.

Chart 12.6 – Parking Rent Growth vs. Self-Storage - Top Unit Sizes*
Current Ownership And Investor Demand
Investor interest in the RV/boat parking sector has never been higher, as indicated by the record number of sales over the past few years. Despite the interest, ownership in the sector is still highly fragmented, much more than traditional self-storage, which has prominent national brands. Yardi Matrix tracks underlying ownership beyond the LLC level, which reveals a few large owners in the sector with national brands, including RecNation, SpareBox Storage, A-Affordable Storage, The Macritchie Group (dba Honey Bee RV and Boat Storage), and SROA Capital (dba Storage Rentals of America)—all of which have eight or more properties nationally. Still, these top five owners own only 116 properties, or 8.4 percent of dedicated RV/boat storage properties nationally, compared to self-storage where, following the Extra Space/Life Storage merger, the top five owners/operators control 7,810 properties, or 15.3 percent of all properties nationally, according the 2023 Self-Storage Almanac. Furthermore, nearly 88 percent of all RV/boat storage properties are owned by an individual or entity with a single property, compared to only 35 percent of self-storage properties that are owned by someone with only one property. See Chart 12.7 and Table 12.3 below.
Table 12.3 – Top 10 Owners - RV and Boat Storage
Chart 12.7 – RV and Boat Storage Ownership by Number of Properties
Much of the acquisition activity over the past few years has been done by new entrants to the market that recently raised large funds for the acquisition of RV/boat storage properties, including a number of the companies listed perviously. Of the 320 properties sold since 2020, 46 have sold to RecNation, 26 to SpareBox, nine to The Macritchie Group, and seven to Storage Rentals of America, making up most of their current portfolios of RV/boat storage. RecNation, a private real estate investment trust (REIT), was started by former data center CEO Gary Wojtaszek in October 2020 and has been the most active buyer of RV/boat storage properties on the tails of an $800 million capital raise and recent $500 million debt raise. They are focused solely on the niche sector and building a national brand but currently have the largest concentration of properties in Texas and Florida.

Other active buyers are investing in RV/boat storage alongside traditional self-storage. Yardi Matrix has noted sales of RV/boat storage properties in recent years to large self-storage owners/operators including Amerco Real Estate (dba U-Haul), Madison Capital Group (Go Store It), National Storage Affiliates (various brands), Strategic Asset Management (SmartStop) and The William Warren Group (StorQuest). These owners and operators may see operational similarities with self-storage and have unique insight into demand and rent trends as they already own and operate many self-storage properties with RV/boat parking. They are able to integrate RV/boat storage properties into their portfolios and management platforms and take advantage of their sector knowledge and boots on the ground management.

Additionally, large private equity groups have set their sights on the niche sector and have acquired RV/boat storage properties recently, including Invesco, Blackstone Group, Hines Interests, KKR and Brookfield Properties. Although their ownership is currently very limited, these companies have extremely large balance sheets and have the ability to transform the RV/boat storage into a more institutionally-owned sector like self-storage has become over the past few decades.

Like development activity, much of the transaction volume in recent years have focused on high-growth Sun Belt markets, particularly Texas and Florida. Nearly half of the 320 RV/boat storage properties sold since 2020 have been in these two states, with the most in Houston (43), followed by Dallas (29) and the Southwest Florida Coast (18). Other markets that have experienced a notable amount of sales recently include Oklahoma City, Denver, the Central Valley of California, and Phoenix. Only 16 properties have sold in the Northeast, half of these occurring in Massachusetts. Like self-storage, pricing varies significantly by market and depends on the availability of data and age and quality of properties being sold, but ranges from $125,000 per acre in Corpus Christi to over $5 million per acre in Los Angeles.