veryone wants self-storage data; however, collecting it is the real issue. While the 2024 Self-Storage Almanac presents the most accurate data available to the industry today, it is our continual goal to improve that data every year. Hence, we ask the question, why doesn’t every owner-operator share the data for the overall good of the industry?
Gartner, a leading provider of data and analytics across a wide array of industries, believes that these owner-operator fears might not only lack a solid foundation, but safeguarding data could actually be detrimental to your business. In an online article published in 2021, Gartner notes, “Organizations that promote data sharing will outperform their peers on most business value metrics.” Gartner goes on to say that without a well-vetted reason, a lack of data sharing can actually hamper business outcomes rather than promote them.
While benchmarking and industry insights are certainly one potential benefit of data sharing, there are a litany of additional potential benefits that could follow if we had high-quality, safely aggregated industry data available. Companies like Reply are leveraging data from across companies and industries to provide a more holistic understanding of a customer or set of customers. According to a June 2020 article published by Harvard Business Review, “Pooling expertise and information enables a company to exponentially increase the value of the individual pieces of data. A combination of information from different environments and businesses can lead to the creation of a range of information that could not otherwise be derived from a single specific data set.” Here again, sharing data provides an accurate and cost-effective way to glean insights that would otherwise be cost prohibitive and daunting to gather as an individual operator.
Calculated by taking the total supply of rentable square feet of self-storage in the U.S. or market, multiplied by the average occupancy and divided by the population, the demand figures presented in the Almanac are used nationwide in feasibility studies and reporting on the health of the industry. They are widely seen as the most accurate figures available to the industry. The information is gathered from our data partner, Radius+, one of the most tech-savvy data gathering companies in self-storage.
Multimillion-dollar decisions are based on these calculations and this data. Paired with average rent assumptions, developers decide whether the unmet demand justified the costs and projected returns of the project. Over the course of 30-plus years, the Almanac’s data has created many wealthy self-storage developers on the best data available. As technology has improved, so too can the accuracy of the data and the ease with which data sharing is made possible. In the end, making informed, data-driven decisions about development benefits us all.
The key to accurate data is the ability to access it from the source of truth, the property management software. The more accurate the data, the more accurate the decisions. As an industry, we know our data could be more accurate. The challenge has always been the ability to share the data, willingly, in a way that is seamless for the operator and doesn’t take away resources during the workweek to report it.
With the proliferation of property management software, the source of truth (the data) has moved to the cloud. The cloud makes the sharing of data easier, what should be as simple as turning on a “switch” for the operator. It would allow operators to share their data anonymously with data services of their choosing. The value of data from one facility, in one market, is essentially useless except to that owner. The value of data is derived from scale, statistically significant scale, that’s why they call it “Big Data.” Scale can be achieved anonymously.
This is not the first time this idea has been attempted in the industry. The Self Storage Association (SSA) started a similar campaign 15 years ago with REIS. Sometimes, great ideas come too early. The work to create the switch then was far too burdensome for the software companies, and the manual process was too cumbersome for operators to adopt on a wide scale.
That was then; this is now. The next step, at this point, is the creation of that “switch” within our software. MSM has had discussions with management software companies in our industry, and they all believe the creation of the “switch” to be a relatively painless endeavor. Only one has created this capability to date, while the others seek to understand the need from their customers.
Self-storage data sharing is essential to the continued success of our industry. Operators should want the best data available to make their decisions, and they should willingly be able to share their data easily to get it.
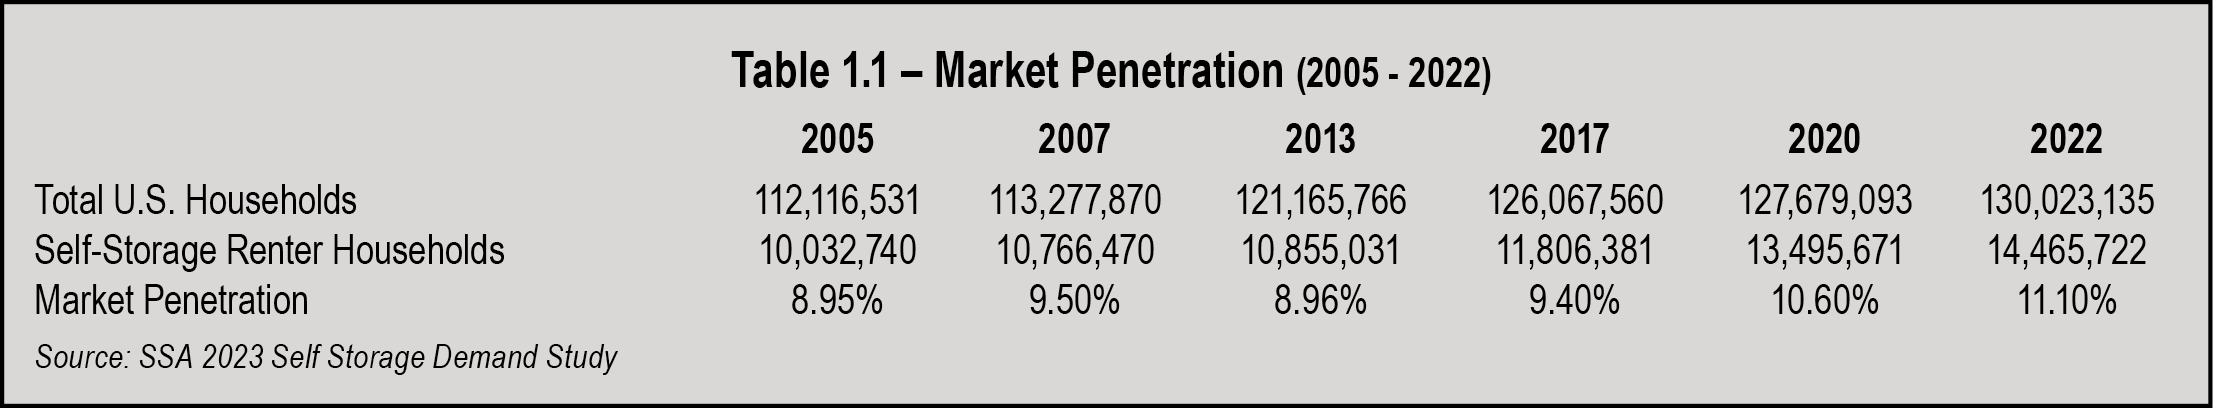
According to the SSA’s 2023 Self Storage Demand Study, of 130,023,135 households in the U.S., 14,465,722 use self-storage, representing a market penetration of 11.10 percent. As seen in Table 1.1 on page 13, market penetration has increased by 2.15 percent since 2005. Simplified, approximately 4,432,982 more households utilize self-storage today than in 2005. Moreover, since 2020, the industry saw an uptick in market penetration of 970,051 households.
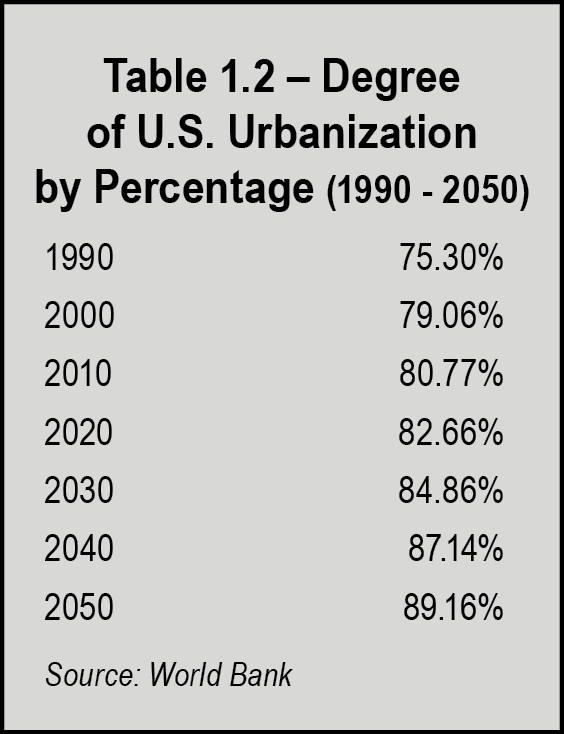
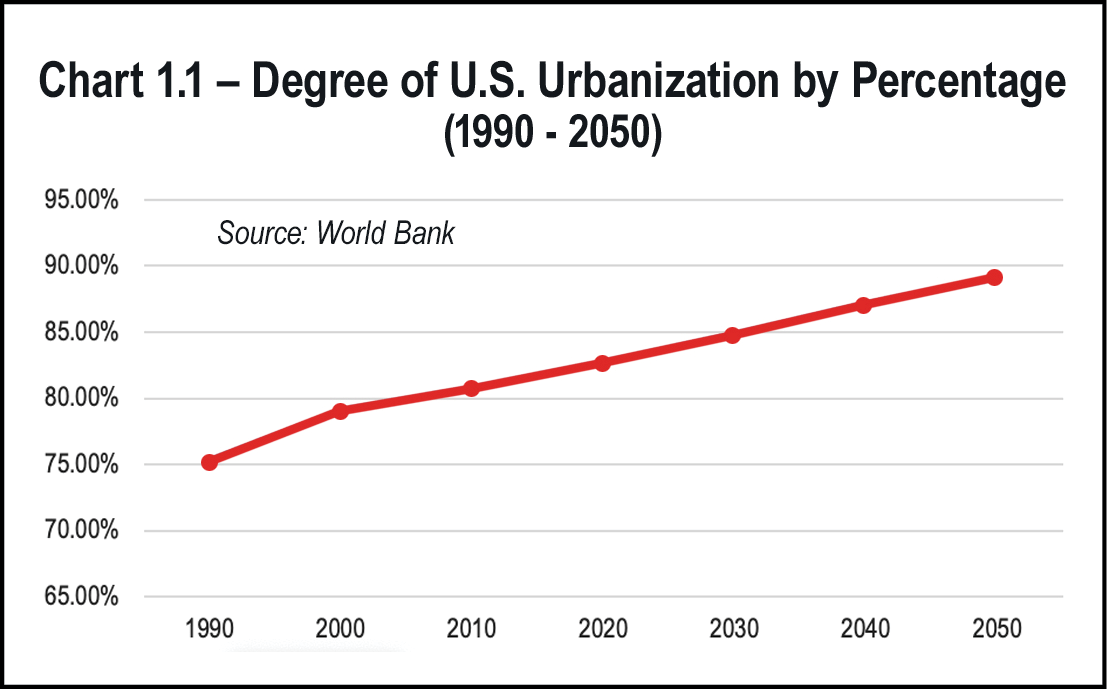
While life changes such as divorce, death, or moving have always been the major reasons for using self-storage, an increase in urbanization has also become a major driver. As seen in Table 1.2 and Chart 1.1 on page 14, more than 82 percent of the U.S. population lived in urban areas as of 2020, a number which is expected to increase to more than 89 percent by 2050. Smaller living spaces in these highly populated areas along with downsizing to smaller homes has led to more demand for storage in these areas. As a result, many self-storage developers are seeking out sites in more densely populated areas to meet this demand.
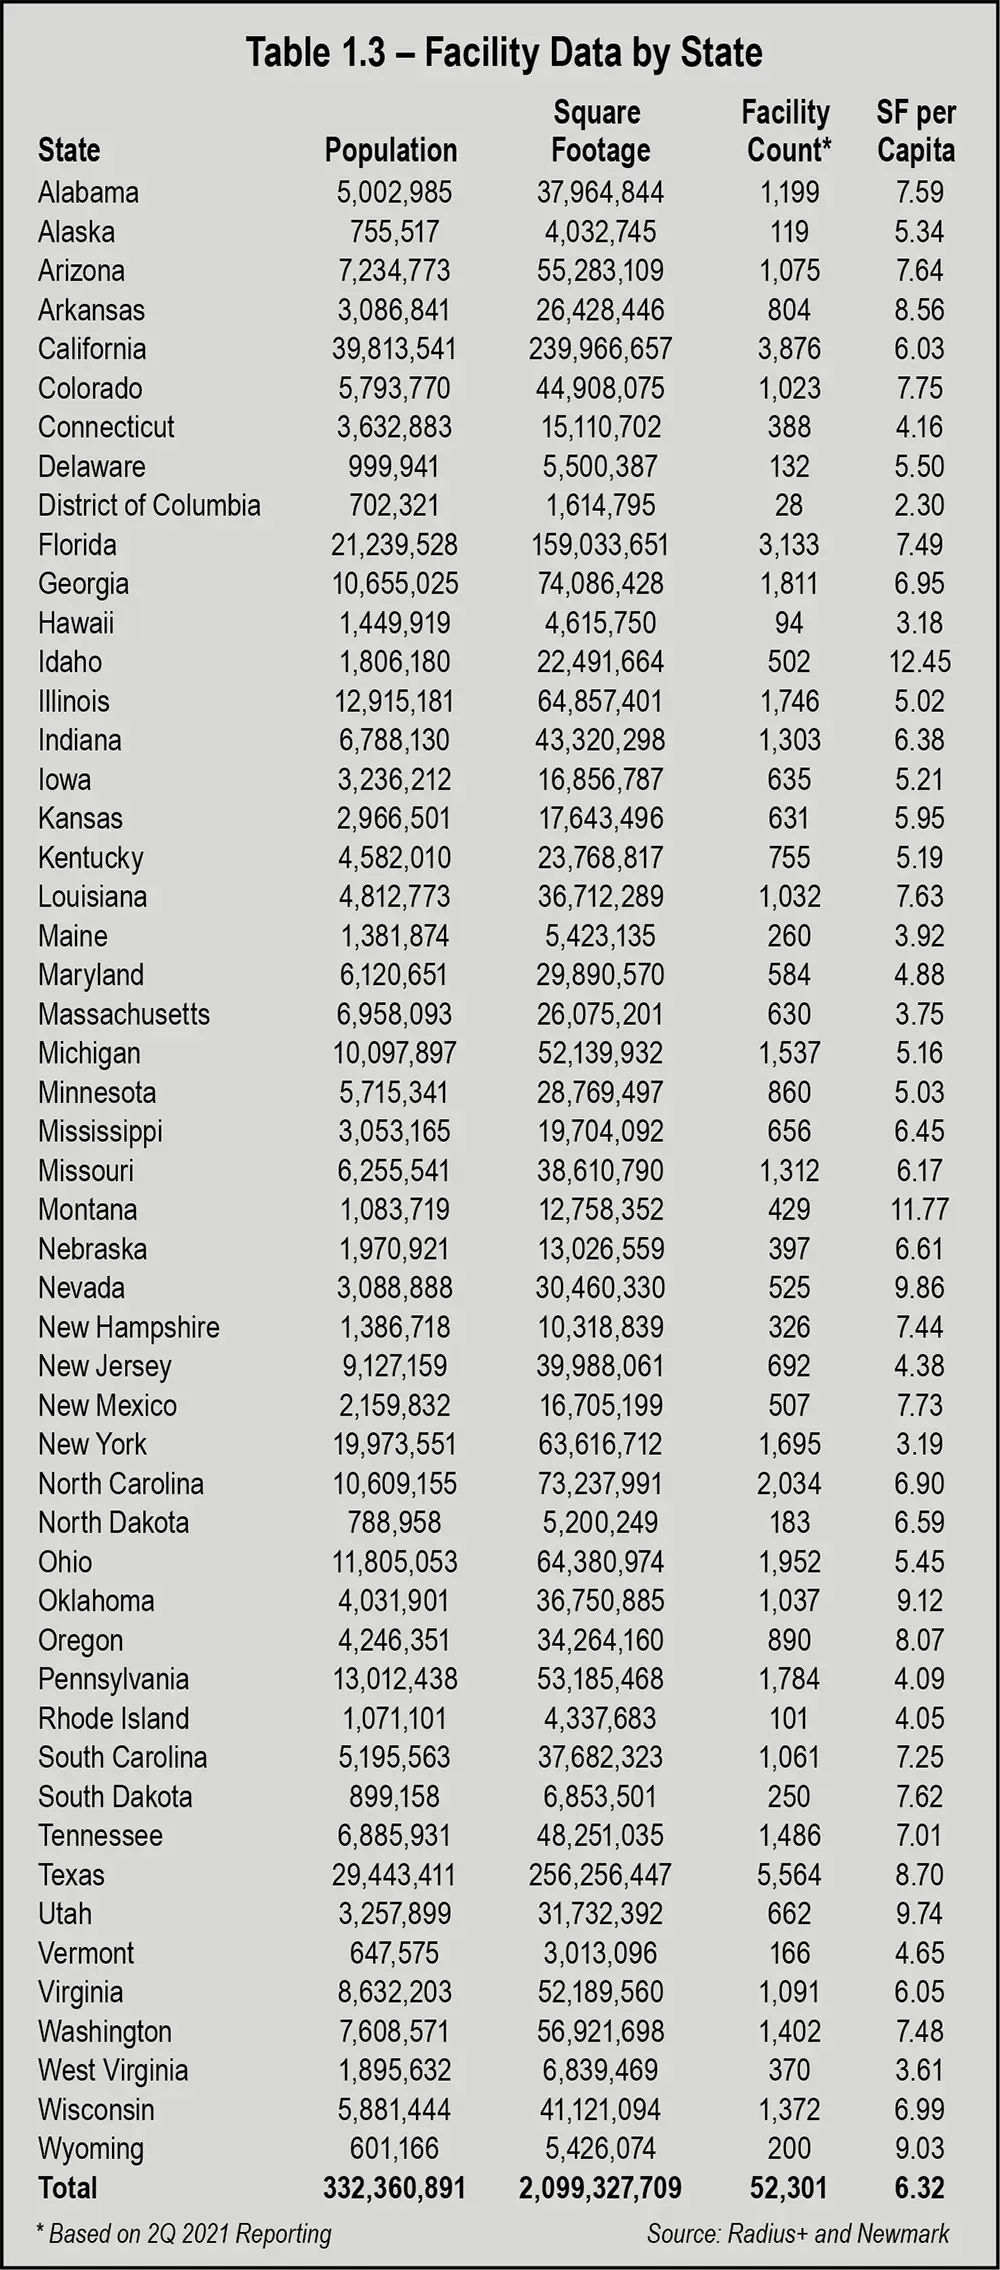
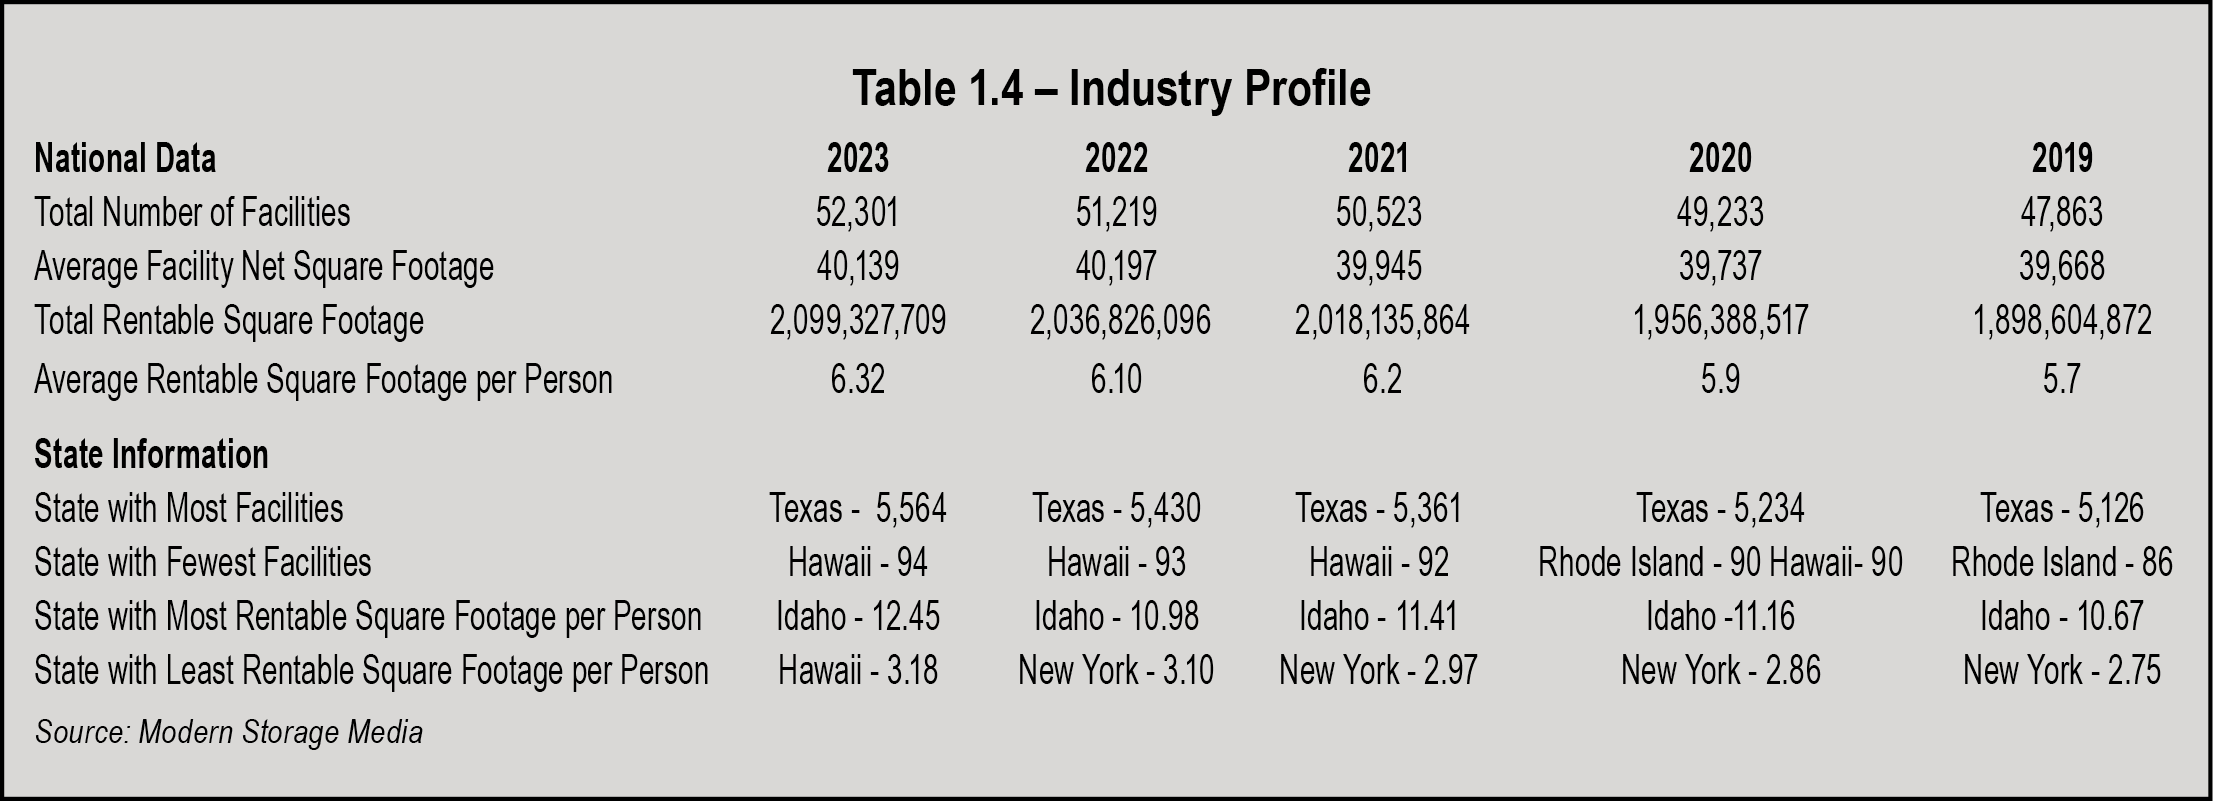
Table 1.3 on page 15 shows self-storage information by state, including the number of facilities, rentable square footage, state population, and square feet per capita. Table 1.4 represents the industry profile for the past five years of Almanac reporting.
Based on data from Radius+, there were approximately 52,301 self-storage facilities in the United States in 2023, an increase of 1,082 facilities from 2022. This number does not include those operations where the primary business is something other than self-storage. It is important to note that this is the best data available today. Based on publicly available earnings reports from innovative building and technology solution providers such as Janus International, we believe that this number could be higher, however, until more owner-operators are willing to share their data, we must rely on the best data available to us.
The industry’s total rentable square footage is 2,099,327,709, up from 2,036,826,096 in 2022—a gain of 62,501,613 square feet. Comparably, the average facility size based on current data is approximately 40,139, a slight decrease from 40,197 net square feet in 2022.
As seen in Table 1.4 below, the state with the most facilities is once again Texas, with 5,564 facilities, representing an increase of 134 facilities in a year’s time. This is nearly double the 69 facilities added two years ago. The state with the least number of facilities is still Hawaii with 94 facilities.
A breakdown of this data by CBSA can be found in Section 13, Market Conditions. Likewise, information for RV and boat storage can be found in Section 12.
In conclusion, presenting the best data available has always been and will continue to be our ultimate goal for the annual Almanac. As such, we will continue to encourage each and every self-storage operator in the U.S. to share their data for the betterment of the industry.