proper feasibility study should begin with a market study. A market study determines if the trade area is oversupplied, undersupplied, or at equilibrium. It should also quantify the amount of demand in the trade area. If there is sufficient demand, phase two is a feasibility report.
In our appraisal practice at Newmark, we complete these two-phase analyses for clients and also review many feasibility studies. Unfortunately, many of the reports are based on rules of thumb or estimates unsubstantiated from market data. These analyses should include multiple methodogies to determine demand and feasibility. This section will summarize our two-phase process of a market study and a feasibility report. For clarity, we have used an example prior to the current trend of rising interest rates.
As outlined in “Self-storage Economics and Appraisal,” published by the Appraisal Institute in 2012, self-storage economics is the analysis of the market conditions that affect value using both qualitative and quantitative techniques. To evaluate the key market conditions for self-storage, an appraiser must perform a series of related analyses:
- An analysis of existing supply
- A forecast of stabilized demand, resulting in a conclusion of the state of the trade area (oversupply, undersupply, or equilibrium)
- An examination of the competitive position of a facility in relation to the competition
These conclusions of market conditions and competitive position are critical to the economics of a self-storage facility. A review of rent comparables or a sample of the competition in the trade area would be insufficient analyses. Analyzing the entire supply in a trade area is critical to the market condition conclusion, which forms the basis of forecasting long-run rents, long-term or stabilized vacancy, net operating income, and capitalization and yield rate conclusions. Ultimately, the market condition conclusion is the foundation of the valuation conclusions. Fortunately, the dynamic economic and demographic data used in the analysis of self-storage economics is readily available to appraisers.
A comparison of local, regional, and national supply data underscores the need for local trade area analysis to provide an accurate snapshot of the self-storage market for a particular facility. National market data and trends are useful tools in general, but local trade area analysis is the essential starting point for analyzing a self-storage facility. For example, market equilibrium is measured in terms of a balance between supply and demand in each trade area. To analyze the subject trade area, four analyses are presented: two quantitative and two qualitative.
Quantitative Models
The quantitative analyses are based on a quantitative forecast of stabilized demand using our proprietary, econometric model, and an analysis of the cost of occupancy (or the ratio of average household income to average self-storage rent). Determinants of the self-storage market relate to the forces of supply and demand, as is the case with other types of real estate. The analysis of demand generators, however, is focused on four key variables:
- Population
- The percentage of renters
- Average household size
- Average household income
Similar to other types of trade areas, a self-storage trade area is “the geographic area immediately adjacent to the property from which the retail establishment obtains 60 percent to 70 percent of its total customers.” Such a detailed gravity model analysis is beyond the scope of most appraisal assignments, but these principles can be applied when determining the subject trade area.
A typical primary market is described by the population density and the proximity of existing supply. As for land use patterns, the availability of vacant land parcels for self-storage development is limited in many cities. Furthermore, self-storage developers may have difficulties obtaining entitlements because some planning and zoning authorities perceive the tax and job base to be relatively low. Cumulatively, these factors suggest that a review of several local trade areas is the best tool for measuring the market.
Under these parameters, analysts typically define the trade area of a self-storage property using a series of rings with a radius of 1.0 to 5.5 miles as outlined in survey research. In some cases, a ZIP code study of existing tenancy may assist in defining the proper trade area. For the purposes of analysis, we have used a trade, consider the typical trade area defined as a 5-mile radius.
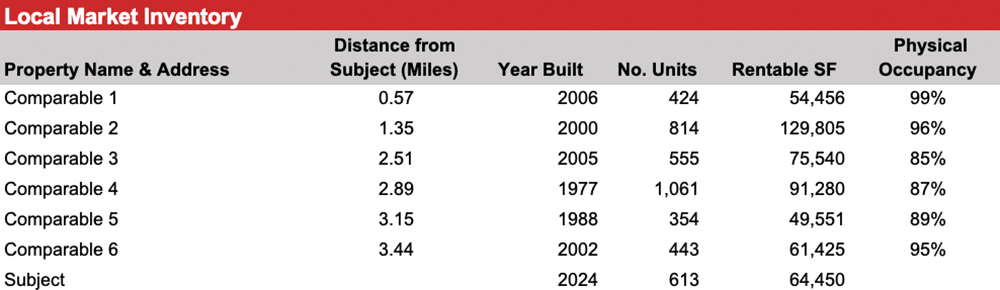
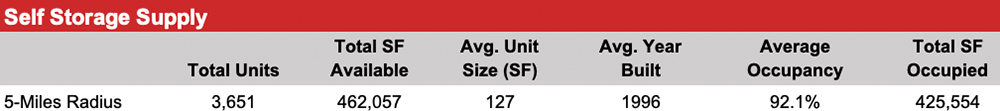
Sources used in local trade area analysis include public records and primary survey research. The data sources vary in scope, method, and precise geography of research but are considered reasonable indicators of current trends and conditions in the subject trade area because the data has been supported by field research. For the subject, we utilized REIS, PAC-COMM, Radius, and primary survey research. The supply (competition and subject) of self-storage is summarized in the Local Market Inventory and Self Storage Supply tables below.
To test market saturation in a static equilibrium model, a forecast of demand in the subject trade area is critical to the determination of project feasibility.
Demand
Self-storage demand is measured in terms of square feet per capita. As a test of reasonableness, demand is estimated for the subject based on a simple econometric model developed by the Newmark Self Storage Group for self-storage properties. After mining demographic data for meaningful mathematical relationships for self-storage, there are four characteristics key to demand: population, percentage of renters, household size, and household income. The data is analyzed in a regression model detailed in the Demand Forecast Table below. Using multi-variable regression, the variables correlate (not cause) to demand.
Market Equilibrium – Summary Of Econometrics
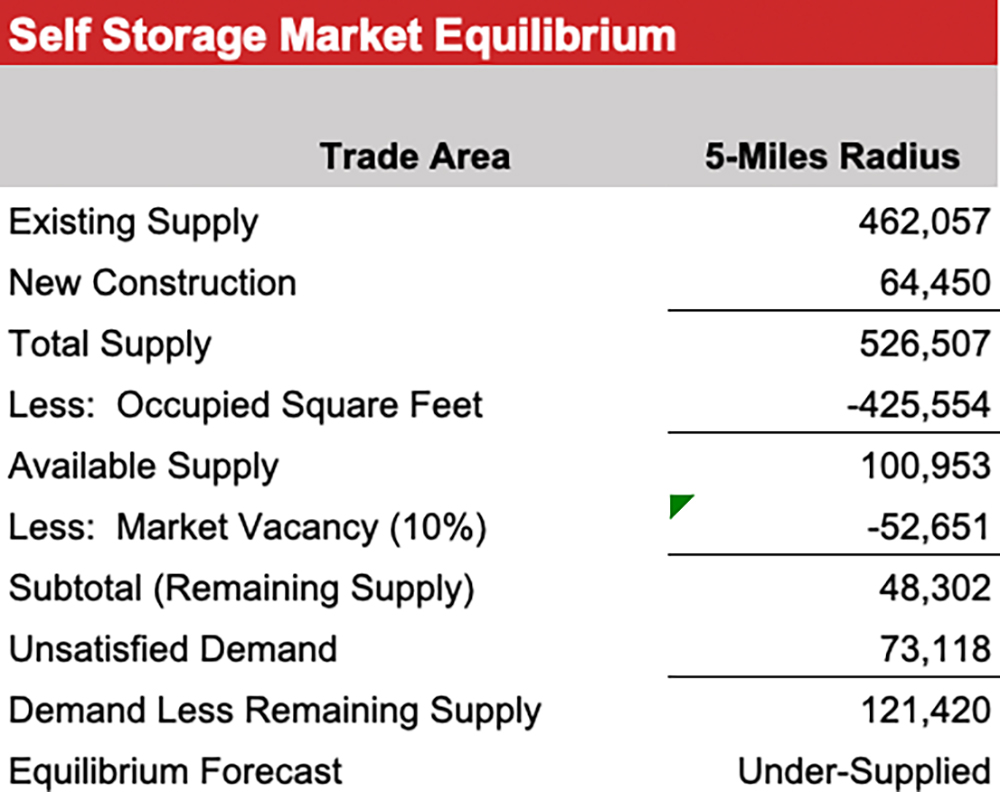
The Self Storage Market Equilibrium table on the opposite page shows the total supply (existing supply plus new construction), less occupied square feet in the trade area, results in the available supply in rentable square feet. Based on our analysis of the trade area, we have forecast a trade area vacancy, which is the amount of rentable square feet that will remain vacant. The result is the remaining rentable square feet available in the trade area shown as a negative in the table. Unsatisfied demand is the result of the multi-variable regression. Adding this to the remaining supply results in the trade area demand; if the result is a negative, then the trade area is oversupplied.
Cost Of Occupancy
As a test of reasonableness, we have calculated the cost of occupancy for the subject based on market rents (average annual unit price of the market rent forecast divided by the average household income of the trade area). In this case the cost of occupancy is below 2.00 percent. For self-storage, we note trade areas below 3.00 percent generally have room to improve rental rates (revenue enhancement). Quantitatively, the market appears to be undersupplied within the 5-mile radius, based on local demographic factors.

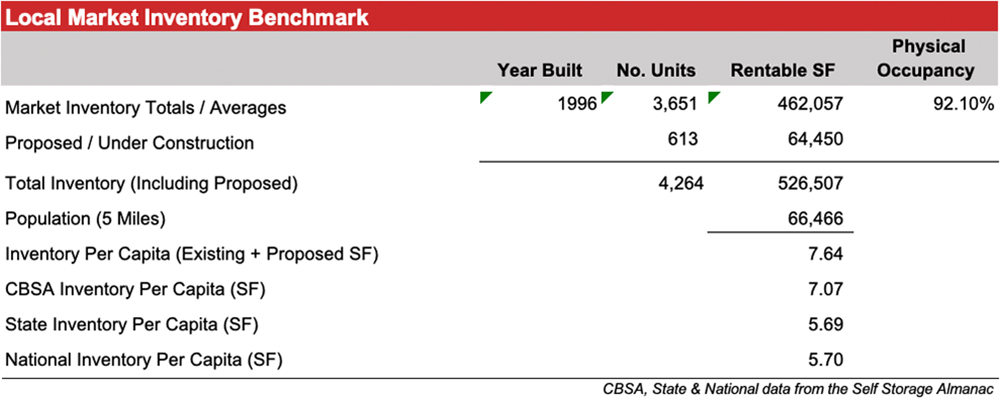
The benchmark data is presented in the Local Market Inventory below.
The subject rentable square feet per capita is above the CBSA, state, and national average, indicating potential oversupply. However, physical occupancy in the trade area is 92.10 percent. Overall, this indicates undersupply conditions in the subject trade area.
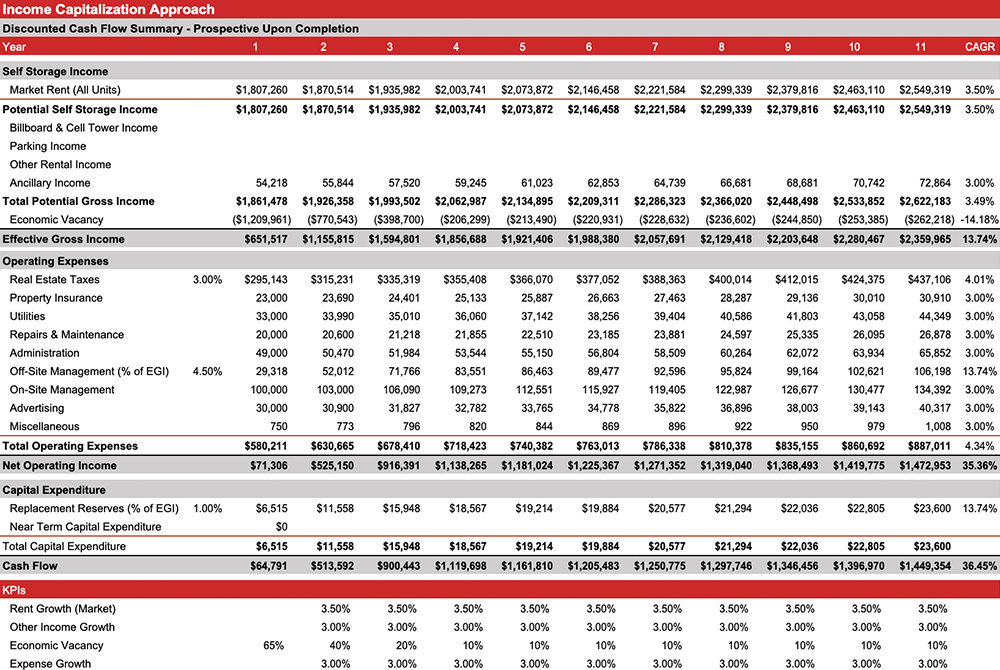
To assist feasibility analysis, we utilize the income capitalization approach. This approach to value views the subject through the eyes of a typical investor. It is based on the premise that the higher the earnings for a property, the higher its value. This approach converts anticipated future benefits or dollar income to be derived from ownership into a present value estimated through the capitalization process. Application of the approach includes the following steps:
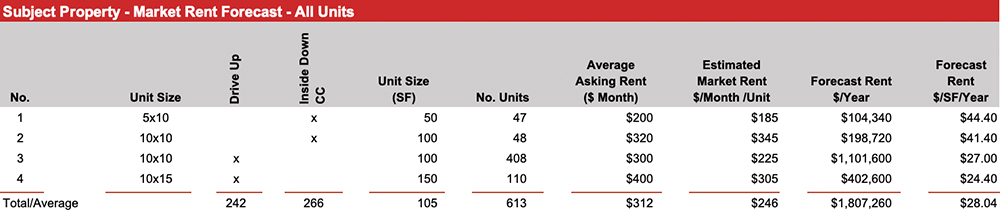
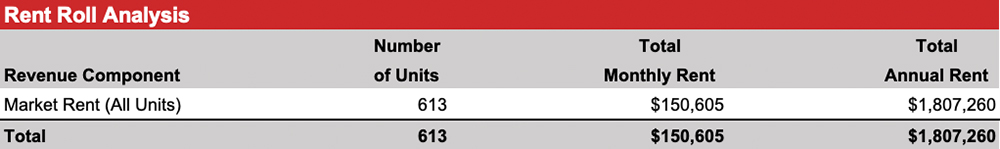
- Survey the rents of comparable properties to estimate an economic market rent for the subject property. For self-storage, this step should include an analysis of each unit based on asking rent and actual rent to compare to market rent.
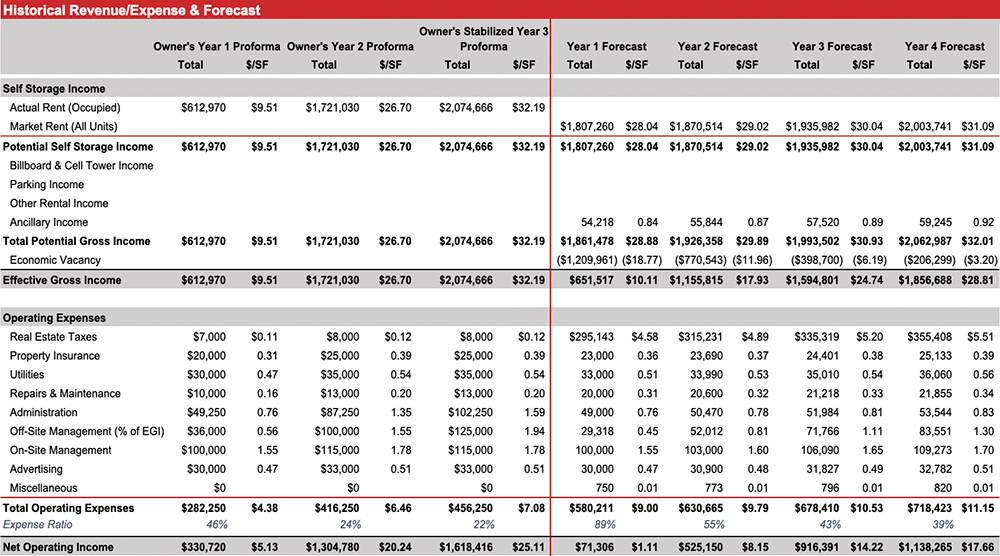
- Estimate operating expenses (including economic vacancy) applicable to the subject ownership, including an analysis of the trailing three-year financials (when available) to compare patterns in effective gross income and operating expenses.
- Derive net operating income for the subject property.
- Estimate the remaining economic life of the subject based on the market or the investor’s holding period.
- Select the proper capitalization method and rate.
- Capitalize the net operating income into an indication of value.
- Direct capitalization is a method used to convert an estimate of a single year’s income expectancy into an indication of value in one direct step, either by dividing the income estimate by an appropriate income rate or multiplying the income estimate by an appropriate factor. Direct capitalization employs capitalization rates and multipliers extracted from the market data. Only one year’s income is used. Yield and value change are implied, but not identified.
- Yield capitalization is a method in which future benefits are converted into a value indication by discounting them at an appropriate yield rate (DCF analysis) or applying an overall rate that reflects the investment’s income pattern, value change, and yield rate.
As an asset class, self-storage was historically not considered institutional grade (although REITs are widely traded). Over the past five years, however, investment analytics for this sector have increased significantly. Consequently, the investment market now relies on both direct and yield capitalization. Due to revenue enhancement, discounted cash flow is typically emphasized in the investment community. Considering all aspects that influence an investment decision for self-storage, both methods are analyzed in this feasibility study.
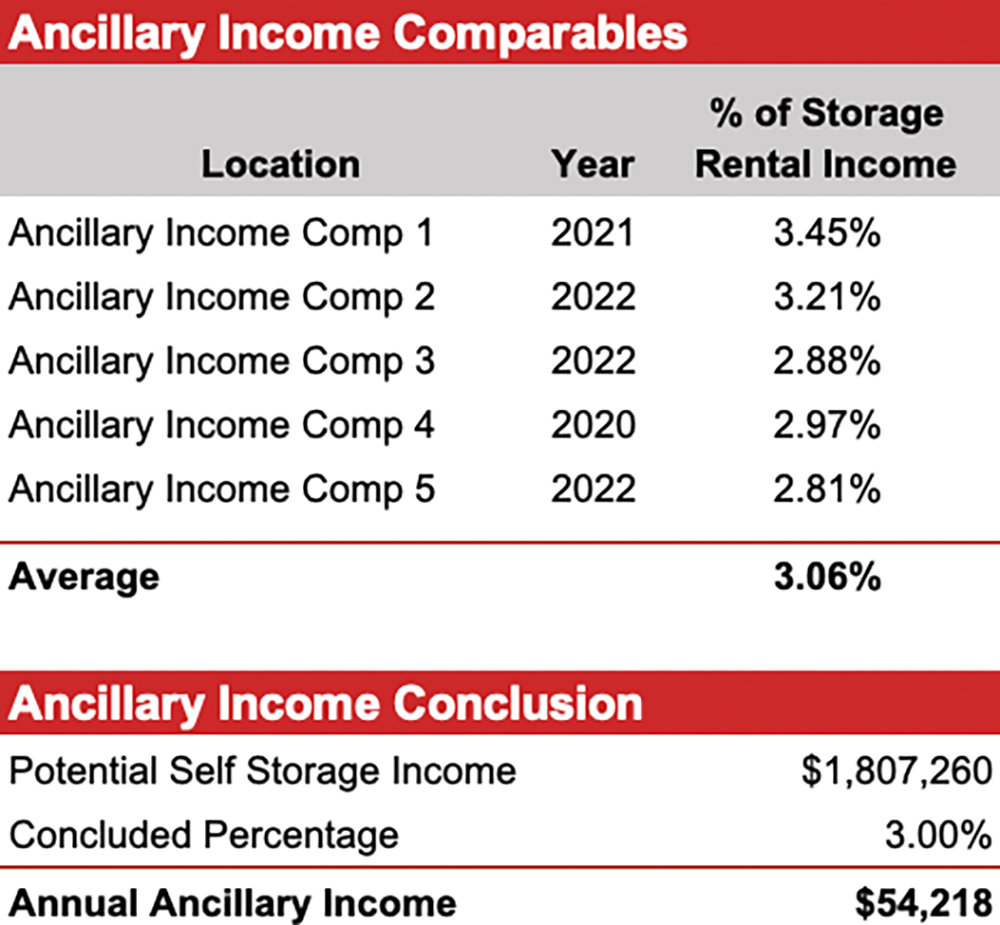
- Late fees
- Unit insurance (such as renter’s insurance for an apartment)
- Administrative fees
- Truck rentals
- Retail sales of storage items (from the office)
The projection used in this analysis is based upon the budget and market rent, together with our assumptions as to the absorption of the vacant space, market rent growth, and renewal/turnover probability. We begin our rental income analysis by discussing certain aspects of the subject property, namely its occupancy and the quoted rent levels of its various unit types.
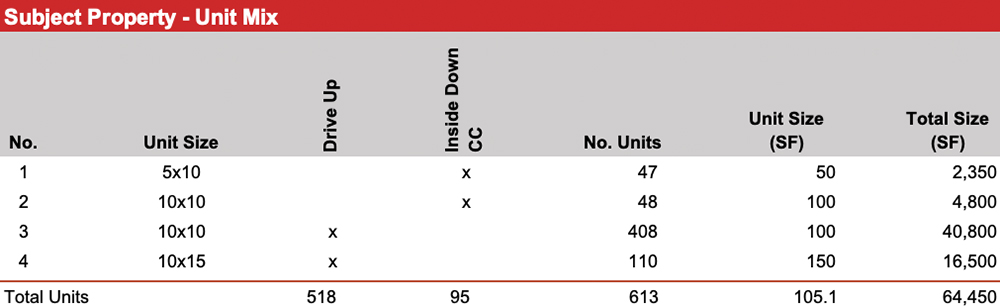
The subject average unit size is 105 square feet, slightly smaller than the average unit size within the 5-mile radius of 127 square feet and the average unit size of the rent comparables of 126 square feet. However, these factors are considered more precisely in the selection of rents per unit and in the occupancy analysis.
The adjustment of comparable rent data is difficult because textbook methodology for the income capitalization approach is limited, unlike for the other approaches. Nevertheless, rental adjustments should follow a logical and sequential path to derive a reasonable market rate conclusion. Adjustments should account for financial, locational, and physical aspects of the rental data. The seven key variables that warrant consideration for adjustment are:
- Rent basis
- Escalation
- Concessions
- Conditions of rent transaction
- Market conditions (time)
- Physical characteristics
- Location
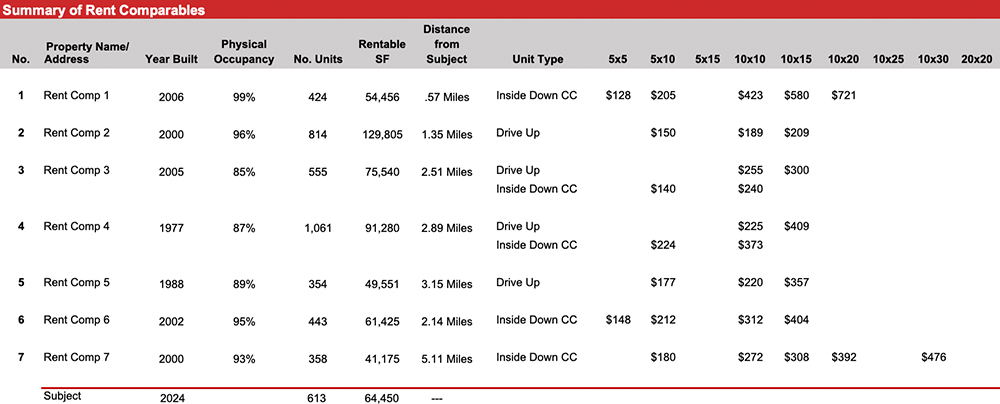
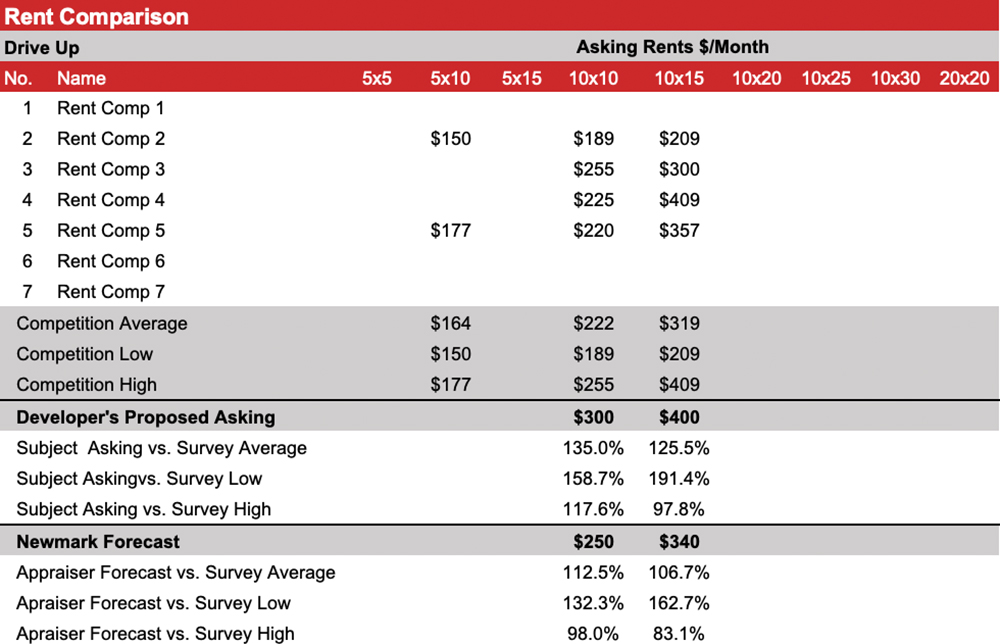
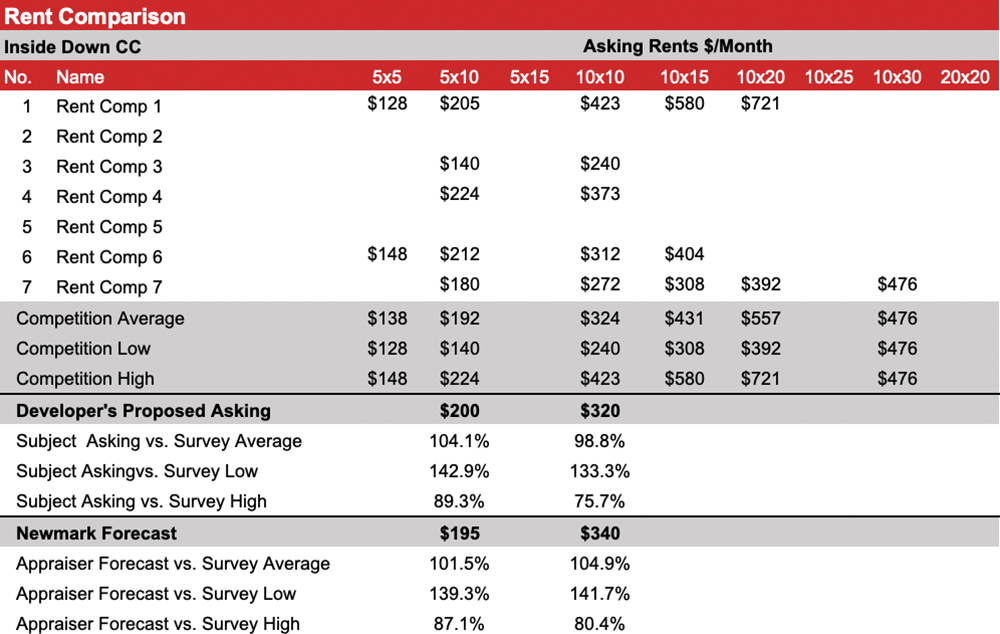
More important than mathematical equivalencies, however, is actual data. For example, managers were queried about the asking rent on available, vacant units (typical of the industry) to obtain the representative rate of the comparable (and other parameters such as specials, discounts, or other concessions). This data is considered to be a reasonable representation of the market. Rent analysis should consider the elements of comparison, but rents are often best analyzed in chart or table format. Each unit is analyzed and compared to market comparables. The analysis should consider the unit size as well as location within the facility.
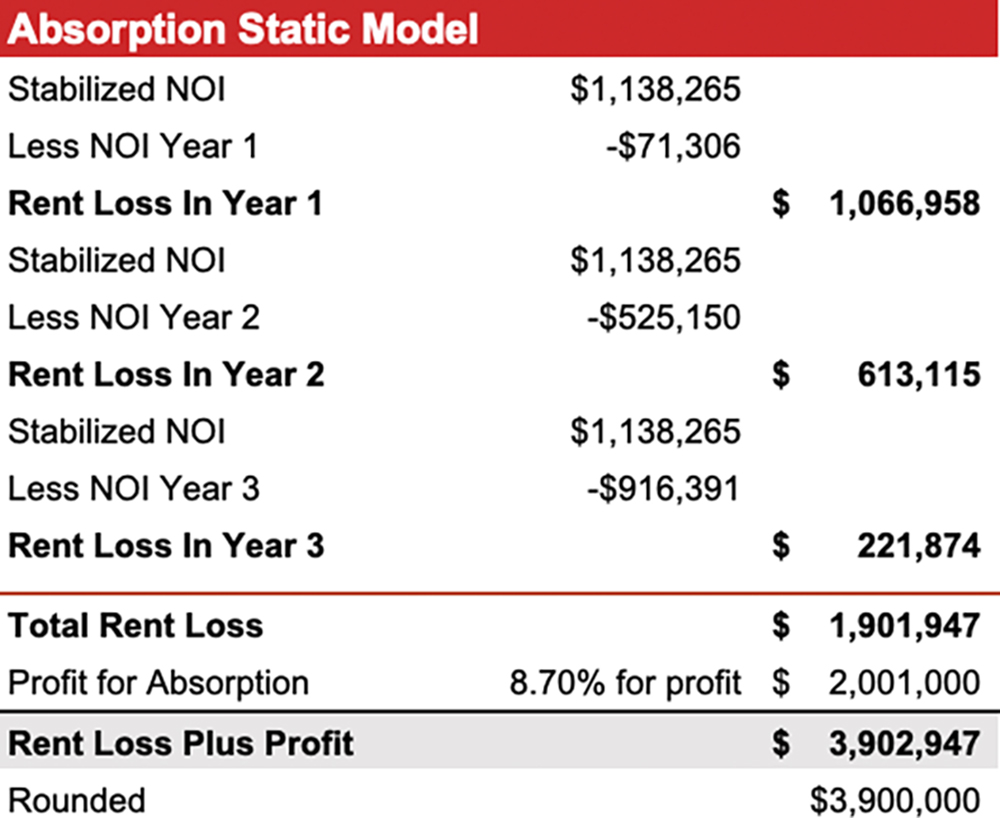
The Absorption Static Model table above shows total rent loss of $1,901,947. In addition, prudent investors in self-storage expect a profit for the time and risk associated with lease-up to stabilization. Based on that table, the implied profit is 8.7 percent (of the stable value); this is considered a reasonable return for time and risk associated with this project.
The Expense Comparables table on page 174 summarizes the expenses of the subject, comparable properties, the 2023 Self-Storage Expense Guidebook national data, and the applicable NCREIF Division.
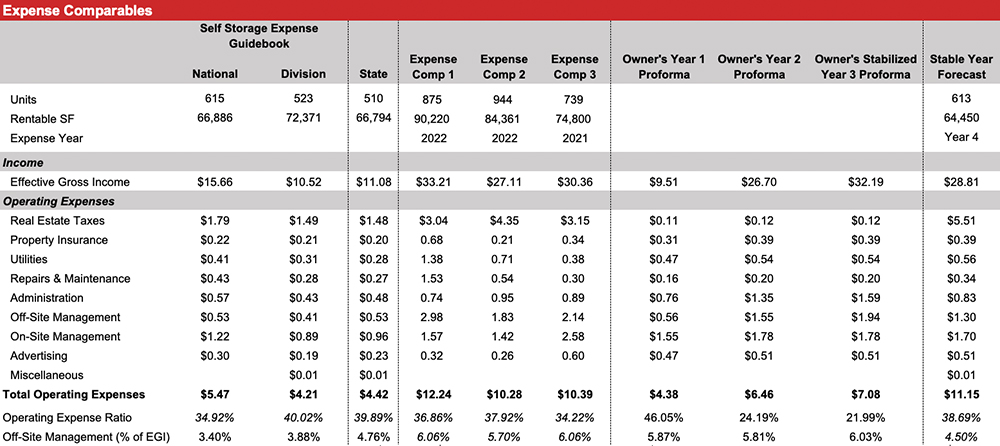
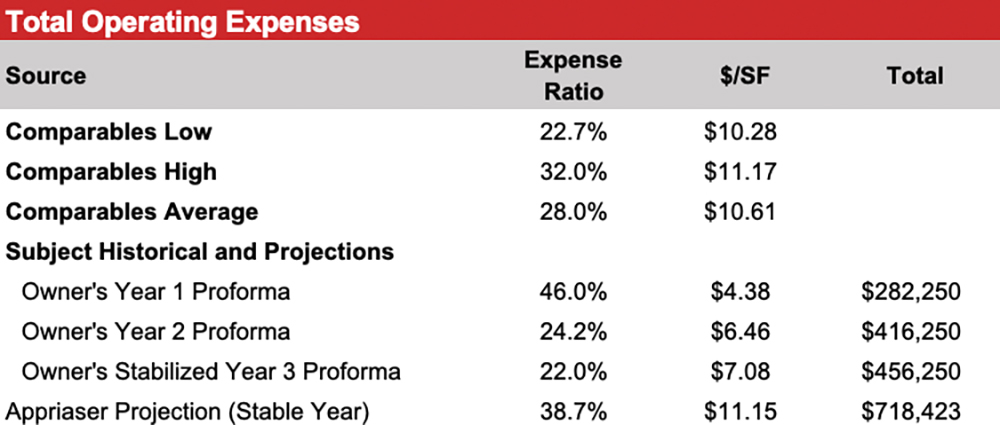
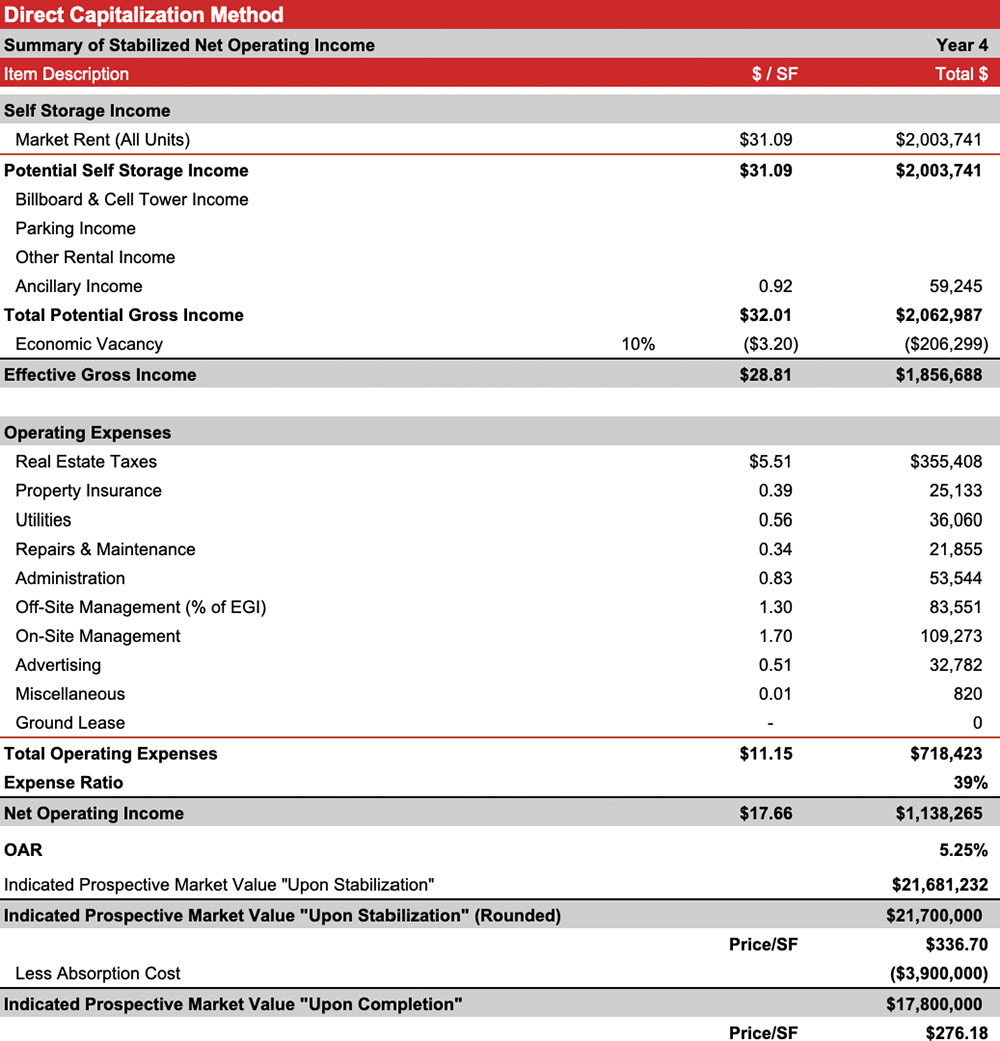
The subject per square foot expense ratio is 38.70 percent on year four (stable year). This is considered reasonable.
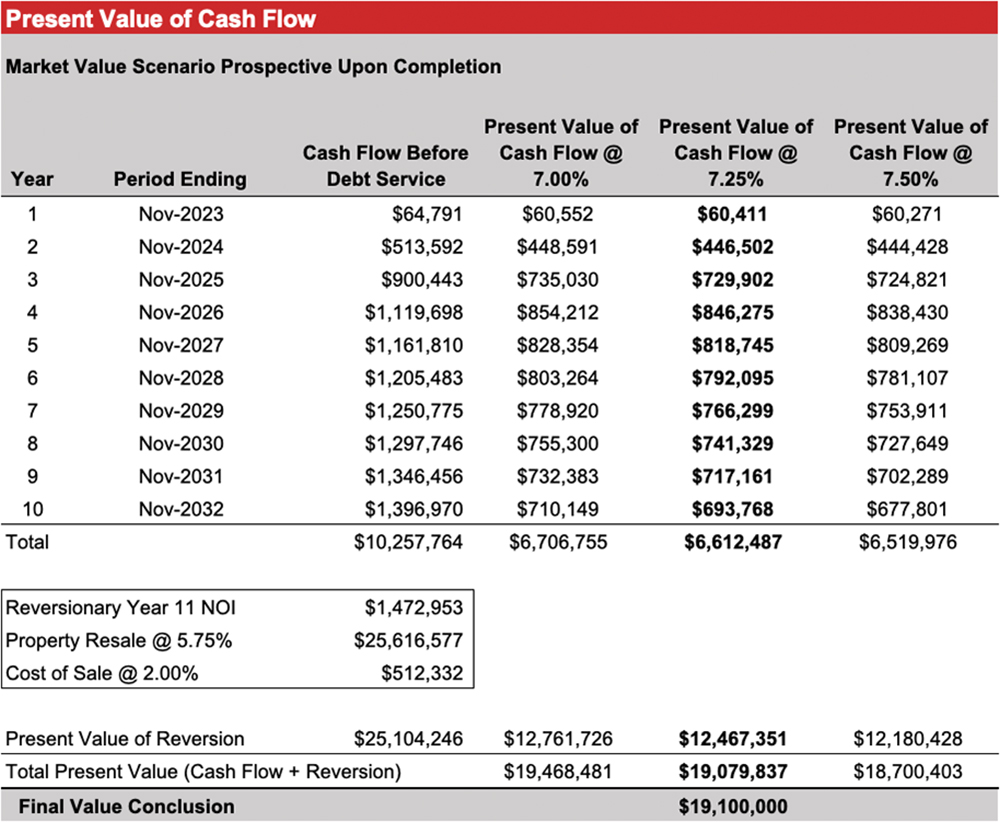
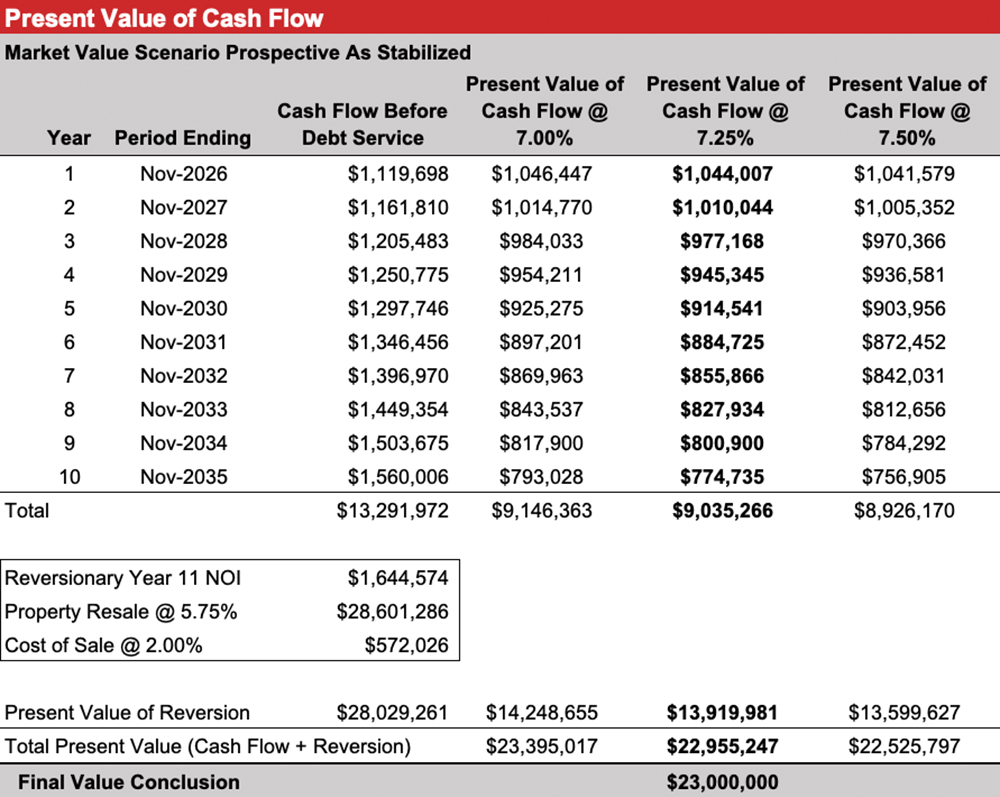
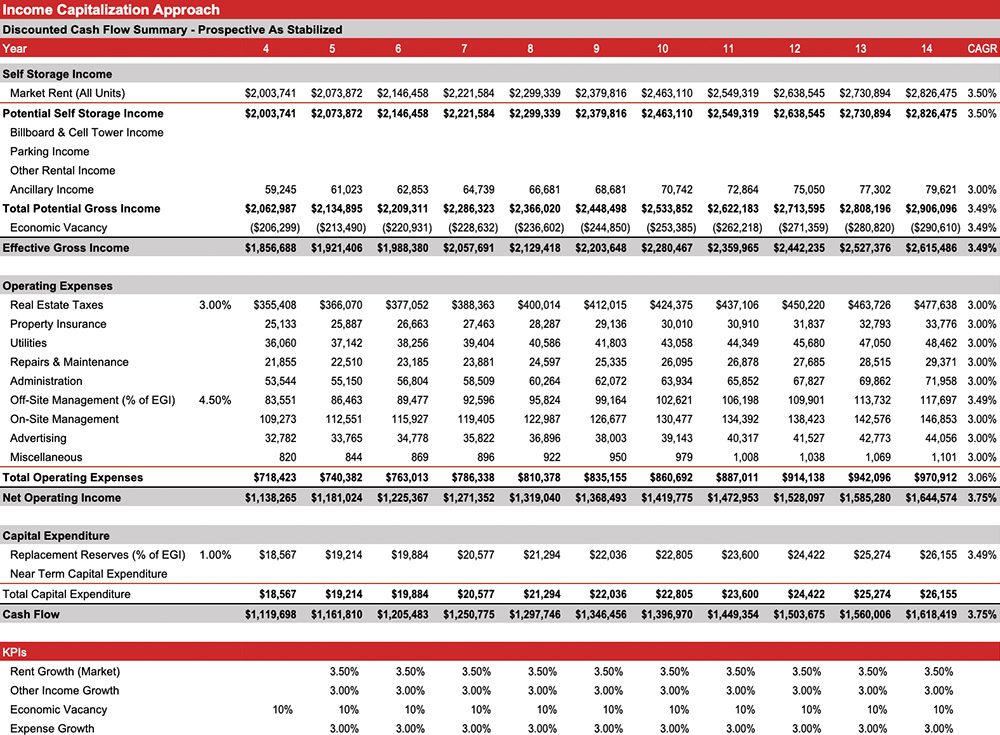
The reversion year must be representative of the cash flow pattern, or the present value analysis will be skewed. The report is based on the premise of a sale at the value date. Therefore, an investor must carefully consider a resale strategy or the basis of the reversion. The next investor will consider the following 10 years’ income. In this regard, we have based the complete value on year one to year 10 and the as stabilized value on year four to year 13. The DCF analysis utilizes a 10-year projection period for each scenario. This is consistent with current investor assumptions.
Sometimes called growth rates, escalations are typically based on a forecast of the Consumer Price Index (CPI). As previously concluded, the CPI forecast is 3 percent annually. Expenses are subject to inflation regardless of market conditions.
Discount Rate
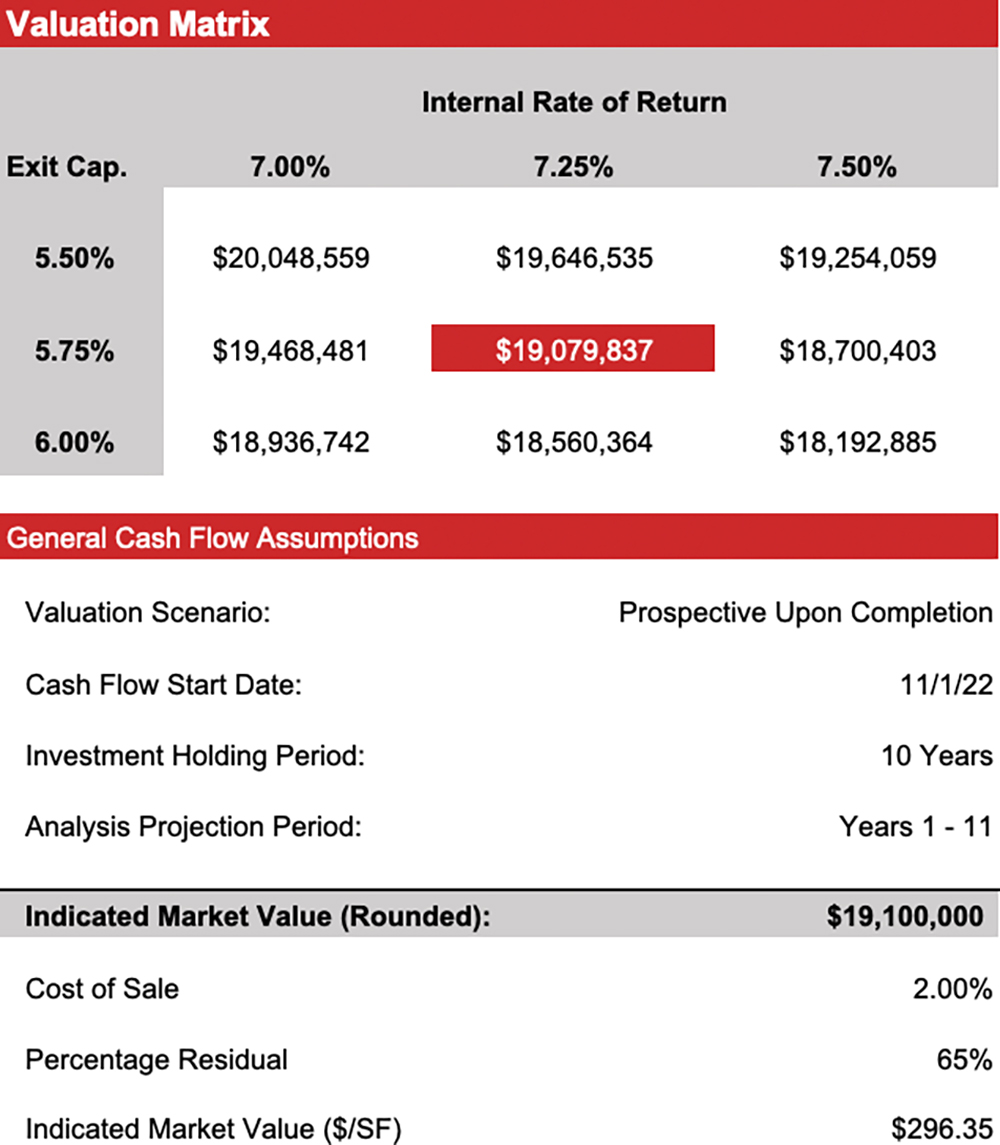
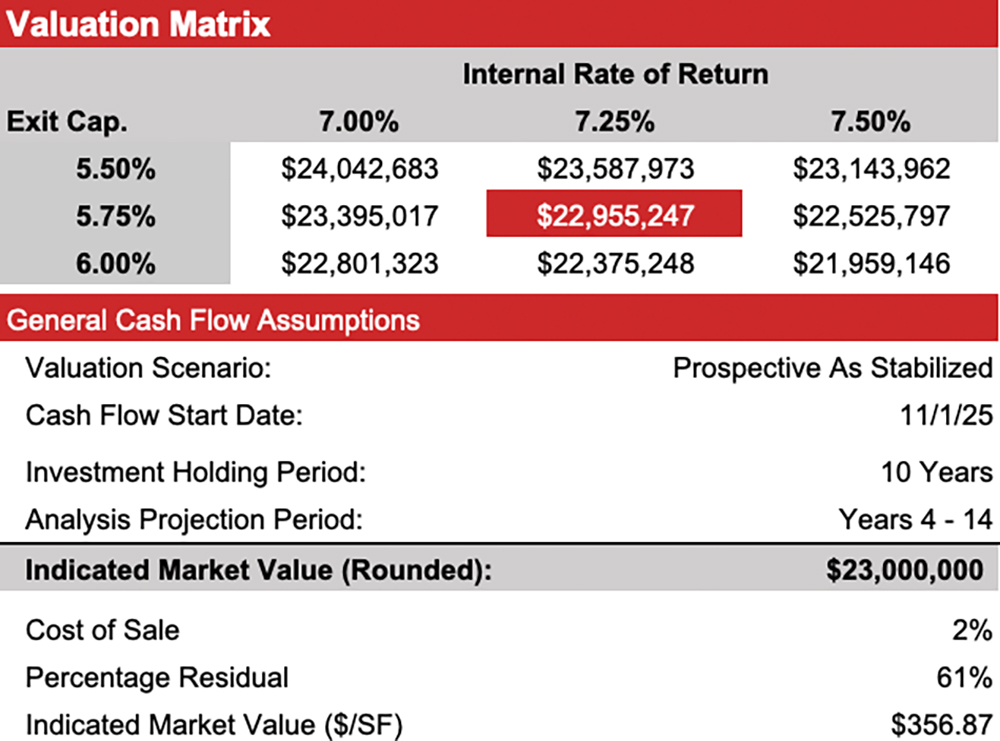
Conversion of the cash flows and reversion to present equity value is by discounting at the discount rate (annual Internal Rate of Return or IRR). The discount rate (IRR) is a projection of the probable yield. It accounts for return to capital and return to equity (entrepreneurial profit). Therefore, the anticipation and expectations of investors in the market are more important than historical data. See the Present Value of Cash Flow, Income Capital Approach, Valuation Matrix, Present Value of Cash Flow, Income Capitalization Approach, and Valuation tables on the previous pages.
As a test of reasonableness of the cash flow and IRR conclusion, a changing income (projected for the subject) can be tested with a common yield capitalization model, sometimes called the Universal Formula. This is a simple mathematical relationship that considers the overall capitalization rate and the growth rate to derive the yield rate or IRR. That is, the capitalization rate plus appreciation equals the IRR; or Y = R + A, where Y = IRR, R = overall capitalization rate, and A = growth rate. On this basis, a typical overall capitalization rate for the subject would be 5.25 percent. However, the spread to terminal rates have increased for self-storage, more in line with core assets, and therefore the IRR has declined. Considering the projected income stream based on an analysis of the quality, quantity, and duration of the income expectancy, as well as the foregoing analysis, a 7.25 percent discount rate is appropriate for the projection period. Considering the foregoing analysis, the subject discounted cash flow analyses are reasonable (see cash flow).
In estimating the replacement cost new for the subject, the following methods/data sources have been utilized, if available:
- Marshall Valuation Service (MVS) cost guide, published by Marshall and Swift, LLC, a nationally recognized publication containing construction costs
- Actual/budget construction cost figures available for comparable properties; and
- The subject’s actual construction costs (if available).
Marshall Valuation Services – Direct Cost
Salient details regarding the direct costs are summarized in the Cost Approach Conclusion at the end of this section. The MVS cost estimates include the following:
- average architect’s and engineer’s fees for plans, plan check, building permits and survey(s) to establish building line
- normal interest in building funds during the period of construction plus a processing fee or service charge
- materials, sales taxes on materials, and labor costs
- site preparation including finish grading and excavation for foundation/backfill
- utilities from structure to lot line figured for typical setback
- site improvements (included as lump sum additions)
- initial tenant improvement costs are included in MVS cost estimate (additional lease-up costs such as advertising, marketing, and leasing commissions are not included)
- contractor’s overhead and profit, including job supervision, workmen’s compensation, fire and liability insurance, unemployment insurance, equipment, temporary facilities, security, etc.
Base building costs (direct costs) are adjusted to reflect the physical characteristics of the subject. Making these adjustments, including the appropriate local and current cost multipliers, the direct building cost is indicated.
Additions
Items not included in the direct building cost estimate include parking and walks, signage, landscaping, and miscellaneous site improvements. The cost for these items is estimated separately using the segregated cost sections of the MVS cost guide.
Indirect Cost Items
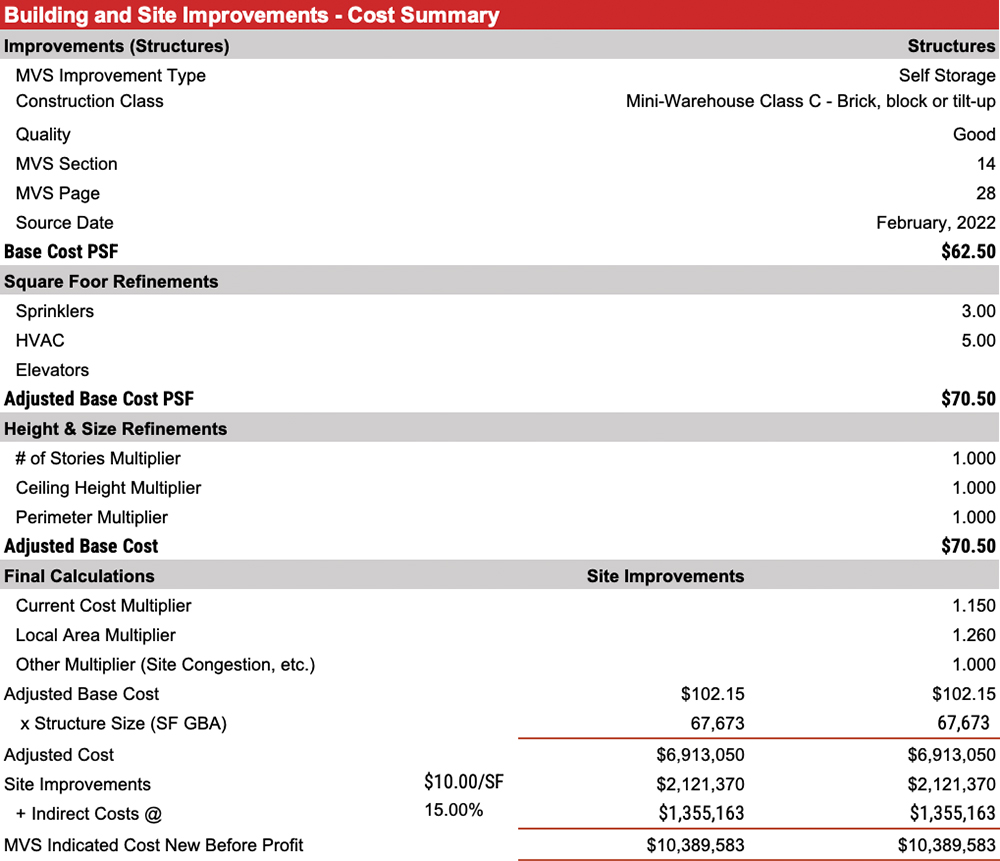
Several indirect cost items are not included in the direct building cost figures derived through the MVS cost guide. These items include developer overhead (general and administrative costs), property taxes, legal and insurance costs, local development fees and contingencies, lease-up and marketing costs, and miscellaneous costs. For self-storage, indirect costs are typically in the 10 percent to 20 percent range of direct costs.
See Building and Site Improvements – Cost Summary table above.
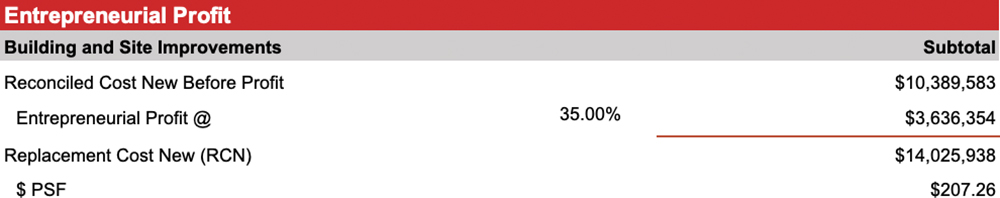
Entrepreneurial Profit
Entrepreneurial profit represents the return to the developer and is separate from contractor’s overhead and profit. Developers are reporting a profit range from 20 percent to 35 percent with an average of 30 percent. Self-storage profit is high due to the difficulty in obtaining zoning approvals or entitlements, as municipalities tend not to like the sector because it offers no retail tax revenues and creates few jobs per facility. As a result, self-storage profit factors have been increasing over the past five years. See Entrepreneurial Profit table above.
We have compared the survey research of Newmark and the developer’s budget and they reasonably corroborate. Since the variance is small it confirms the reasonableness of the developer’s budget. Considering the MVS data is based on multiple facilities we have relied on this for our feasibility analysis.
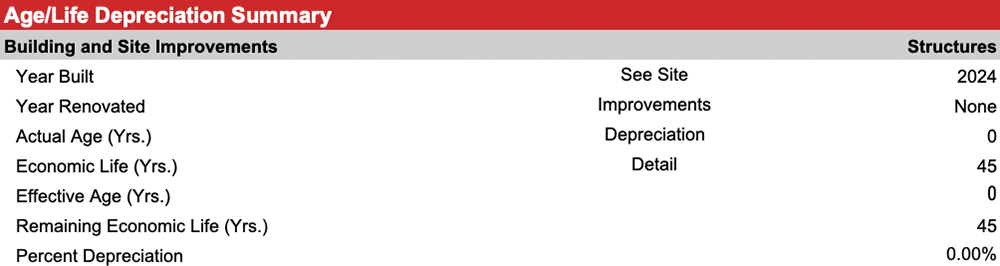
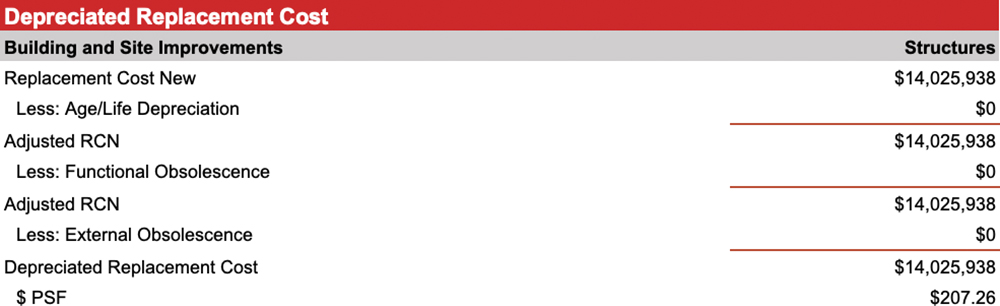
Depreciation
Depreciation is defined as “a loss in property value from any cause; the difference between the contributory value of an improvement and its cost at the time of appraisal.” There are essentially three sources of accrued depreciation:
- Physical deterioration, both curable and incurable;
- Functional obsolescence, both curable and incurable; and
- External obsolescence.
In this case, the subject trade area has sufficient demand for additional supply based on four tools of analysis. Moreover, the contemplated development (the subject property) achieves milestone of feasibility consistent with the market using financial and cost analytics. Make sure feasibility reports include detailed analyses and multiple methodologies to support credible conclusions.