







How to enjoy our new magazine:
Just scroll!
Click or tap the table of contents icon in the menu bar to find any article.
Read any article by clicking or tapping the read full article button below each article intro.
Jump back to your previous browsing spot from any article using the menu bar or back to issue button.

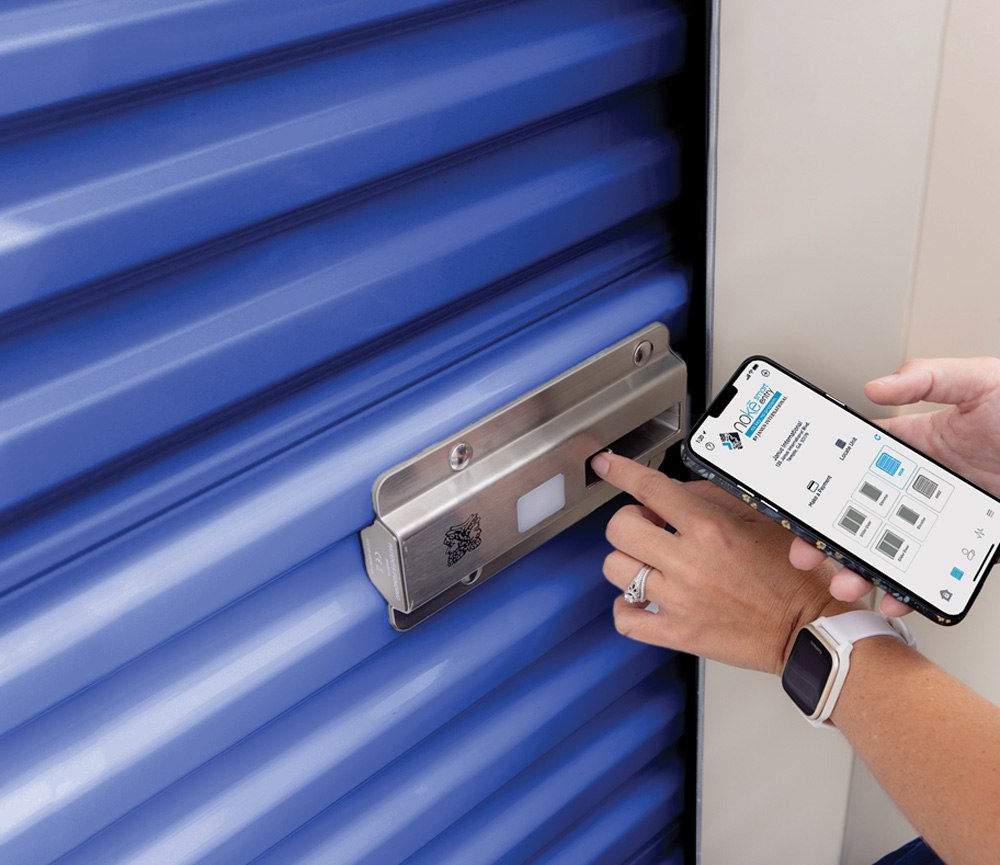

+ Janus Doors
– Gina Cruz, Property Manager, Guardian Storage.

Reports
Studies
Services
• Site Plan Reviews • Development Assistance • Office Layout • Vendor Recommendations • Unit Mix Reviews • 3rd Party Management Contract Review • Security Plans • Asset Management
 1-866-279-5673
 info@bmsgrp.com
Almanac
-
PUBLISHER
Poppy Behrens
-
Director Of Sales & Marketing
Lauri Longstrom-Henderson
(800) 824-6864 -
Creative Director
Carlos Padilla • (800) 352-4636
-
Editor
Erica Shatzer
-
LEAD WRITER / WEB MANAGER
Brad Hadfield
-
Storelocal® Media Corporation
Travis M. Morrow, CEO -
Websites
modernstoragemedia.com
shop.modernstoragemedia.com
www.MSMTHEShow.com -
Visit Messenger Online!
Visit our Self-Storage Resource Center online at
ModernStorageMedia.com,
where you can browse our paid publications, research archived articles, sign up for a magazine subscription, submit a change of address, and more. -
Reproduction in whole or in part without written permission is prohibited.
Printed in the United States.Unsolicited manuscripts, artwork and photographs must be accompanied by an addressed return envelope and the necessary postage. Publisher assumes no responsibility for the return of materials.
All correspondence and inquiries should be addressed to:
MSM
PO Box 608
Wittmann, Arizona 85361-9997
Phone: (800) 352-4636
- Section 1 – Industry Numbers 11
- Section 2 – Ownership 15
- Section 3 – Self-Storage Supply Forecast 23
- Section 4 – Economics & Demographics 27
- Section 5 – Customer Traits 39
- Section 6 – Security & Smart Technology 45
- Section 7 – Occupancy 57
- Section 8 – Rental Rates 71
- Section 9 – Marketing 87
- Section 10 – Site Information 95
- Section 11 – RV & Boat Storage 103
- Section 12 – Cap Rates 109
- Section 13 – Market Conditions 115
- Section 14 – Finance 123
- Section 15 – Valuation 131
First published in 1992, the annual Self-Storage Almanac is known throughout the industry as the leading self-storage source for data, trends, and in-depth analysis.
With information gathered from Noah Starr and his team at TractIQ, our data provider, the Almanac is continually referenced, cited, and relied on for its current and comprehensive statistics that self-storage owners, operators, investors, developers, and appraisers across the country utilize to make better informed business decisions.

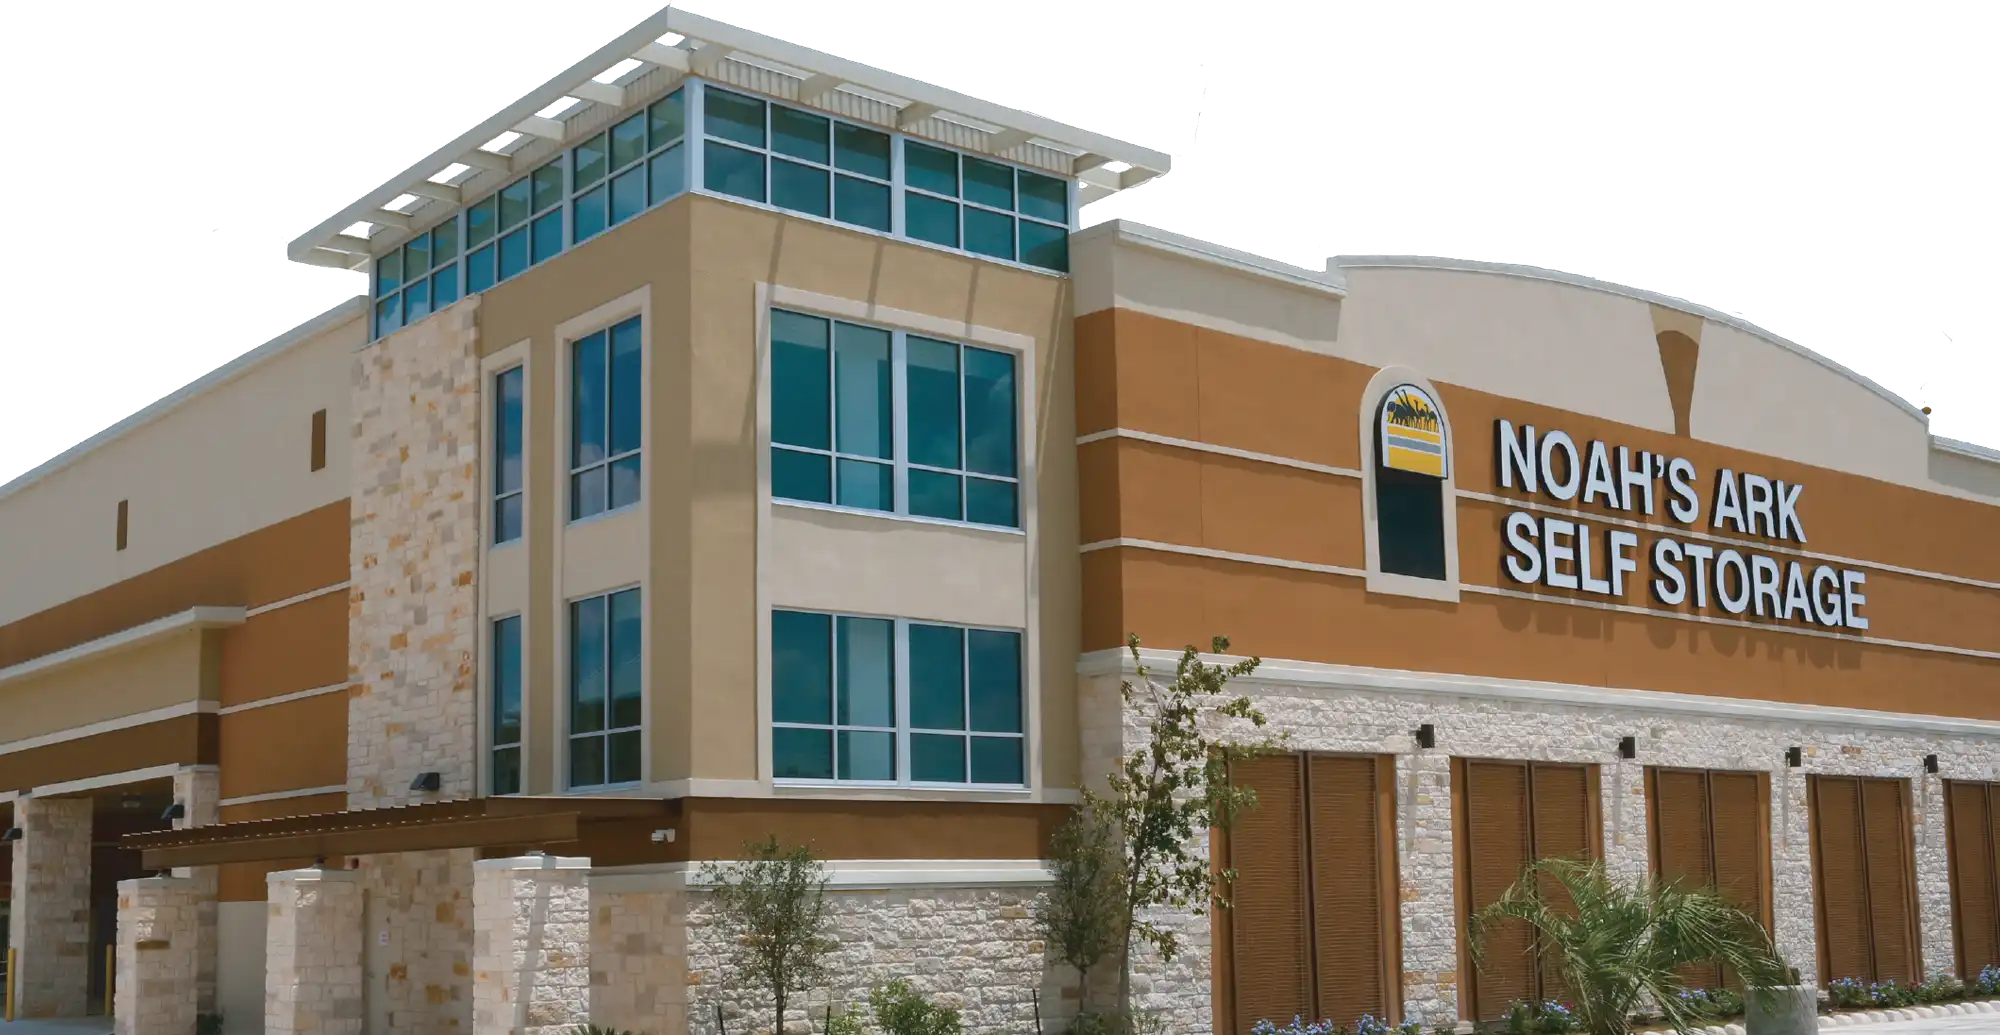
Invest with confidence in a family-owned and operated self-storage brand backed by 40 years of proven experience. Built on trust, stability, and hands-on management, our company has thrived across market cycles while delivering consistent value.
Join a legacy of smart growth and reliable returns in an essential, resilient industry.

210-405-6695
theparhamgroup.com







elcome to the 2026 Self-Storage Almanac. For 35 years, the Almanac has been the leading source of data for the self-storage industry. As the most sought-after publication in our industry, we take pride in delivering the best industry data in each and every edition, and this year’s is no exception.
In fact, with TractIQ as the official data provider, on top of a reimagined modern design and trends from the most recent version of the SSA’s Self Storage Demand Study, MSM is confident that this volume is the best Almanac it has ever produced.
Led by CEO Noah Starr, who also writes “Stats By Starr,” a quarterly column for MSM’s Messenger magazine, TractIQ is a leading provider of self-storage data and analytics, tracking more than 70,000 self-storage facilities for insights on rental rates, construction activity, ownership data, and demographics.
TractIQ also shares MSM’s commitment to transparency and delivering the most accurate, accessible data to the self-storage industry, which is of the utmost importance considering that data presented in the Almanac is used nationwide in feasibility studies and reporting on the health of the industry. For that reason, we have made this edition cleaner and more concise than ever before, upgrading the reader experience through more visually appealing charts and tables and improved readability, as you will see on the following pages.
Though the Almanac has changed since last year, one thing hasn’t: The need for comprehensive, market-specific research and ample due diligence remains vital to the success of any investment in our industry. Because data constantly fluctuates, and this publication is meant to serve as a benchmark, it is still essential to retain an unbiased, third-party consultant to conduct extensive feasibility and market studies.
If you have any questions about the Almanac, please feel free to reach out to me at poppy@modernstoragemedia.com. We wish you the best in your self-storage endeavors!

Publisher

elcome to the 2026 Self-Storage Almanac. For 35 years, the Almanac has been the leading source of data for the self-storage industry. As the most sought-after publication in our industry, we take pride in delivering the best industry data in each and every edition, and this year’s is no exception.
In fact, with TractIQ as the official data provider, on top of a reimagined modern design and trends from the most recent version of the SSA’s Self Storage Demand Study, MSM is confident that this volume is the best Almanac it has ever produced.
Led by CEO Noah Starr, who also writes “Stats By Starr,” a quarterly column for MSM’s Messenger magazine, TractIQ is a leading provider of self-storage data and analytics, tracking more than 70,000 self-storage facilities for insights on rental rates, construction activity, ownership data, and demographics.
TractIQ also shares MSM’s commitment to transparency and delivering the most accurate, accessible data to the self-storage industry, which is of the utmost importance considering that data presented in the Almanac is used nationwide in feasibility studies and reporting on the health of the industry. For that reason, we have made this edition cleaner and more concise than ever before, upgrading the reader experience through more visually appealing charts and tables and improved readability, as you will see on the following pages.
Though the Almanac has changed since last year, one thing hasn’t: The need for comprehensive, market-specific research and ample due diligence remains vital to the success of any investment in our industry. Because data constantly fluctuates, and this publication is meant to serve as a benchmark, it is still essential to retain an unbiased, third-party consultant to conduct extensive feasibility and market studies.
If you have any questions about the Almanac, please feel free to reach out to me at poppy@modernstoragemedia.com. We wish you the best in your self-storage endeavors!
Publisher
- 180 Self-Storage54
- Argus Professional Storage Management by SmartStop63
- Baco Properties10
- Baja ConstructionInside Back Cover
- BETCO Inc.8
- BMSGRP Self Storage Consultants1
- Boxwell14
- BSC Group, The124
- Building Outlet Corporation / Mini Storage Outlet114
- Caliber Metal Buildings93
- Central States Manufacturing56
- Cubesmart31
- DALLENBACH-COLE Architecture33
- Janus InternationalInside Front Cover
- Janus International44
- Jones Lang LaSalle – Americas38
- Jordan Architects Inc.108
- Kiwi II Construction Inc.123
- Live Oak Bank70
- MiniCo Insurance102
- Neighbor.com22
- Newmark Valuation & Advisory132
- Parham Group Company/NDS, Joshua, Noah’s Ark3
- PTI Security Systems21
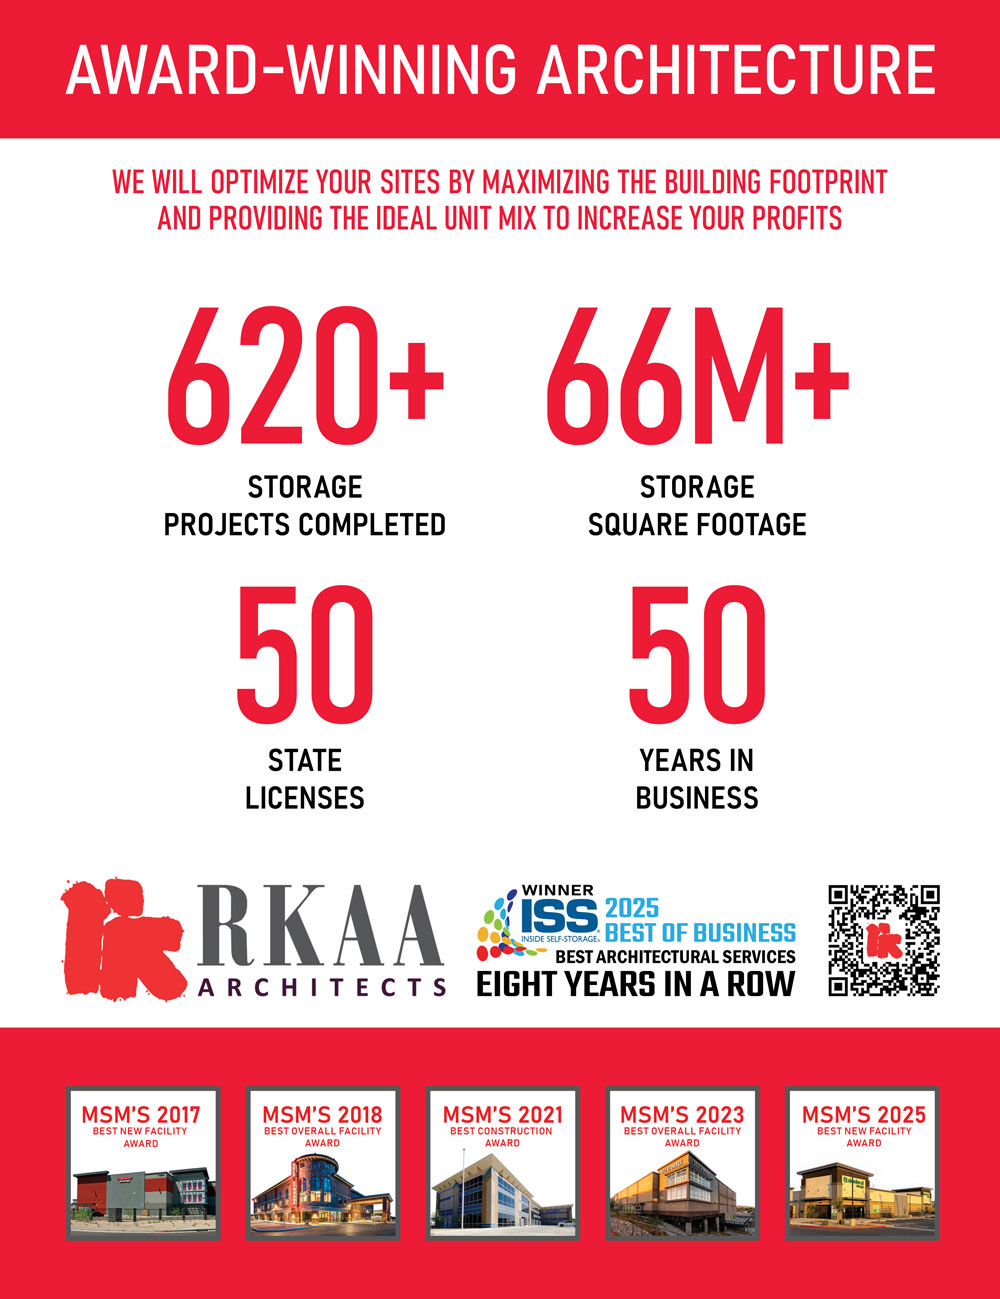
- RKAA Architects, Inc6
- SecureLease (On The Move Insurance Agency)85
- Self Storage Association (SSA)138
- StorageMart26
- StoragePRO Management, Inc.13
- StorageVaultBack Cover
- Storelocal86
- Tenant Inc.51
- TLW Construction37
- Trac-Rite83
- Trachte Building Systems75
- TractIQ55
- TractIQ101
- Universal Storage Group (USG)94
- Warehouse Anywhere49





Noah Starr and Taylor Bills, TractIQ
Jason Mathew, Janus International
Sarah Beth DeFazio and Lou Barnholdt, Universal Storage Group
Tommy Nguyen, Storage Pug
Yardi Matrix
Adam Karnes and Shawn Hill, The BSC Group
Ben Vestal and Cole Carosella, Argus Self Storage Advisors
Poppy Behrens
Greg Isaacson
Erica Shatzer
Alejandra Zilak
This study, or parts thereof, may not be reproduced, copied, or transmitted in any form without prior written permission of MSM, which has received one-time reproduction permission from the sources referred to herein.
All rights reserved • Copyright © 2026 • Printed in the U.S.A.
MSM • PO Box 608 • Wittmann, Arizona 85361-9997 • (800) 824-6864

very successful self-storage leader knows that better data leads to better decisions. For over 30 years, the Self-Storage Almanac has provided the industry with the best data available. Data availability, accuracy, and coverage continue to increase and improve with each passing year. For the 2026 Self-Storage Almanac, we are excited to officially partner with TractIQ as the primary trusted source. TractIQ empowers investors, brokers, and operators to find and analyze opportunities faster with the most trusted data in the industry. The data includes verified owner information, real-time rental rates, development tracking, and demographic insights across 69,000-plus self-storage facilities nationwide. Our goal is to continually provide the best data so you can succeed in your self-storage business, and our partnership with TractIQ will do just that.
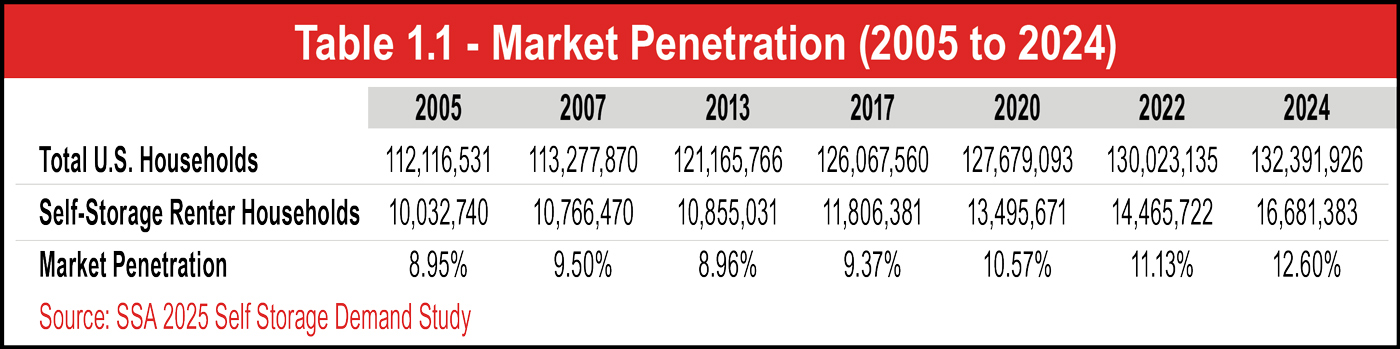
See Table 1.1.
See Table 1.2.
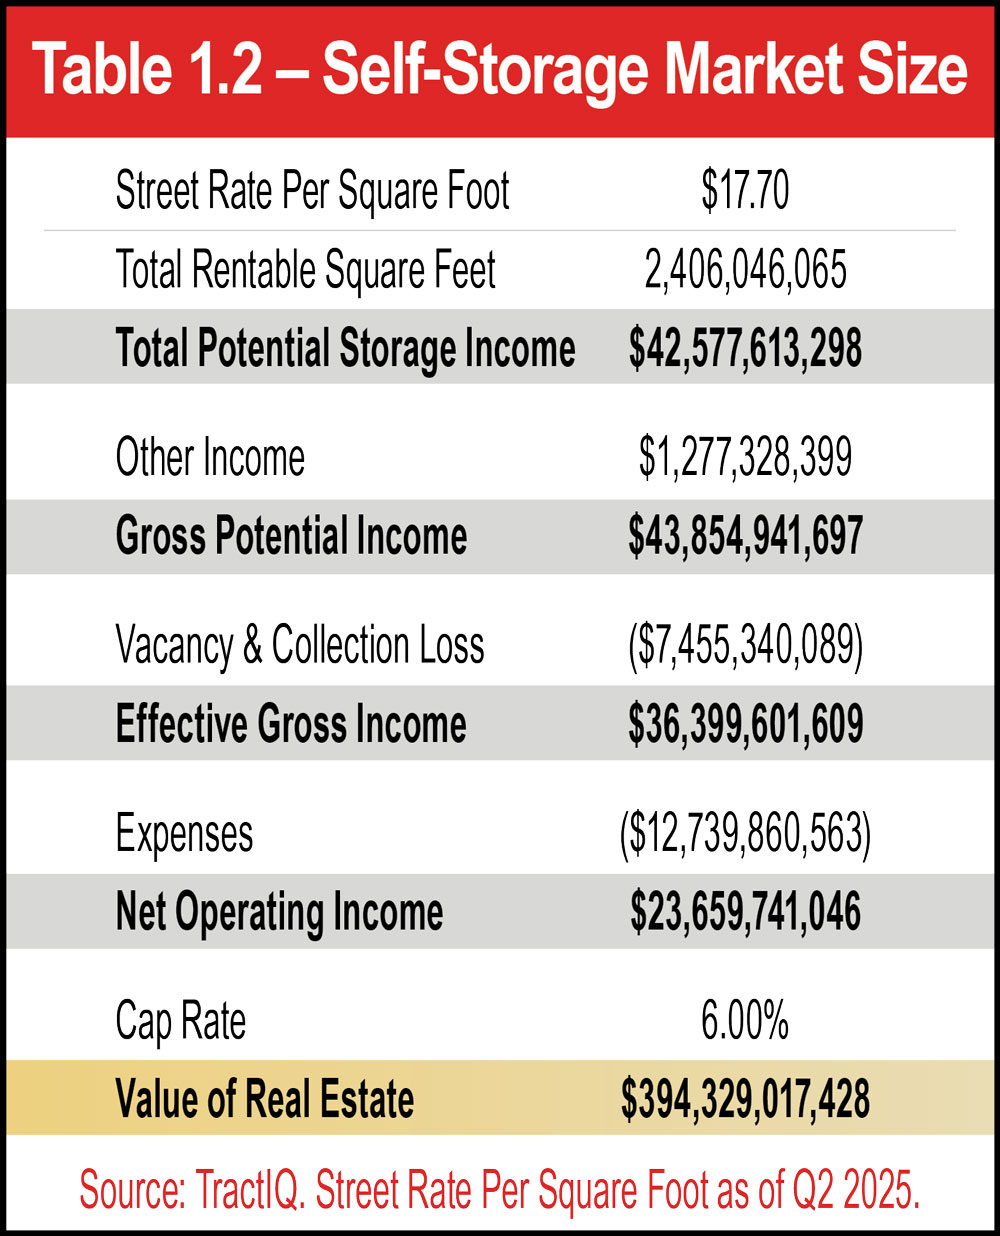
GPI also includes ancillary income from fees, insurance, billboards, retail sales, and other items. Ancillary income ranges anywhere from 0 percent of storage rental income to more than 10 percent of storage rental income, depending on the location and operator of the property. Publicly traded self-storage REITs typically report ancillary income percentages that range from 4 percent to 12 percent. To be conservative, we’ve used 3 percent in our analysis, as REITs represent a smaller portion of the overall industry.
Realistically, one could also apply an “achieved rate premium” to GPI, as this analysis is only utilizing street rates. The trend in 2024 showed that achieved rates were typically higher than street rates due to existing customer rate increases (ECRIs). However, in 2025 the spread between street rates and achieved rates narrowed. We’ve intentionally left out applying an “achieved rate premium” due to this very reason.
Effective Gross Income (EGI): This is the net revenue generated by the industry after applying vacancy and collection loss to GPI above. As you will see later in the occupancy section, typical self-storage stabilized occupancy is usually assumed to be between 80 percent and 90 percent. We’ve used an 85 percent physical occupancy rate in our analysis as well as an additional 2 percent to account for collection loss.




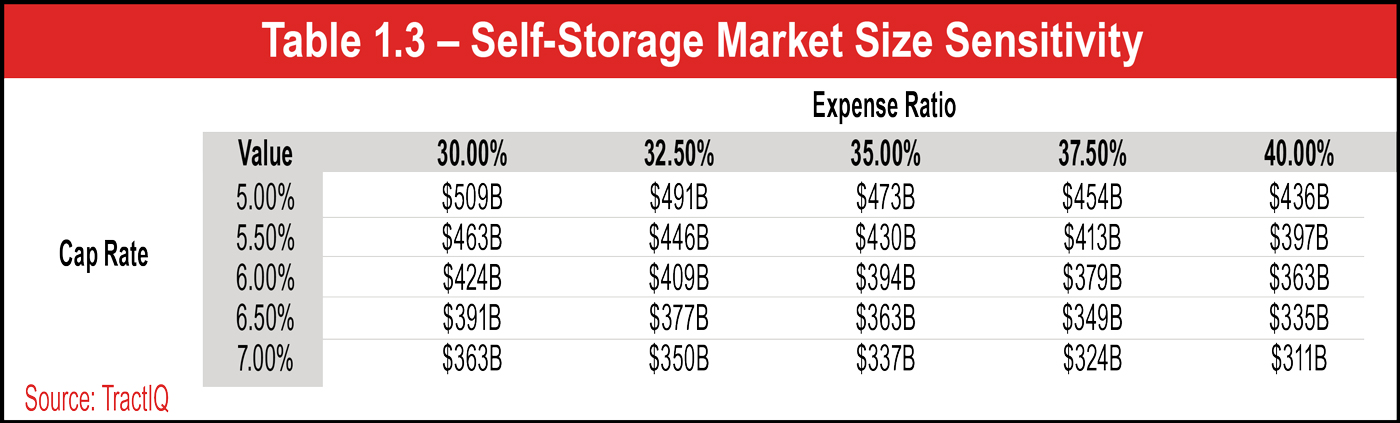
Net Operating Income (NOI) and Total Value of Real Estate: To effectively estimate the total value of the real estate for the self-storage industry, we must apply a cap rate to the industry’s NOI (EGI minus expenses). We’ve applied a 6.0 percent cap rate to the NOI, but Table 1.3 shows a sensitivity table, revealing how the value of the industry changes based on different cap rates and expense ratios.
See Table 1.3.
This real estate market value analysis is a reasonable estimate to give you an idea of the size of the self-storage industry.
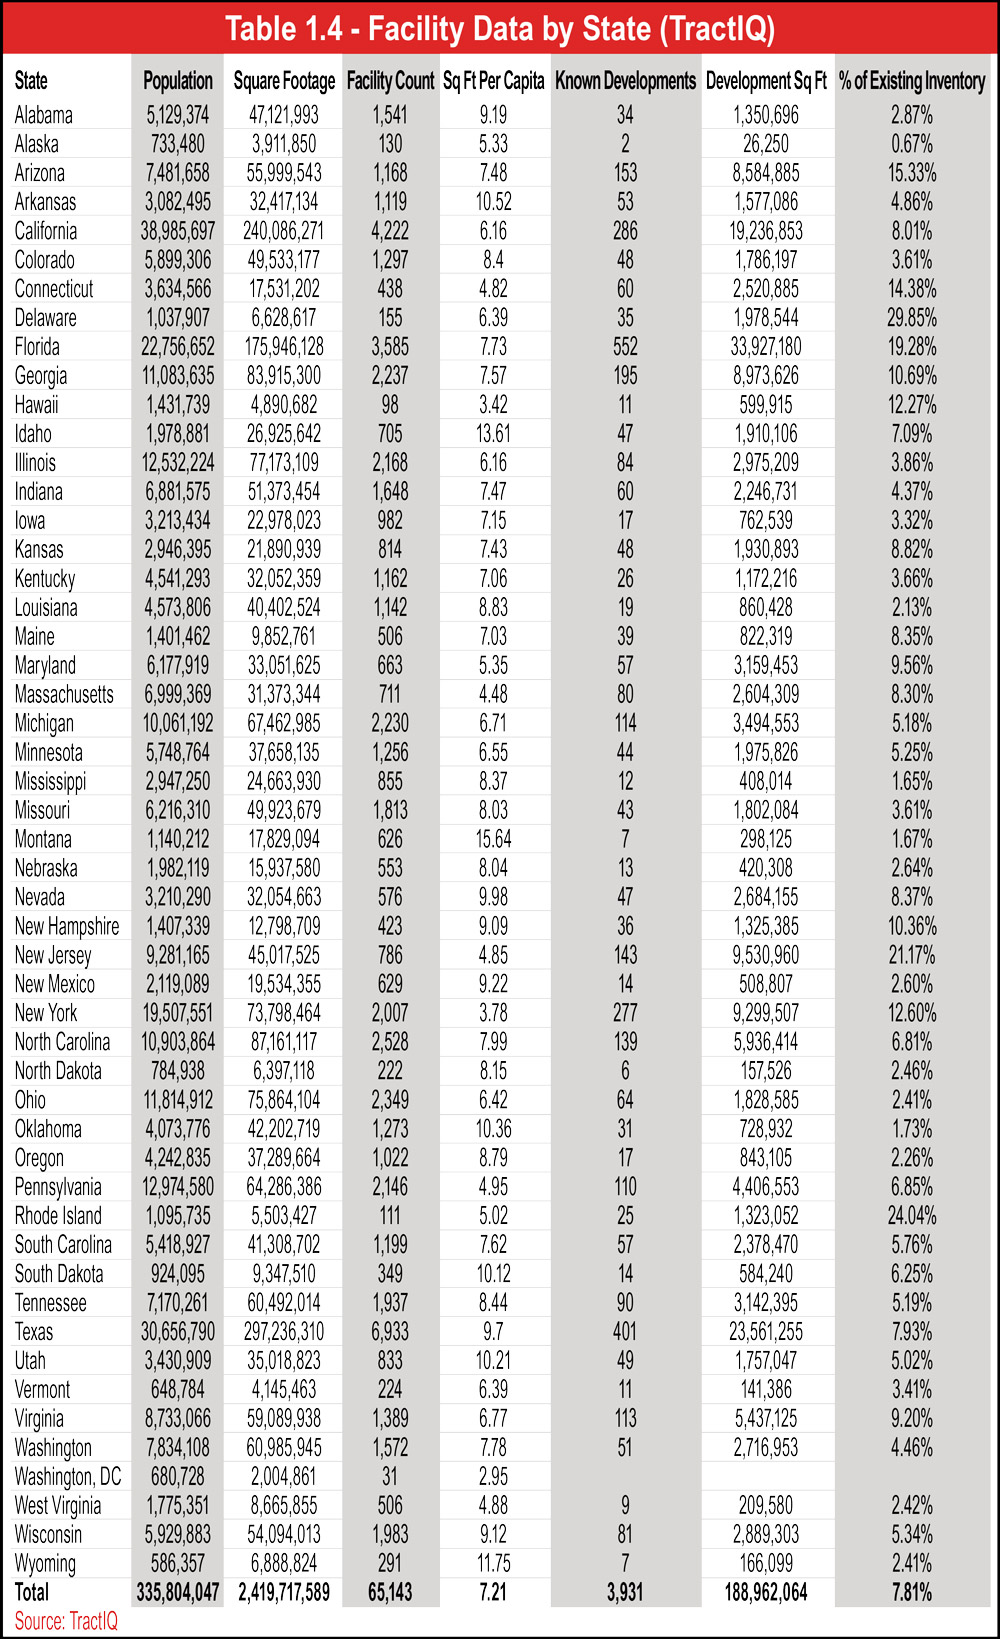
See Table 1.4.
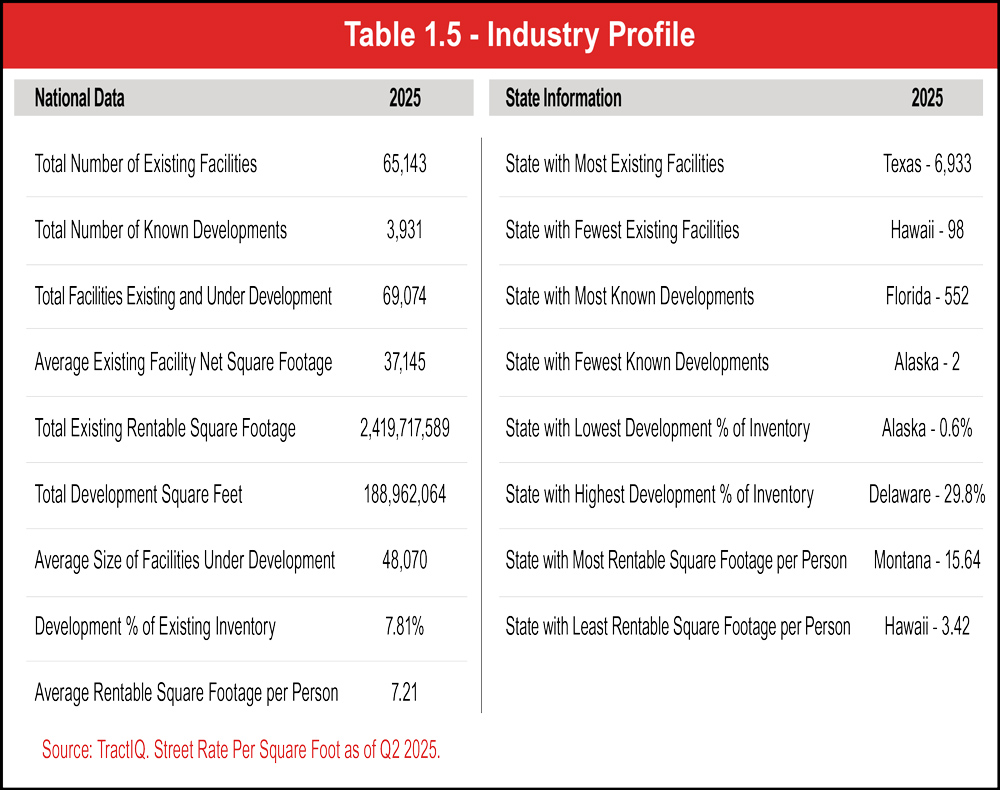
As you can see from Table 1.4, the self-storage industry has over 2.4 billion square feet, 65,000-plus active facilities, and 3,900-plus known developments with a supply per capita of 7.21, according to TractIQ. Table 1.5 summarizes data from Table 1.4 and shows top and bottom states for number of existing facilities, known developments, and square foot per capita.
See Table 1.5.
You will notice the current average size of an existing facility is 37,145 square feet. Compare this to the average size of facilities under development (48,070 square feet). Developers continue to build larger facilities in hopes of generating more revenue per site to offset high construction costs, high interest rates, and the overall difficulty of entitlement and construction. Currently, self-storage square feet under development as a percent of existing inventory equals 7.81 percent. The state with the lowest development square feet as a percent of existing inventory is Alaska at 0.6 percent. The state with the highest development square feet as a percent of existing inventory is Delaware at 29.8 percent.
As the self-storage industry’s data continues to improve, MSM will continue to uphold its commitment to supplying the most accurate information possible in its annual Self-Storage Almanac.






aking a closer look at industry ownership, only data from TractIQ and MSM’s 2025 Top Operator’s list were used for this section.
In analyzing ownership data among the top 100 operators, we look at four groups:
- Real estate investment trusts,
- Other Top Operators with portfolios of both properties owned and managed,
- Other Top Operators whose portfolios only include properties they own, and
- Other Top Operators whose portfolios only include properties they manage.
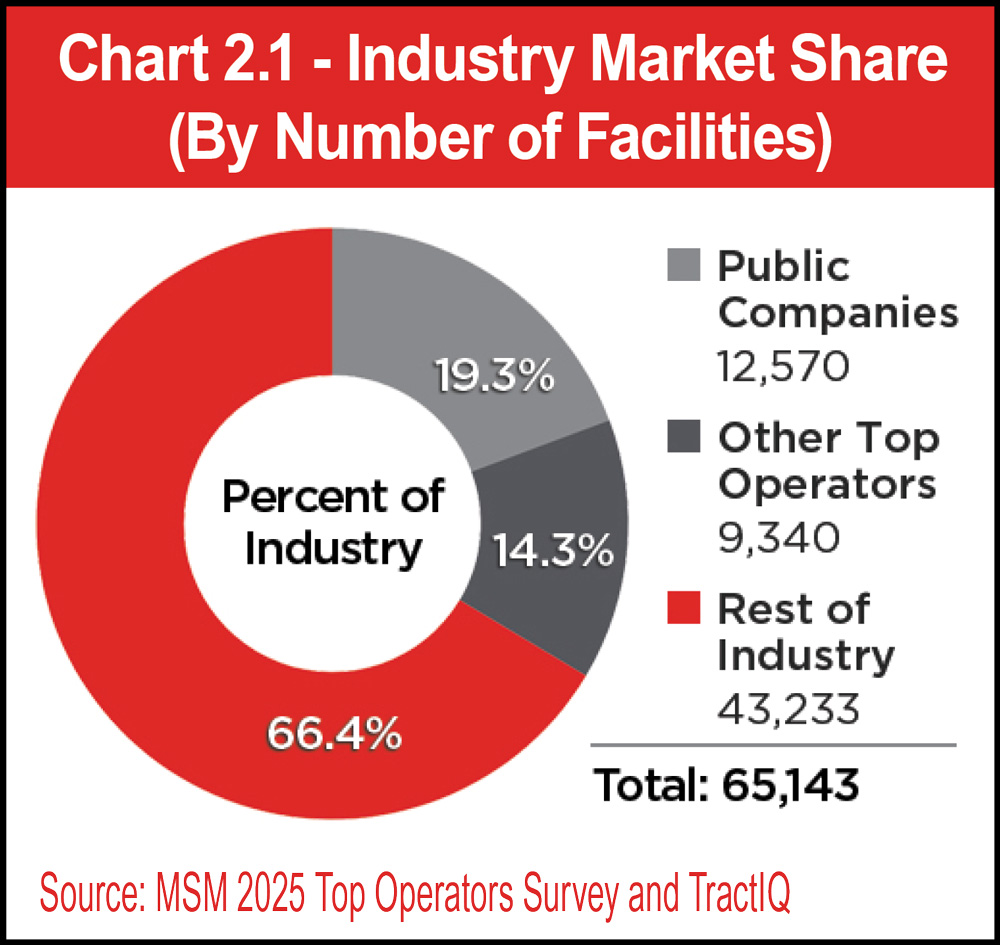
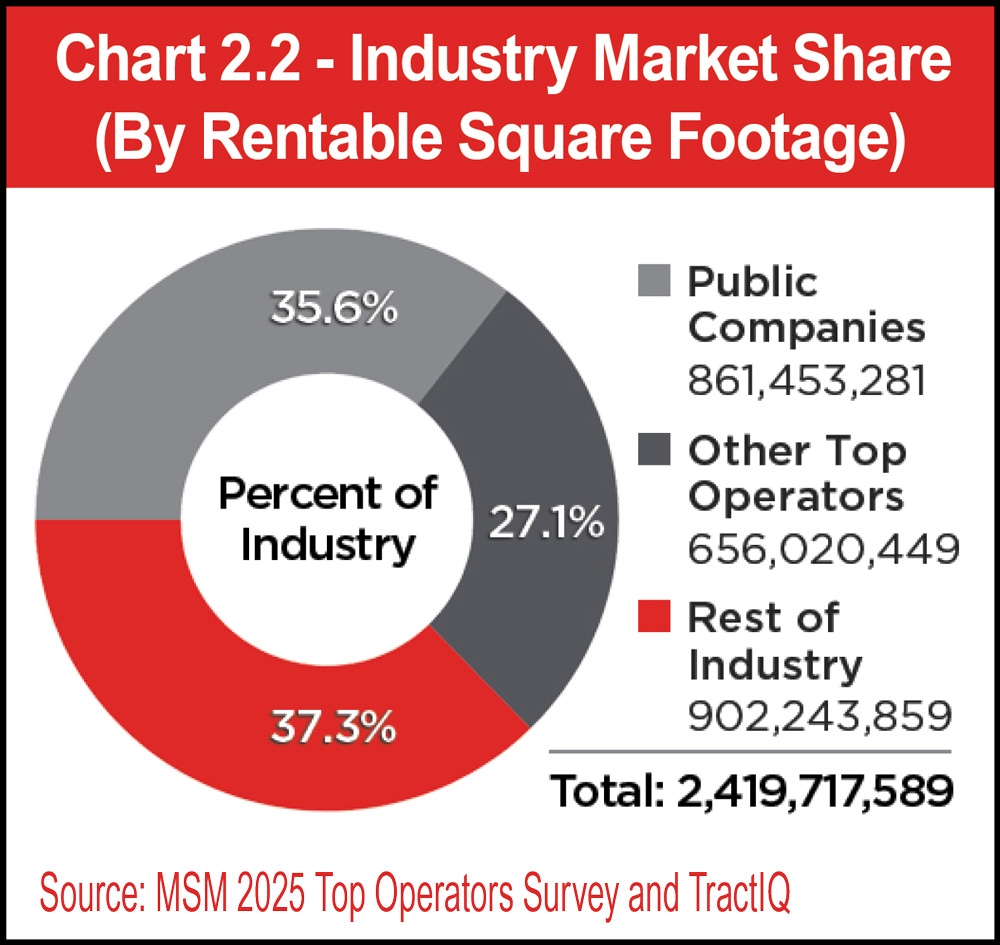
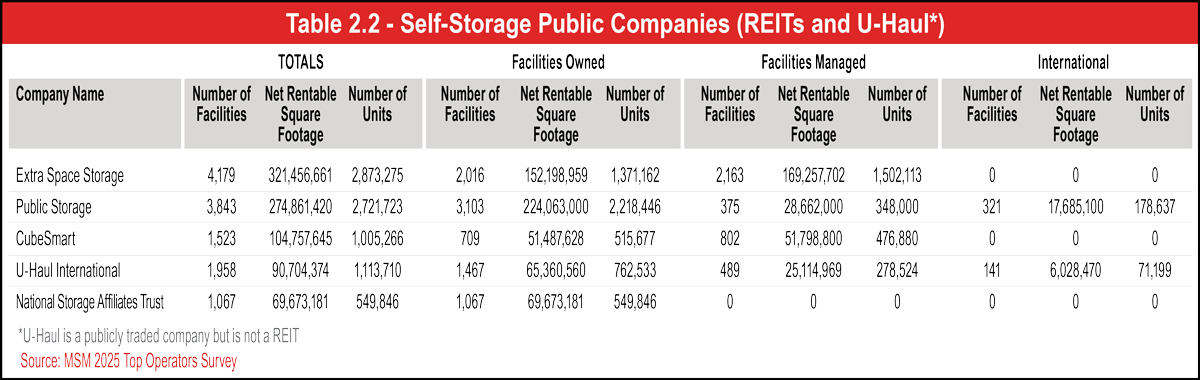
The five largest self-storage operators (REITs and U-Haul, a publicly traded company) comprise 19.3 percent of facilities and 35.6 percent of rentable square footage. Their portfolios include properties they own and manage, except for National Storage Affiliates (NSA), whose portfolio does not include any third-party managed facilities as of 2025.
See Charts 2.1 and 2.2.
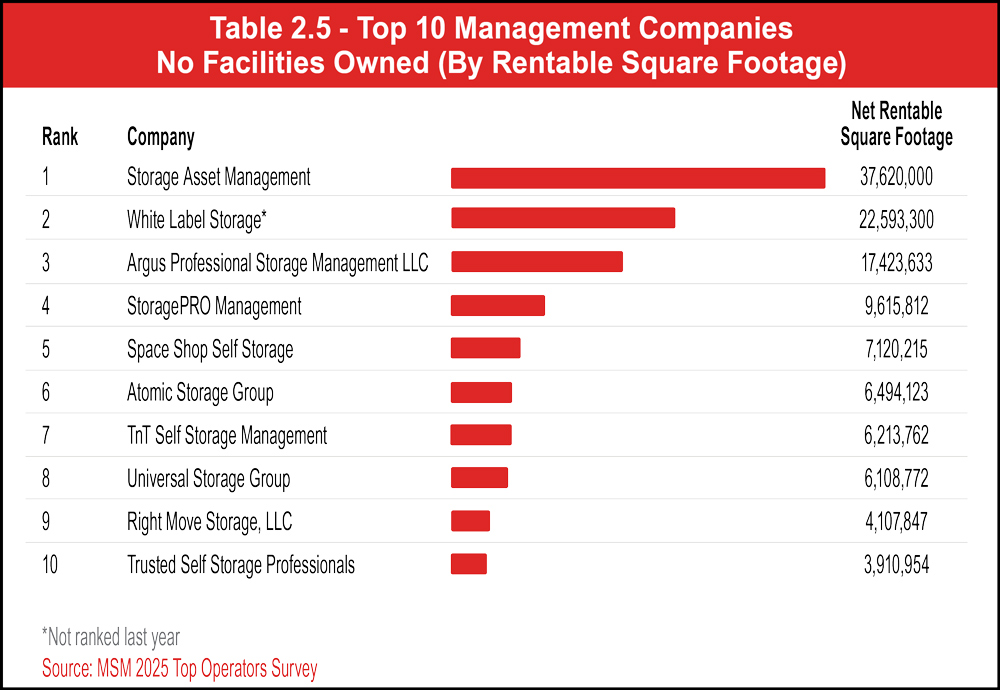
Other Top Operators whose portfolios only include properties they own comprise 40 companies on the 2025 list of top 100 operators. Thirty-eight operators both own and manage self-storage facilities. Finally, 17 companies on the Top Operators list only provide third-party management; they do not own any facilities.
Adding up the five REITs, 38 top operators with both owned and managed facilities, 40 with owned facilities only, and 17 with exclusively managed facilities brings us to 100 operators on the list.
In 2025, 27 operators were considered “new” to the Top Operators list; they didn’t rank on the 2024 list, but some had been ranked in previous years, and consolidation has (and will continue) to make way for new entrants, such as StoragePRO’s (No. 26) acquisition of Storage Investment Management, Inc. (SIMI) in January. Of those 27, 14 own properties exclusively and do not offer third-party management. Conversely, four of 2025’s new entrants provide third-party management but do not own any facilities.
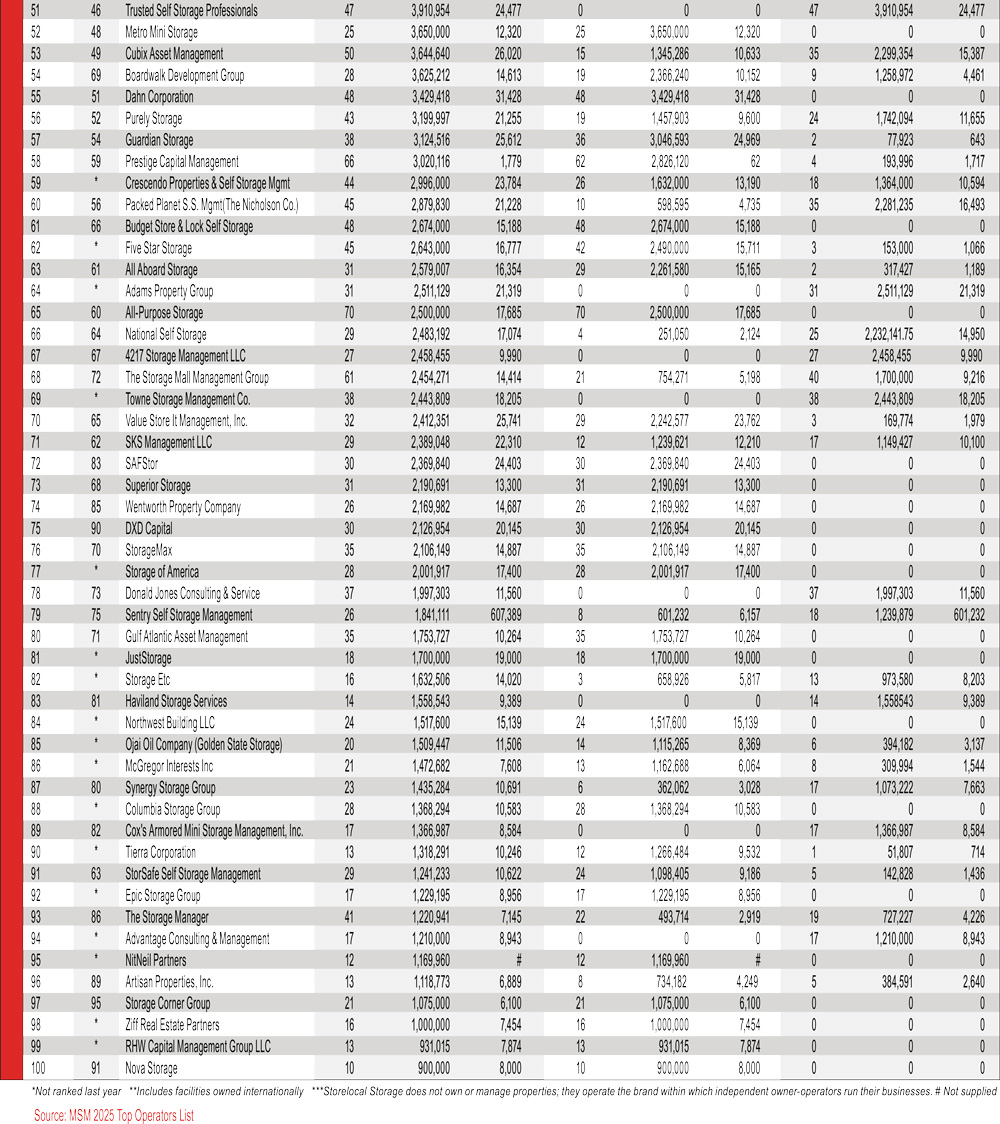
See Table 2.1.
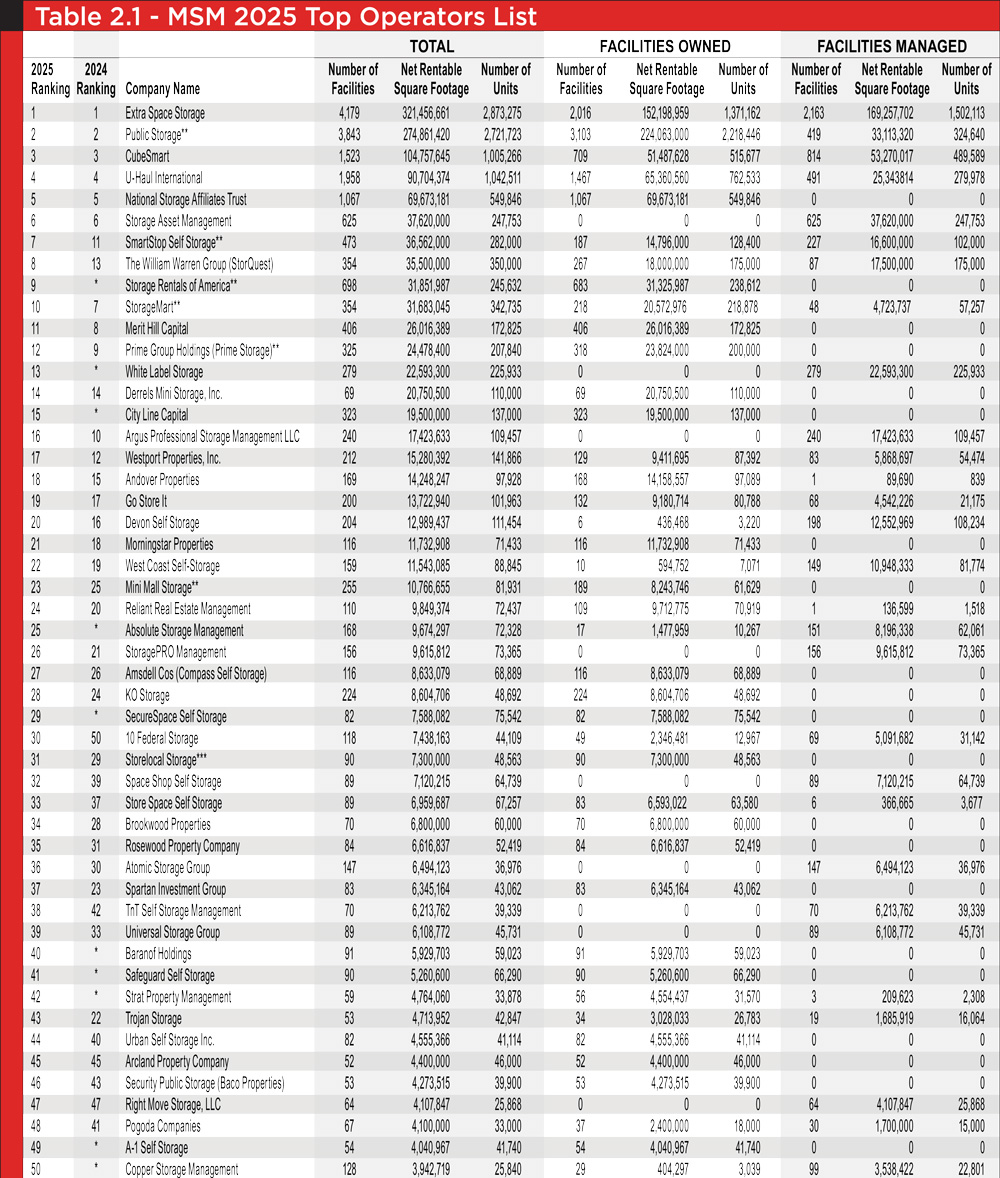
Like 2024, Public Storage, the second-largest operator, grew its portfolio by another approximately 11 million NRSF. Although about half of that amount (approximately 5 million NRSF) was added to the management side of its portfolio, Extra Space Storage still manages five times as much net rentable square feet in the United States than Public Storage.
Once again claiming third place is CubeSmart, which manages almost 2 million more NRSF than it owns. And with approximately 53.2 million NRSF of storage managed, roughly 20 million more than Public Storage, CubeSmart has the second-largest third-party managed portfolio in the self-storage industry.
Rounding out the REITs are U-Haul International (No. 4) and National Storage Affiliates Trust (No. 5). Their ranks remain unchanged from 2024, even though they each added about 1 million NRSF to their portfolios since the 2024 Top Operators Survey was completed.
Of special note: Next year’s REIT data will include SmartStop Self Storage, which became a REIT in the second quarter of 2025.
See Table 2.2.
Ranking No. 8 is The William Warren Group, which operates facilities under the StorQuest brand; it ranked 13th last year. In nineth is Storage Rentals of America (SROA), an operator that wasn’t listed in the 2024 list but has been ranked in previous years. It owns and operates nearly 32 million NRSF from 683 facilities across the United States, 12 in England, and three in Scotland. Other high-ranking newcomers to the 2025 list include White Label Storage at No. 13, City Line Capital at No. 15, and Absolute Storage Management at No. 25.
Finally, due to the addition of SROA and upward movement from The William Warren Group and SmartStop, as well as a slight decline in portfolio size, StorageMart has dropped from seventh to tenth.
As seen in Chart 2.1, market share of “Other Top Operators” ranked No. 6 to 100 is 14.3 percent of the industry’s total number of facilities. By rentable square footage, shown in Chart 2.2, their share is much more substantial at 27.1 percent.
However, the Rest of Industry’s lead over REITs and Other Top Operators is negligible when calculated by rentable square footage. Chart 2.2 shows that Rest of Industry holds 37.3 percent of the market share by rentable square footage, which is only 1.7 percent more than the REITs but 10.2 percent more than Other Top Operators.
See Table 2.3.
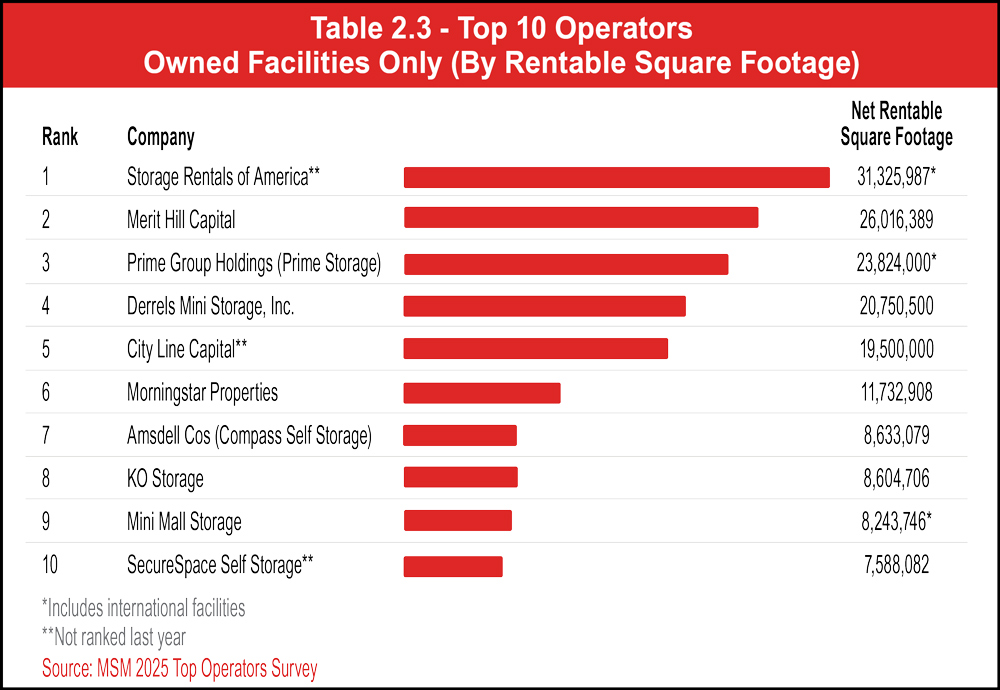
Remaining in the No. 4 position is Derrels Mini Storage with nearly 21 million rentable square feet. Another newcomer to the list, City Line Capital, with 19.5 million rentable square feet, has landed ahead of Morningstar Properties, which is now No. 6. Morningstar Properties dropped one rank last year as well; it had ranked No. 4 in the 2024 Self-Storage Almanac. KO Storage also moved down a spot to make room for Amsdell Companies (Compass Self Storage); both companies have slightly more than 8.6 million rentable square feet, but Amsdell reported having almost 30,000 more square feet in its portfolio. Ranked 7th last year, Mini Mall Storage, which has both American and Canadian facilities, is now No. 9. SecureSpace Self Storage, one more not ranked in 2024, has taken the No. 10 slot with more than 7.5 million rentable square feet.
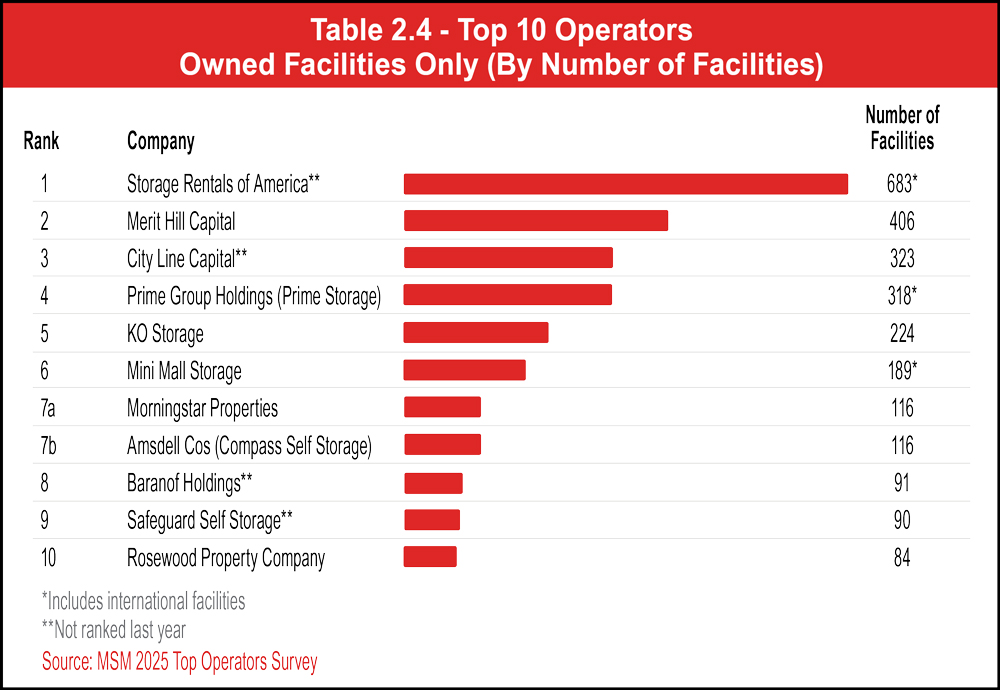
The ranks are somewhat different when sorted by total number of facilities, as seen in Table 2.4 and Chart 2.4. While the No. 1 and No. 2 companies are the same (Storage Rentals of America with 683 facilities and Merit Hill with 406), City Line Capital comes in third for having five more facilities than Prime Group Holdings. KO Storage, ranked 8th by rentable square footage, moves up to No. 5 by number of facilities. In the No. 6 position is Mini Mall Storage with 189 facilities; this is an increase of three ranks when compared to its rentable square footage ranking. With 116 facilities each, Morningstar Properties and Amsdell Companies are tied for No. 7, so they have been listed as 7a and 7b. Coming in eighth and nineth are two newcomers to the 2025 Top Operators list: Baranof Holdings and Safeguard Self Storage. They have 91 and 90 facilities, respectively. Rosewood Property Company takes No. 10 with 84 facilities. It should be noted that Storelocal Storage, which ranked 31st on the 2025 Top Operators list, has been omitted from this list, despite reporting a portfolio of 90 properties, because it operates the brand within which independent owner-operator run their businesses; it does not own those properties.
See Table 2.4.
See Table 2.5.
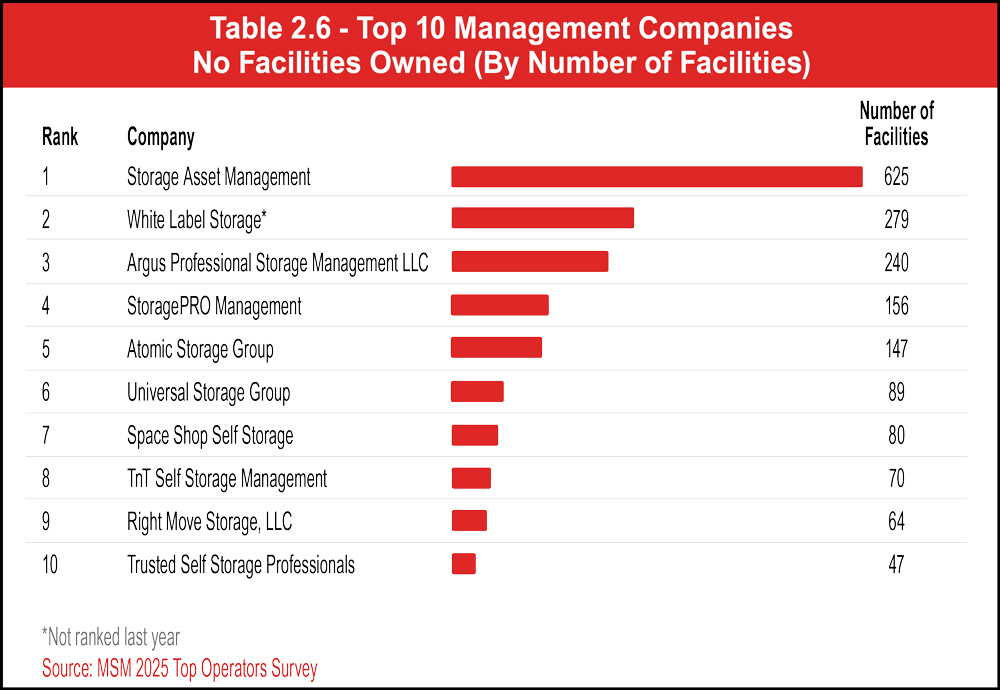
See Table 2.6.
Although new development has somewhat slowed compared to years past, growth of the REITs’ extensive portfolios has not. With more management contracts under their belts, smaller facilities being developed, and corporate consolidation of top operators, the shifting ownership landscape is deserving of attention. It will be interesting to see what 2026 brings!

At PTI Security Systems, our commitment to quality and passion for innovation drives the development of advanced security solutions to help operators scale with confidence. From smart technology to fully integrated systems, our solutions provide greater security, insights, and control across any facility.

don’t keep up with the competition;
they lead the pack.



MOBILE APP
SMART KEYPAD
SMART LATCH
MOBILE APP
SMART KEYPAD
SMART LATCH


or the Q4 2025 update, the Yardi Matrix Self-Storage Supply Forecast has been increased by approximately 4.5 percent for 2025 and 2026. The remaining years’ forecast remains unchanged.
See Table 3.1.
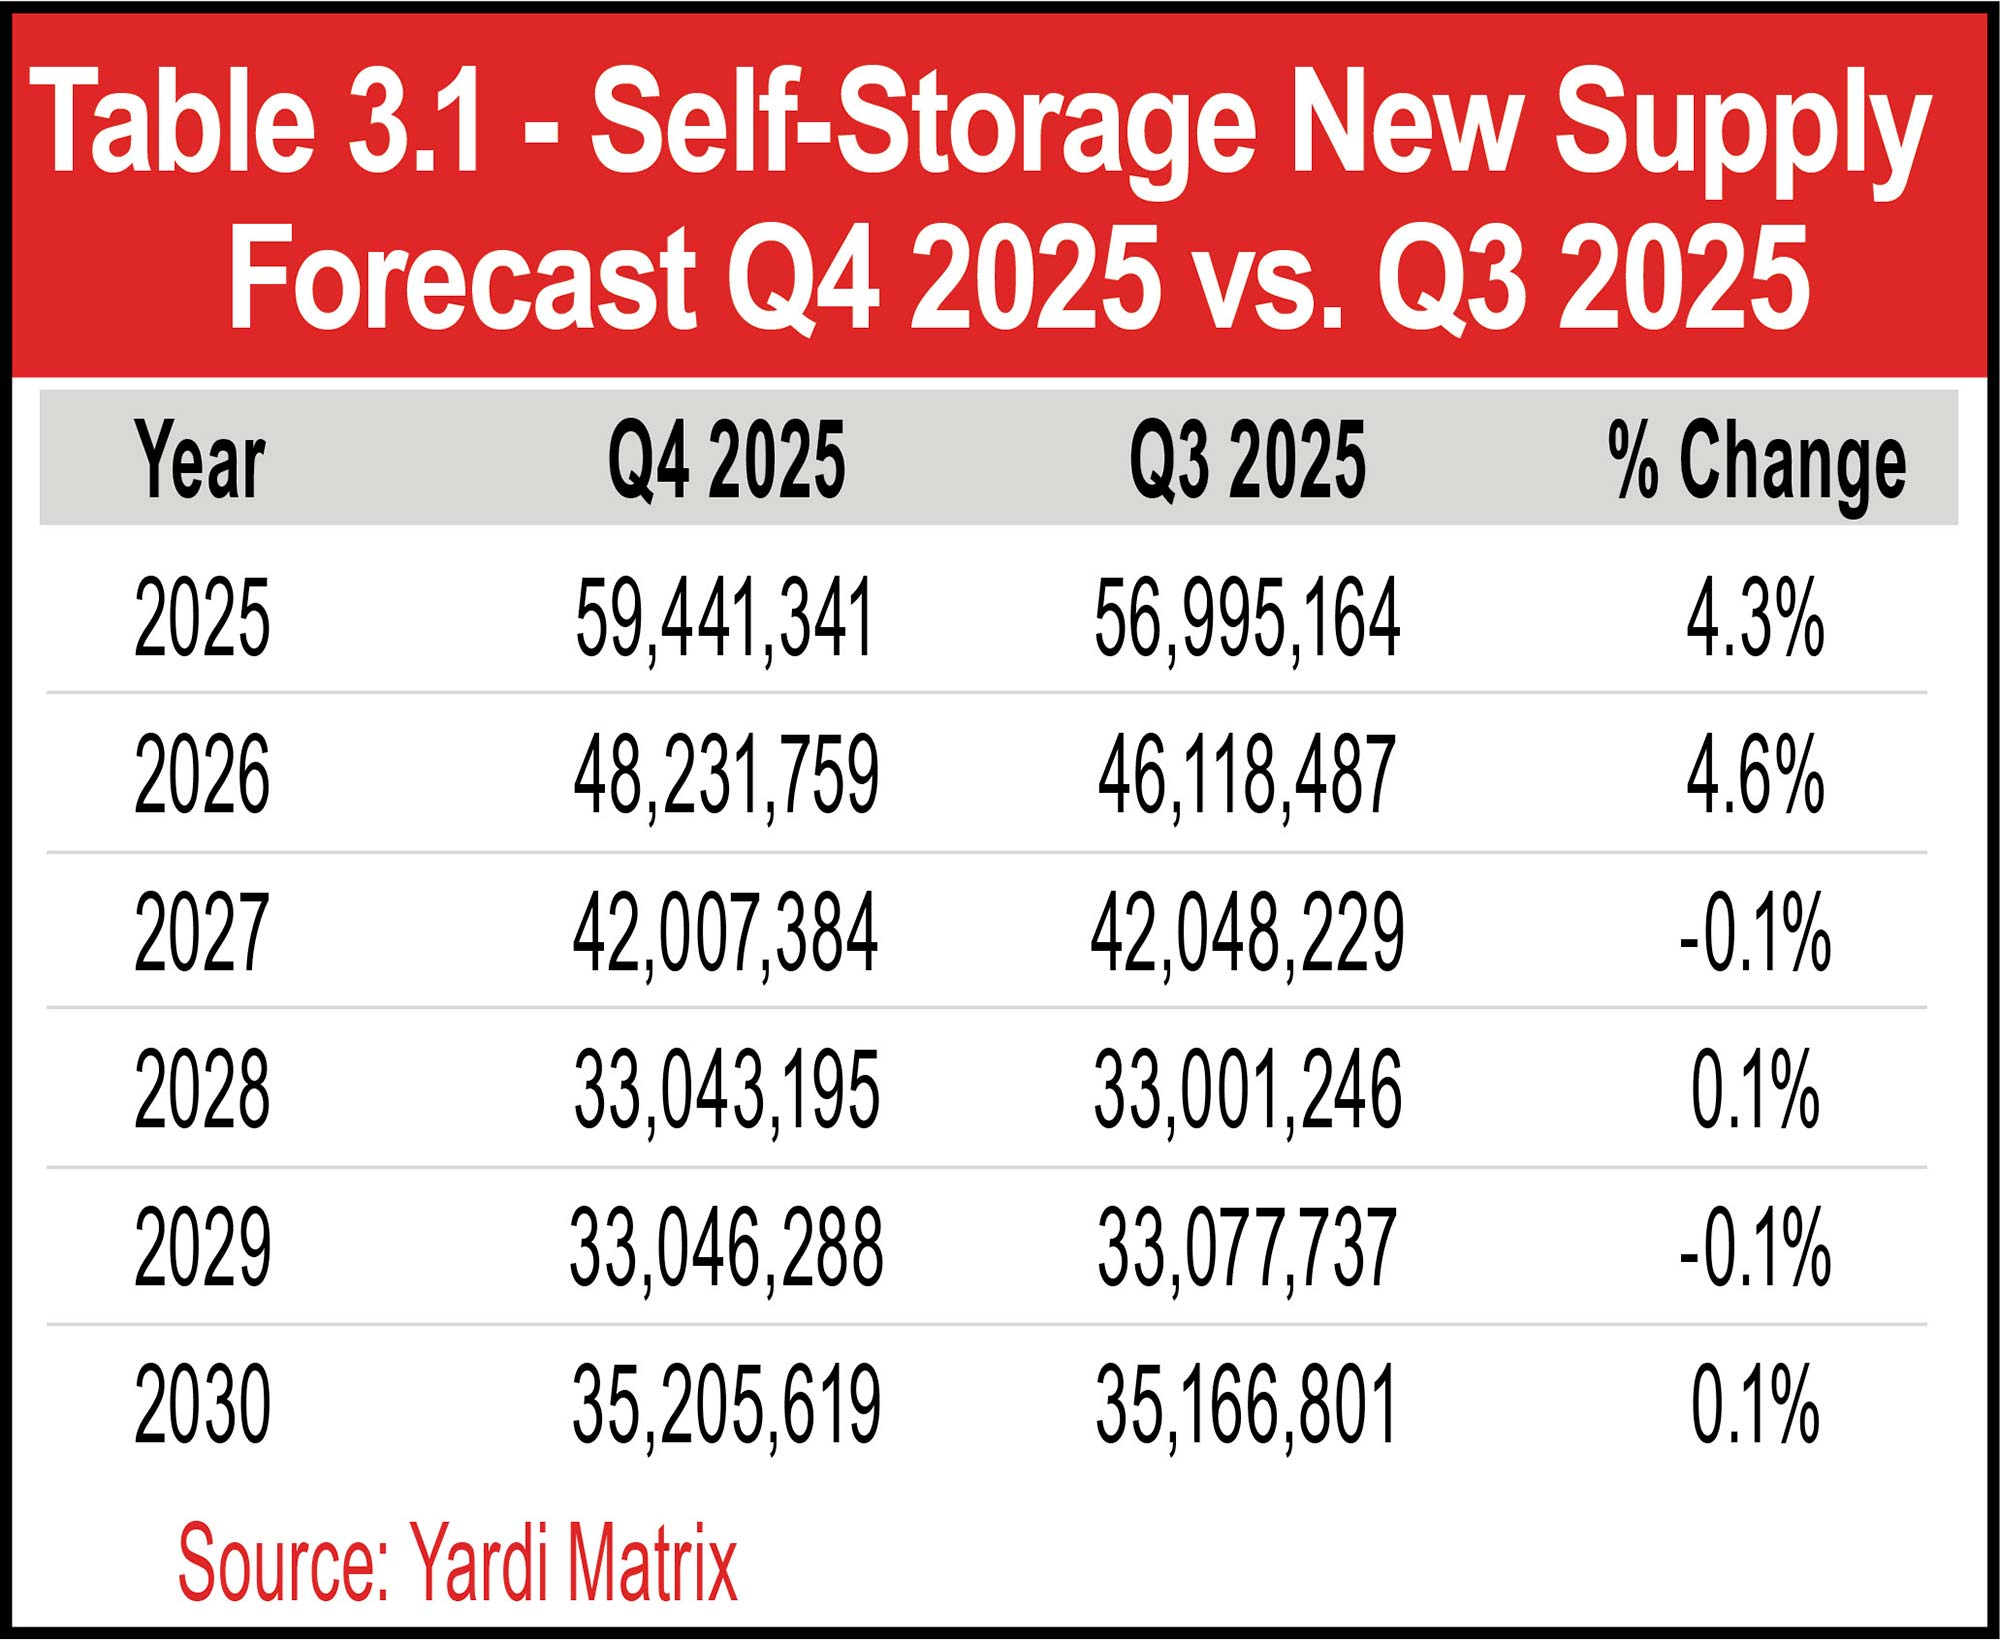
The overall shape of the forecast remains unchanged and continues to show a decline in new self-storage supply through 2027 and beyond. Construction starts have declined markedly from the 2023 peak, with 2025 year-to-date construction starts lagging behind 2024’s pace. This will continue to drive declines in the under-construction pipeline, which has to date declined 21 percent from the peak.
In September, national advertised rates tracked by Yardi Matrix increased on a year-over-year basis for the first time in three years. A return to sustained advertised rate growth would certainly help new development prospects. However, the relatively large amounts of new supply delivered in 2023 and 2024 will continue to limit rental rate growth over the near term. Should the combination of advertised rental rate growth and easing monetary policy drive a pickup in Q4 2025 construction starts, subsequent forecasts will be revised higher.
See Chart 3.1.
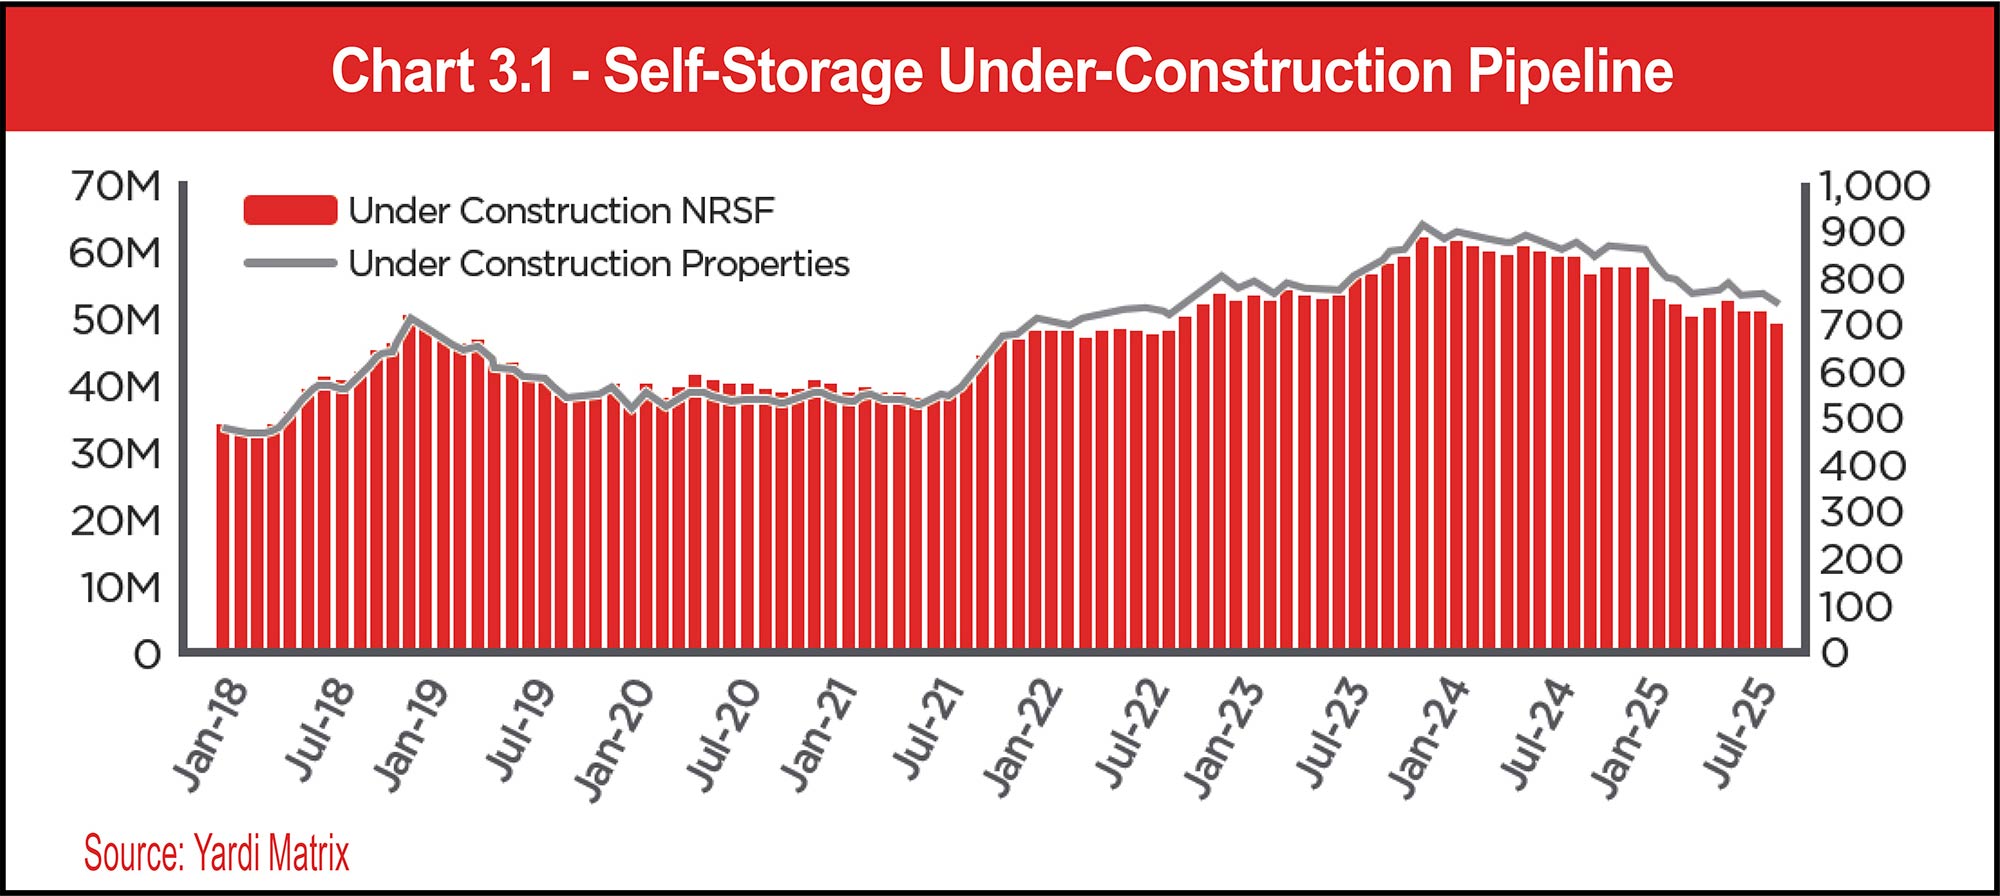
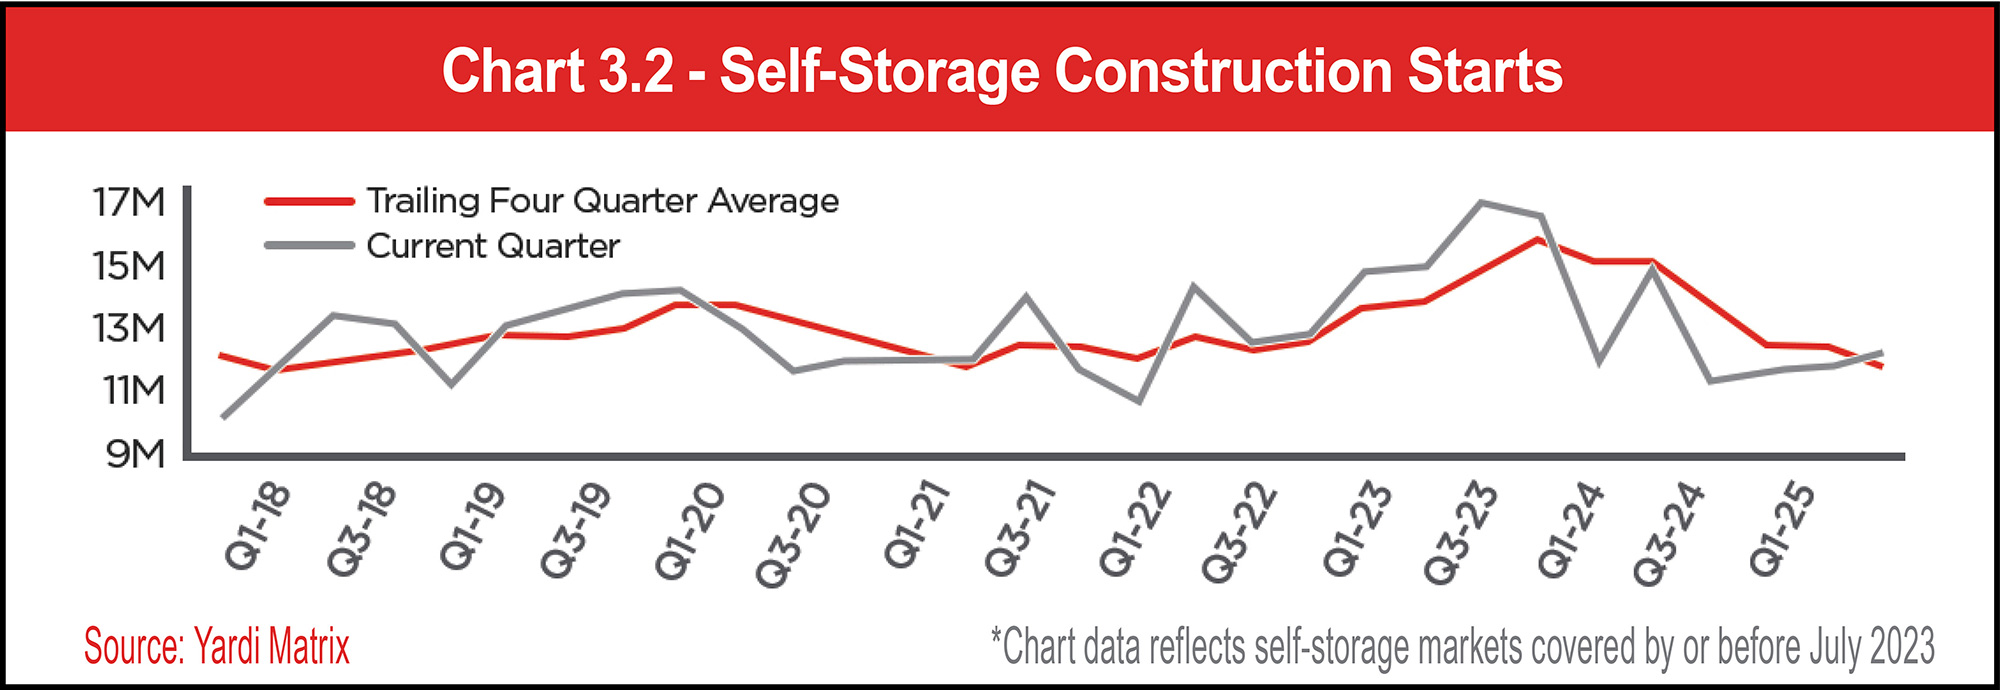
Through the end of September 2025, the Matrix research team had identified 31.54 million NRSF in new-construction starts, 7.8 percent below the level recorded over the same period in 2024. For all markets tracked by Matrix, 2024 construction starts totaled 52.21 million NRSF, declining 19.6 percent from 2023’s 64.96 million NRSF.
See Chart 3.2.
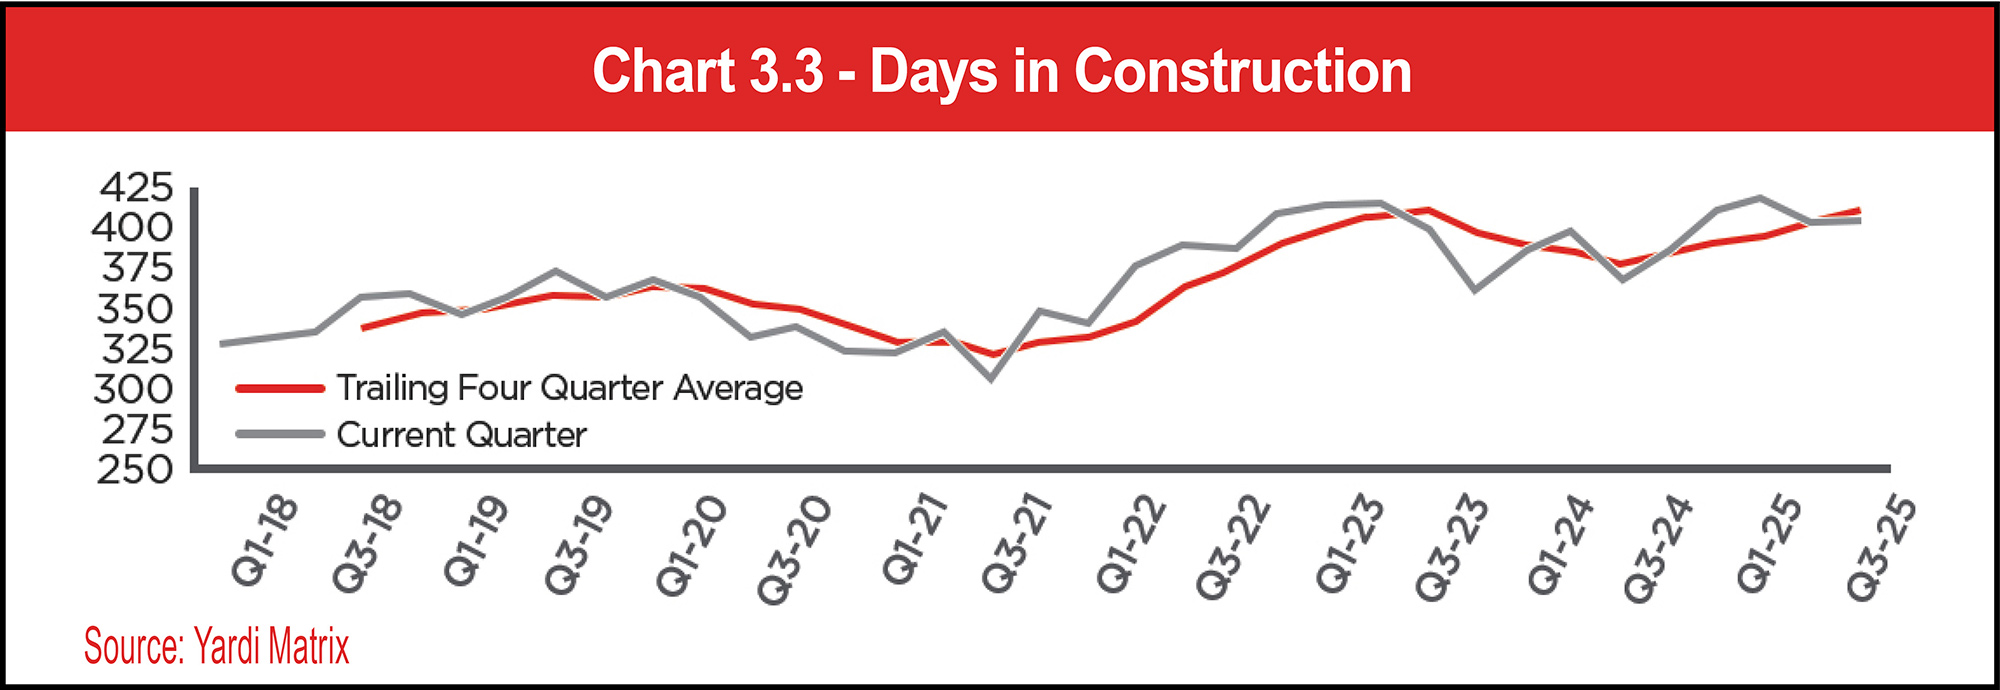
See Chart 3.3.
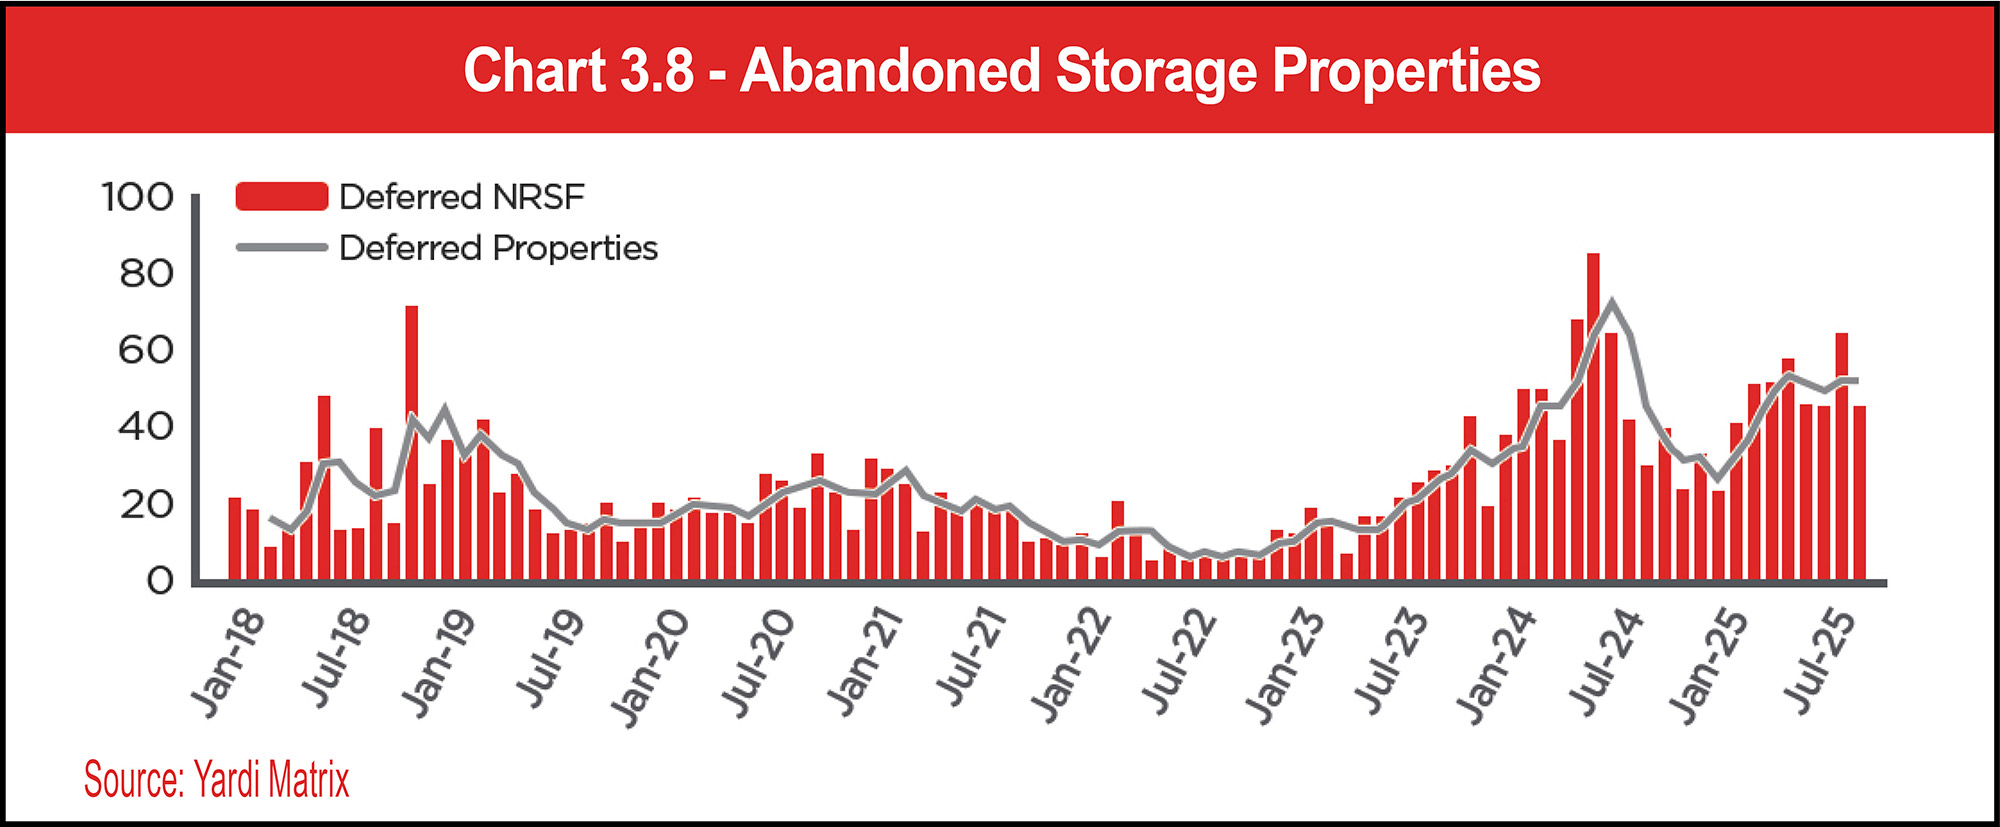
Weak operating results have translated into a noticeable decline in longer-term development interest. On a year-over-year basis, the planned pipeline has declined by 10 percent, while the prospective pipeline has declined by 18.8 percent and the deferred pipeline has grown by 33.3 percent. The monthly number of projects categorized as abandoned is currently averaging 52. In mid-2022, the average stood at seven projects per month.
Since the great financial crisis, the self-storage industry has experienced significant growth, and it is now a mature asset class. Absent new demand drivers, national self-storage supply growth in excess of 2.0 percent of stock likely exceeds long-term demand growth and leads to localized flat or negative rate growth. The Q4 forecast update therefore continues to model a decline in longer-term new self-storage supply to roughly 1.5 percent of stock in the later years of the forecast.
On the other hand, if September’s positive advertised rental rate growth turns into a durable trend that combines with easier monetary policy to drive a rebound in construction starts, our thesis for longer-term self-storage new supply will need to be revisited.
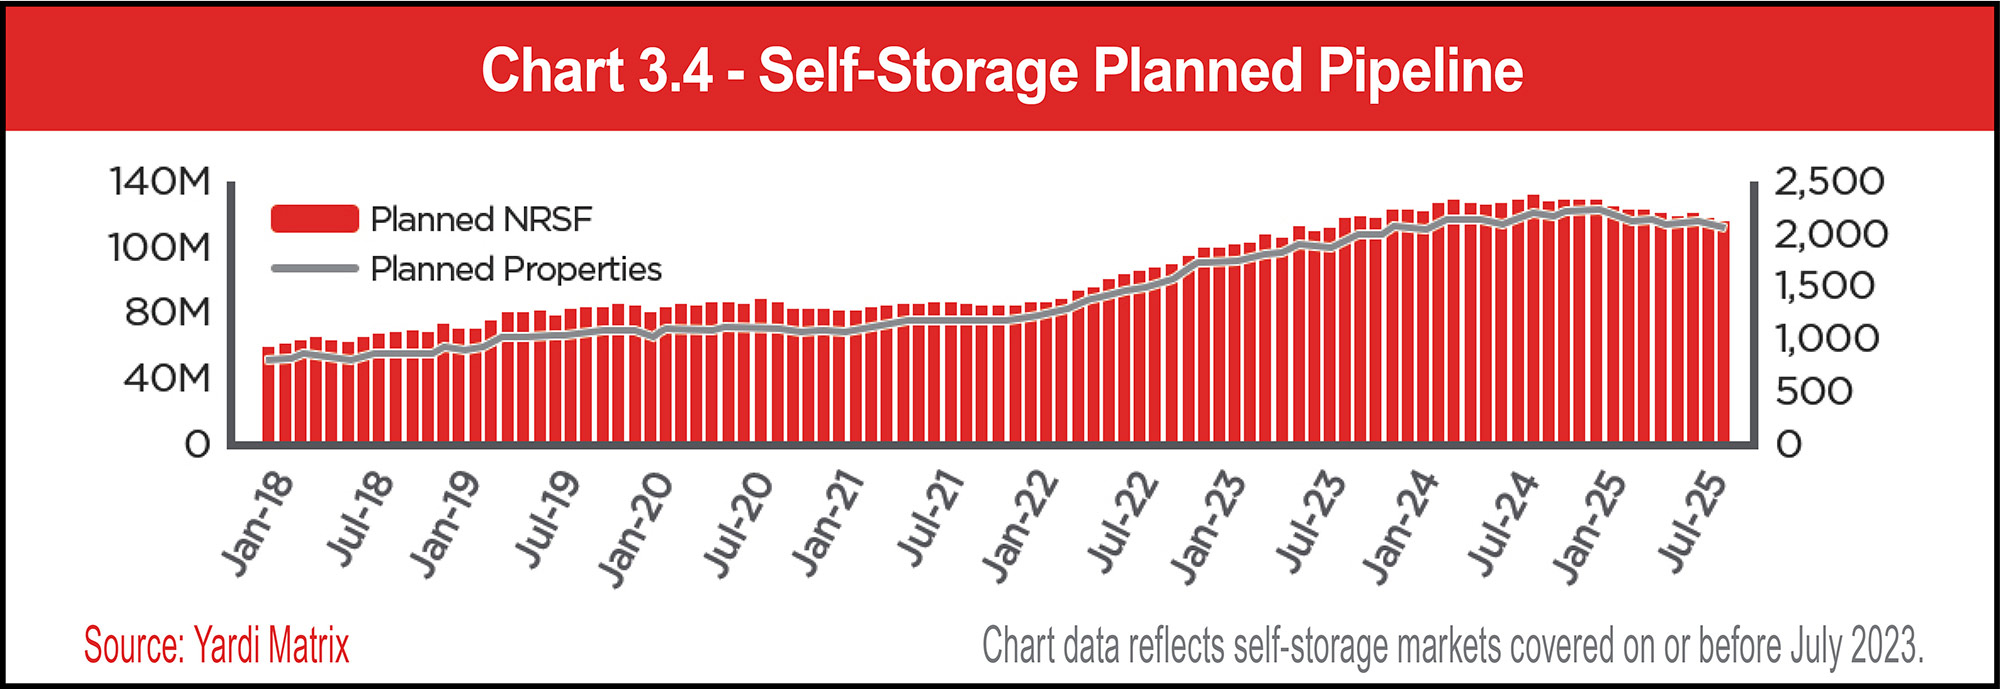
On a quarterly basis, the planned pipeline declined by 2.3 percent, while on a year-over-year basis it declined by 10.3 percent. The planned pipeline peaked in September 2024 at 131.65 million NRSF.
The current planned pipeline is approximately 2.4 times as large as the under-construction pipeline. Prior to 2024, the ratio held below 2.0. The planned pipeline has decreased at a slower rate than the under-construction pipeline over the past 18 months, as projects spend an increasing amount of time in planned status.
See Chart 3.4.
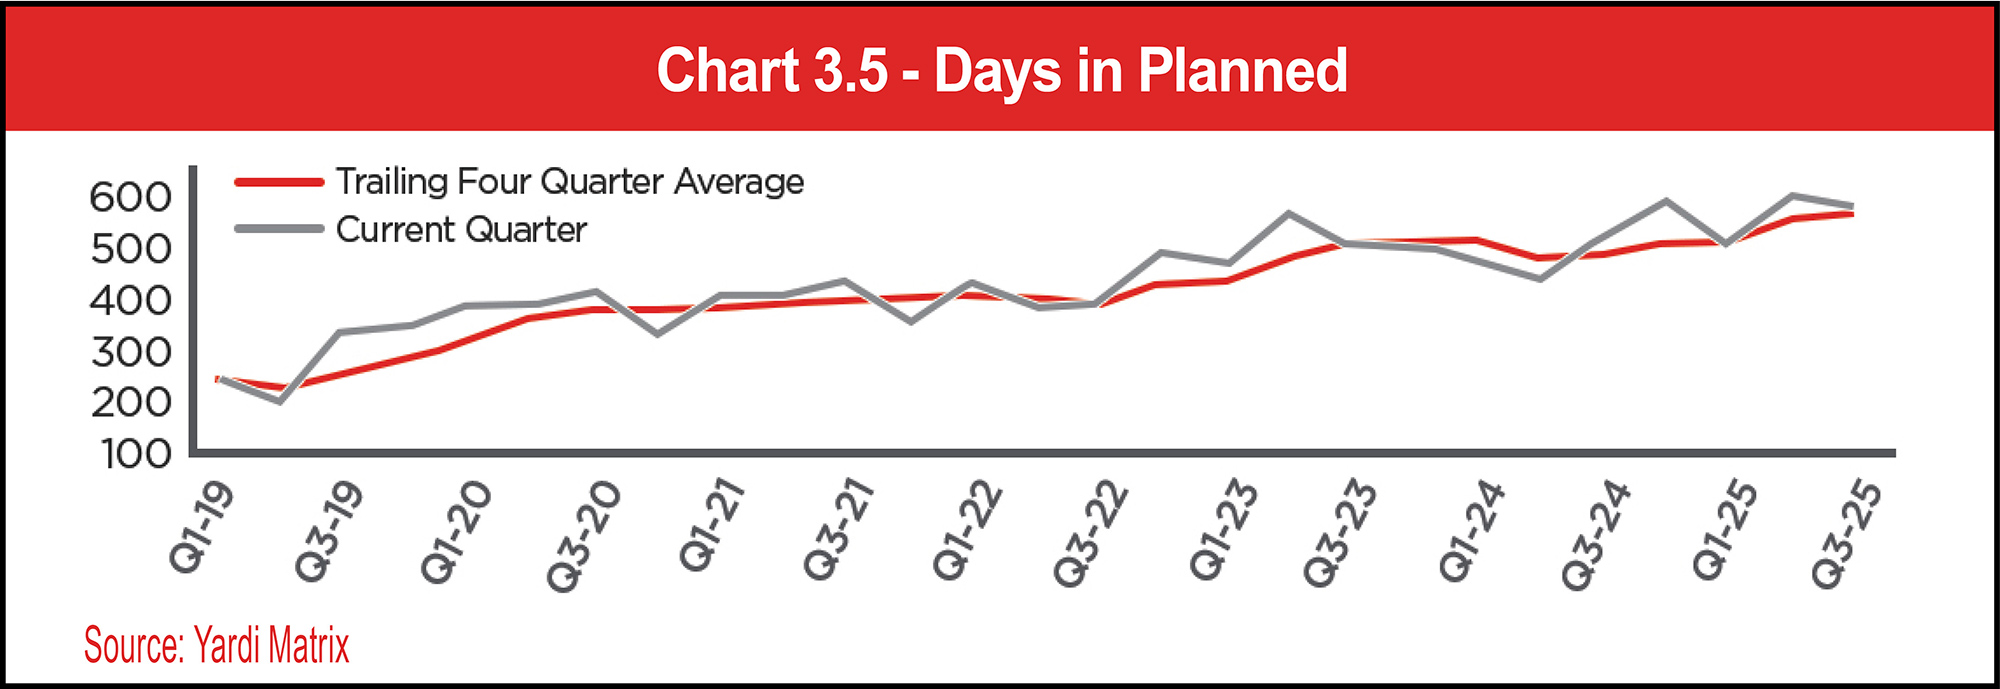
Days in planned, however, has been trending upwards over the past 18 months, with the trailing four-quarter average now sitting at 571 days (19 months). The increase in days planned observed in 2022 was most likely driven by labor and material scarcity as the development cycle ramped up. The current increase in days in planned is most likely driven by the weaker operating environment forcing projects to delay breaking ground.
See Chart 3.5.
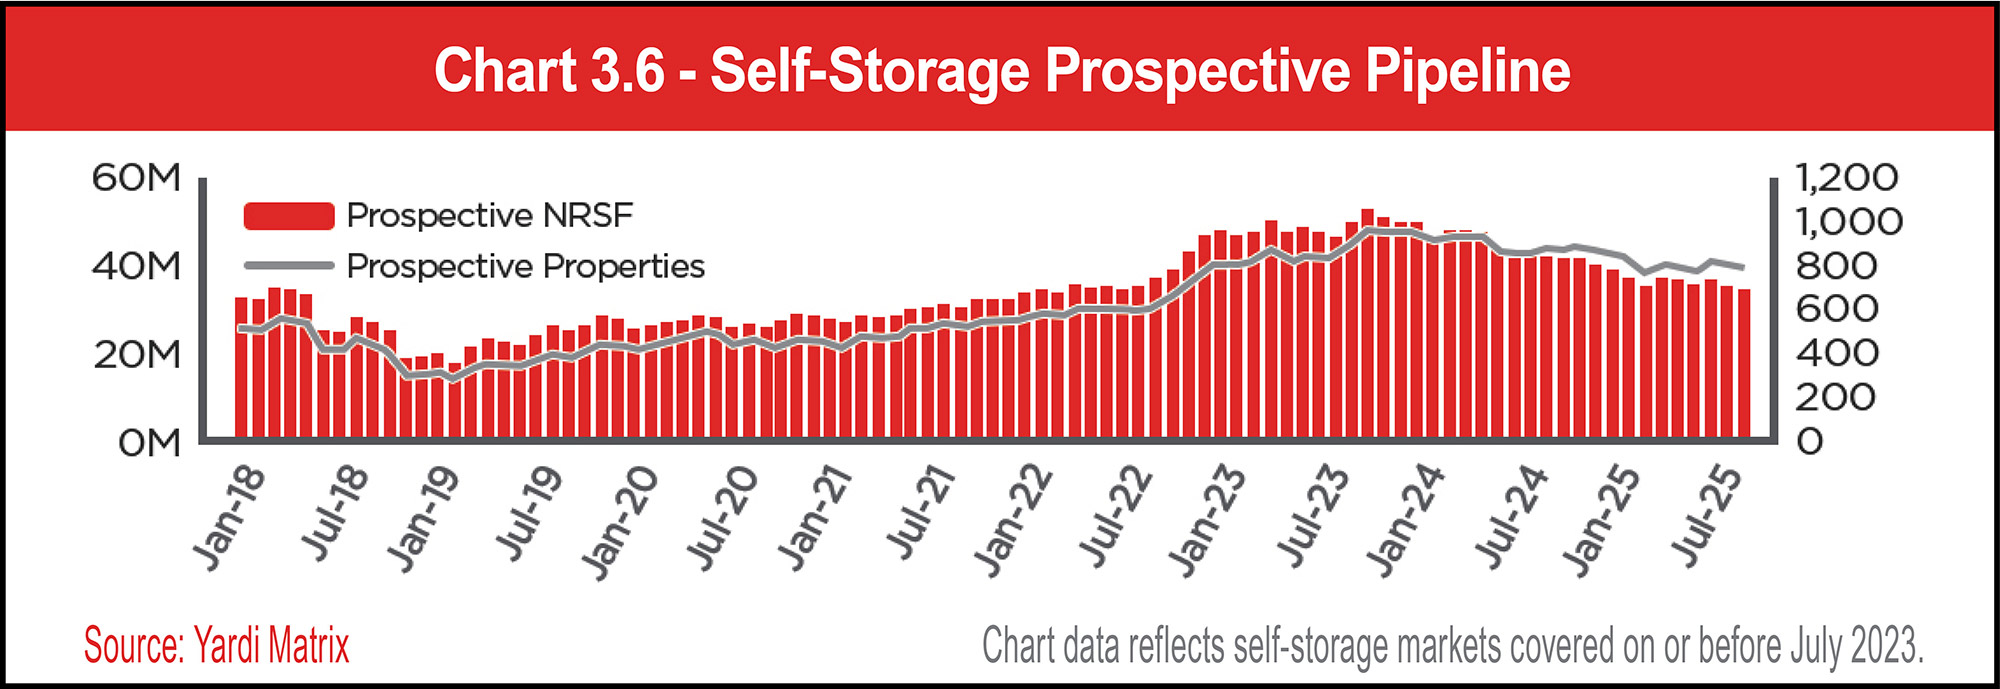
The prospective pipeline peaked in October 2023 at 52.72 million NRSF and has since declined by 35.6 percent. The continued contraction in the prospective pipeline indicates that longer-term self-storage development interest has not yet bottomed.
See Chart 3.6.
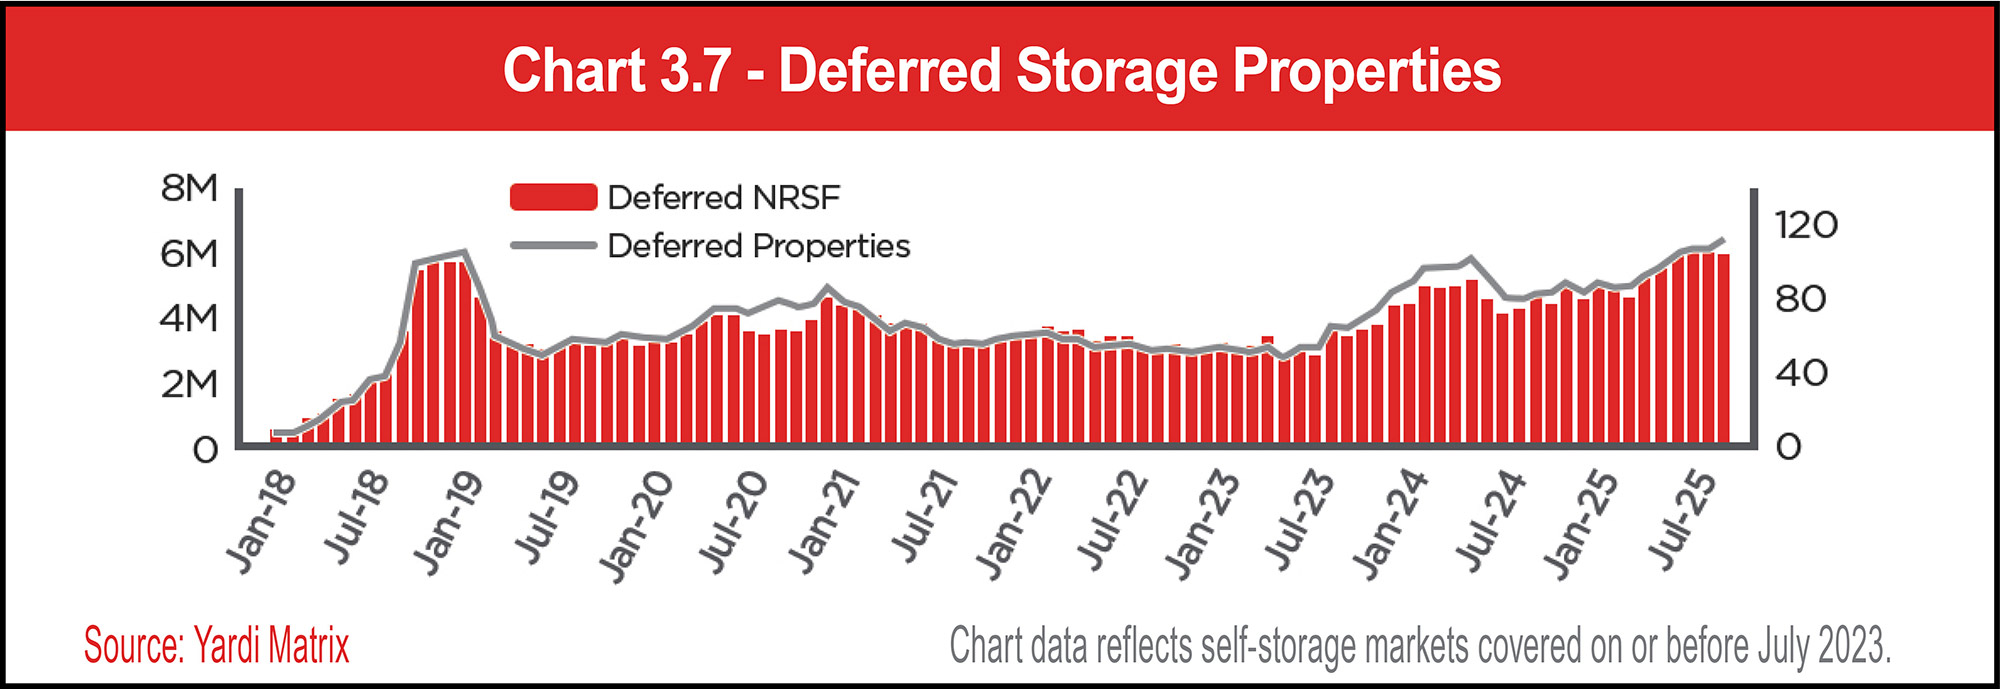
The deferred pipeline bottomed in July 2023 at 2.77 million NRSF and has since increased by 121 percent. The continued large size of the deferred pipeline is another indication that long-term self-storage development interest remains weak.
See Chart 3.7.
See Chart 3.8.
However, the shape of the forecast has not changed. Matrix development pipeline data continues to show an overall deceleration in both near-term and long-term development interest. This was expected in previous forecasts; therefore, the remaining years are unchanged.
New supply delivered in recent years has put downward pressure on rates and occupancy, which has suppressed new-development interest. The forecast assumes construction starts and the under-construction pipeline continue to decline, driving decreases in new supply for 2026 and 2027.
Longer-term development interest also remains weak. Both the planned and prospective pipelines are contracting, while the number of deferred and abandoned projects remains well above cycle lows. As a result, the Q4 forecast update continues to assume new supply for the later years will decline on an annual basis to roughly 1.5 percent of existing stock.
September’s positive year-over-year growth in advertised rental rates reduces forecast certainty. A return to sustained rate growth could potentially drive increased new development interest. Should this prove to be the case, subsequent forecast updates will be revised higher.
As always, Yardi Matrix is extremely focused on accurately maintaining our development pipeline data and identifying any changes in self-storage development activity.


he U.S. economy is vast and diversified, with a gross domestic product (GDP) of over $30.6 trillion. Governments, businesses, and investors closely watch the economy’s performance to guide their decisions, relying on indicators such as the cost of capital, building costs, supply chain conditions, and the state of the labor market. Consumers are also influenced in their financial decisions by factors such as housing costs, inflation, and interest rates.
Voters named the economy as their top issue in the 2024 presidential election, setting high expectations for the new administration. President Trump was elected on a platform that included a host of measures designed to improve affordability and promote economic growth. Taking office in January 2025, the Trump administration inherited a high-performing economy featuring resilient consumer demand, strong corporate profitability, and a solid labor market.
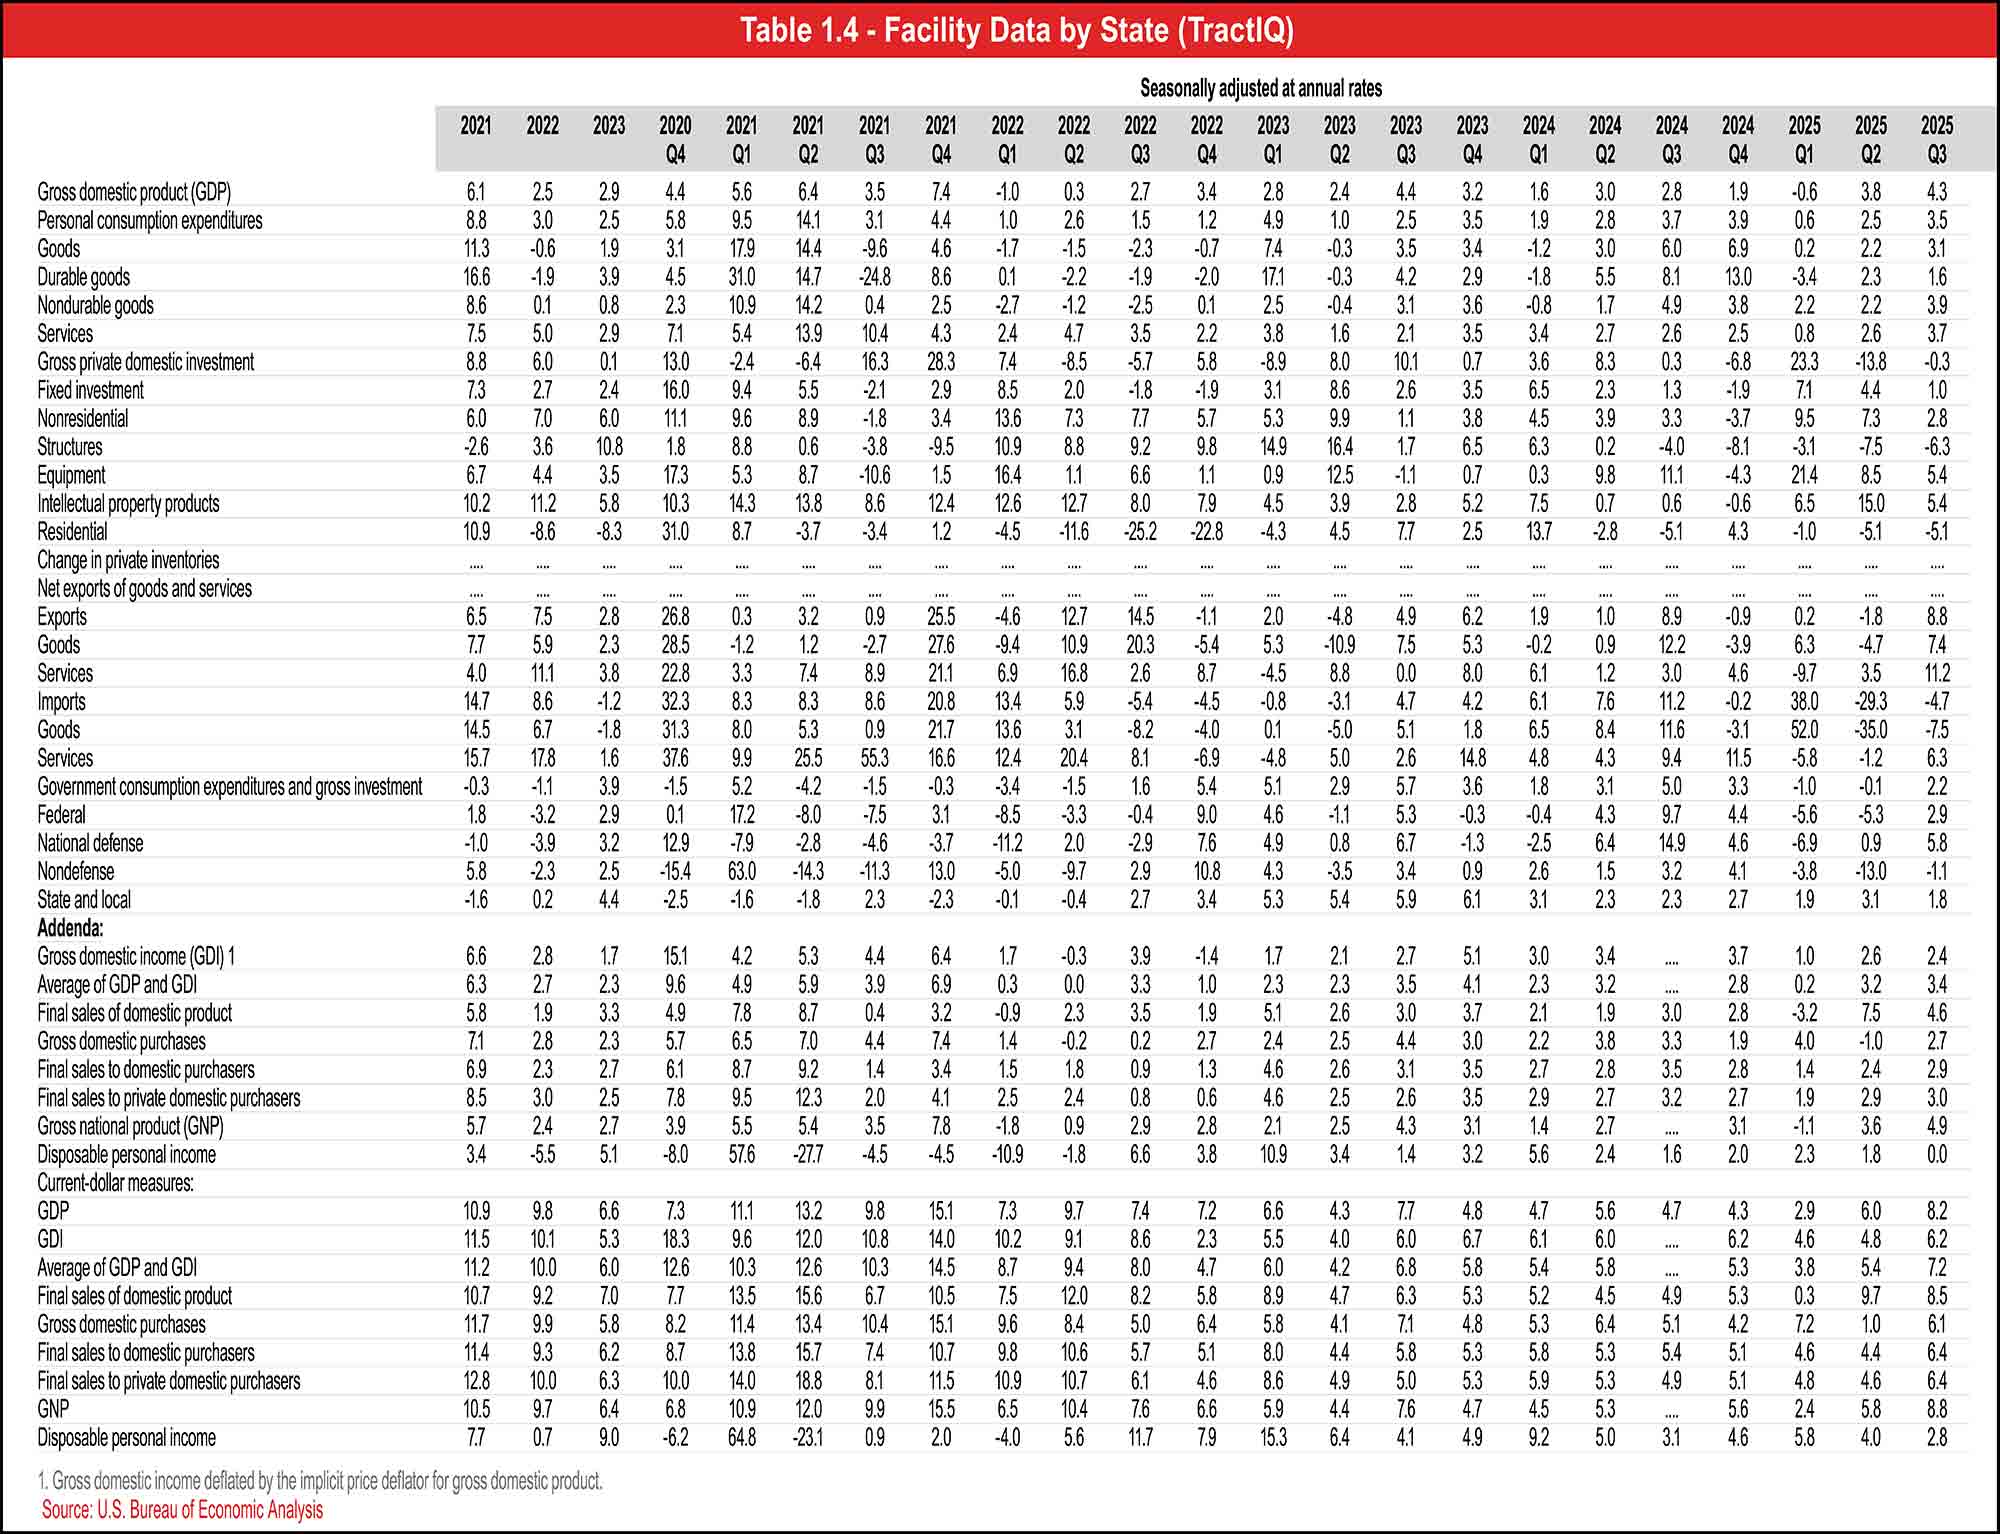
After contracting in the first quarter, the economy showed remarkable resilience in 2025. GDP grew at an annualized rate of 3.8 percent in the second quarter and 4.3 percent in the third quarter, the latter marking the fastest pace in two years. This robust expansion, propelled by a jump in consumer spending and a surge of investment related to artificial intelligence (AI), came despite headwinds including a slowing labor market, persistent inflation, and trade policy turbulence.
Those headwinds have contributed to negative public perceptions of the economy, which have persisted despite strong growth. According to a December 2025 Gallup poll, 47 percent of adults describe current economic conditions as “poor,” the highest reading since September 2024. More than two-thirds (68 percent) say that economic conditions are getting worse, compared to 29 percent who say they’re getting better.
Inflation, boosted by tariff-related cost increases, remained a continued point of stress in 2025. While inflation is dramatically down from its peak of more than 9 percent in 2022, slowing wage gains and a softening job market are placing pressure on the American consumer. The core personal consumption expenditures (PCE), which excludes food and energy prices, showed an annual rate of 2.8 percent, above the Federal Reserve’s 2 percent long-term target.
The federal government experienced its longest shutdown in history, lasting 43 days from October 1 to November 12, as Congress failed to pass appropriations bills for the 2026 fiscal year. The impasse led to an estimated 1.4 million federal employees being furloughed or working without pay, disrupting government services. It also halted the collection of economic data by federal agencies, delaying the release of various reports and likely distorting the results. This has undermined confidence in key indicators such as GDP growth and inflation.
The economy started the year on shaky footing, with real GDP contracting by an annualized rate of 0.6 percent in the first quarter of 2025. This decline was driven by companies ramping up imports in anticipation of new tariffs; imports are subtracted from the calculation of GDP. Growth rebounded strongly in the following two quarters. Third-quarter growth of 4.3 percent far exceeded analyst forecasts of 3.2 percent.
See Table 4.1.
U.S. equities rebounded strongly from tariff-related volatility early in the year. Stock markets reached record highs during the fourth quarter, with the benchmark S&P Index registering a year-to-date gain of around 16 percent as of Dec. 12, 2025. Earnings growth for the S&P 500 is estimated at 8.3 percent year over year for the fourth quarter, according to FactSet.
Tariff policy featured prominently in 2025’s economic news, with President Trump announcing sweeping import duties on April 2. These included a 10 percent baseline tariff on nearly all countries, with additional “reciprocal” tariffs on roughly 90 countries ranging as high as 50 percent. The most aggressive tariffs were largely withdrawn after the news triggered severe volatility in global markets, including the U.S. Treasury market.
With many trade disputes still unfolding, the U.S. approached the end of 2025 with an overall average effective tariff rate of 16.8 percent, the highest level since 1935, according to the Yale Budget Lab. The Lab estimates that if the 2025 tariffs remain in place, they would raise more than $2.7 trillion in revenue over 10 years, although that sum would be partially offset by declines in tax revenue stemming from lower economic growth. Tariff disputes notably affected trade with China, the European Union, Canada, and Mexico during the year.
One of the stated goals of the tariff package was to revitalize U.S. manufacturing, but roughly 67,000 fewer Americans were employed in manufacturing in November than in April, per data from the Bureau of Labor Statistics. Total manufacturing construction spending also declined over the course of the year. Despite this, manufacturers are making ambitious capital spending commitments. One analysis found that companies announced a total of $1.2 trillion in planned investments in U.S. production during the first eight months of 2025.
In July, the legislation known as the “One Big Beautiful Bill” was signed into law, with provisions that included permanently extending many of the tax cuts and reforms from the Tax Cuts and Jobs Act of 2017. One of the largest tax cuts in American history, the bill is projected to reduce federal tax revenue by $5 trillion from 2025 through 2034, according to the Tax Foundation.
The impact of severe weather was relatively muted in 2025, as no hurricanes made landfall in the continental U.S. for the first time since 2015. However, Southern California experienced a series of wildfires in January that killed at least 30 people and caused tens of billions of dollars in property damage.
The construction industry is a major contributor to the overall economy, accounting for 4.5 percent of GDP and employing over 8 million people. Construction spending during August 2025 was estimated at a seasonally adjusted annual rate of $2.17 trillion. During the first eight months of the year, construction spending totaled $1.43 trillion, down 1.8 percent from the same period in 2024, according to the Census Bureau.
Business investment has been strong this year, with real nonresidential investment surging by 9.5 percent in the first quarter as companies scrambled to prepare for tariff shocks. That figure stayed high at 7.3 percent in the second quarter, then fell to 2.8 percent in the third quarter. Investments in digital transformation and AI contributed to overall business investment, but investment in structures has declined consistently since the start of 2024.
Consumer spending was resilient throughout most of the year, although pressure on household budgets is making many consumers more price sensitive. Total credit and debit card spending per household was up 1.3 percent year over year in November 2025, according to Bank of America data. Consumer demand kept the auto industry healthy despite challenges, including tariff headwinds. New-vehicle sales were expected to total 16.3 million for 2025, rising 1.8 percent year over year, according to Kelley Blue Book estimates.
Despite steady spending, consumer confidence weakened for a fifth consecutive month in December, according to The Conference Board. Consumer spending in 2025 tended to shift away from pricey, discretionary activities, and consumers registered greater caution about their plans for buying big-ticket items for the following six months. Views on current business conditions turned mildly pessimistic for the first time since September 2024.
See Table 4.2
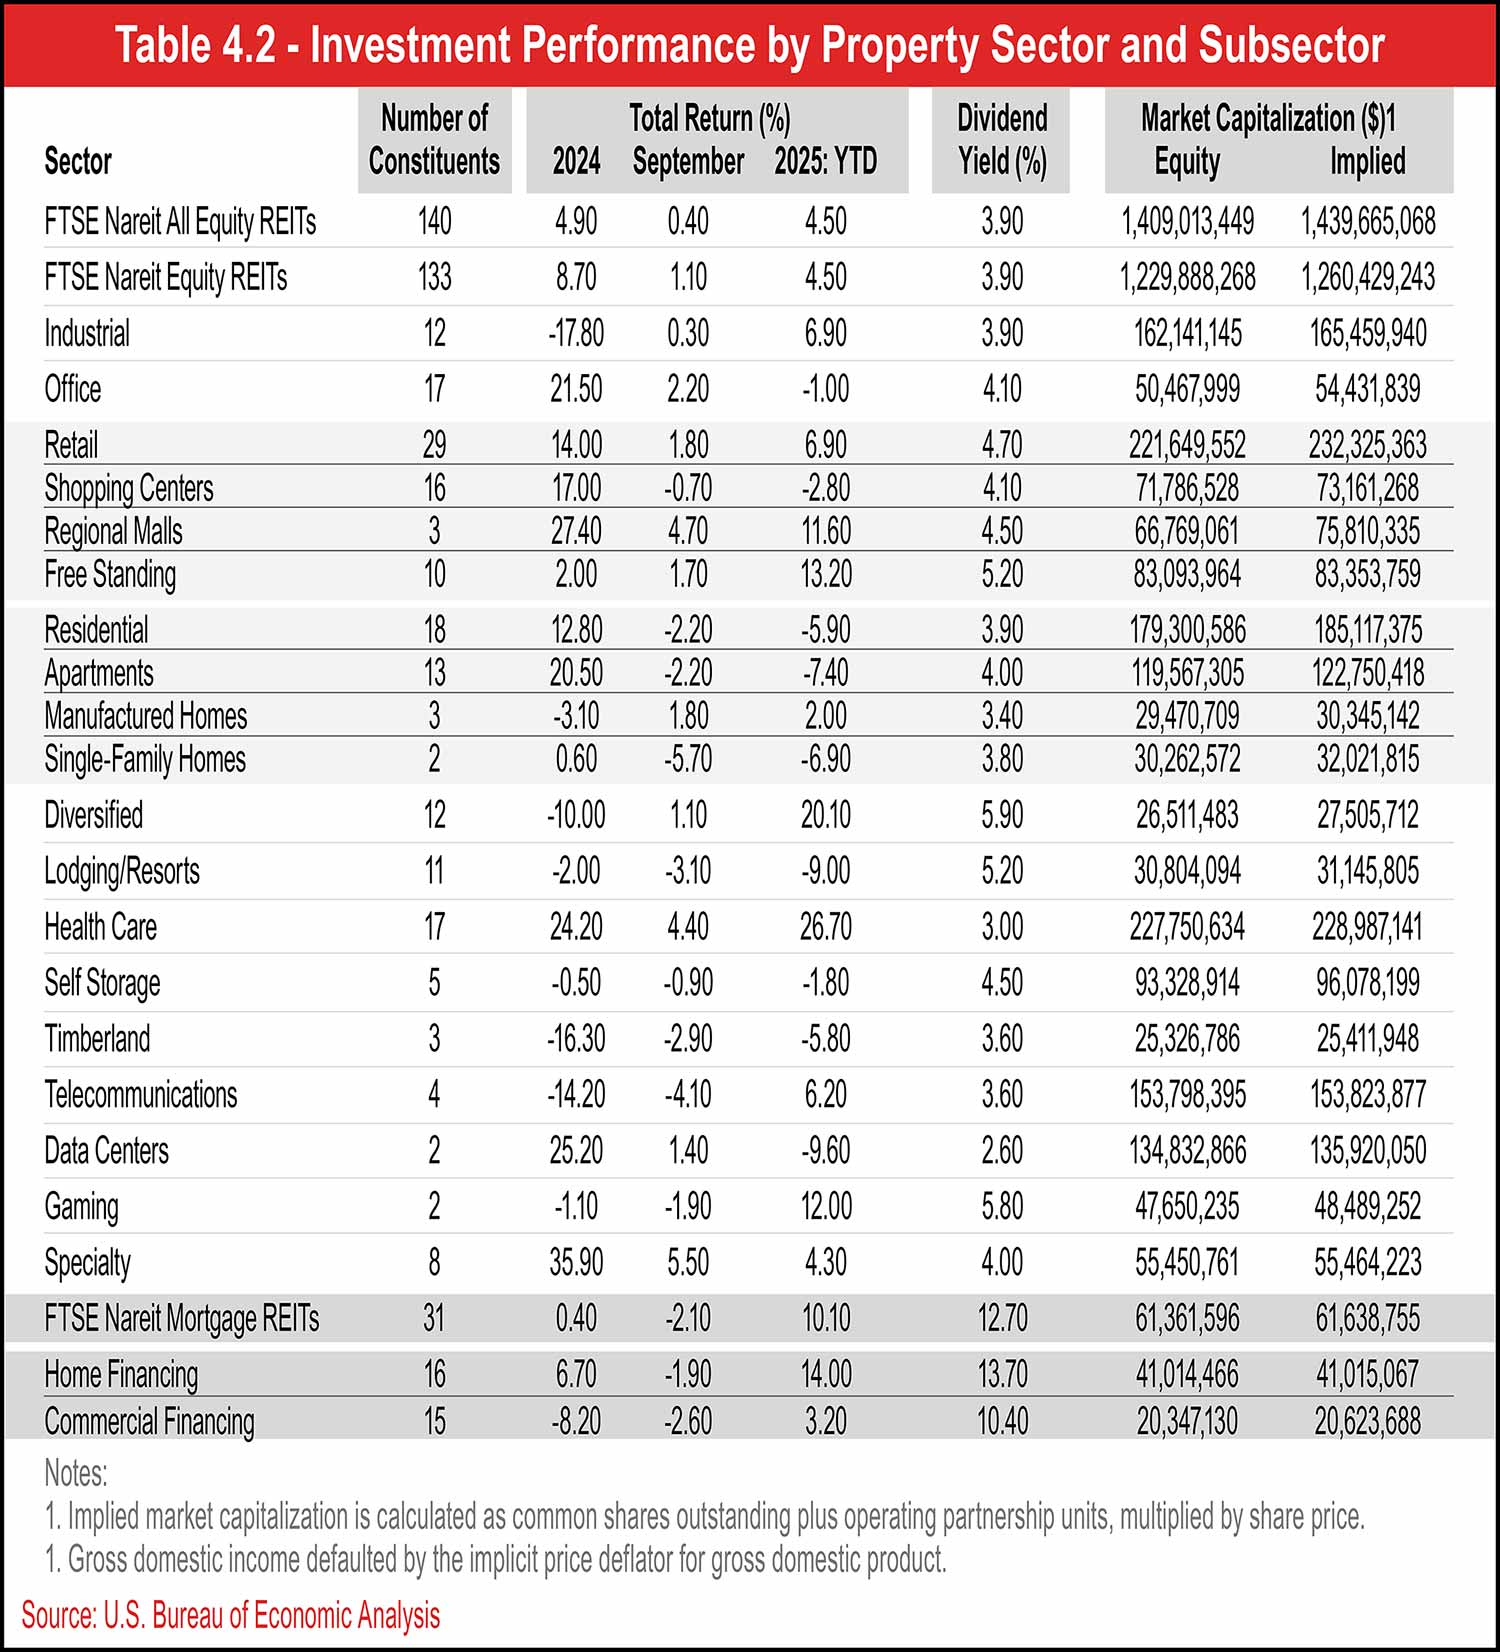
As of the third quarter, U.S. public equity REITs registered 5.2 percent growth in year-over-year net operating income (NOI) and 2.8 growth in same-storage NOI. More than 60 percent of REITs saw positive growth in year-over-year NOI, while more than 50 percent had gains in same-store NOI. Nareit also pointed out that REITs have maintained well-structured balance sheets with low leverage.
Self-storage REIT performance was weaker, with the ongoing downtown in the U.S. housing market weighing on revenue. Nareit reported that NOI for self-storage REITs rose 3.9 percent year over year in the third quarter, while same-store NOI declined 1.4 percent. Year-to-date returns for self-storage REITs were down 8.1 percent as of Dec. 1, 2025.
Self-storage demand suffered in 2025 as a result of the largely “frozen” housing market. People’s need for short-term storage when they move is a key driver of self-storage demand, but the U.S. home turnover rate has hovered near 30-year lows for two years as a result of higher mortgage rates, reducing this demand.
Another factor is that the percentage of consumers using self-storage as temporary storage while moving is declining. A UBS Evidence Lab survey found that people using self-storage for this purpose was 35 percent in the third quarter of 2025, below the long-term average of 37 percent and down from the peak of 41 percent in the third quarter of 2020.
The housing market will likely need to recover to reignite self-storage demand. Despite this, some tailwinds have appeared. Long-term apartment renters who can’t afford to buy a home are helping to support storage demand when they undergo life events such as marriage and relocation for work. The UBS survey also found that an increasing share of people are using self-storage as temporary storage while remodeling.
See Chart 4.1.
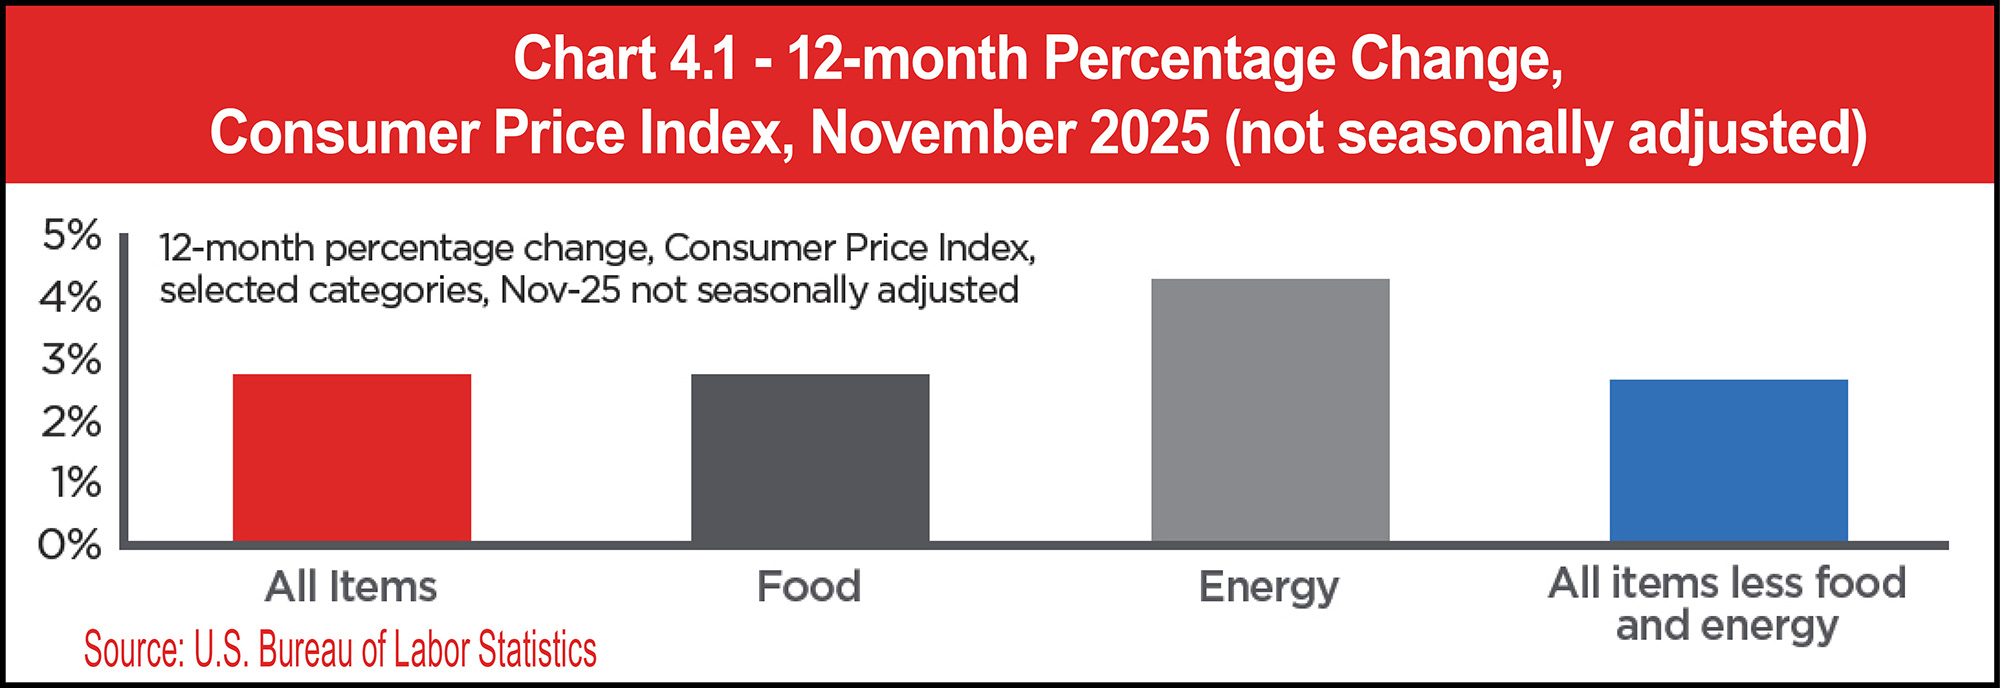
The consumer inflation rate peaked at 9.1 percent in 2022 and has since fallen substantially, though overall prices are still about 25 percent higher than they were in 2020. The ongoing and cumulative increase in prices has placed significant strain on household budgets, even if wage gains have generally kept up with inflation by some measures.
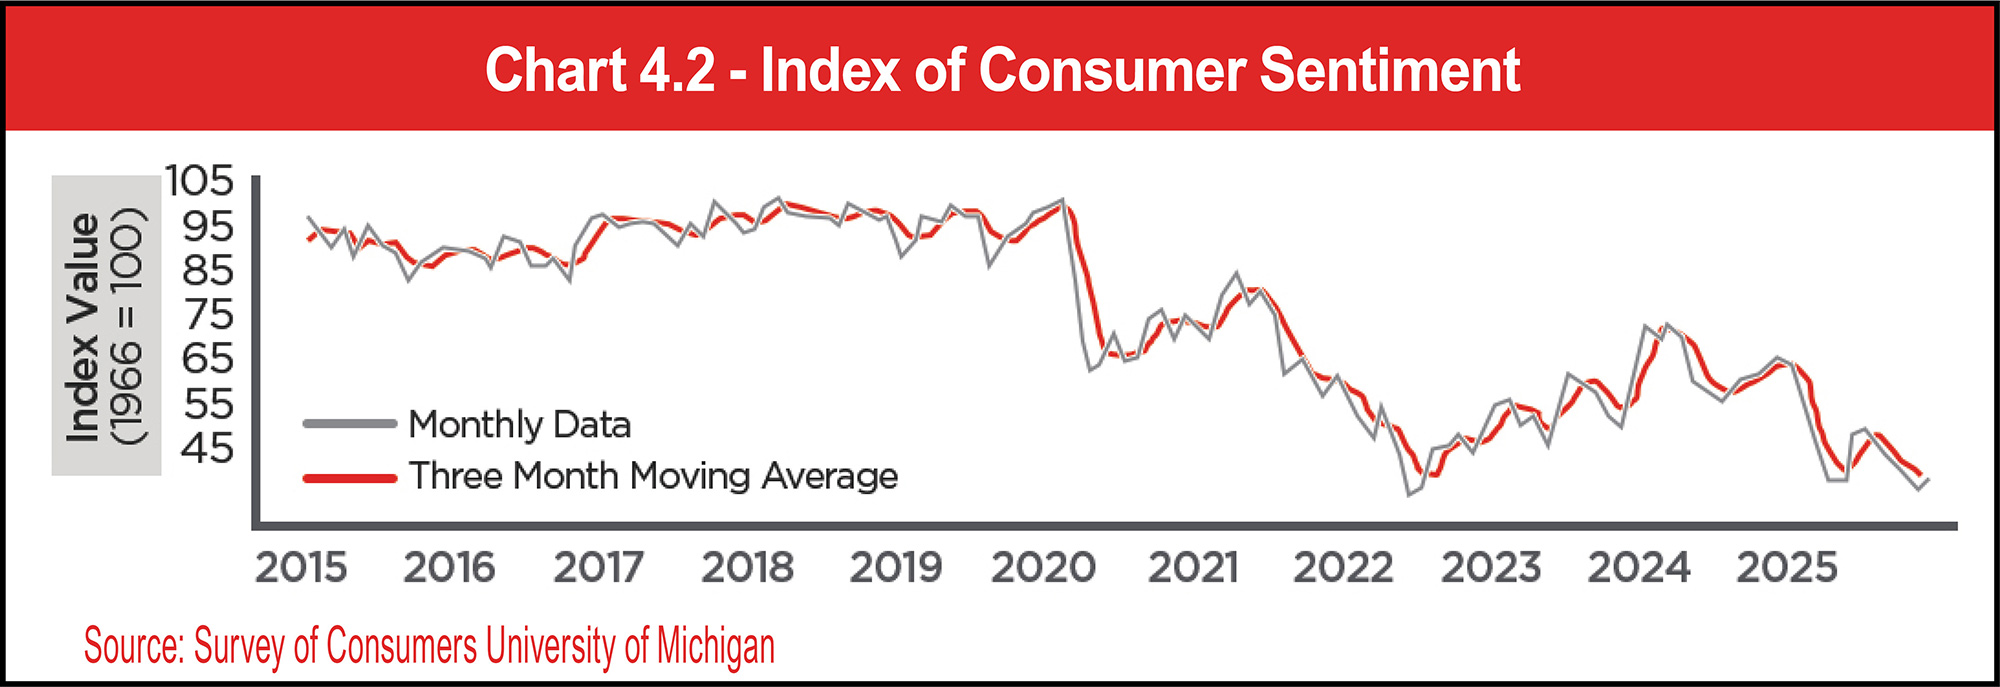
The University of Michigan consumer sentiment index for the U.S. inched up to 52.9 in December 2025, a reading that was down 28.5 percent year-over-year. Lower-income consumers experienced gains, but sentiment for higher-income consumers remained basically unchanged. Buying conditions for durable goods declined for five straight months. Expectations for personal finances and business conditions improved in December, as did labor market expectations, but 63 percent of consumers still expect a continued increase in unemployment next year.
See Chart 4.2.
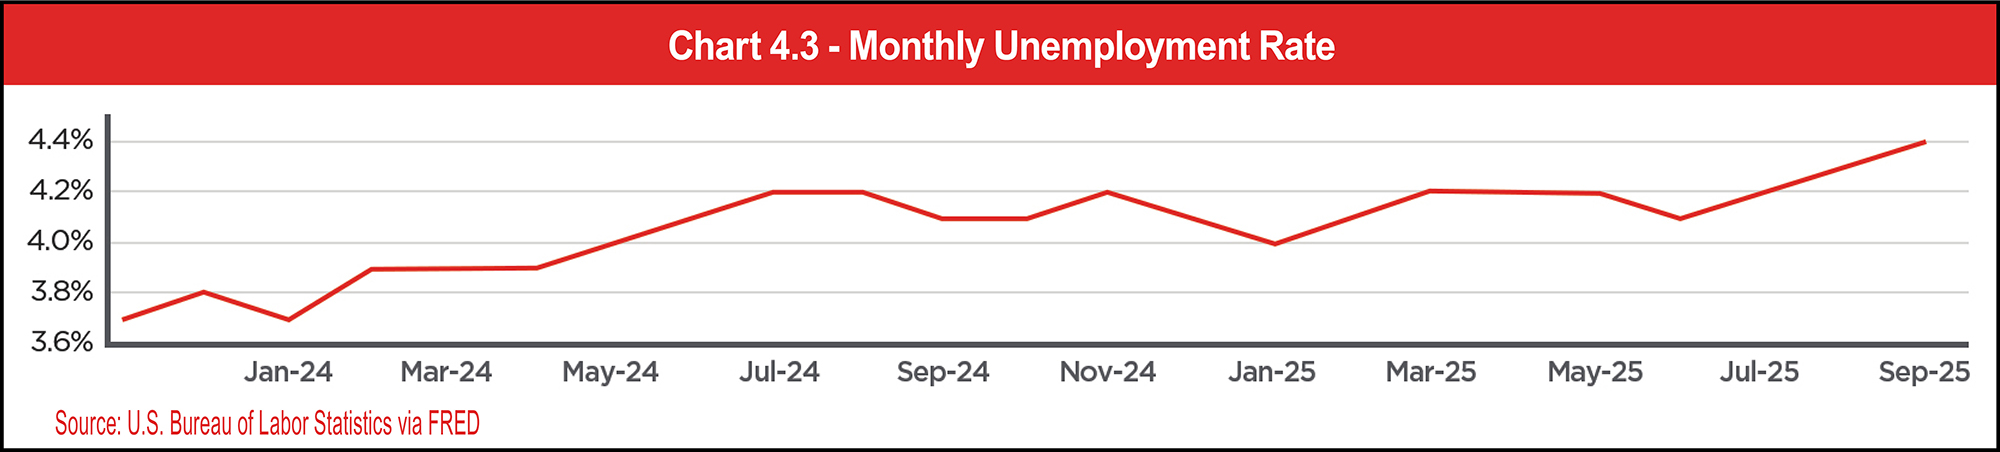
The economy added just under half a million jobs in January through November 2025, a steep drop from the 1.6 million jobs created in the same period of 2024. The total number of unemployed Americans rose more than 700,000 to 7.8 million, and the unemployment rate rose to 4.6 percent at the end of November 2025—the highest rate since 2021 but lower than the long-term average of 5.67 percent.
See Table 4.3 and Chart 4.3.

Immigration policy had a notable impact on the labor force this year. An analysis of Bureau of Labor Statistics data found a decline of 1.1 million foreign-born workers since January 2025, apparently due to immigration restrictions and a ramped-up deportation campaign.
See Chart 4.4.
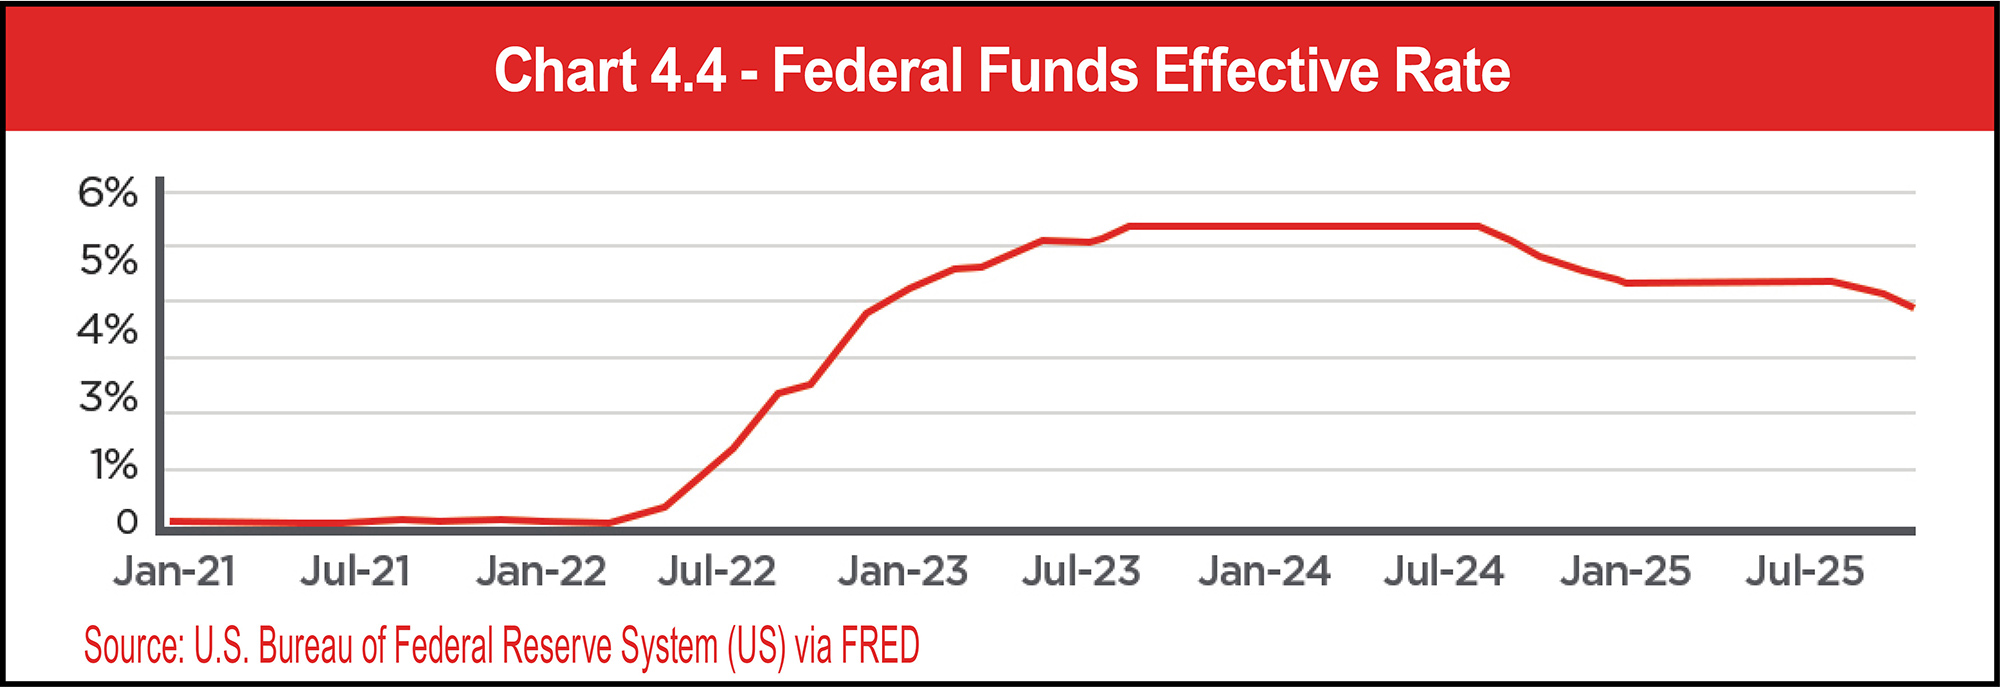
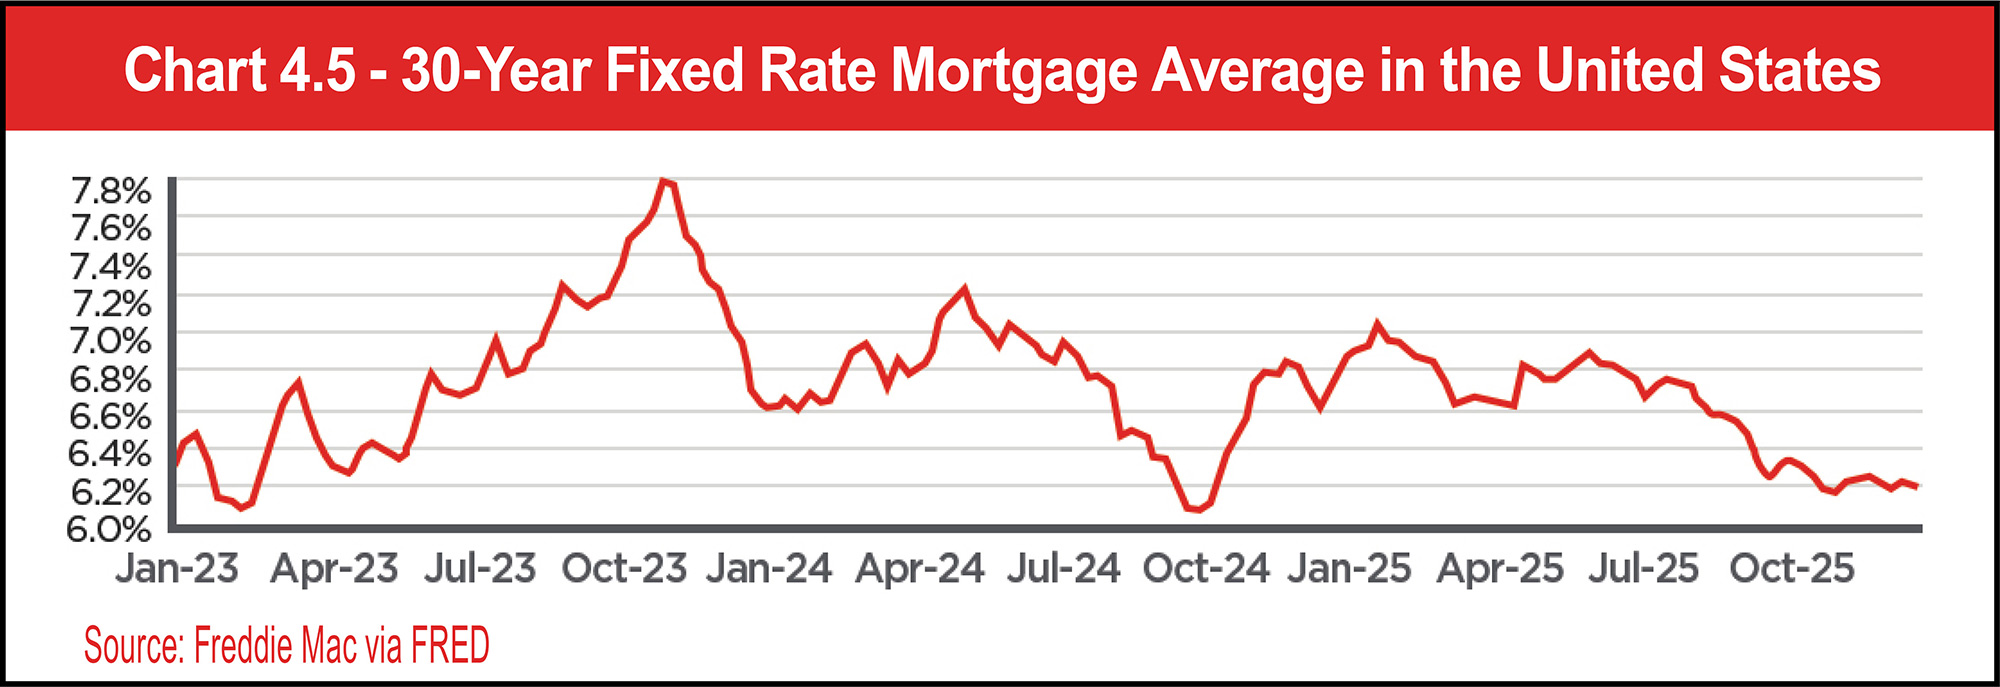
Following that period of volatility, mortgage rates have hovered in the 6 percent to 7 percent range for most of 2024 and 2025. Rates lingered in the 6.6 percent to 7 percent range in the first half of 2025 but declined steadily in the second half of the year as the Fed eased rates. The 30-year fixed rate mortgage average stands at 6.18 percent as of December 24.
See Chart 4.5.
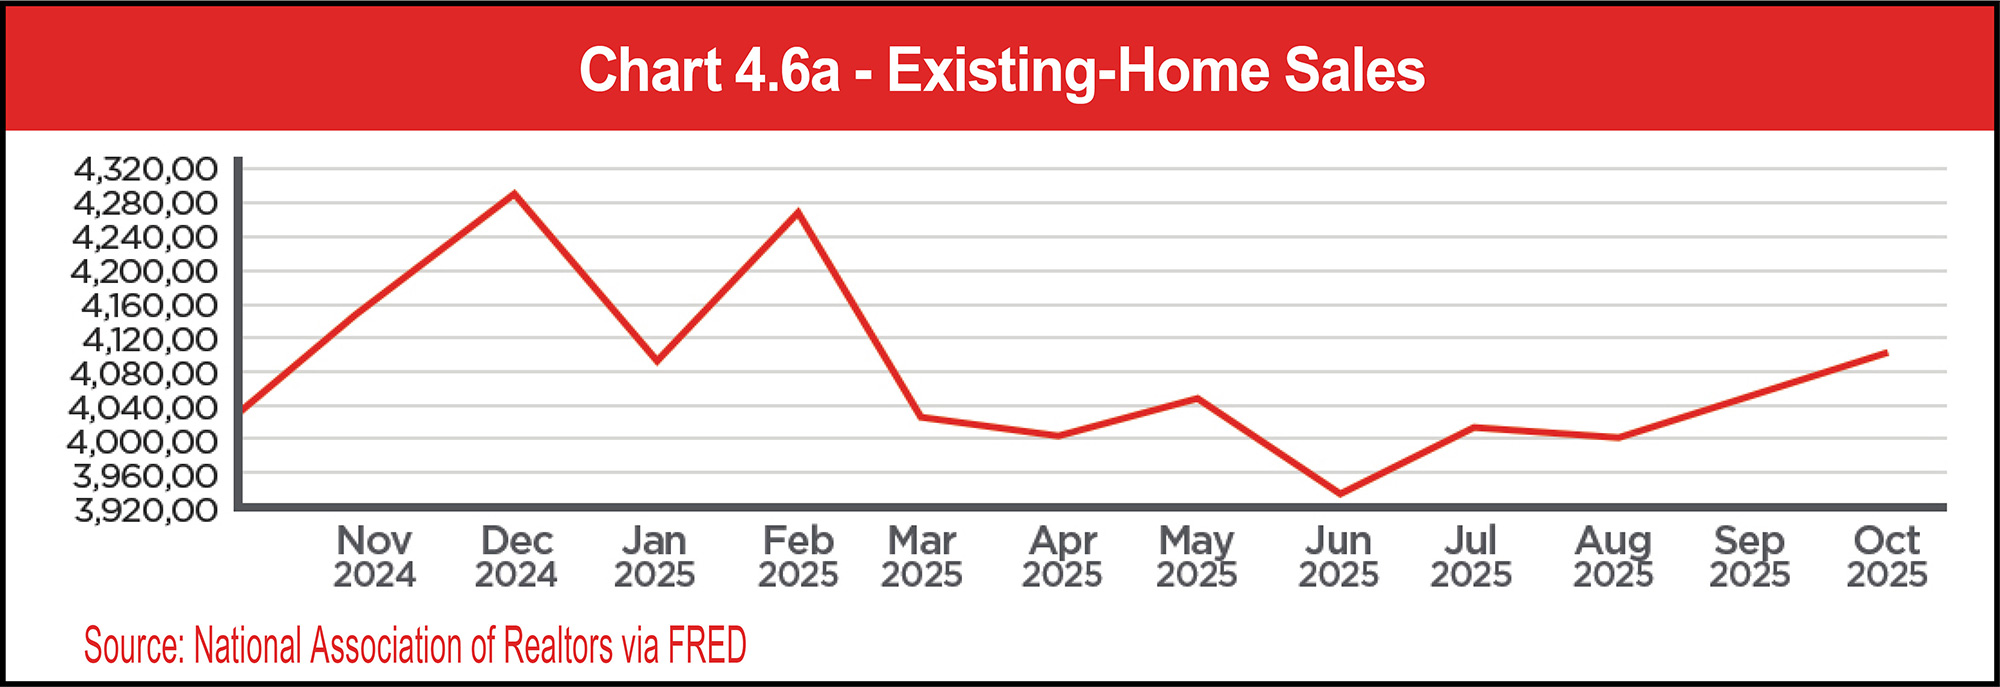
Existing-home sales reached a seasonally adjusted 4.13 million in November 2025, up 0.5 percent from the previous month but down 1.0 percent year over year, according to the National Association of REALTORS® (NAR). Sales increased for the third consecutive month due to lower mortgage rates in the autumn. NAR noted that wage growth was outpacing the rise in home prices, which improves housing affordability.
See Chart 4.6a.
The median price of existing homes for all housing types in November was $409,200, up 1.2 percent from October 2024, when the median price was $404,400, according to NAR. The Northeast, the Midwest, and the South all saw year-over-year price increases, with the largest jump seen in the Midwest at 5.8 percent. Prices eased in the West by 0.9 percent.
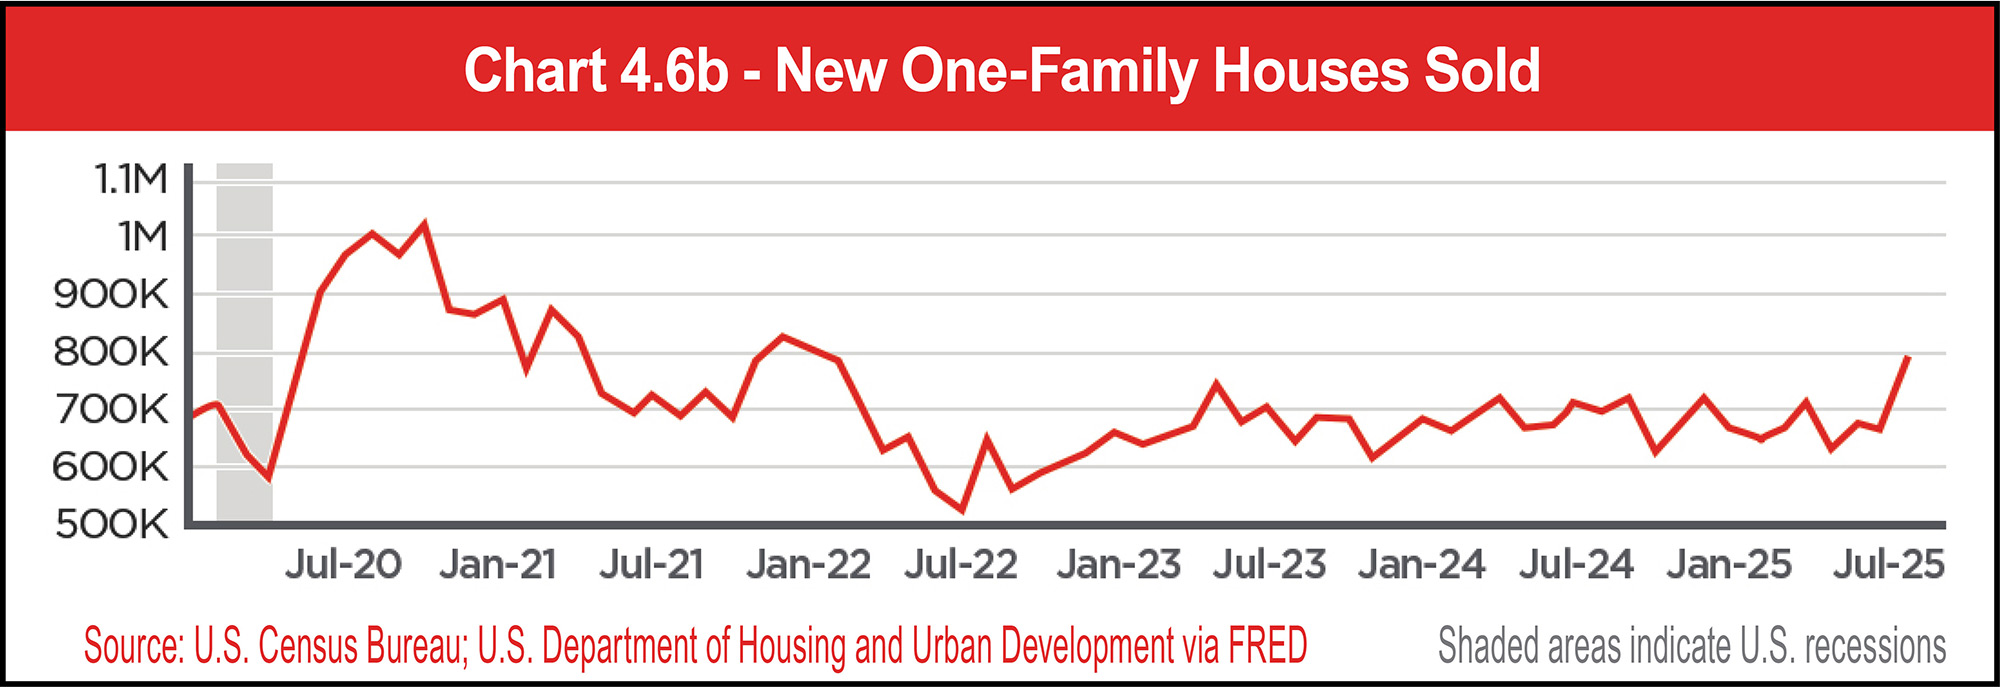
The seasonally adjusted annual rate of new one-family houses sold was 800,000 in August 2025, rising from 664,000 in July 2025 and 693,000 in August 2024. The median sale price for new houses sold in the U.S. was $413,500 in August 2025, up from $395,100 in July 2025 and $405,800 in August 2024, according to data from the Census Bureau and the U.S. Department of Housing and Urban Development.
See Chart 4.6b.
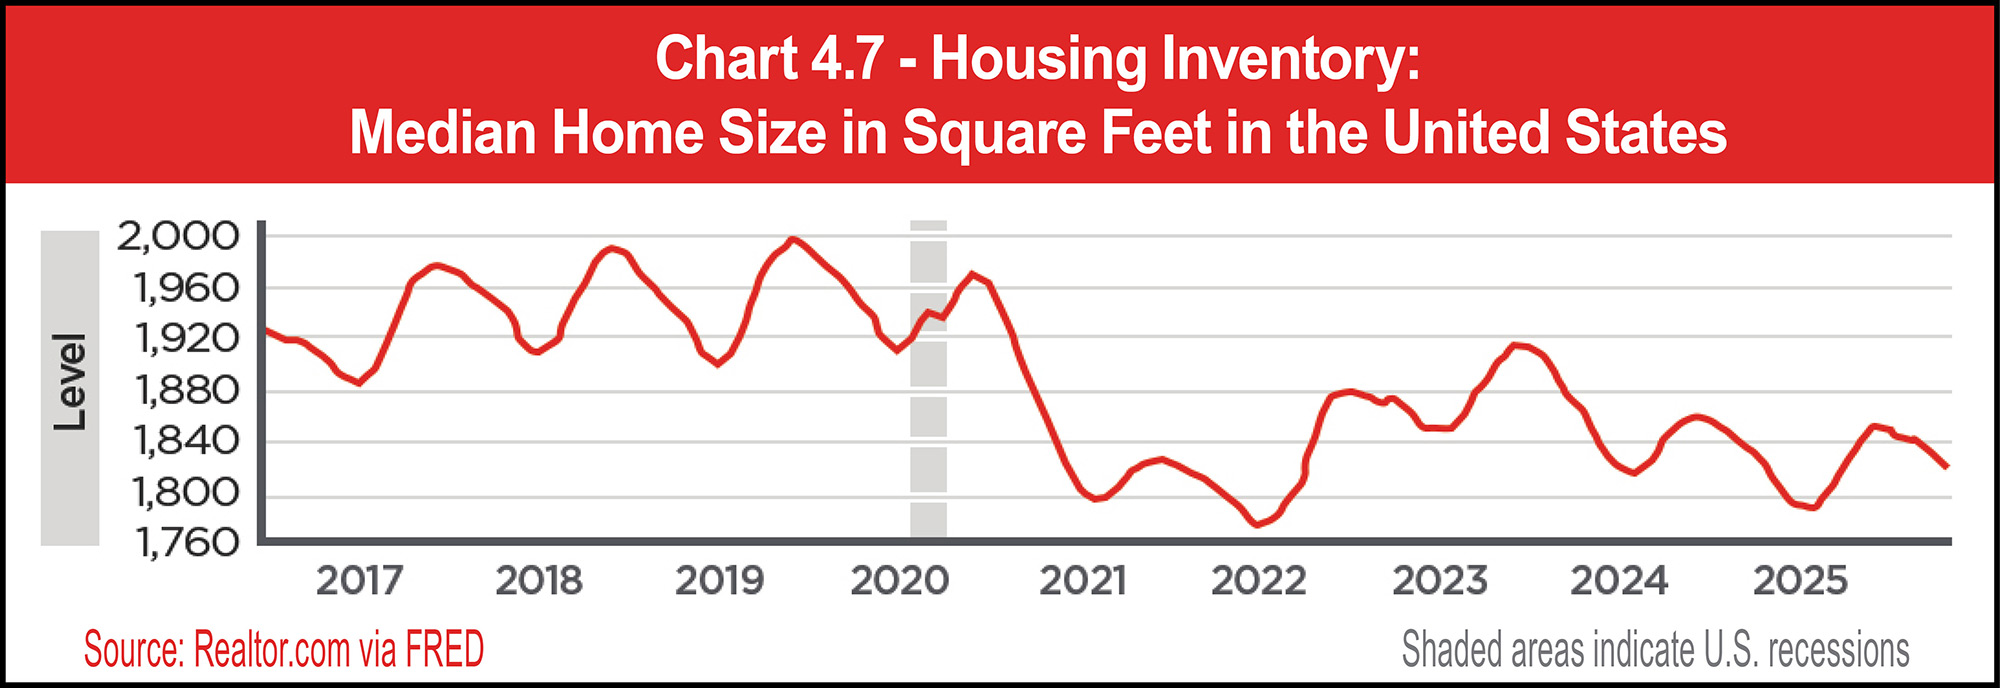
See Chart 4.7.
See Table 4.4.
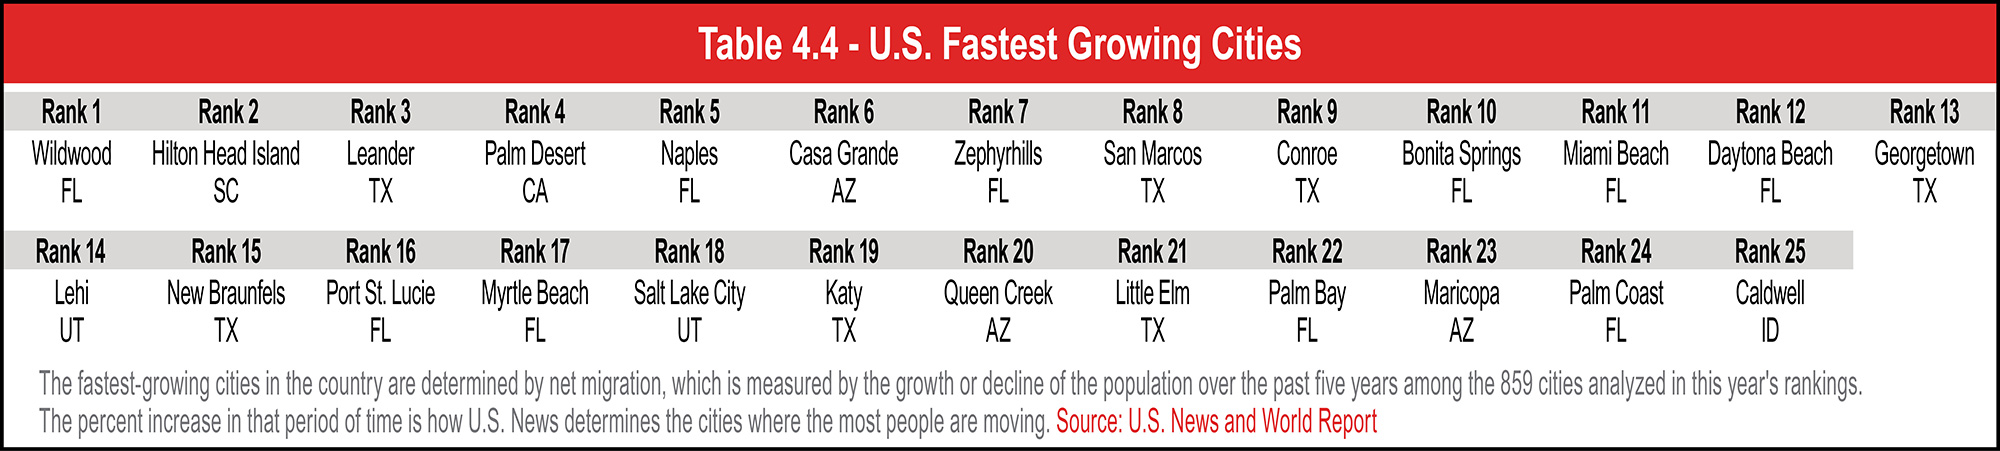
Over the long term, Americans are moving less. A report by North American Van Lines found that the number of individuals that moved in 2025 dropped 3 percent compared to 2024. Tennessee, North Carolina, and South Carolina have consistently ranked among the top inbound states since 2020, while California was the top outbound state for the second consecutive year.
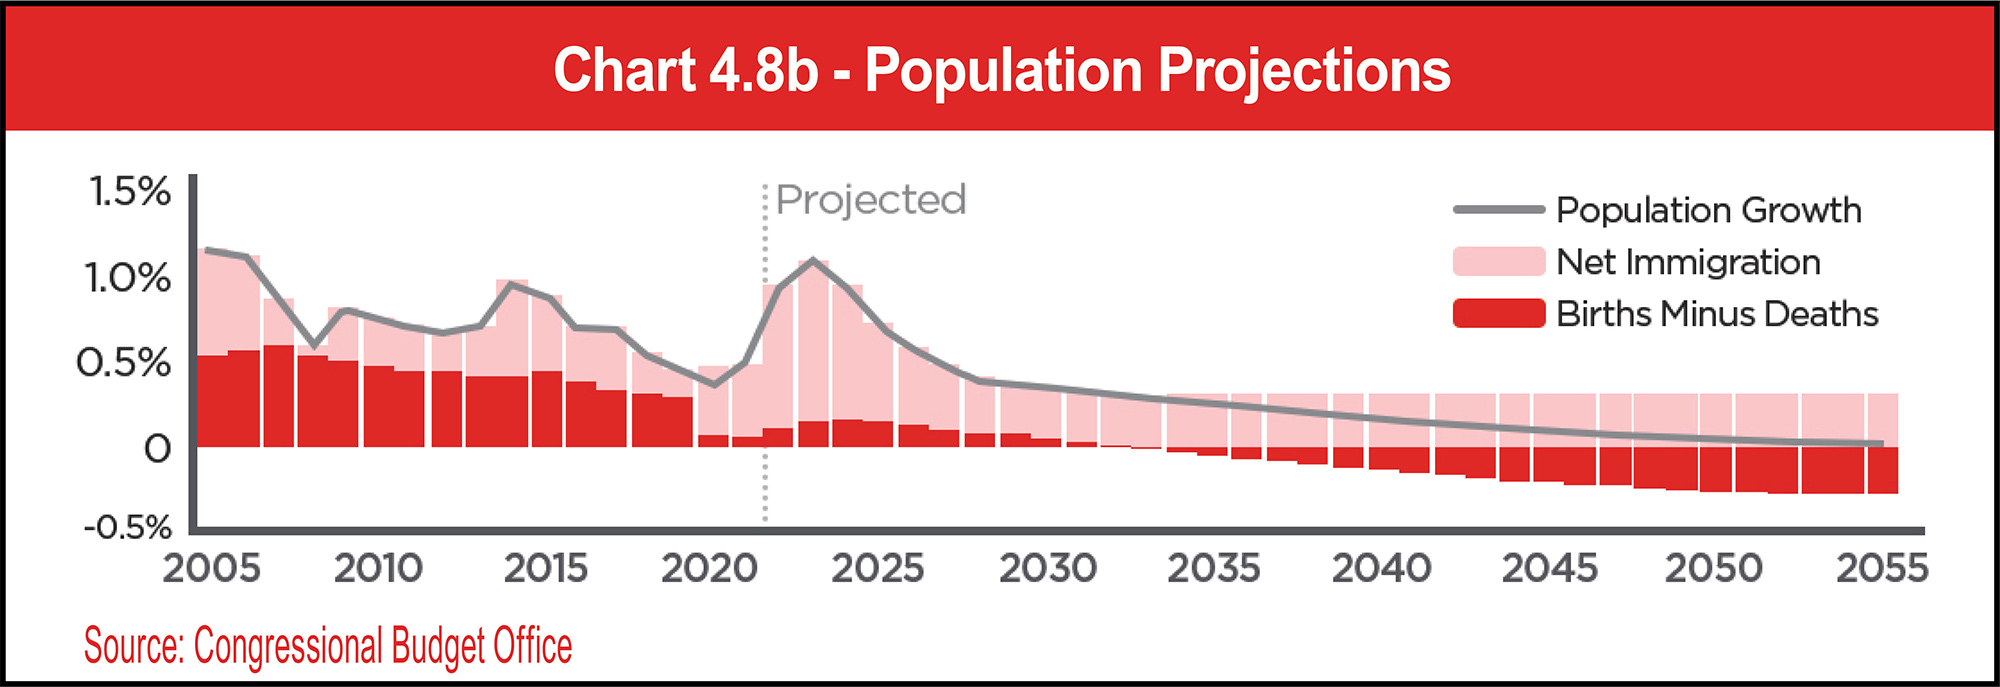
The size and age of the U.S. population have major implications for the economy and the federal budget, helping government agencies estimate the needs for services and infrastructure as well as anticipate forthcoming needs. The U.S. continues to experience robust population growth. Total population increased from 340.83 million in September 2024 to 342.74 million a year later, adding nearly 2 million people.
See Chart 4.8a.

See Chart 4.8b.
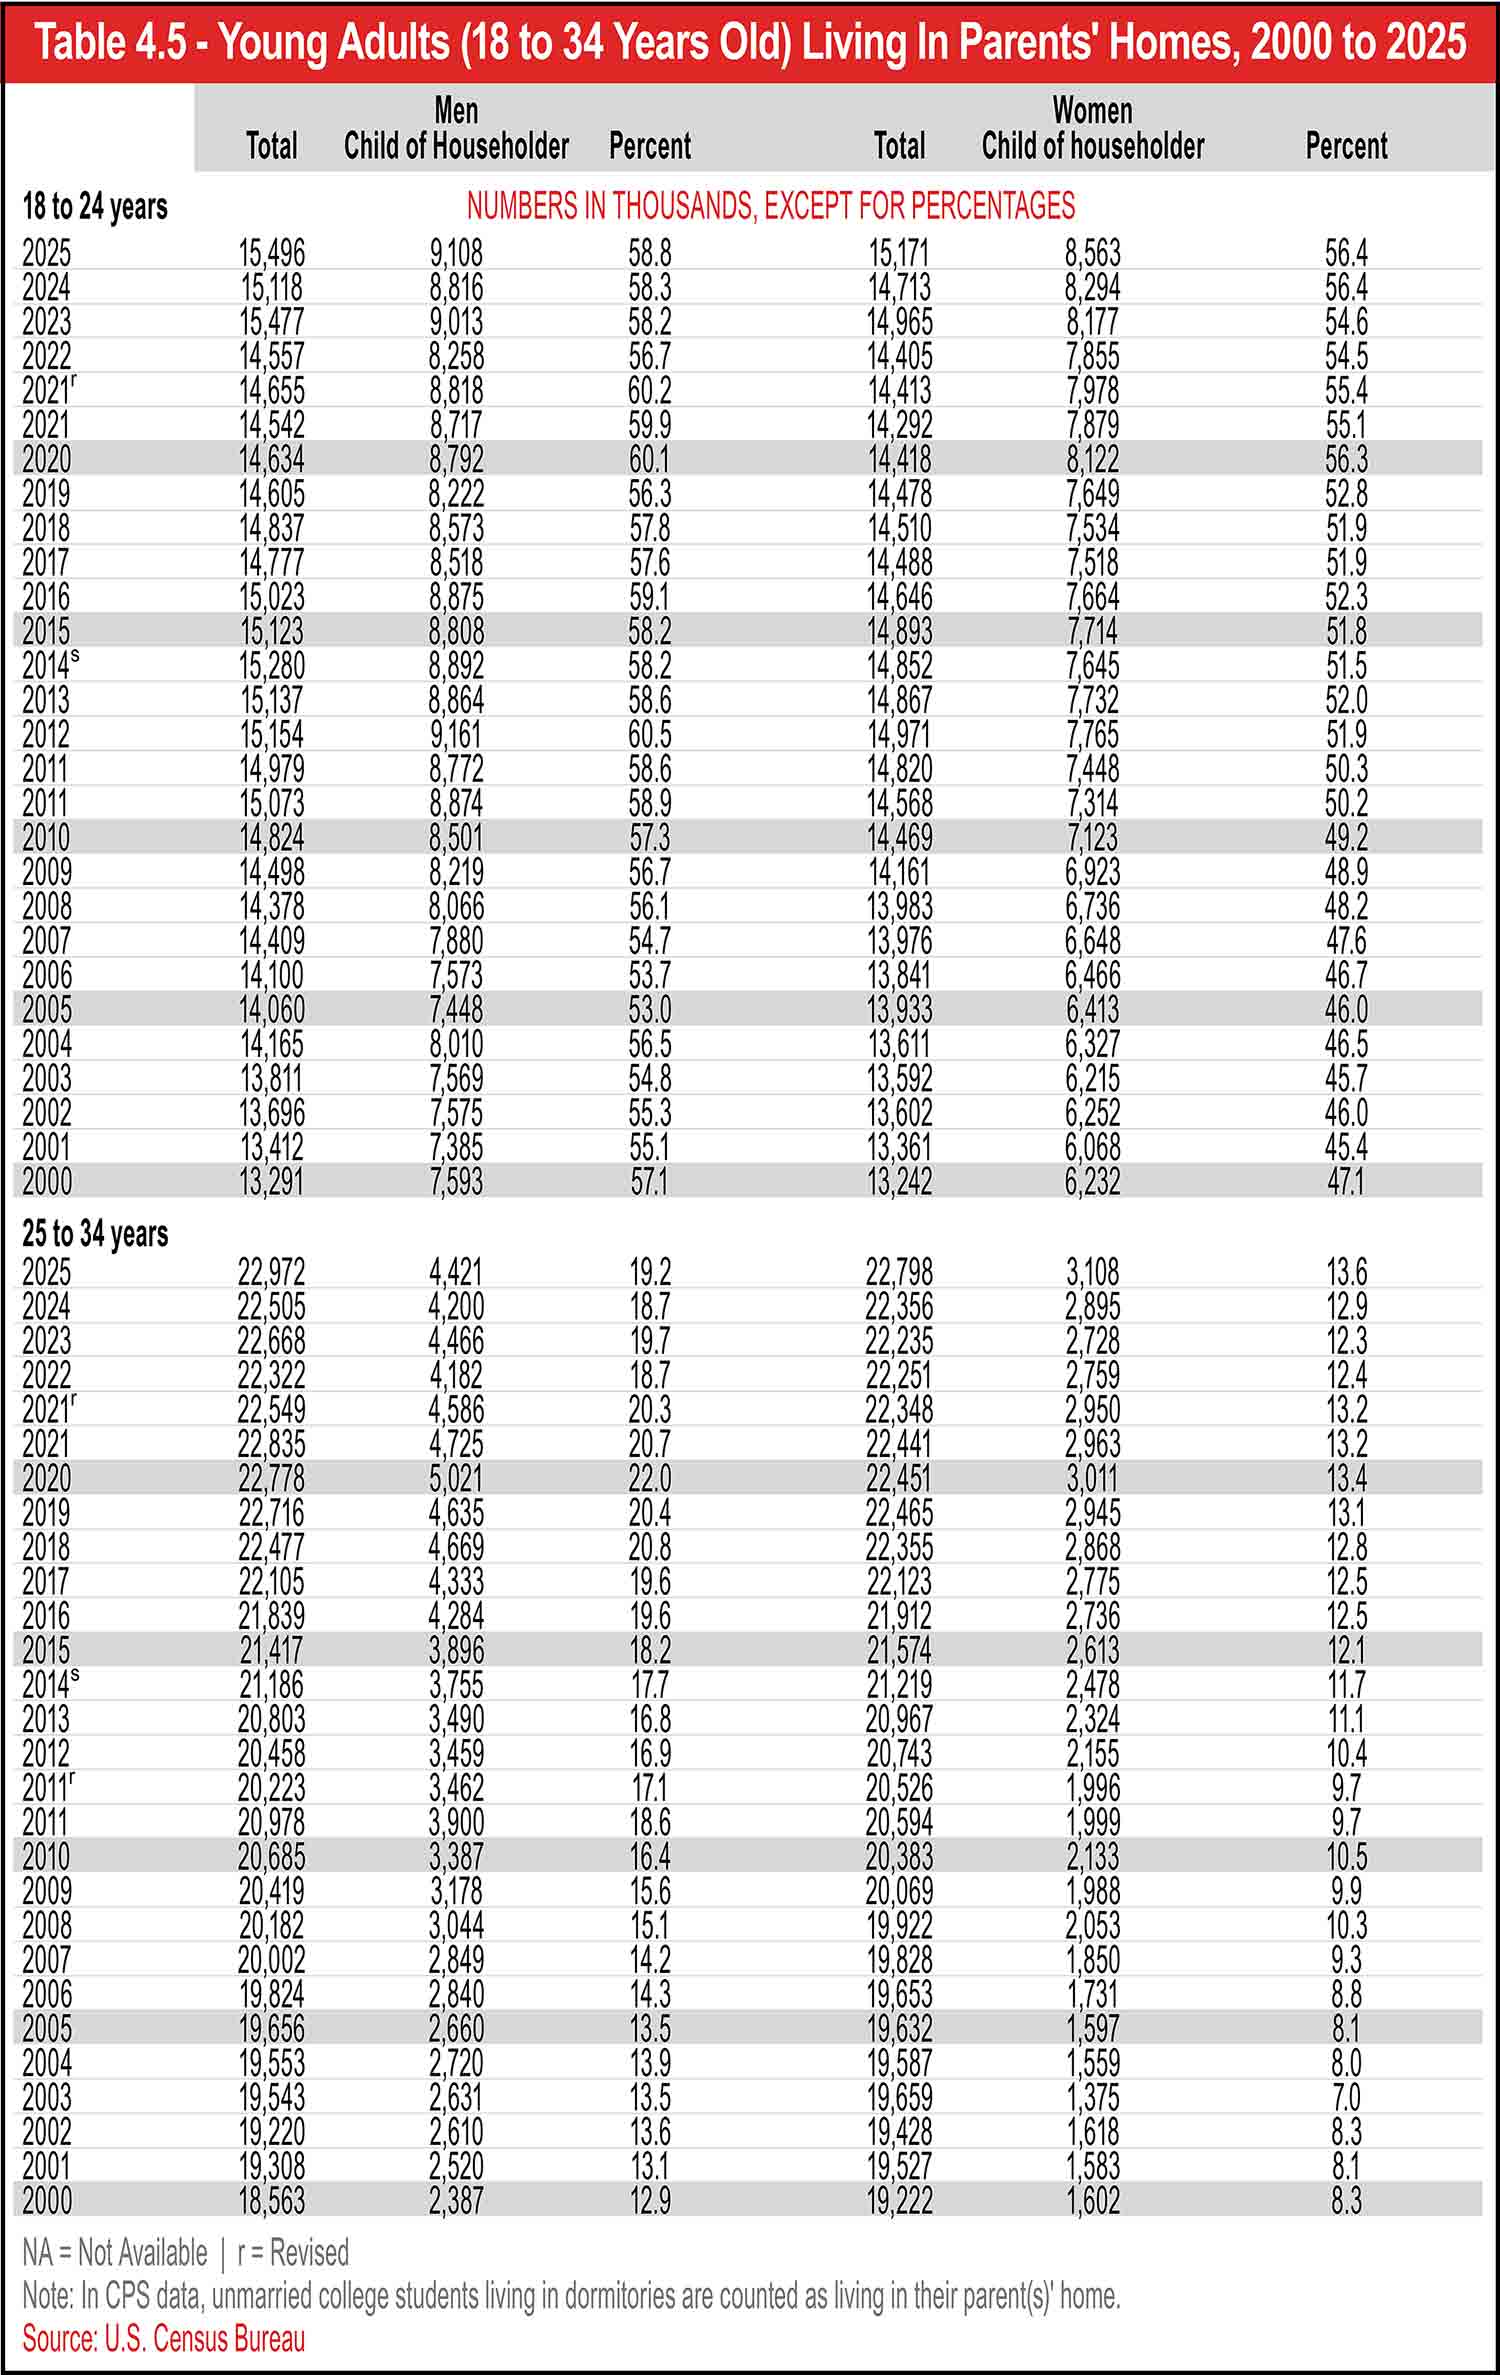
See Table 4.5.
Shrinking household sizes and the rise of single-person households accompany the decline in traditional married-parent families. The average number of people per household was 2.5 in 2025, compared to 3.33 in 1960. The long-term decline of household sizes likely factors into the trend of home sizes shrinking in the last decade. The median home size was 1,820 square feet in November 2025, declining from a peak of 1,997 square feet in June 2019 (according to a Realtor.com data series starting in July 2016).
See Chart 4.7.
The future of the workforce is a major question mark heading into 2026. Many companies are racing to adopt AI tools, touting the technology’s potential to unleash innovation and productivity gains. While this presents significant upsides for employers, AI seems to have driven tens of thousands of job losses in 2025. Massive disruption to the U.S. and global workforce is a possibility if AI is widely adopted. Unemployment crept up in 2025 and AI could accelerate that trend, as employers focus on reducing their labor costs.
Inflation is another lingering uncertainty, with declining consumer confidence in the second half of 2025 reflecting concerns about stubbornly elevated costs. While inflation may ease in 2026, affordability concerns are becoming a major political issue. Housing affordability is a key part of this discussion as home prices keep rising and mortgage rates remain elevated, putting a damper on home sales activity. Median asking rents have seen a sustained decline, providing some relief.
Economic and demographic trends will continue to shape self-storage demand in 2026 and beyond. The declining mobility of the American population is a headwind for the industry, since movers seeking temporary storage are a core driver of demand. Shrinking home sizes, on the other hand, could prompt more people to seek extra space for their belongings. A sustained trend of people moving to more expensive, crowded metros could further support self-storage fundamentals in the years ahead.




o cultivate a profitable self-storage business, you first need to know your customers. Knowing your customer base enables you to customize your marketing, offer the features and amenities your prospects need and/or want, and increase your success within your market.
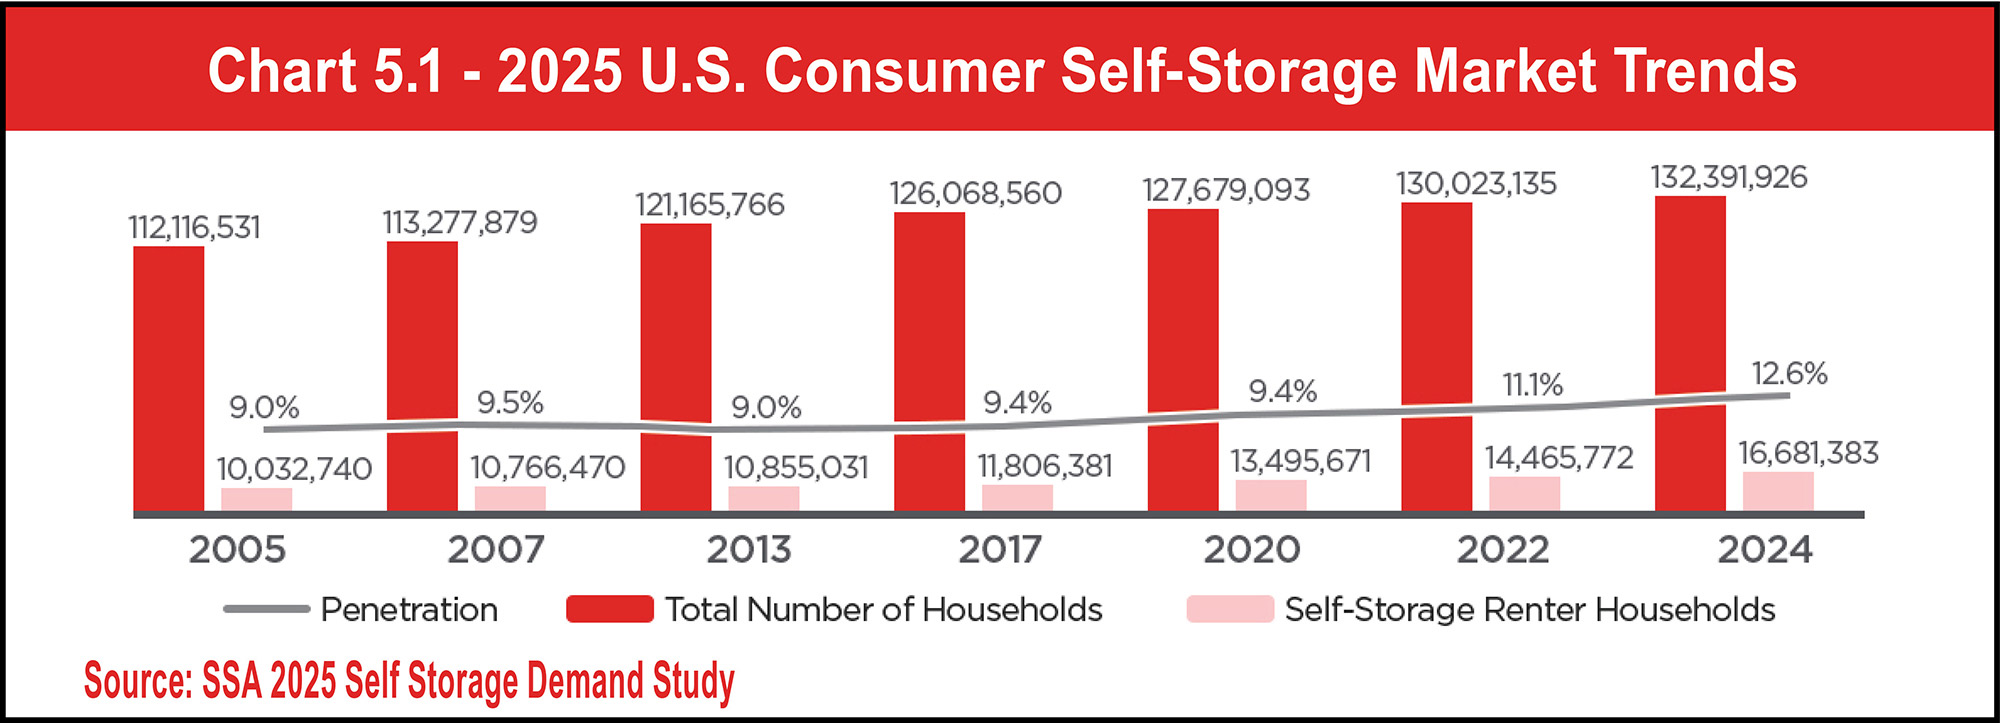
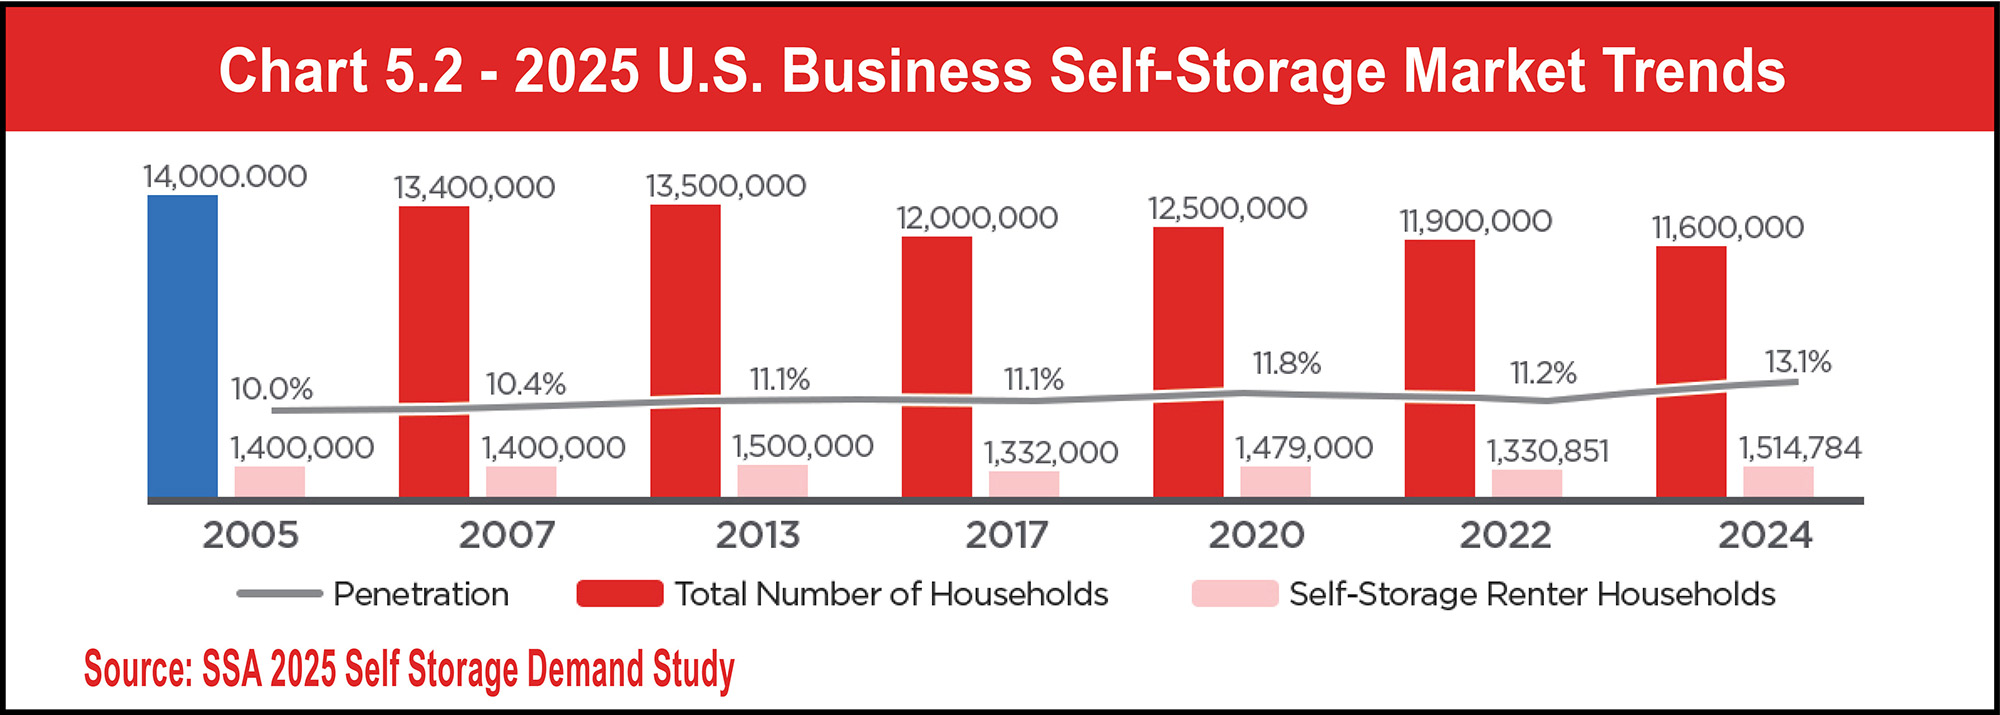
This section takes a national look at the traits of self-storage customers, with much of the referenced data sourced from the Self Storage Association’s (SSA) 2025 Self Storage Demand Study. These national trends will shed light on customers in your market, but employing local sources to obtain more granular data is necessary for the best results. For instance, realtors tend to have valuable information about an area’s number of households, household income, poverty, and other helpful statistics.
See Charts 5.1 and 5.2.
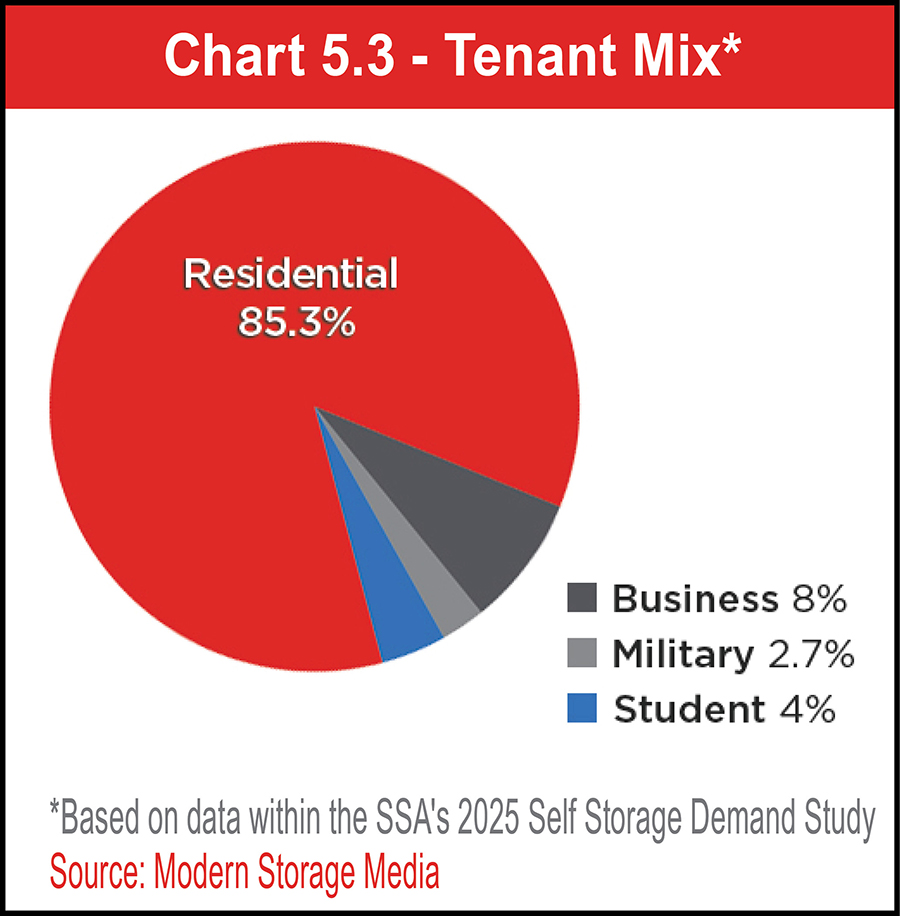
See Chart 5.3.
To attract commercial customers, many self-storage operators focus on forming strategic, business-to-business alliances with professionals and businesses most likely to need storage or refer customers, such as realtors who need storage for items used to stage houses for sale, businesses requiring file/record storage, small businesses needing to store inventory, drug reps needing to securely store drug samples in a climate-controlled setting, service providers needing to store equipment and supplies, and package delivery services in need of last-mile storage. Your local chamber of commerce is a great source for information about businesses in your market area.
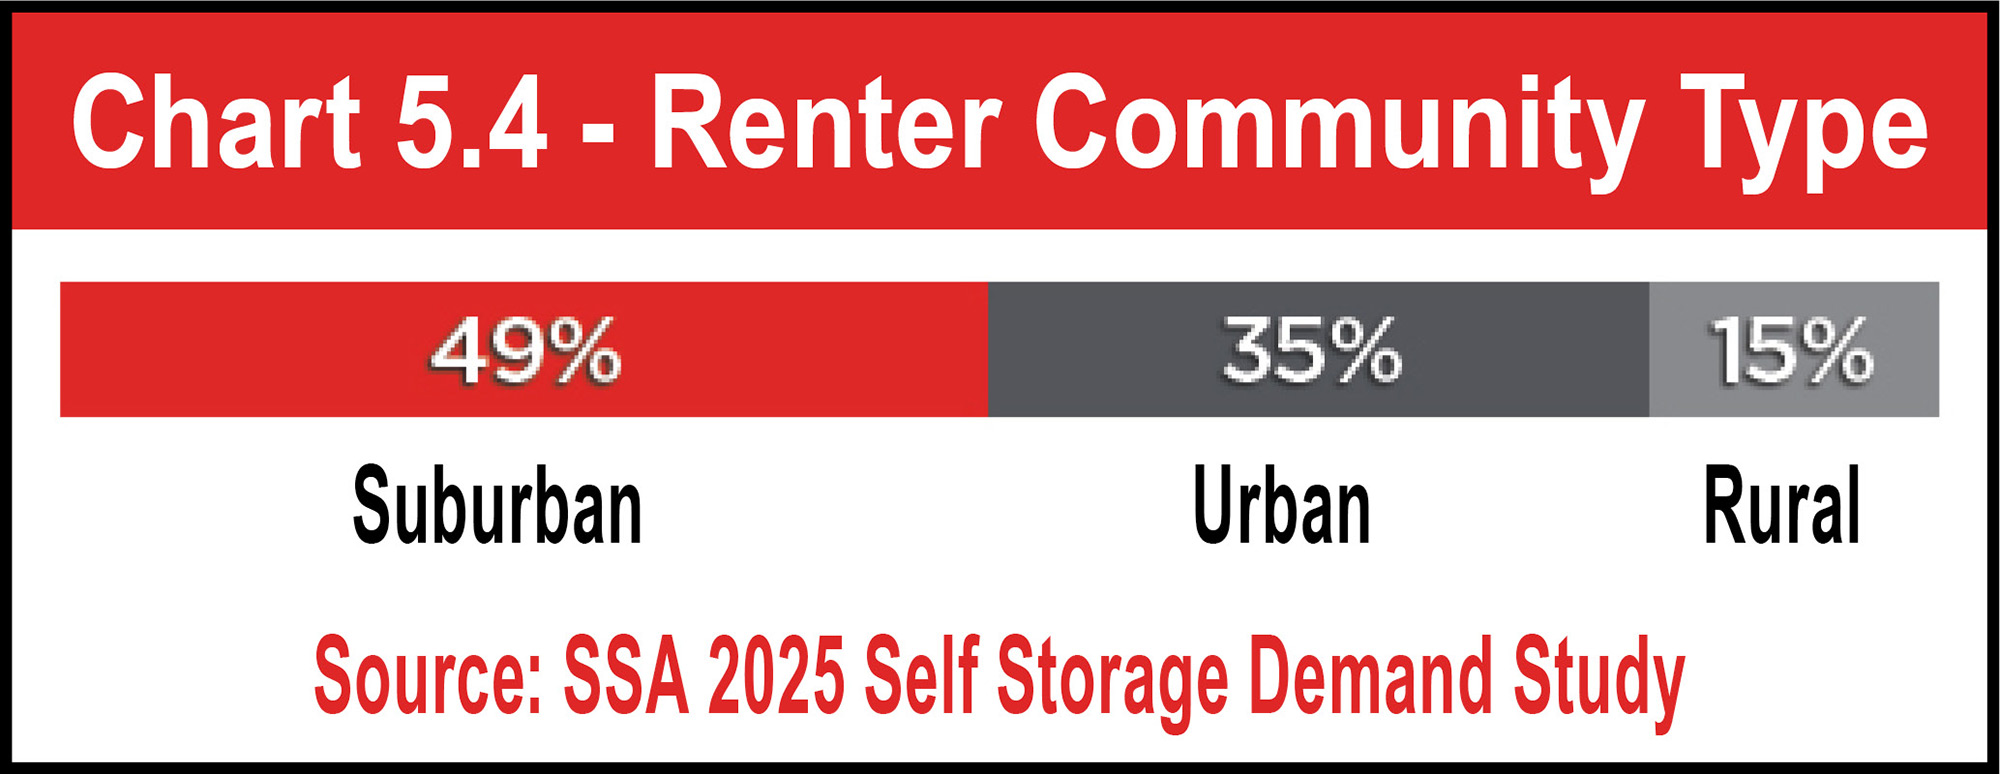
See Chart 5.4.
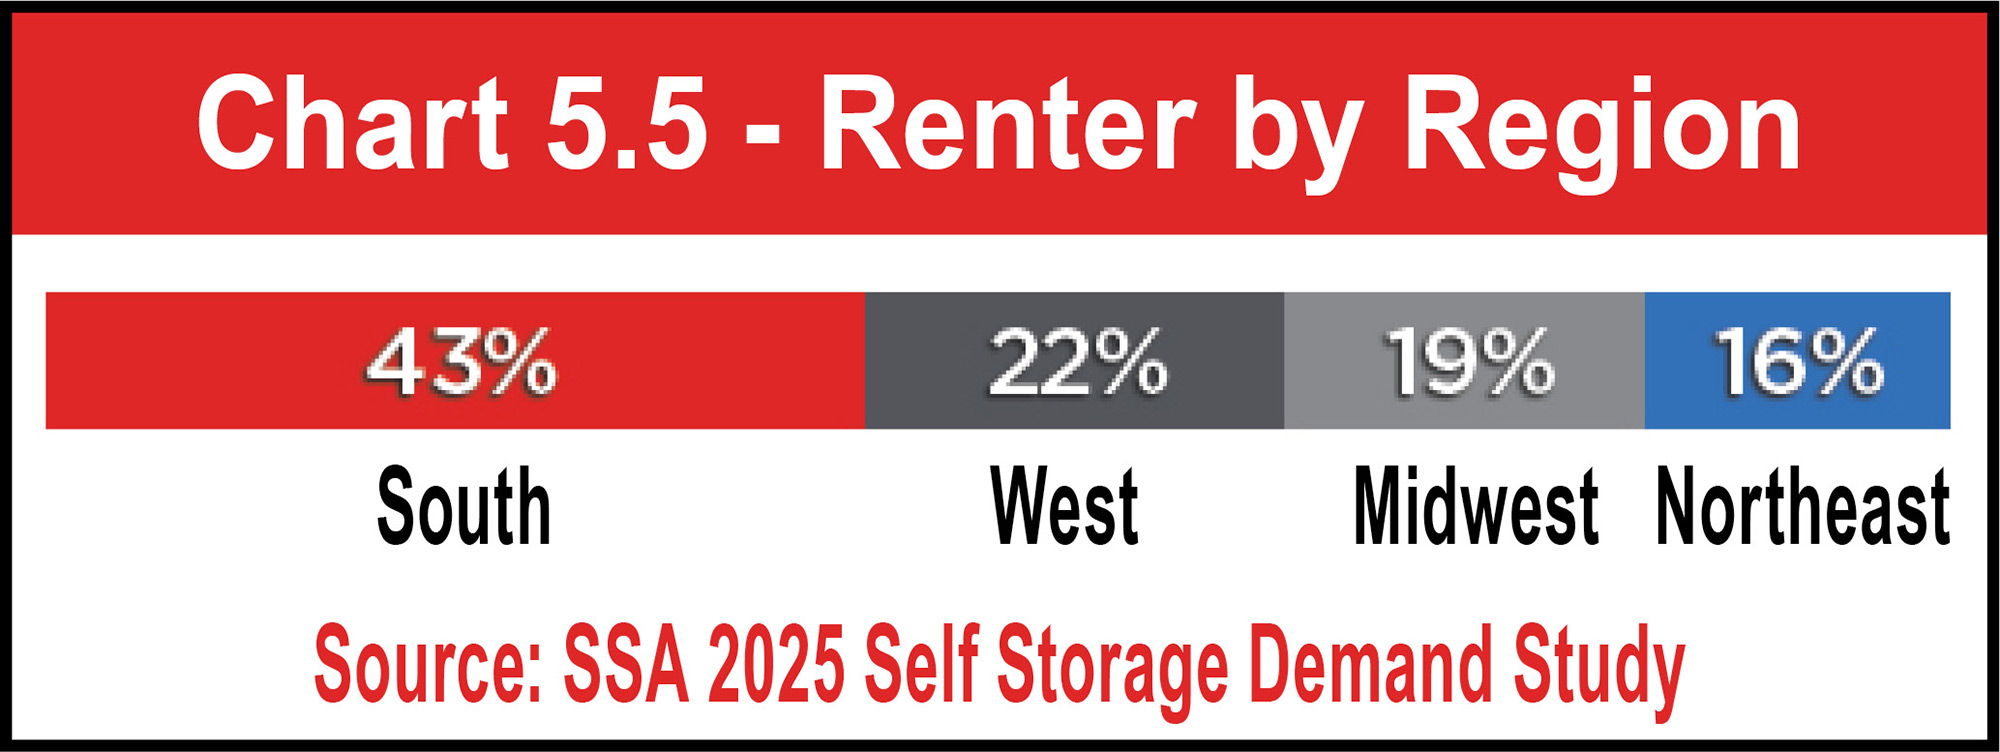
Chart 5.5 shows that there are nearly twice as many renters in the South than other regions in the United States. Forty-three percent of all households in the South use self-storage, whereas only 22 percent rent in the West, 19 percent rent in the Midwest, and 16 percent rent in the Northeast.
See Chart 5.5.
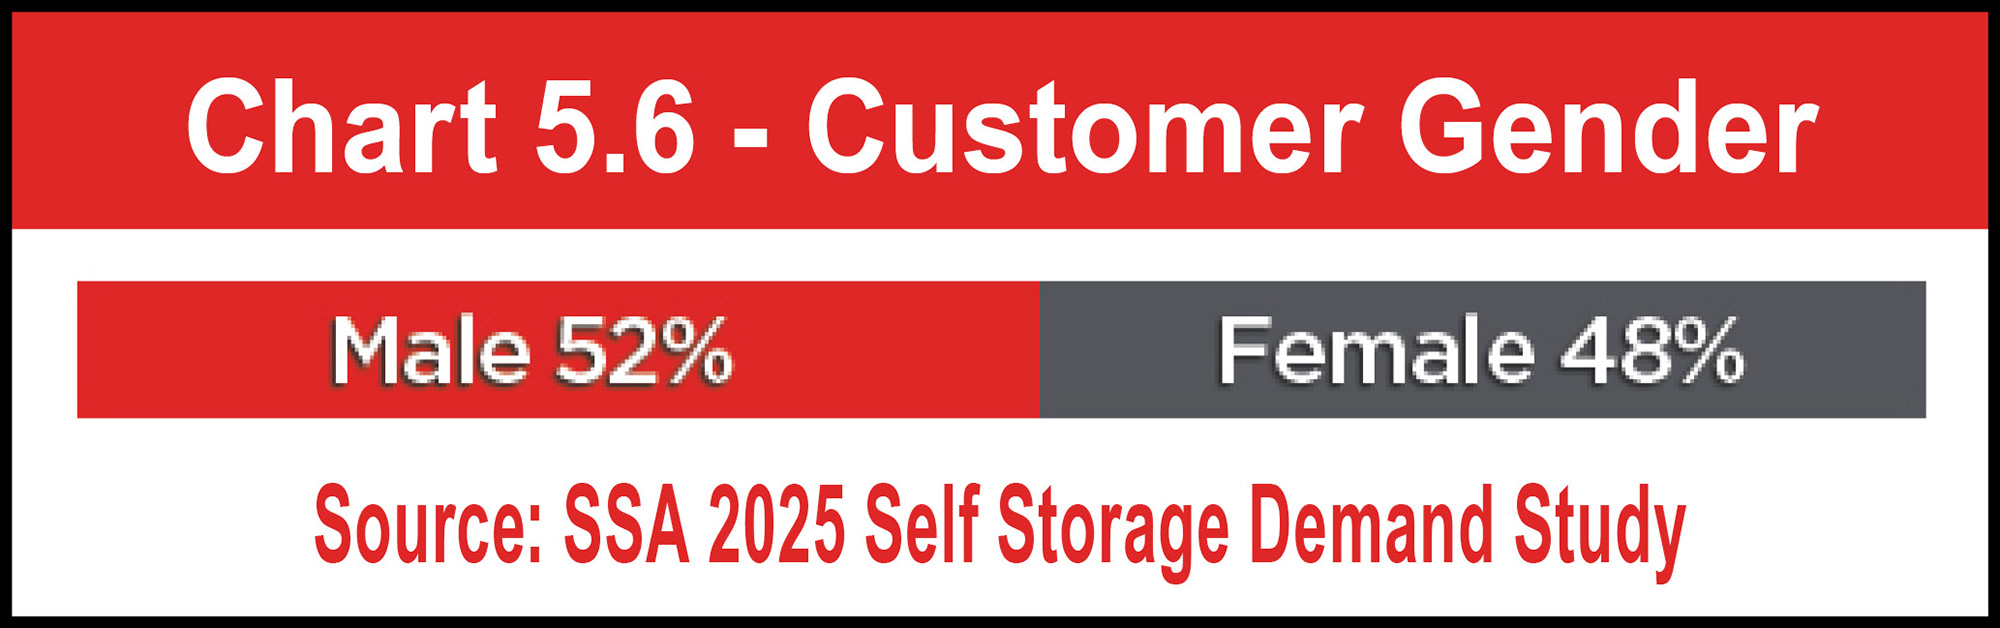
See Charts 5.6 and 5.7.

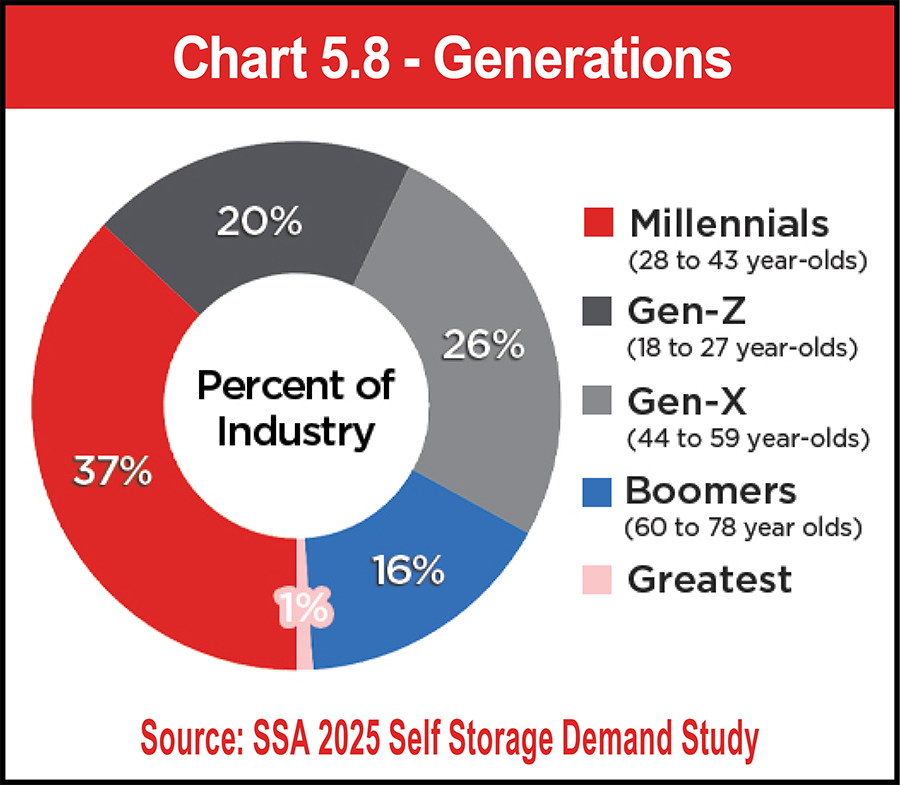
Looking at demographic data by generation brings other shifts to light. For starters, there are more younger renters than ever. At 57 percent, Gen-Z and millennials make up more than half of the consumer self-storage market. Simultaneously, the number of boomers and Gen-Xers renting self-storage units continues to shrink (16 percent and 26 percent, respectively), and the Greatest generation is on the brink of disappearing from the data by representing only 1 percent of renters.
See Chart 5.8.
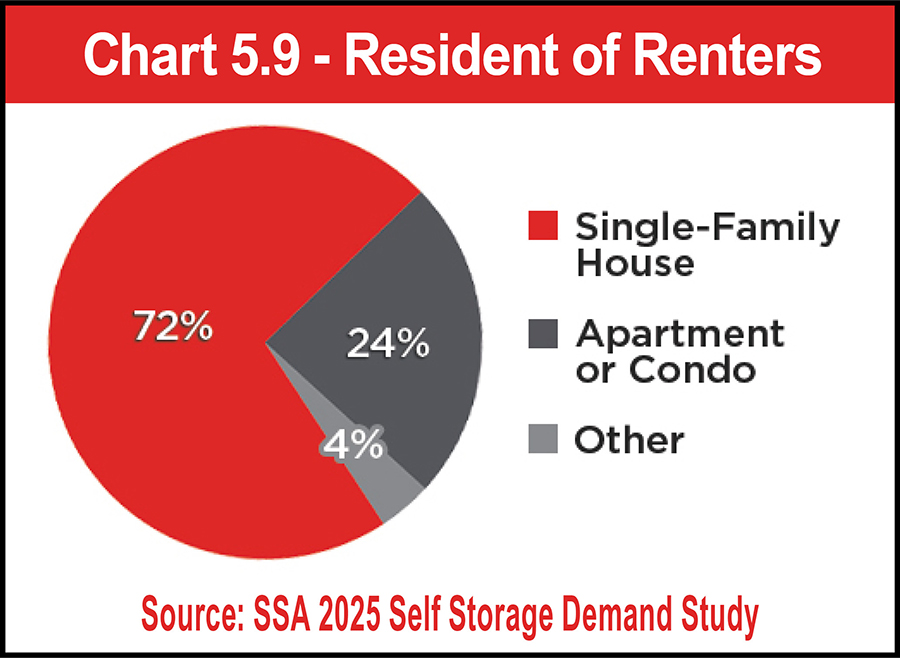
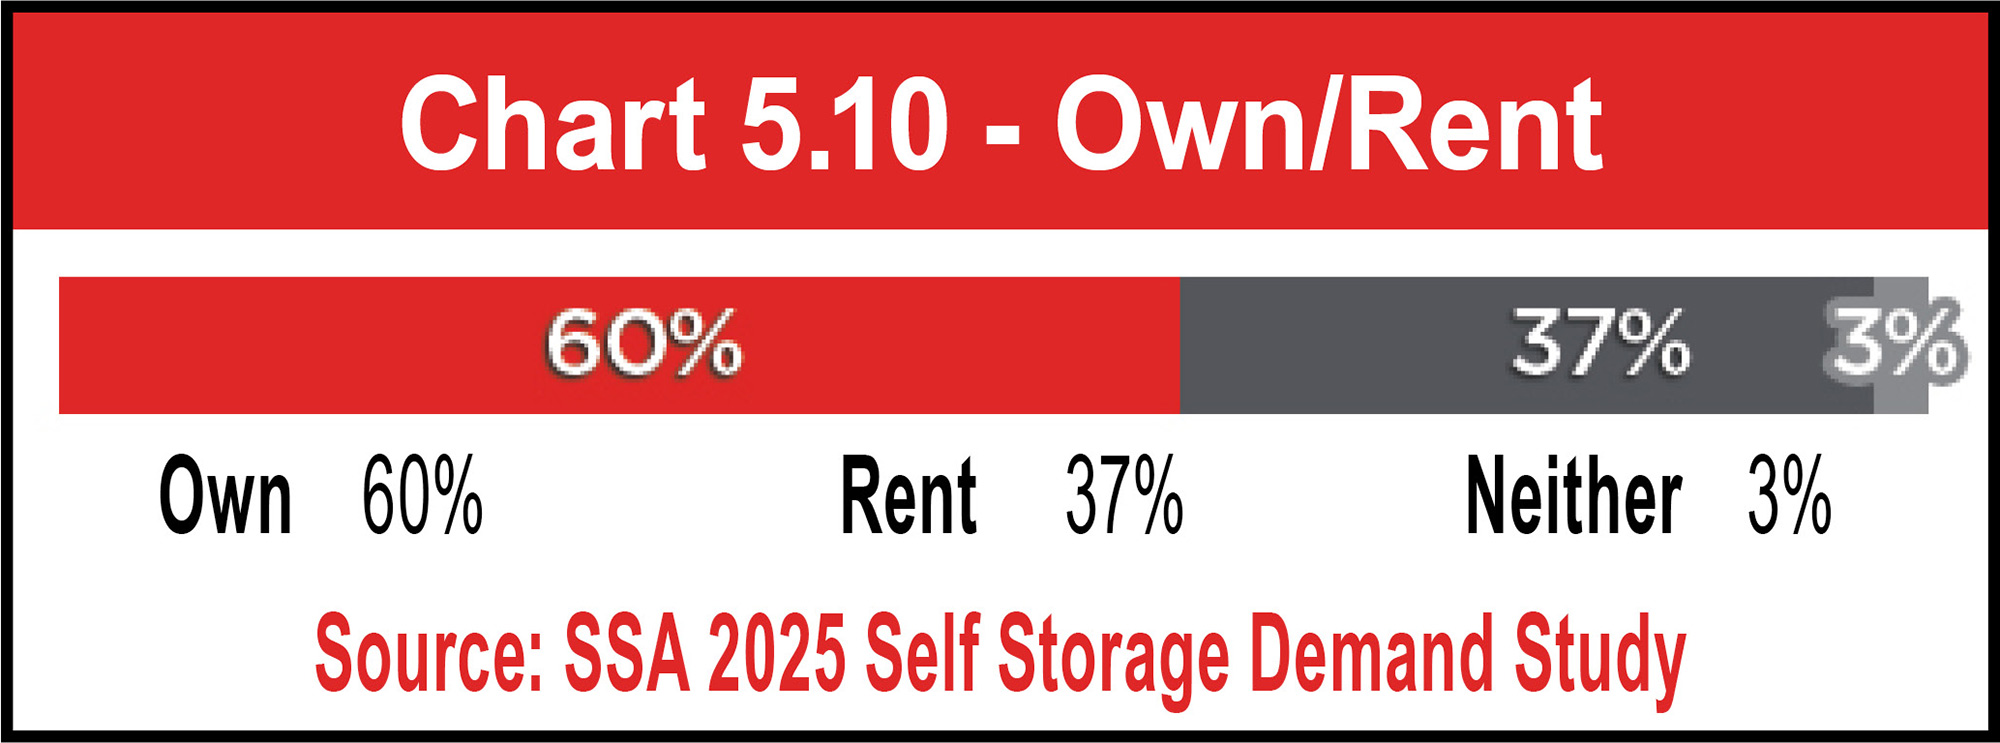
Along that line, nearly one-fourth of renters (24 percent) live in an apartment or condominium, whereas 72 percent reside within a single-family home. According to the 2025 Self Storage Demand Study, more than half of those single-family houses also provide at-home storage space via garages and attics. This proves that many Americans have more stuff than space, regardless of their residence type. But perhaps homeowners, who make up 60 percent of self-storage renters, are simply using their extra square footage for living instead of storing—a trend that peaked during the COVID-19 pandemic era.
See Charts 5.9 and 5.10.
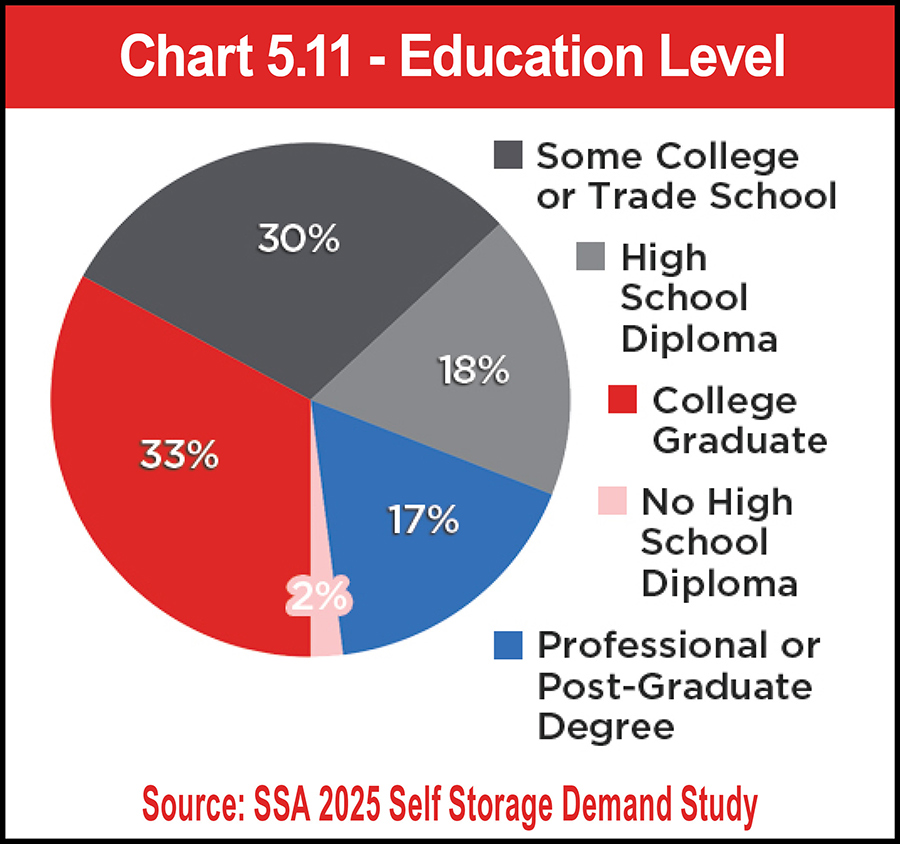
See Chart 5.11.
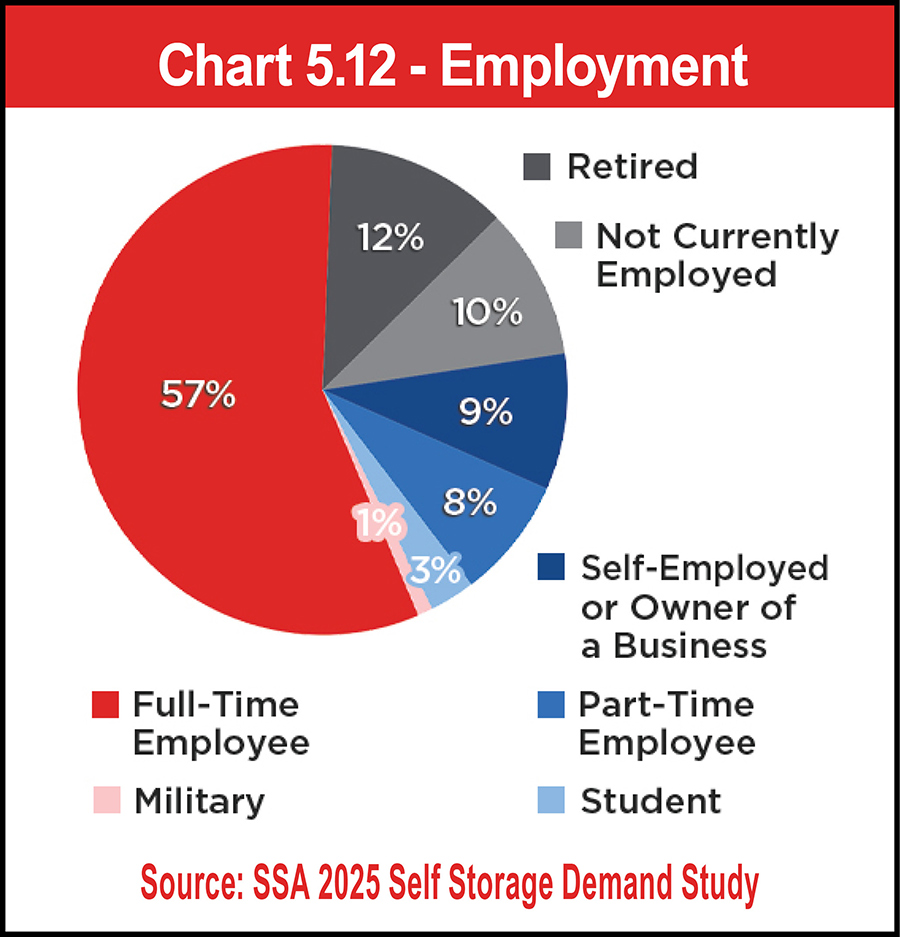
Obviously, education level can have an impact on employment and income. Of consumer renters, 57 percent are employed full time and 8 percent are employed part time. Although boomers and the Greatest generations make up 17 percent of renters, only 12 percent of renters are retired, which likely means that a portion of younger boomers are still active within the workforce. Nine percent of renters fall into the “self-employed and owner of a business” category. Another 10 percent of renters are currently unemployed.
See Chart 5.12.
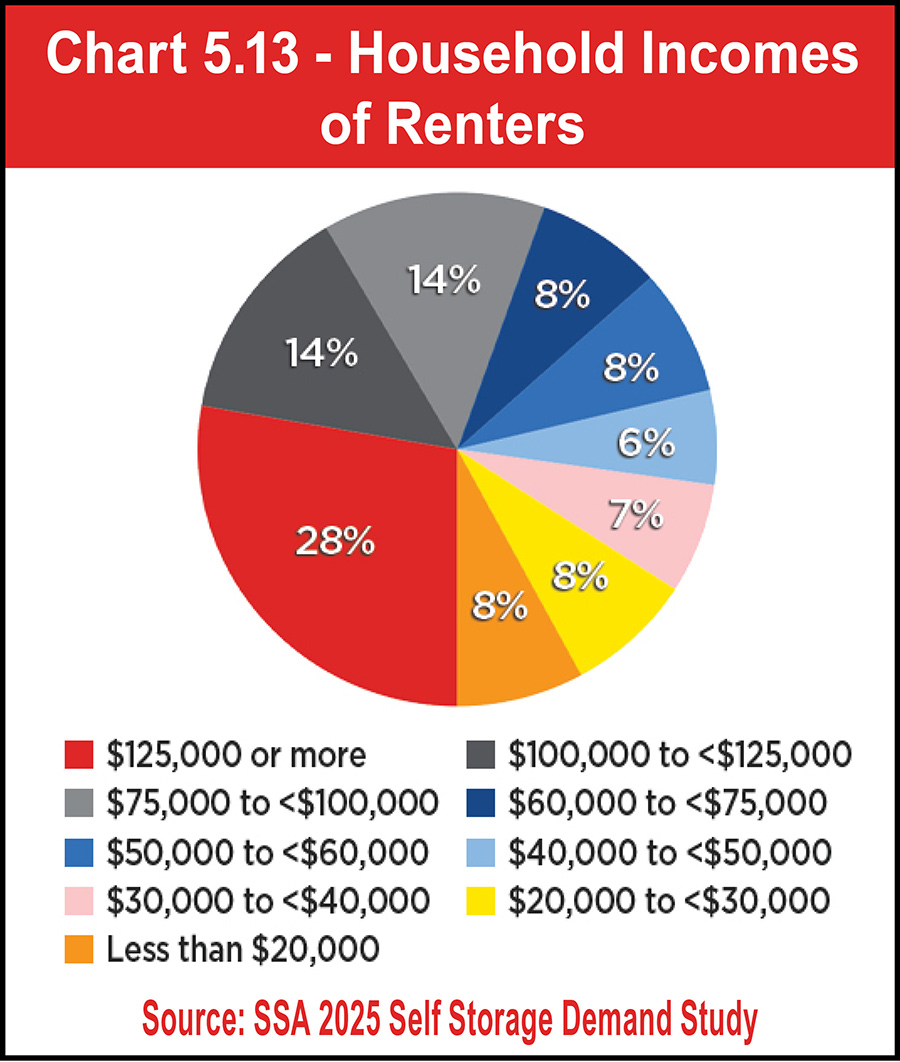
See Chart 5.13.
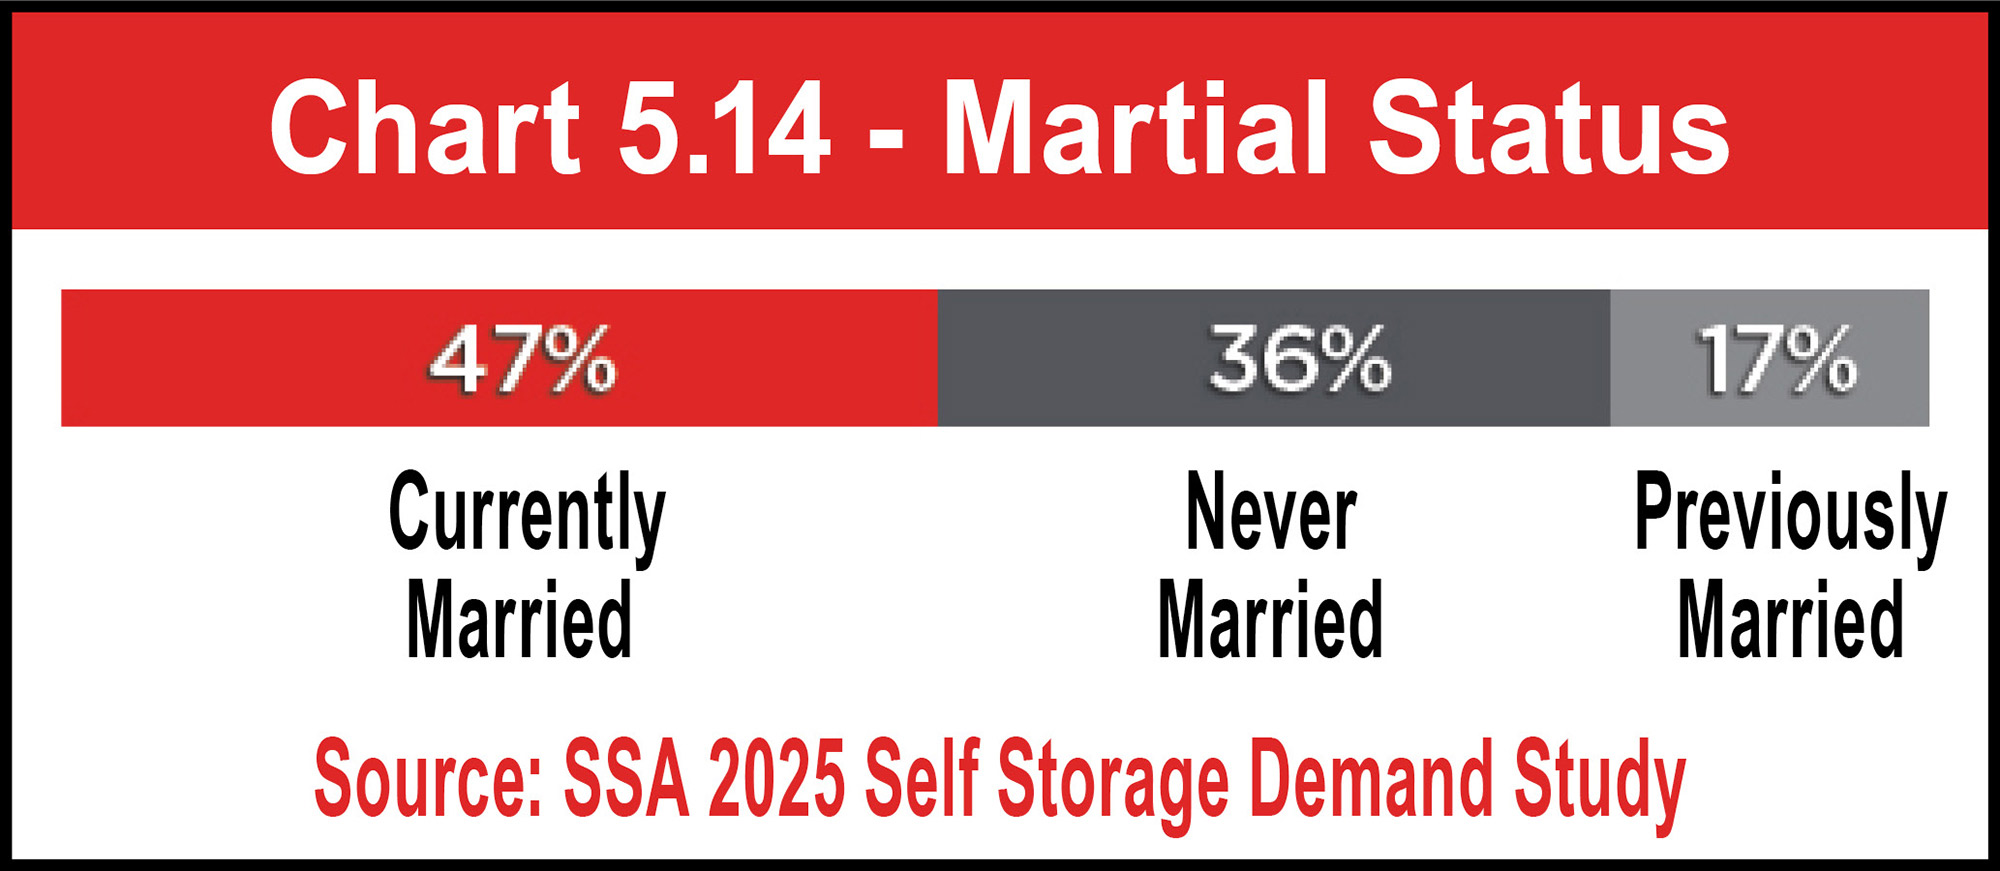
Of course, for married renters, household income would include their spouses’ wages. According to Chart 5.14, 47 percent of renters are currently married. While 17 percent were previously married, 36 percent have never been married. Fortunately for self-storage operators, all martial statuses can necessitate self-storage demand. Newlyweds may need to store belongings after consolidating two homes into one, whereas couples going through divorces may require storage as they sort through the home they once shared and make other living arrangements. Those never married may be impacted by the other “Ds” of demand: death, downsizing, distribution, dislocation (or disaster), and decluttering.
See Chart 5.14.
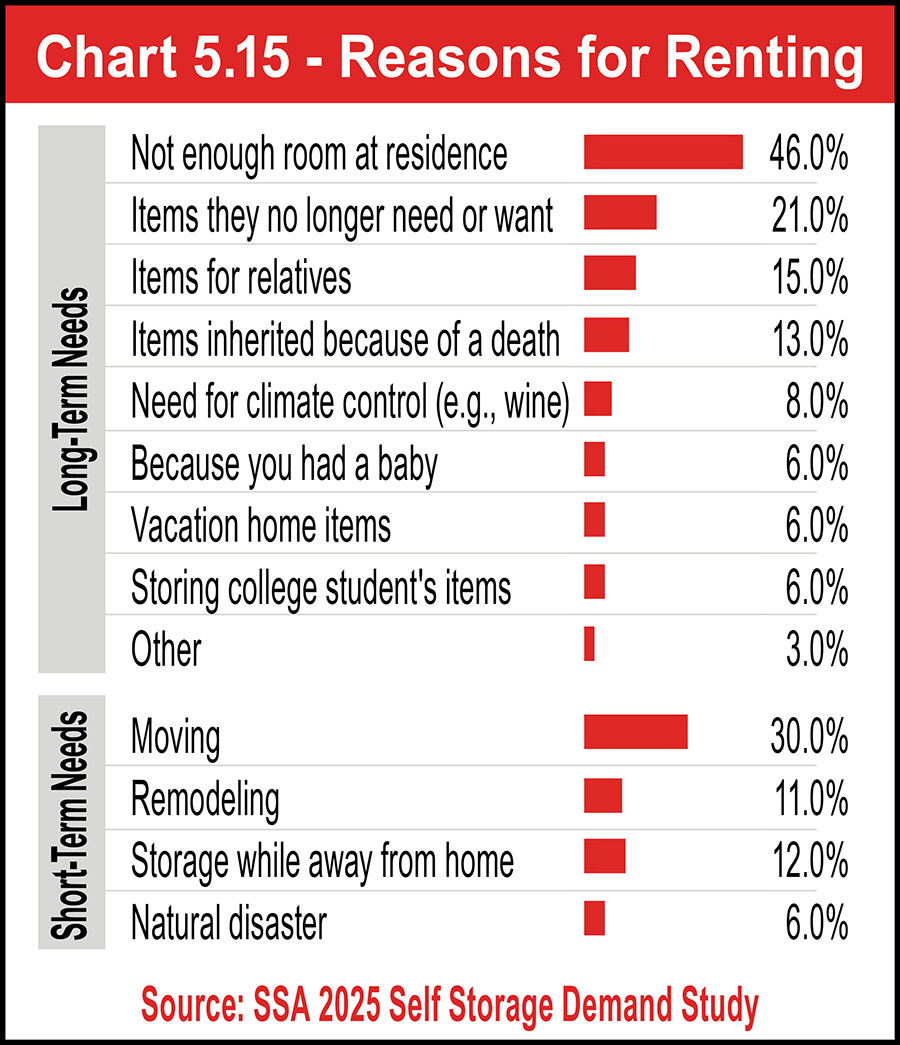
Among short-term needs, moving still tops the list at 30 percent. However, since the 2023 Self Storage Demand Study was released, the percentage of renters using storage during a change a residence has dropped 5 percent. The main reason for this decline is people have been moving less due to high housing costs and expensive mortgages with high interest rates. Moreover, unlike traditional in-person employment opportunities, remote work may make moving unnecessary, so this percentage could continue to decrease. Needing storage while away from home is the reason 12 percent of customers rent units. Six percent use it due to a natural disaster, and 11 percent use storage during remodeling projects.
See Chart 5.15.
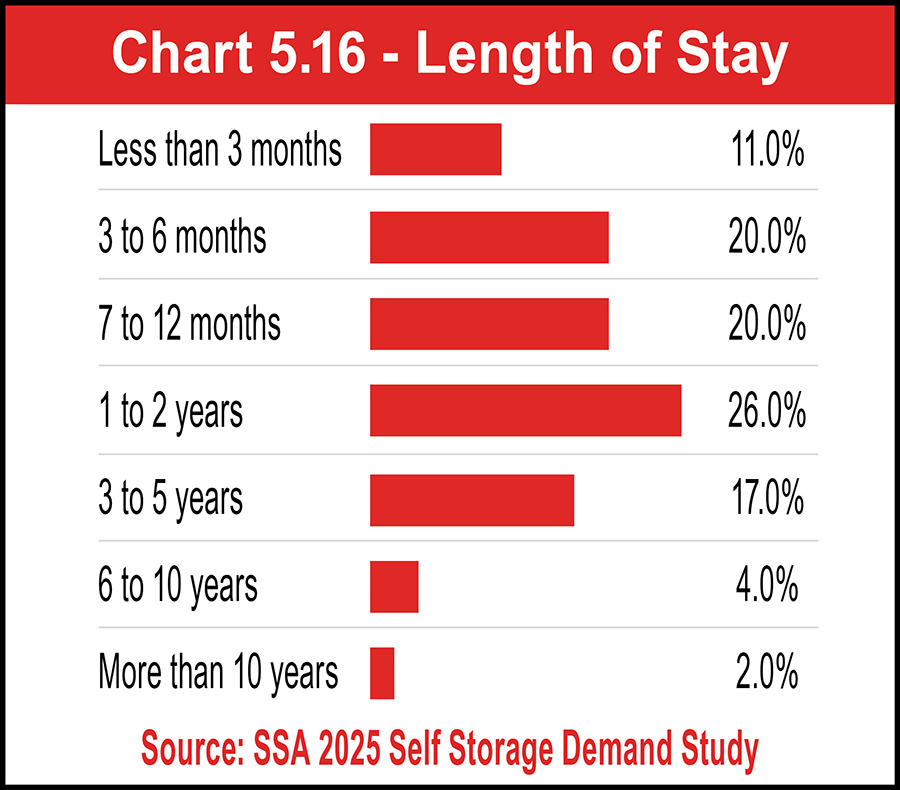
See Chart 5.16.
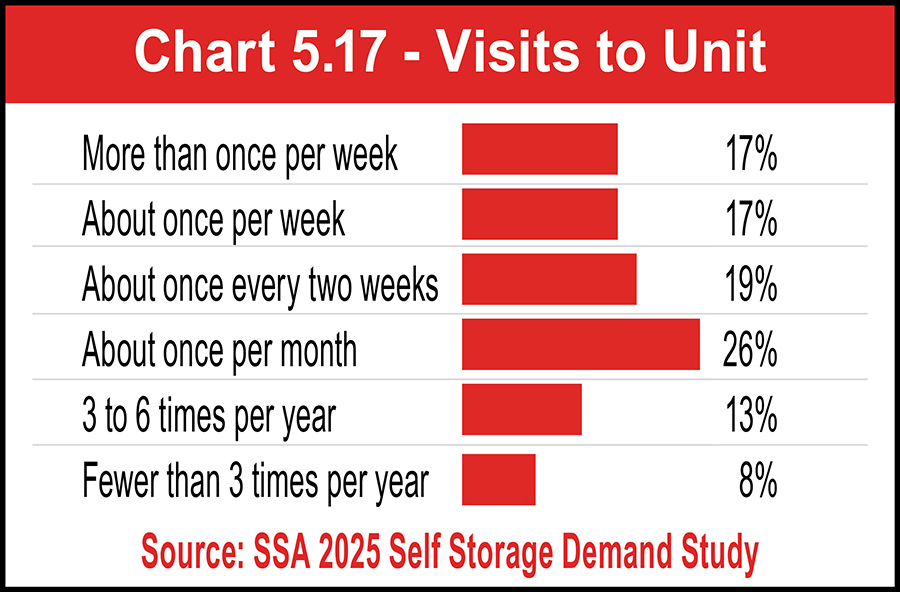
As such, it should come as no surprise that units are being visited more frequently than ever before. In fact, the percentage of renters visiting their units more than once per week has increased by 5 percent in two years to 17 percent. Now, only 8 percent of renters visit their stored belongings fewer than three times per year—a 2 percent decrease from 10 percent in 2023. Additional visits to units can be helpful for early detection of mold, mildew, pests, and other potential damages, but increased foot traffic at a facility could prompt renters to request more amenities, products, and/or services.
See Chart 5.17.
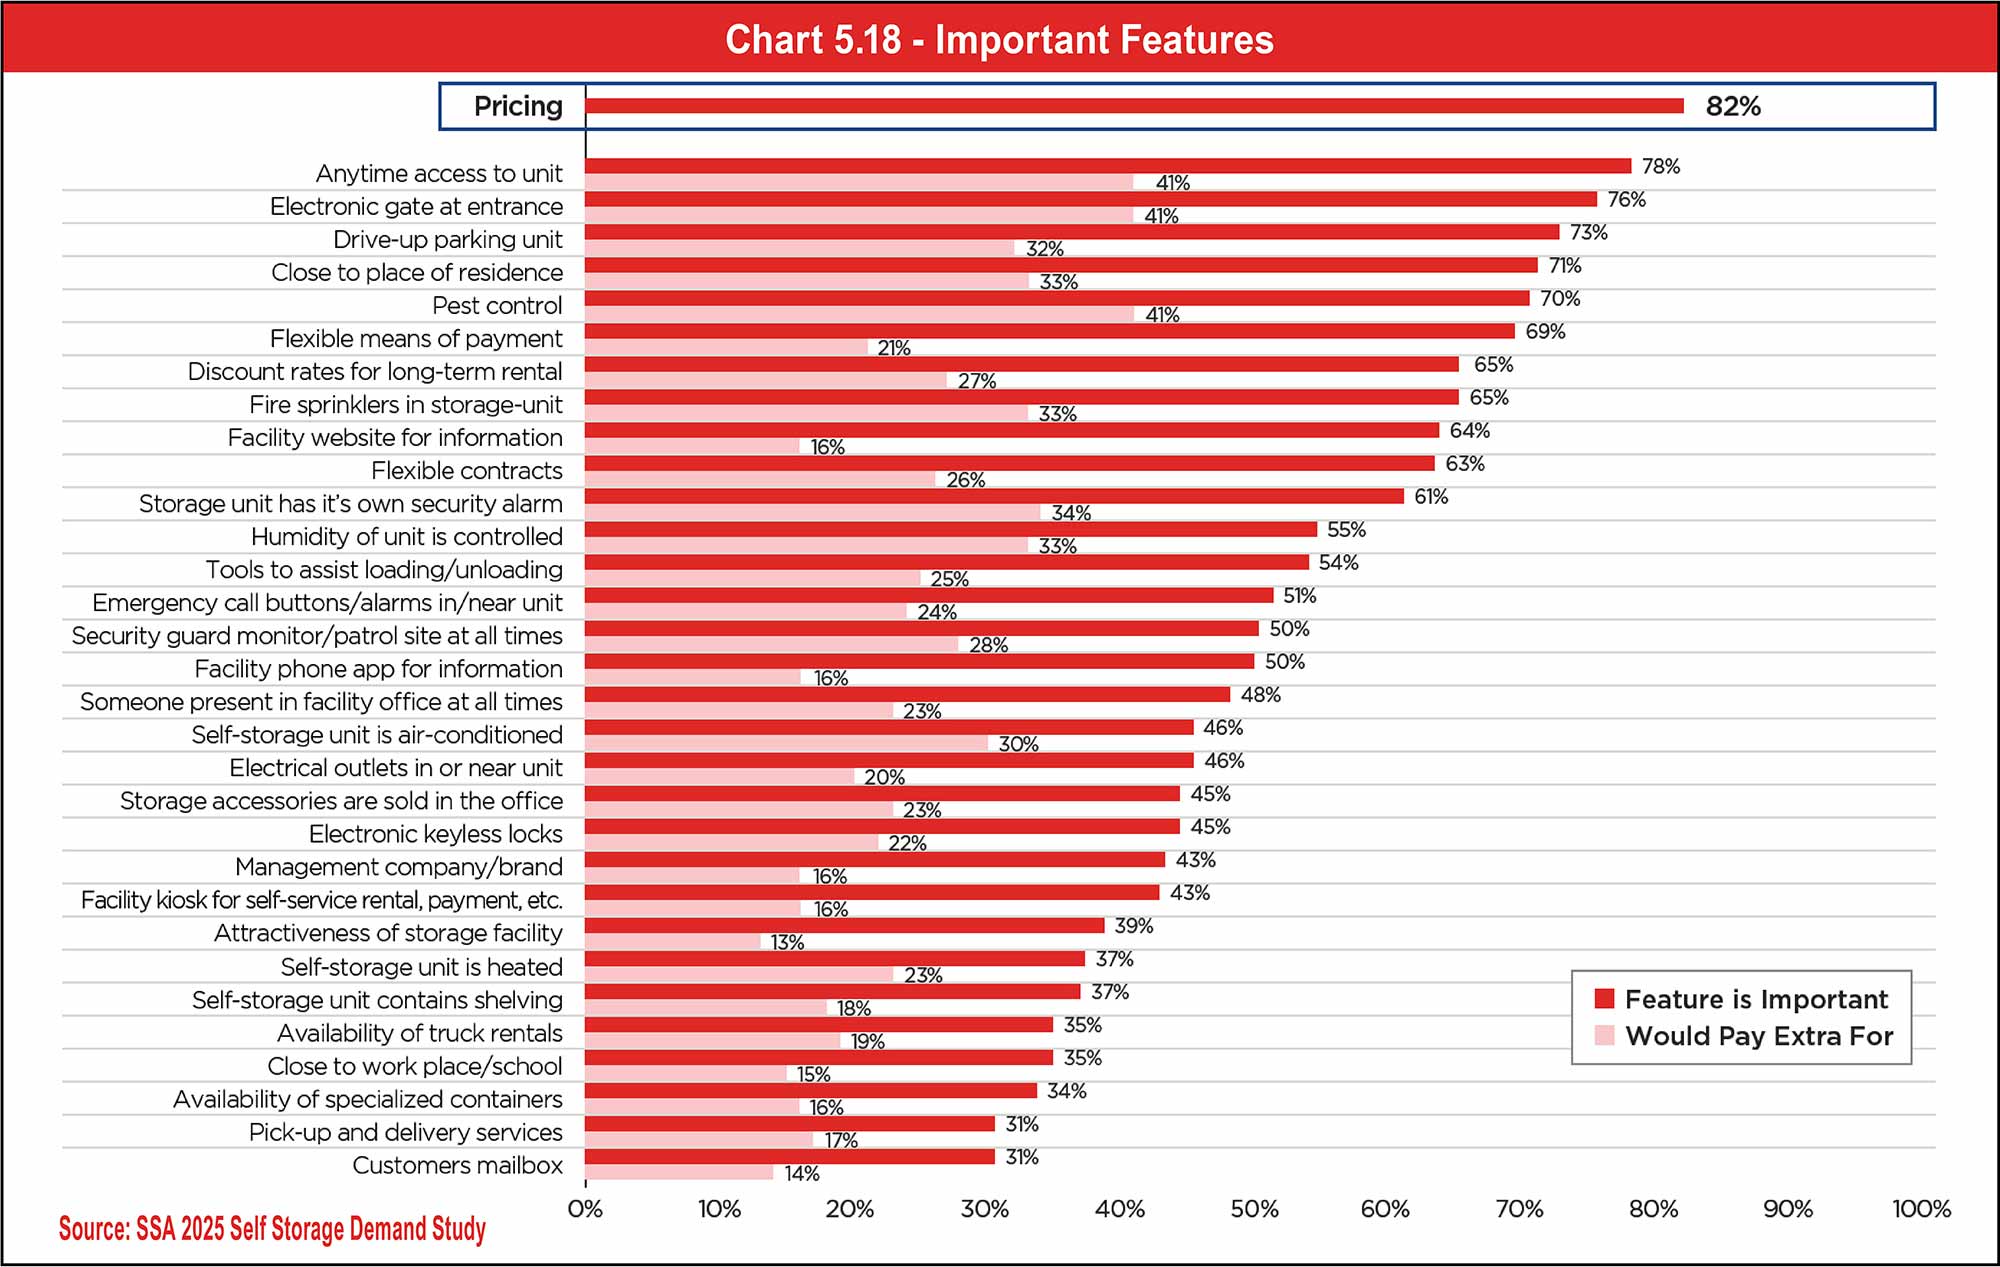
See Chart 5.18.
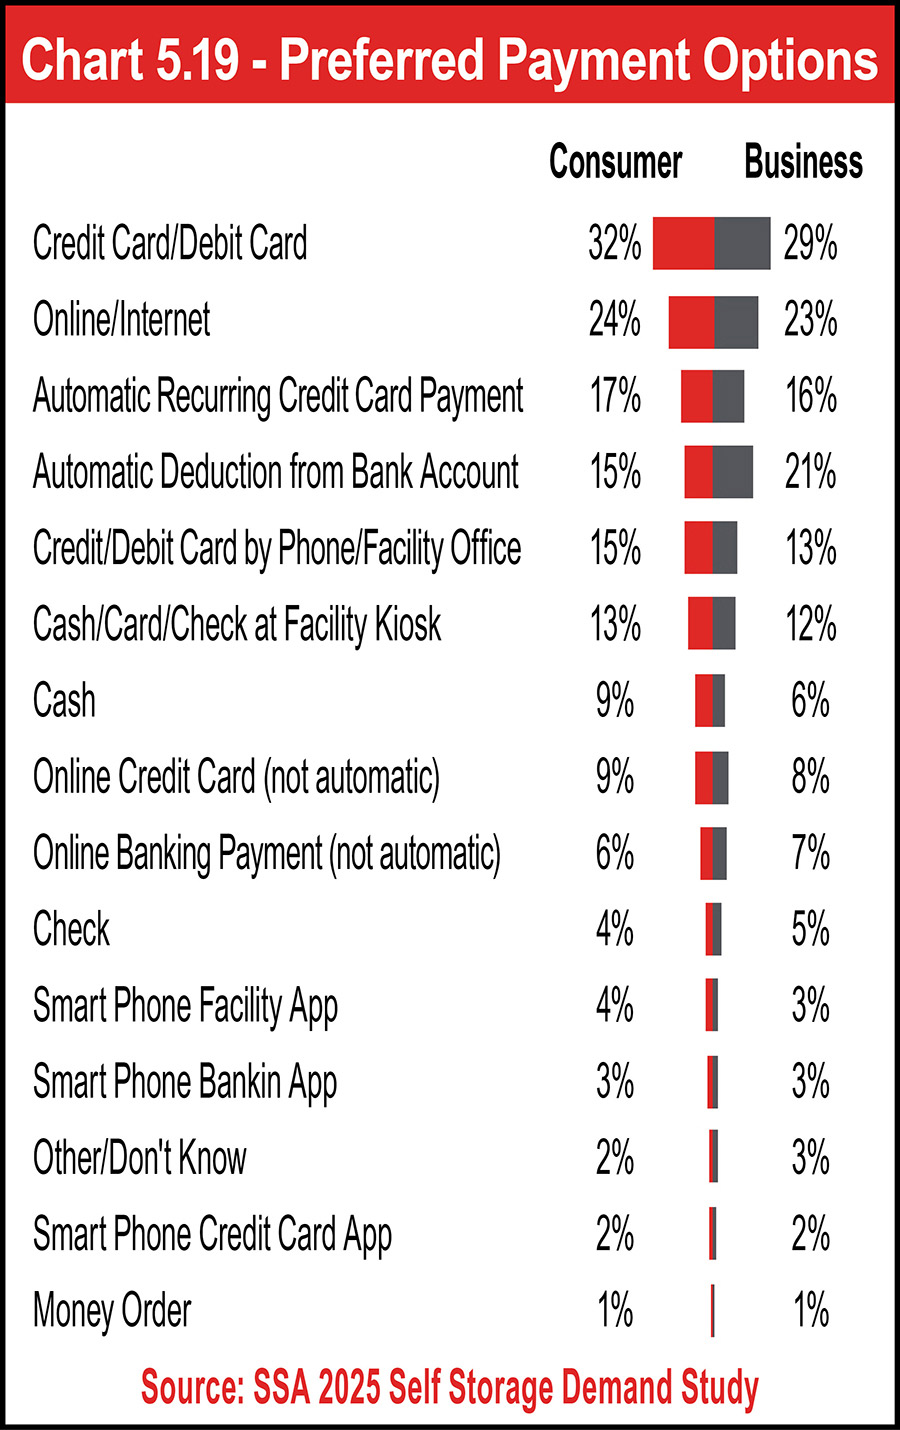
See Chart 5.19.
See Chart 5.20.
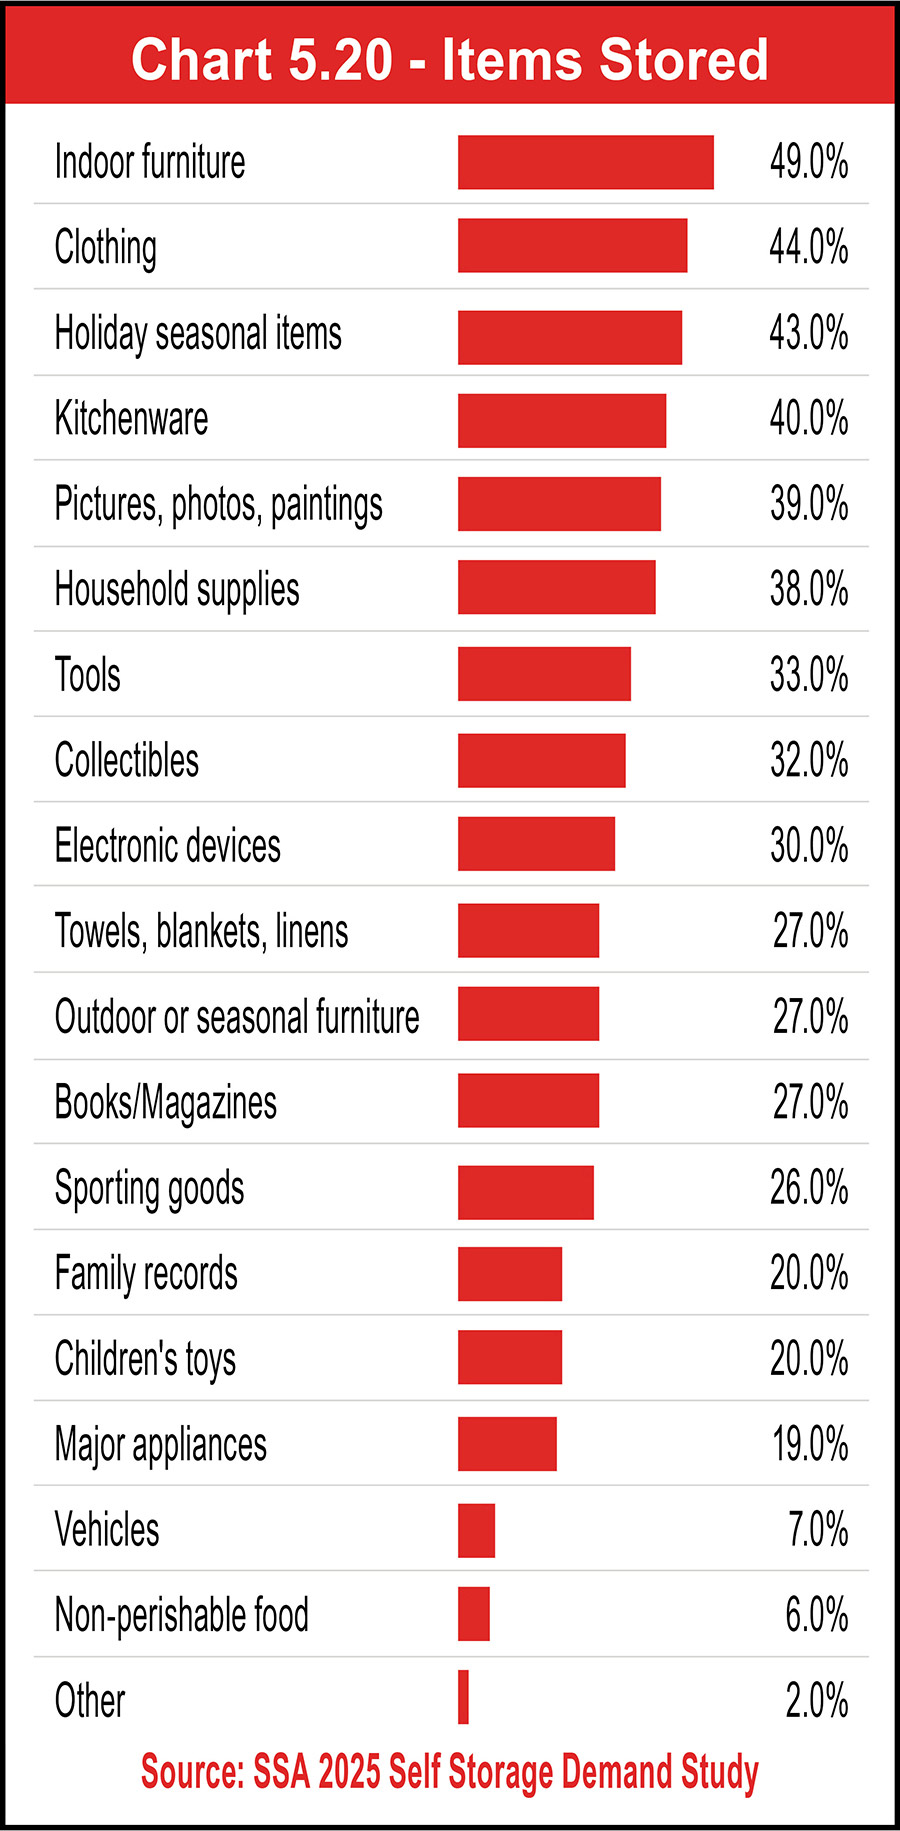
Quite simply, there’s a lot that can be learned from knowing what a customer is storing, and asking helps you know and safeguard your valuable customers from danger and competitors.



for more information

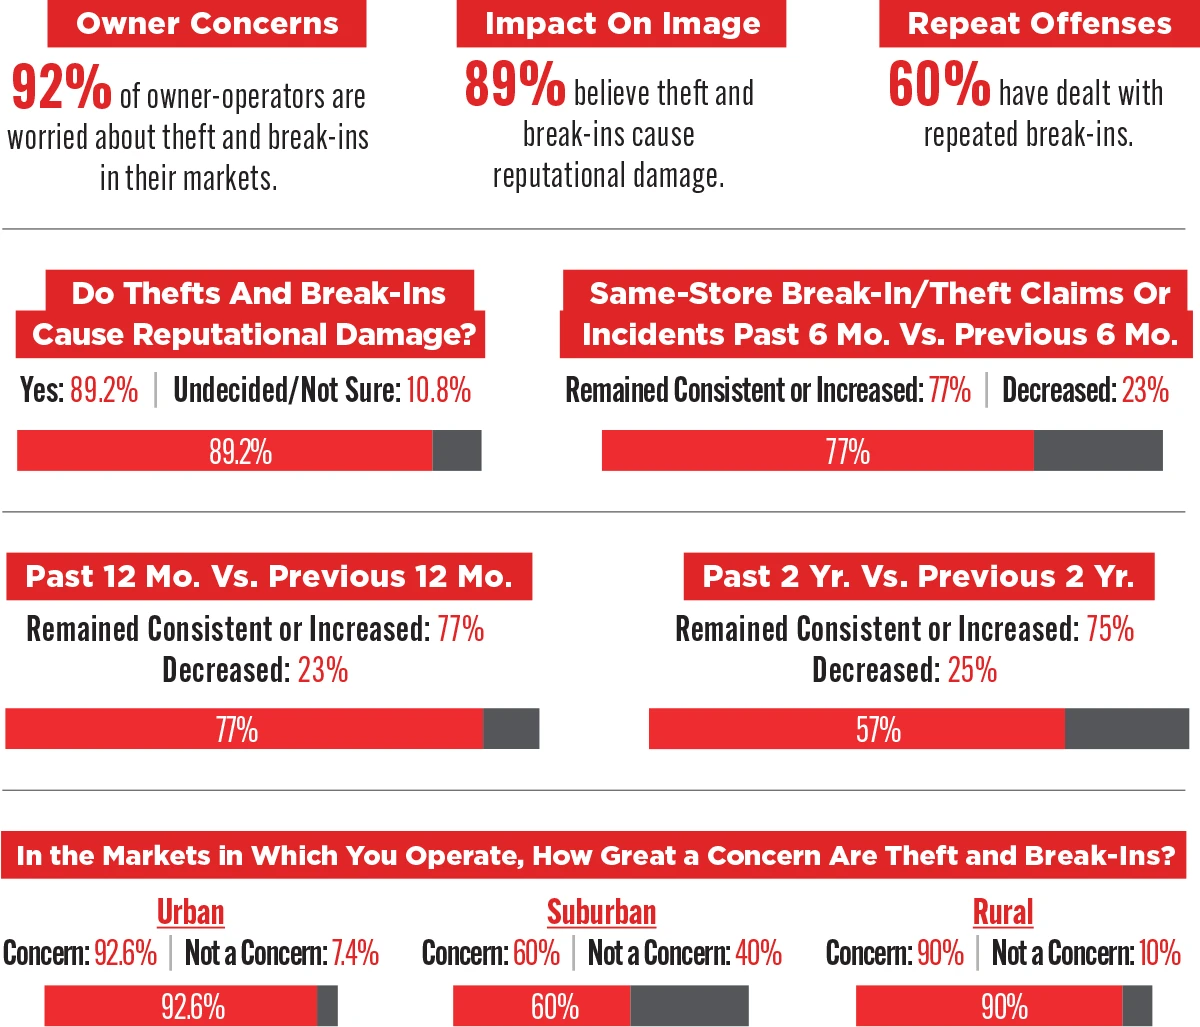
hether it’s the old-school way of criminals cutting through fences and padlocks or savvier schemes that circumvent your gate access, surveillance cameras, and layers of locks, there’s never been a greater need for greater security measures on your properties. That’s because crime is costing self-storage more than people might think in terms of lost revenue and reputational damage. In fact, many experts believe that break-ins have become the biggest threat to the industry right now, not only because of the substantial cost of time and money from claims but also the long-term cost to the industry’s overall reputation. And many self-storage owner-operators are feeling the impact, with 89 percent reporting that they believe crime can cause reputational damage (up 8 percent from last year’s survey) and no respondents dismissing crime as an issue that can hurt the industry’s public image.
But there’s a lot you can do about it, and the latest data shows a move toward doing just that. This section explores the primary security challenges owner-operators are facing today, what makes self-storage facilities so vulnerable to break-ins and other crimes, how and where it’s happening, and which markets are most concerned. Most importantly, you’ll learn which security improvements you should choose when planning new project construction or facility upgrades because of their ability to deter break-ins and protect your reputation.
The short answer: Choose smart technology measures to improve and enhance security. From the latest generation doors and smart locks for unit security to advanced smart entry solutions, you’ll discover how modern systems are reshaping our industry and dramatically helping to mitigate your security concerns. Read on for a highlight of the state of self-storage security in 2025, where technology and security are converging to create smarter, safer, and more efficient storage environments that bring you more business.
The data speaks for itself: Theft, break-ins, and general security challenges in self-storage continue to rise.
One staggering example that was reported by KTVU Fox 2 in San Jose, Calif., detailed how four suspects were arrested trying to break into a self-storage facility after already stealing $400,000 in musical equipment and other property from multiple break-ins at multiple facilities throughout the area.
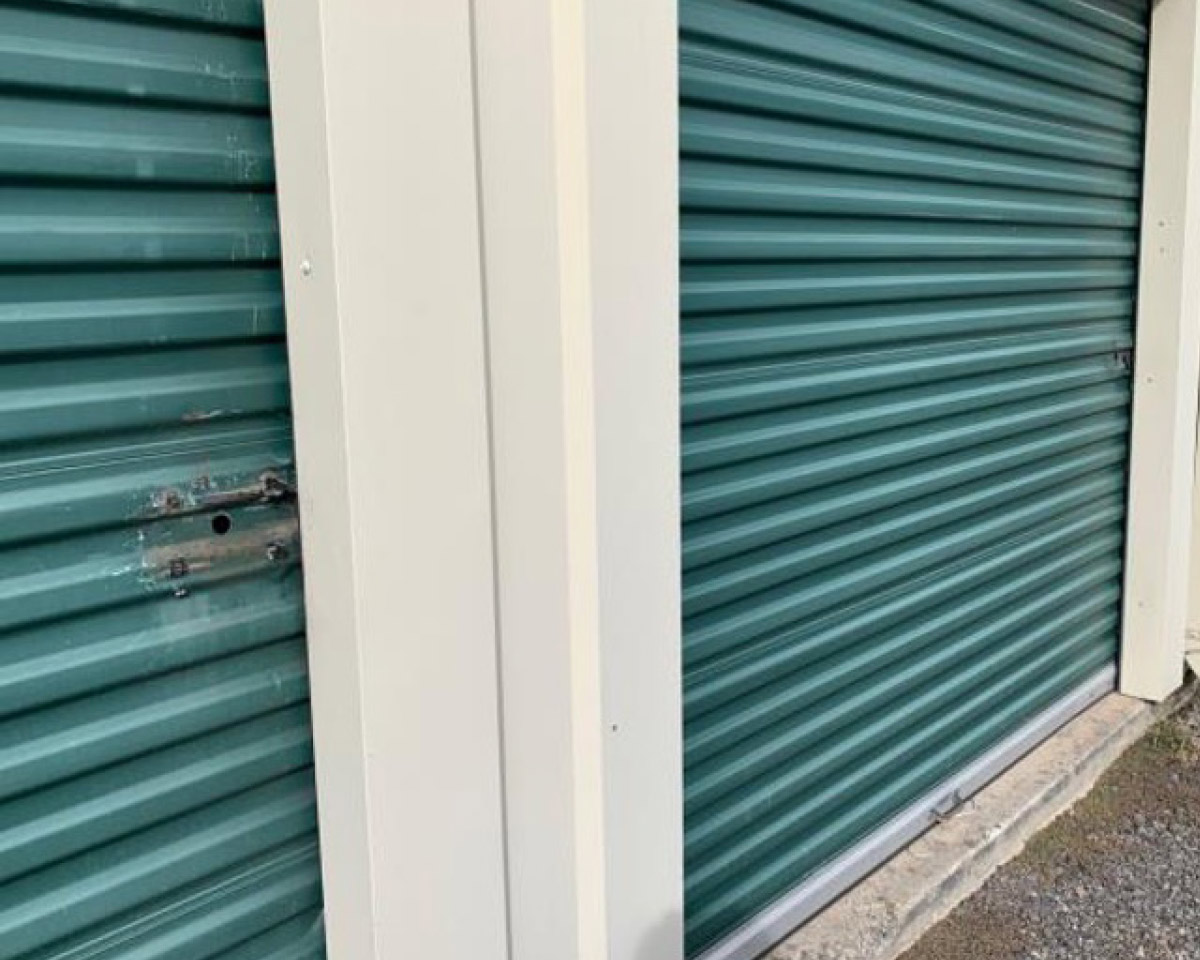
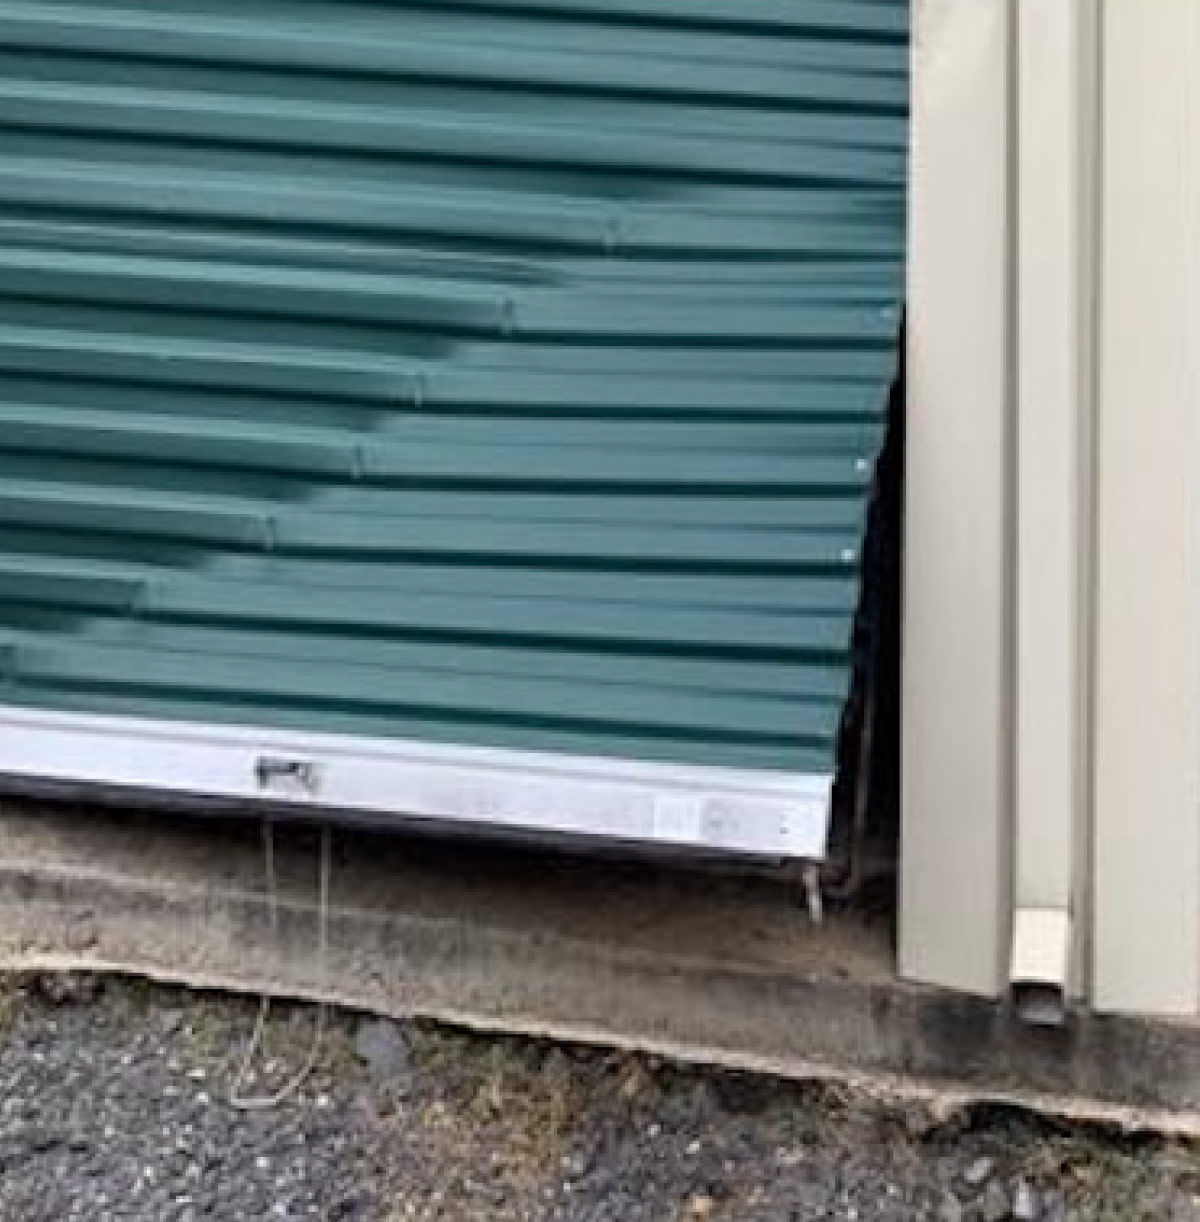
- Cutting latches and padlocks,
- Prying off latches,
- Unscrewing metal paneling on locks, and
- Climbing over unit walls and cutting through wire to access adjacent units.
The second group of criminals is a savvier bunch; they infiltrate internally, usually in the form of current tenants breaking into units that don’t belong to them. Think about it: Tenants know the property well, including when managers are on site, where cameras are located, and where expensive items are stored.
They can use bolt cutters to quickly clean out a unit that is housing cars, motorcycles, or ATVs and then quickly attach a replacement padlock before anyone notices.
With each of these types of break-ins, the traditional security equipment we’ve grown accustomed to in self-storage (padlocks, security cameras, gates, and keypads) is no longer enough to deter the crime.
1. Trouble spots – Some states have higher rates of self-storage theft, with Colorado, Tennessee, Kentucky, Texas, and California ranking at the top.
2. Soft targets – Many self-storage facilities are in industrial areas or on the outskirts of town, which make them easy targets for criminals who want to operate in locations where they won’t be noticed.
3. Windows of opportunity – Many facilities provide 24-hour access to their tenants, which gives criminals more opportunities to case facilities during off hours. One trend that has been reported is criminals renting a unit so they can check out the facility to determine any security lapses on the property. Once they identify a weakness, they hit it hard multiple times, which is why many facilities (nearly 60 percent) report multiple break-ins.
4. Lack of deterrent – In the big scheme of crime, theft is a lower priority for law enforcement, especially in larger urban areas dealing with a shortage of officers. This leads to many criminals not being arrested or sentences being light. When criminals aren’t afraid of prosecution, there’s no deterrent to stop them.
5. Lack of sophistication – The safety and security measures at many self-storage facilities haven’t kept up with the criminals in terms of sophistication; many owner-operators who opted to invest their capital in improvements like landscaping and office remodels have come to realize that it’s time to catch up on security as well.
An integrated smart technology solution—in particular, an integrated technology solution that includes industry leading smart locks on all unit doors—enables self-storage owner operators to mitigate the risk of theft and break-ins while also improving visibility to on-site activity.
So, while crime is more common and frequent in urban areas, it’s happening everywhere, as these survey results across markets indicate.
- 92.6 percent of owner-operators in urban areas are concerned about theft and break-ins (53.7 percent of those are extremely concerned).
- 90 percent in rural markets are concerned (40 percent of those are extremely concerned).
- 60 percent in suburban areas are concerned (15.4 percent of those are extremely concerned).
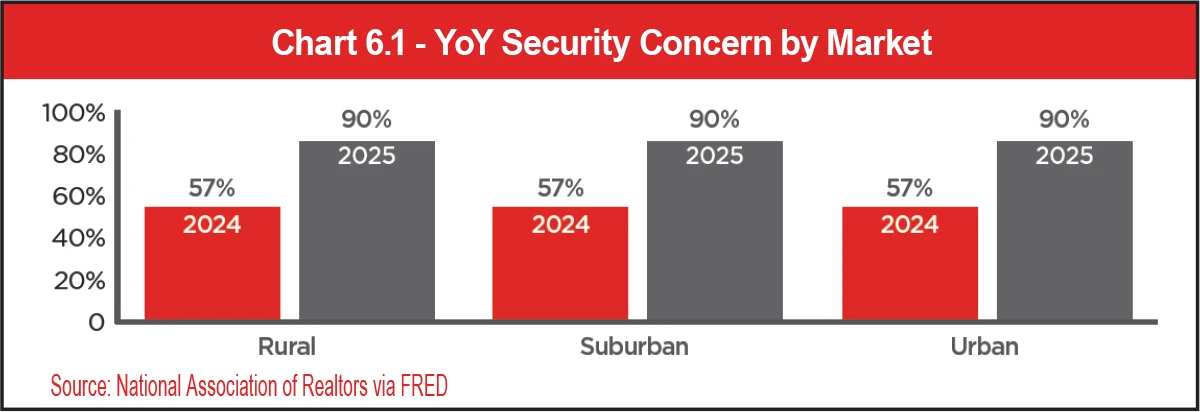
The 2025 security survey data show a dramatic increase in the level of concern about theft and break-ins in urban and rural markets. In rural markets, total concern about theft and security rose by a staggering 35 percent year over year, with extreme concern increasing by 15 percent. Urban markets experienced a similar trend, with total concern raising by 18 percent and extreme concern raising by 10 percent.
See Chart 6.1.

If you look at the findings, every security measure increased in adoption in 2025 compared to 2024. Nearly all facilities in the survey report using surveillance cameras (nearly 99 percent), which is up slightly from 97 percent in 2024. Many utilize digital access control keypads for entry points (80 percent), up 5.6 percent from the previous year. Security alarm use is up 4.3 percent and unit alarms up 3 percent.
However, as criminals become savvier, these methods alone aren’t the deterrents they used to be, especially since 75 percent of facilities report the same or higher levels of break-ins year after year.
The good news is that the largest increase in security measures was in smart locks; considered a gold-standard way to mitigate the risk of theft and break-ins, usage of smart locks was up more than 8 percent, with 25 percent of facilities in the survey now reporting their use. And even smaller increases in unit alarms (up 3 percent) and high-security doors (up 2 percent) demonstrate that operators are getting serious about security.
So, which security improvements on the market should you choose when planning for new project construction or upgrading existing facilities?
- Upgrading current systems – Traditional tools like cameras and keypad systems at points of ingress and egress are not enough of a deterrent to prevent/decrease unit-level break-ins.
- Smart-locking technology – Unit-level smart locks have proven much more effective against unit-level break-ins, but the benefits are clear for those facilities that have rolled out smart locks on unit doors, with many reporting that the locks are proving to eliminate break-ins altogether.
- Better physical barriers at the unit level – Higher security roll-up doors are now available that are designed to combat the most frequent types of break-in attempts, but so far roughly 10 percent report installing these higher security unit doors with clips and reinforced bottom bars.
With integrated smart-locking technology, your tenants can rent a unit online or from their mobile phone and access the facility and their unit using their mobile device. They can even leverage this integrated mobile technology to monitor their unit and grant and revoke digital access to family members, employees, or movers. And that same technology gives owner-operators real-time visibility into unit status and suspicious activity.
Industry-leading smart locks also have security-grade motion sensing capabilities built in to further deter theft and break-in attempts and provide meaningful, real-time alerts when there is a motion event occurring inside a unit.
While some businesses shy away from purchasing new technology because of the cost, in this case the cost of doing nothing to fortify your facility is too high to ignore, especially because the return on investment of smart technology is so strong in deterring crime and reinforcing public confidence in your business and self-storage overall. More security not only brings more safety, but it brings you more business, too.
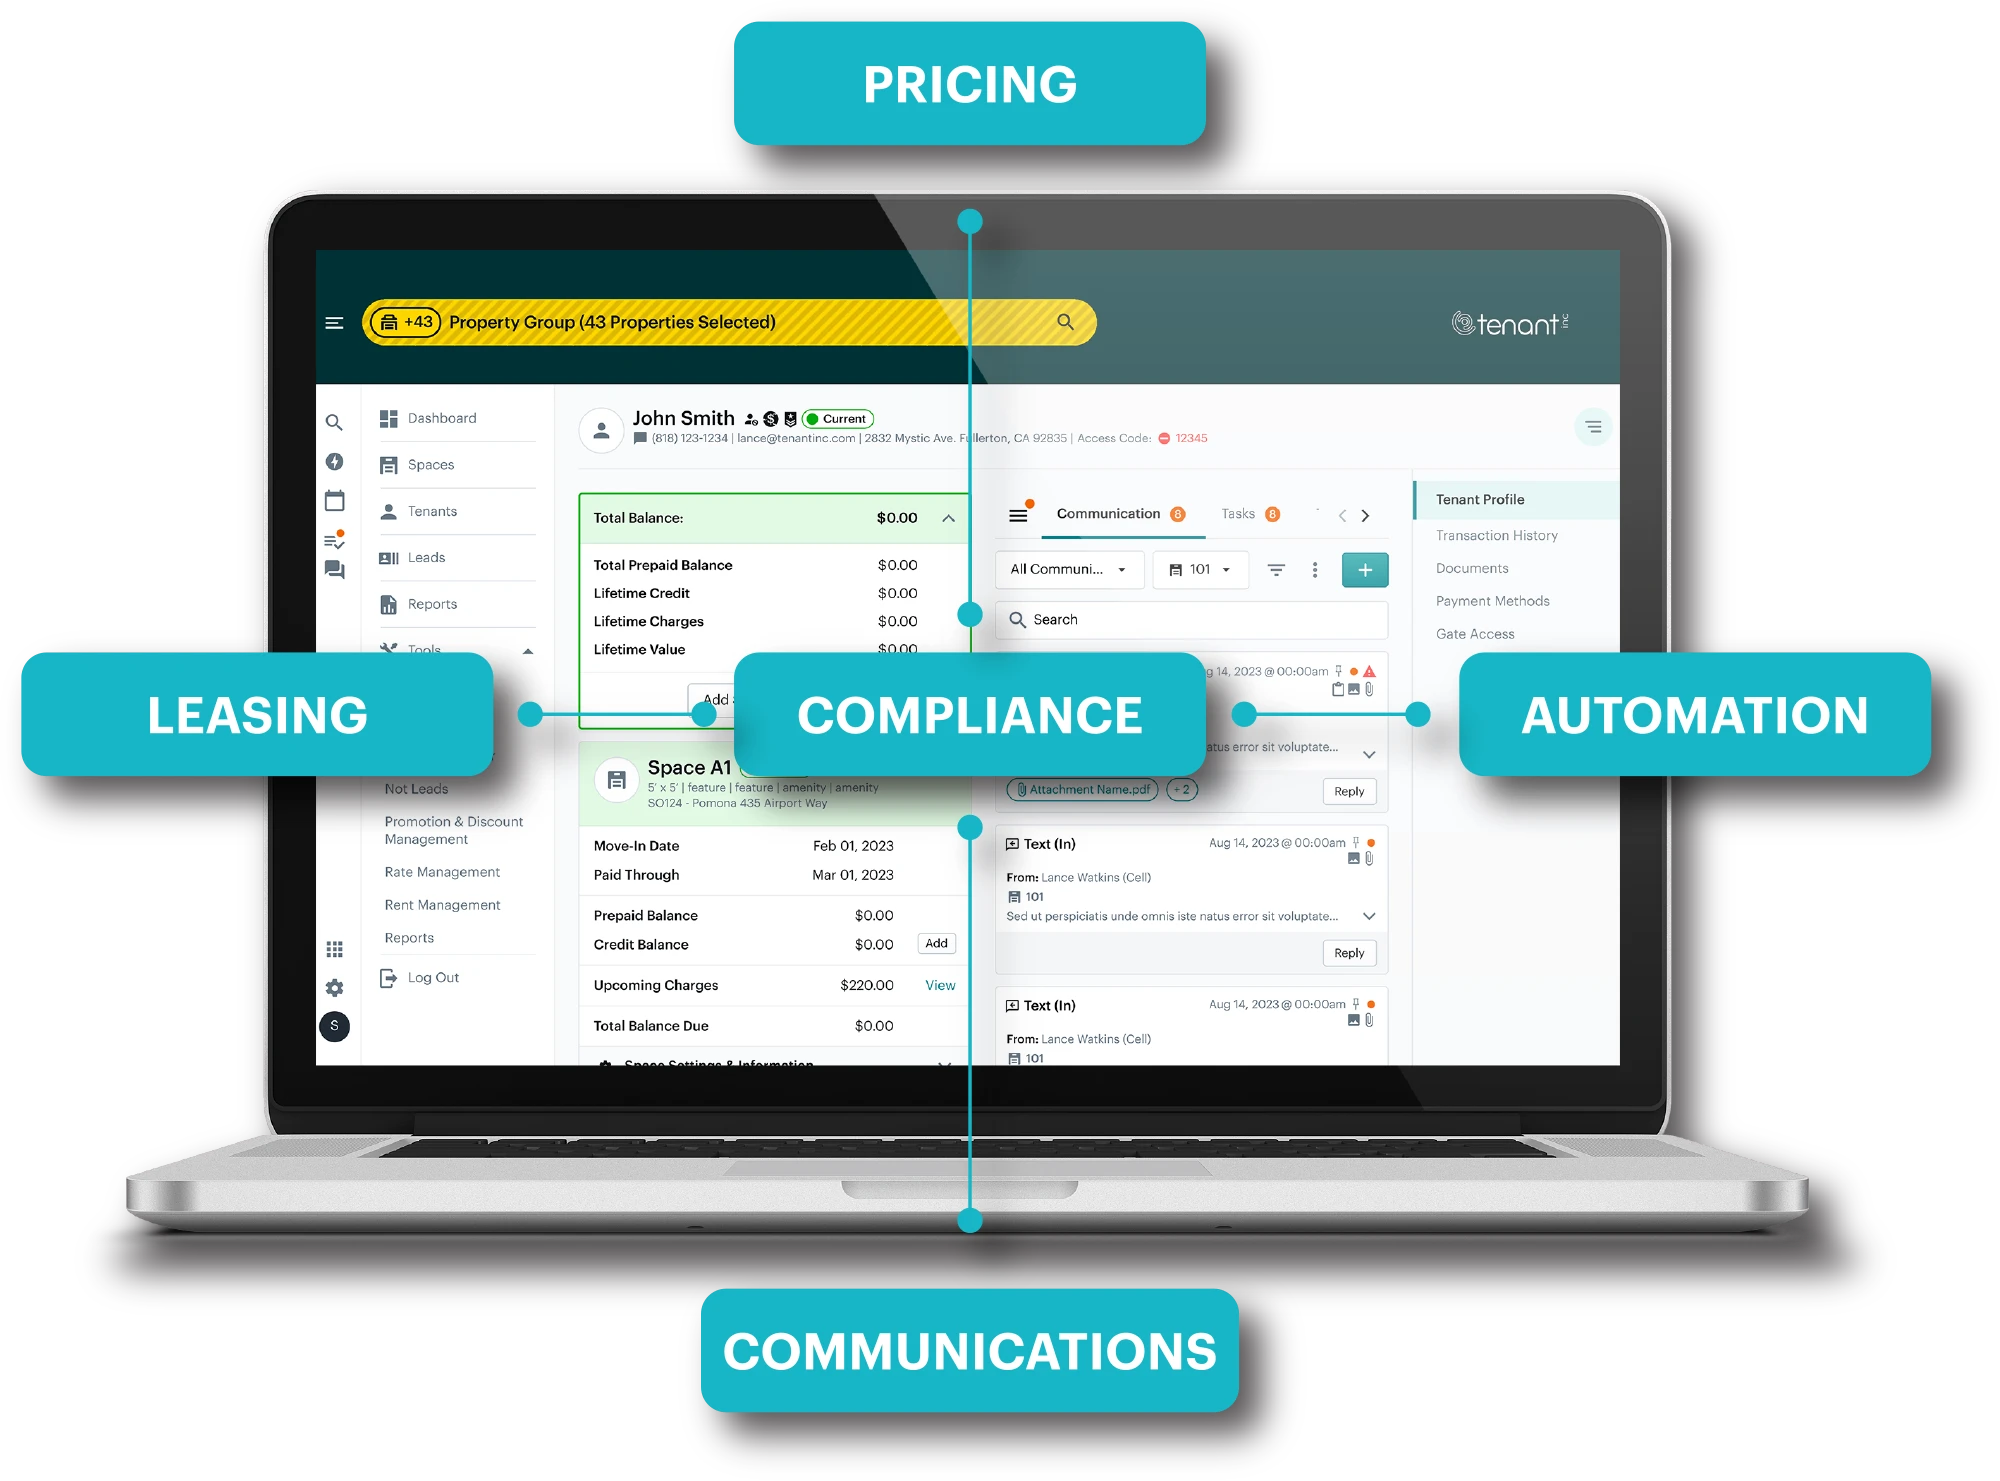
This shift toward smarter storage solutions is more than a trend, it’s a strategic response to changing demands and labor demands. Customers now expect seamless, contactless experiences, and operators are leveraging tools like smart locks, IoT sensors, and integrated management platforms to deliver just that. These technologies enable real-time data insights, predictive maintenance, and personalized services, creating a modern storage environment that is safer, more efficient, and more profitable. In addition to enhancing customer experience, operators can run more efficiently. Insights driven by IoT smart devices, along with the automation opportunities present with these devices, have helped many operators embrace virtual, hybrid, or hub-and-spoke management models.
The benefits extend far beyond convenience. Integrated technology empowers operators to adopt new management models, such as virtual, hybrid, or hub-and-spoke operations. This reduces labor costs while maintaining high service standards. IoT enabled devices provide actionable insights for predictive maintenance, helping prevent costly downtime and enhancing asset longevity. Automation tools streamline repetitive processes like lease execution and access permissions, freeing staff to focus on customer engagement and revenue generating activities. Ultimately, smart integration transforms the operator’s role from reactive to proactive, creating a competitive edge in an increasingly digital marketplace.

Asking a few practical questions is a simple way to assess how integrated your technology truly is. Can a customer complete the entire move-in process online (selecting a unit, signing a lease, setting up payment, and receiving access credentials) without a staff member needing to make a phone call or send a follow-up email? Can that same customer gain access to their unit without someone physically removing a lock from the door? If the answer to both is yes, you’ve addressed only half of the equation.
The other half lies in visibility and control. Integrated smart technology should give operators a real-time, remote view of what is happening across the property, down to the individual unit level. Can you see whether a tenant has shared access with another user, such as a family member or employee? Do you know how frequently a unit is being accessed, how long the door remains open, or whether it was left unsecured? Can you distinguish between residential and business customers based on access behavior? Are you alerted if someone other than the primary tenant opens a unit, or if motion or unexpected activity occurs inside? Just as important: Are delinquency workflows, such as access suspension, overlocking, and auction readiness, automated and consistently enforced without manual intervention?
When these capabilities are integrated into a single platform, smart technology moves beyond convenience and becomes a source of intelligence. Self-storage owner-operators gain access to insights that were previously unavailable or required significant manual effort to uncover. Access and usage data can reveal how tenants actually interact with their units, highlight potential security risks, and support more informed operational decisions.
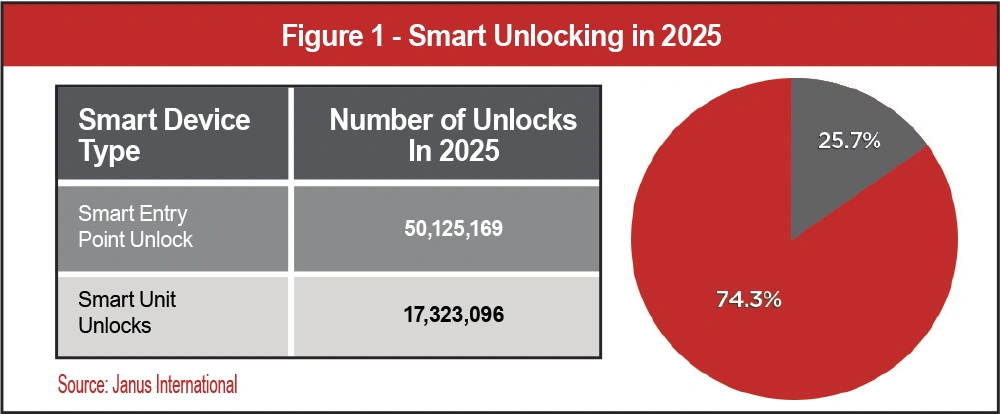
As illustrated by the data, nearly 26 percent of all access that takes places at a typical storage facility is unit-level access. This data is only available when smart technology is deployed at the site. Without unit-level smart technology, owner-operators are missing roughly half of the access attempts that occur on their sites.
In self-storage, smart locks operate on similar principles, but the operational and financial impact is often far greater. Traditional, manual access management is labor-intensive and repetitive. Staff time is consumed by routine lock checks, overlocking delinquent units, removing overlocks, cutting abandoned locks, managing lost or broken keys, and physically preparing units for new rentals. Each of these tasks carries a cost—not only in labor hours but also in delayed rentals, increased risk of error, and inconsistent tenant experiences.
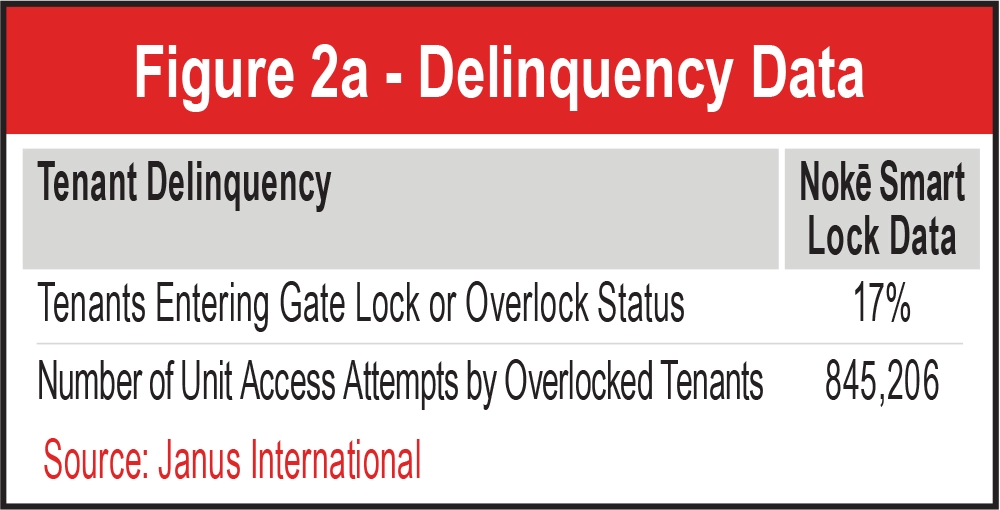
The data supports that smart technology provides more time for self-storage owner-operators to allocate hours to non-manual processes when they leverage smart technology.
See Figure 2a.
Year over year, the percentage of tenants entering some form of past-due status (gate lock, overlock, auction) rose from 10 percent in 2024 to 17 percent in 2025. The 7 percent increase in tenant delinquency is notable. On average, self-storage managers spend 6 hours per week doing lock checks, adding and removing overlocks, and prepping units for auction. With the uptick in the percentage of units entering delinquent status, facilities with industry leading smart locks were able to save 300-plus hours annually on these manual tasks.
With an increasing number of both security concerns and tenants entering delinquency at some point during their lifetime, smart locks are becoming a more important security staple than ever in self-storage.
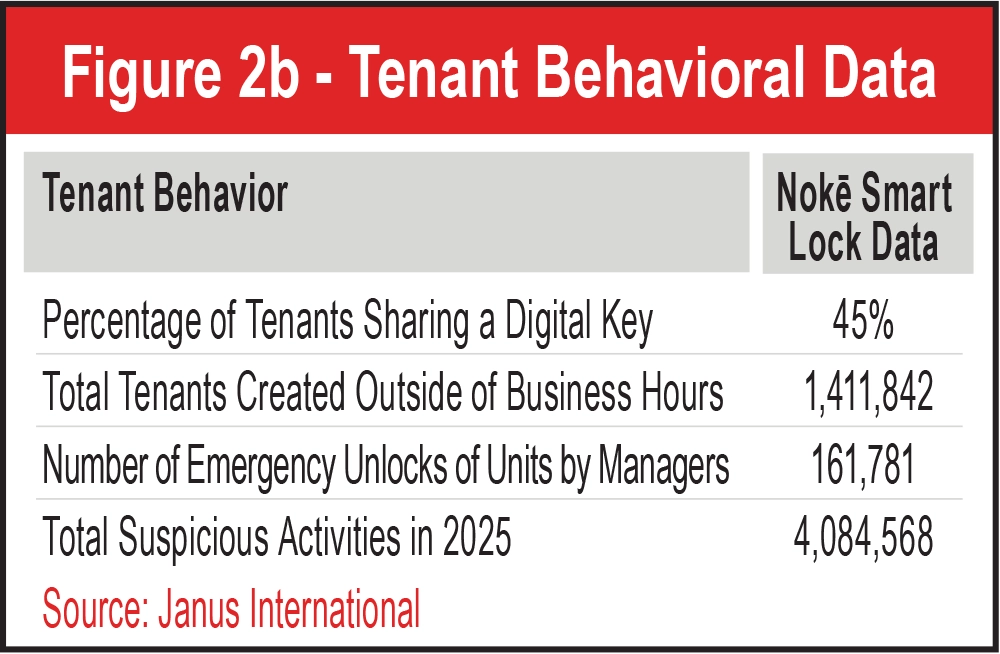
Over time, access data can also reveal behavioral patterns that help operators better understand how tenants use their space, identify underutilized units, and optimize operational workflows. In an increasingly competitive market, smart locks are no longer just a convenience feature—they are a strategic tool that enables smarter operations, stronger security, and data-driven decision-making across the facility.
See Figure 2b.
Perhaps most notably, 45 percent of renters share a digital key when given the opportunity to do so with app-based smart locking systems like Nokē. That’s notable for owner-operators because it means that almost half of the people entering their facilities may not be the actual tenant. Advanced smart locking systems enable storage owners to understand exactly who is on the property, which provides additional marketing opportunities and helps keep the property more secure as a more accurate and robust audit trail is available when key share users are identified by their name and mobile phone number.
In self-storage, mobile apps are redefining the tenant experience by placing the facility directly in the customer’s pocket. When a tenant rents a unit online, a mobile app can provide immediate access to the property and, where deployed, direct control of their smart lock—without waiting for office hours or staff assistance. This eliminates friction at move-in and creates a seamless transition from online rental to physical access.
Modern self-storage mobile apps extend well beyond access alone. Many platforms integrate payment portals that allow tenants to enroll in autopay, update payment methods, and resolve delinquent balances directly from their phone. Some apps also enable tenants to transfer to a different unit, rent an additional unit, or manage shared access for family members or employees. These capabilities reduce administrative workload for staff while giving tenants greater autonomy and flexibility.
Just as importantly, mobile apps strengthen customer loyalty. Being present on a tenant’s smartphone increases brand visibility and engagement. In other industries, consumers are far more likely to book with a hotel or airline when they already have that company’s app installed. The same principle applies in self-storage: Once a tenant relies on an app to manage access, payments, and communication, switching to a competitor becomes less appealing.
As shown in Figures 2a and 2b, self-storage tenants are rapidly adopting mobile technology. The ease of use helps explain the significant growth seen across the industry. Over the past year, the number of tenants using the Nokē system increased significantly, reflecting accelerating demand for mobile-controlled access and security solutions. In total, self-storage tenants used smart technology to access connected devices nearly 44 million times in 2025, underscoring how central mobile apps have become to the modern self-storage experience.
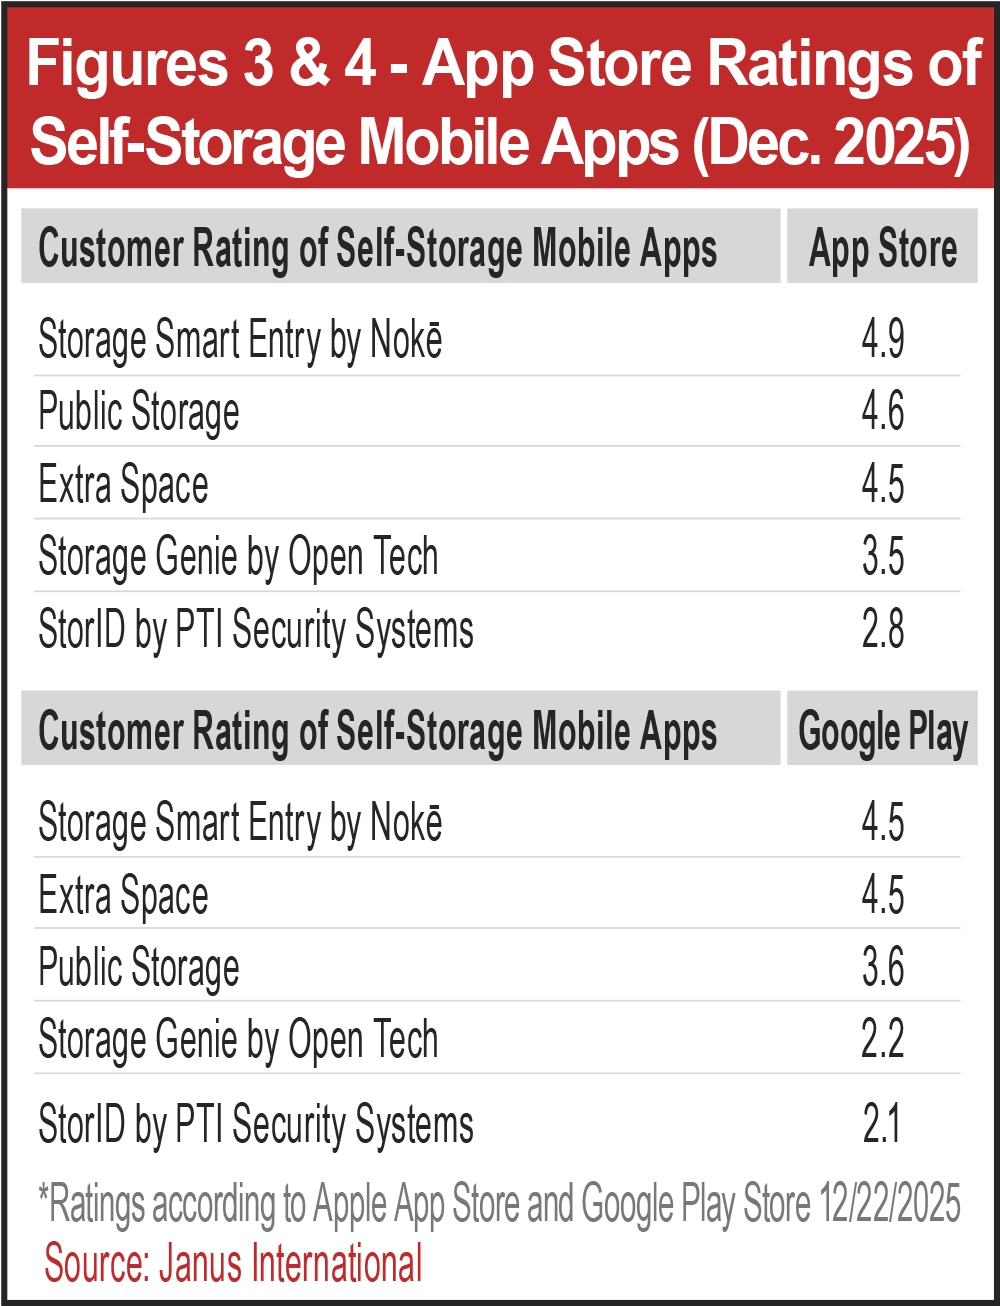
The data in Figures 3 and 4 certainly suggests that self-storage tenants are not only willing to use apps, but that they prefer using apps that are simple and intuitive when presented with the option.
See Figures 3 and 4.

Historically, access reporting in self-storage has been largely limited to gate logs. Traditional access control systems track which code was used and when, allowing operators to reconstruct basic activity patterns at the facility perimeter. While useful, this data provides only a partial picture. As more smart devices are deployed throughout modern facilities, reporting capabilities have expanded well beyond the gate, giving operators deeper, more actionable insight into on-property activity.
Today’s network-connected smart locks can generate unit-level intelligence that was previously unavailable. Operators can see not only when a tenant enters the facility but also how often a specific unit door is opened, how long it remains open, and whether access was granted by the primary tenant or a shared user. This level of granularity enables operators to quickly identify anomalies and potential security concerns. For example, did a tenant enter the facility but never open their unit? Did a unit remain locked while the tenant stayed on site for an extended period? These patterns can signal suspicious behavior and allow staff to intervene proactively rather than reactively.
The shift to electronic smart locks has also fundamentally transformed the customer experience, mirroring the evolution seen in the hospitality industry. Just as hotels replaced physical keys with mobile credentials to deliver a frictionless guest experience, mobile app-controlled smart locks have redefined how tenants interact with self-storage facilities. Digital access eliminates the need for physical keys and shared gate codes, enabling a seamless, app-based “check-in” process that aligns with modern consumer expectations. The result is higher tenant satisfaction alongside measurable gains in staff efficiency.
In an environment where customers increasingly value security, flexibility, and convenience, electronic smart locks offer clear advantages. Tenants can access their units on demand using their smartphones, making it easier to retrieve or store belongings outside traditional office hours. This 24/7 accessibility is particularly valuable for business customers, shift workers, and anyone managing unpredictable schedules.
From an operator’s perspective, smart locks with mobile app control provide centralized management and real-time visibility across the facility. Staff can remotely grant or revoke access, monitor entry and exit activity, and receive alerts when unusual behavior occurs. Leading smart lock platforms also integrate thermal motion sensing capabilities, which can help deter break-ins and identify prohibited behaviors such as tenants occupying units. Beyond security, these insights support preventative maintenance and unlock new revenue opportunities driven by customer behavior analysis.
As illustrated in Figure 2a, 45 percent of smart entry system users shared a digital key with at least one other person over the past year. When combined with unit size, access frequency, and usage history, this data helps operators identify commercial or high-usage tenants who may warrant differentiated pricing strategies. This data-driven approach replaces assumptions with evidence, enabling more precise and defensible revenue decisions.
Ultimately, the implications are clear. Smart technology is no longer a luxury or optional enhancement—it has become an essential component of a successful self-storage operation. The data shows that it materially improves security, enhances the customer experience, and strengthens the bottom line. As adoption continues to accelerate, smart technology will remain a defining factor in how facilities operate today and how they compete in the future.

Actual Intelligence is the how.




- Faster Install
- Less Maintenance
- EnhancedComponents
- 32 Colors Industry-Matched Hues
- 40-Yr Warranty on Paint System

centralstatesco.com
ccupancy data is arguably the hardest data to uncover when looking at any market. Unlike rental rates, there aren’t web scraping tools that gather occupancy data because the data is not publicly available on websites. One way to gather occupancy data in a market is by calling self-storage facilities in the area and asking for the data directly. Some owners and operators are willing to share this data as they realize the best way to improve total market efficiency is transparency, while others keep it confidential out of fear of losing a competitive edge.
Another way to get occupancy data is through publicly available sources. There are several publicly traded self-storage companies that publish quarterly and annual data on occupancy. Unless otherwise noted, the data in this section comes from two sources:
- Publicly traded self-storage companies (REIT same-store portfolios) and
- Storable, a leading management software company tailored to the self-storage industry. Storable has generously provided data for 25,000-plus same-store facilities.
Each company defines “same store” differently, but in general “same store” can be viewed synonymously with stabilized from a rental rate or occupancy perspective. Stabilized means that these stores have reached a steady state for occupancy and are no longer leasing up.
It is important to disclose that REIT occupancy in this section is not a representation of the entire self-storage industry. The REIT data presented is a small sample size compared to the rest of the industry. The number of facilities that make up the same-store pool for the four publicly traded REITs and U-Haul presented in this section does not exceed 7,000 facilities. That is less than 11 percent of the total number of facilities in the country. These facilities are also most likely the highest performers out of the entire industry, in the best condition, and located in the best markets. Storable’s same-store pool of 25,000-plus facilities (approximately 35 percent of the market) is likely a better representation of stabilized occupancy for the self-storage industry nationwide.
So, as you read this section, keep in mind that the data is showing occupancy for a small number of facilities on a stabilized basis; therefore, this data may not apply to your market or facility. Just because Extra Space is achieving 93 percent occupancy for a Class-A facility in downtown San Francisco doesn’t mean a self-storage professional should assume the same occupancy can be achieved for a Class-B self-storage facility located an hour away from San Francisco.
That being said, the data in this section is helpful in uncovering broad trends across the nation, across states, and across MSAs over time.
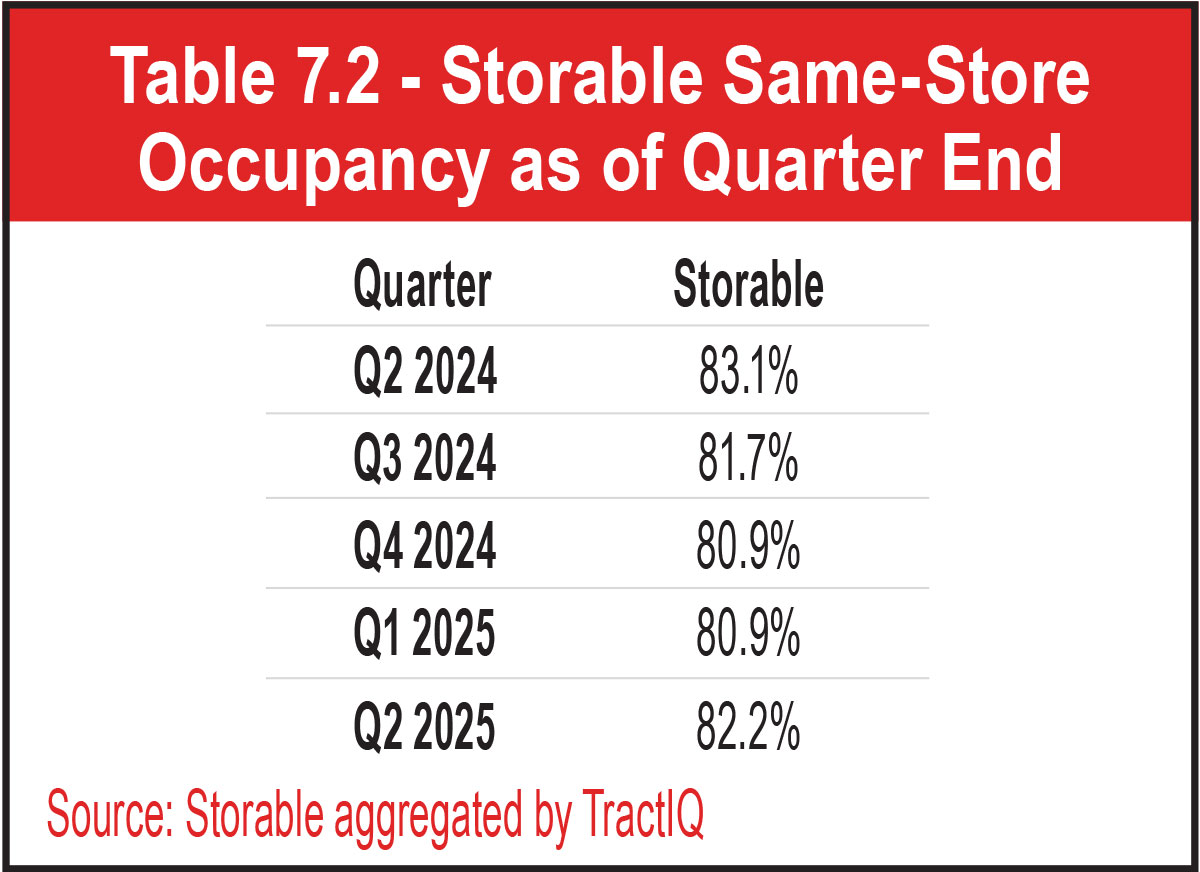
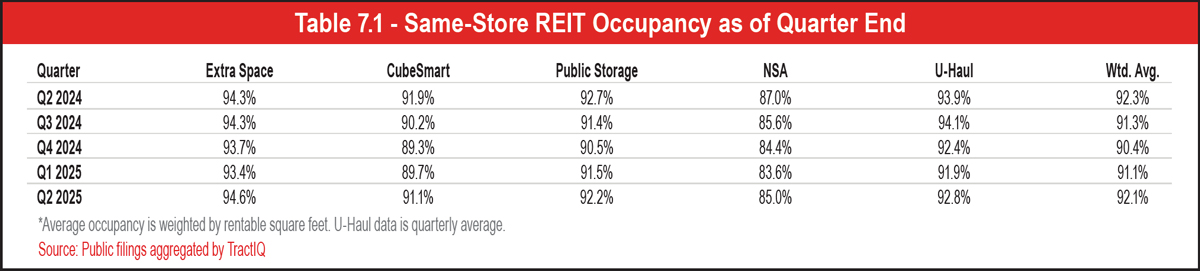
See Table 7.1, Table 7.2, Chart 7.1, and Chart 7.2.
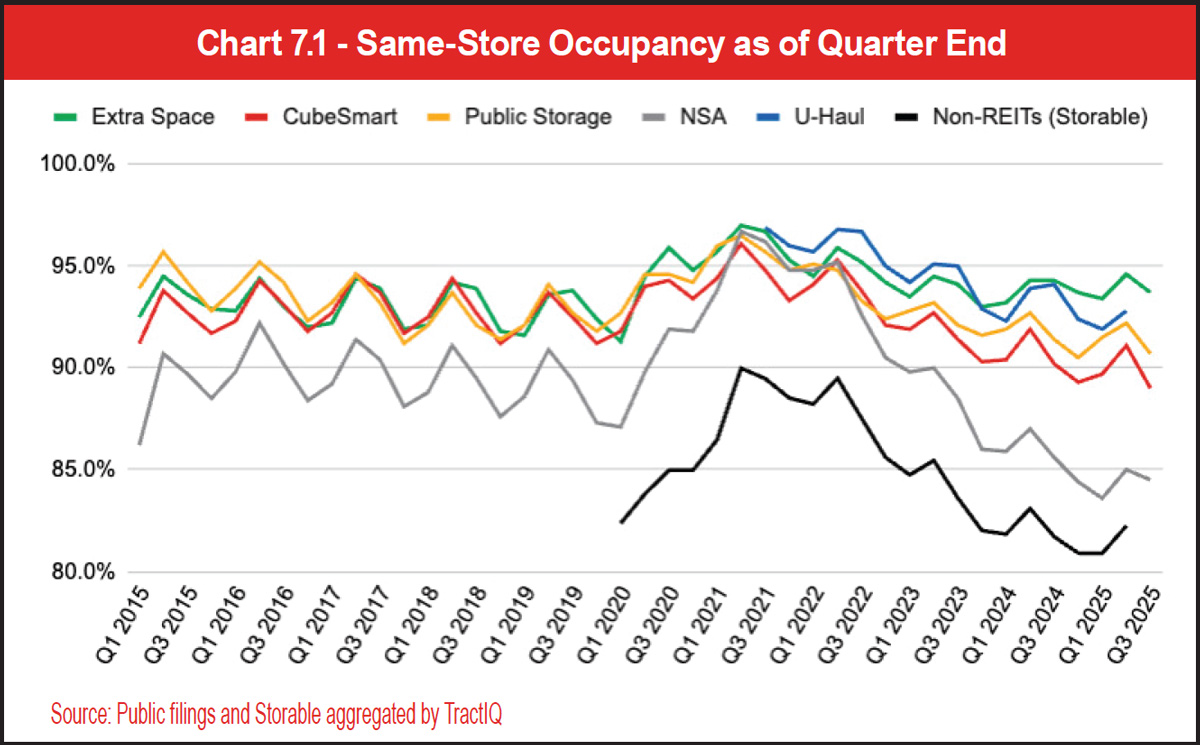
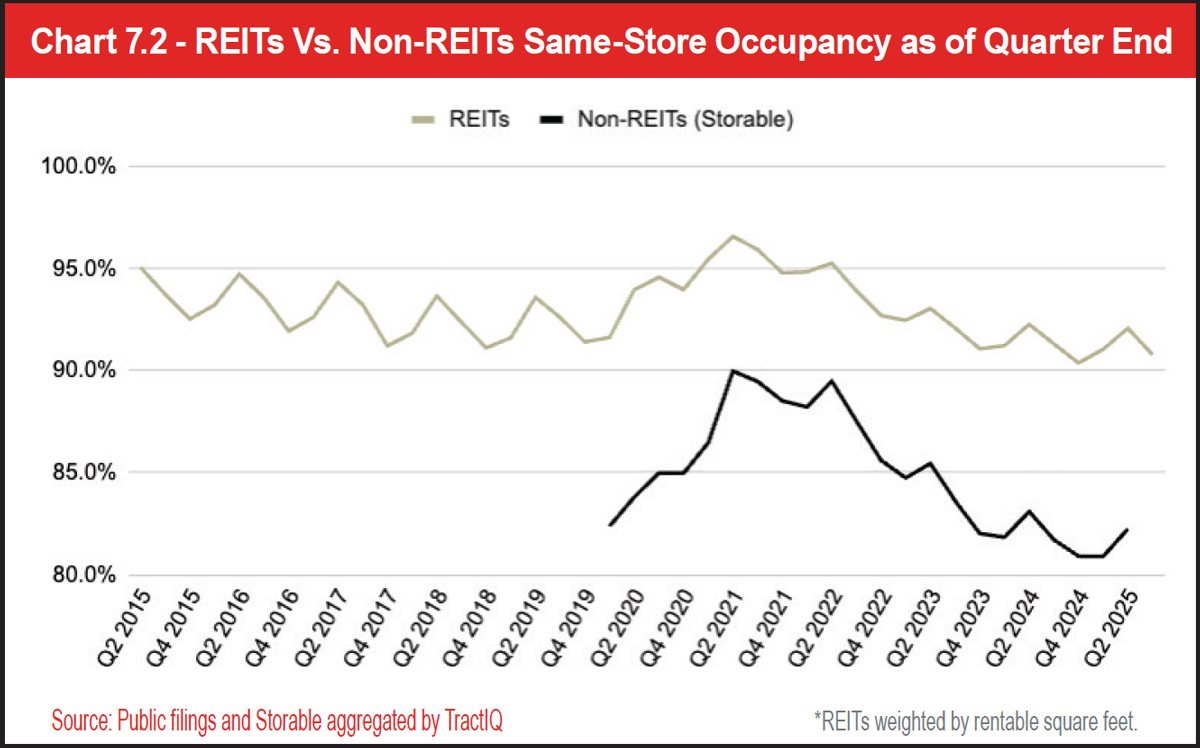
You will also notice distinct peaks and valleys in the charts showing increased occupancy in the summer months and decreased occupancy in the winter months. This highlights the seasonal nature of the self-storage business. Residential migration is typically higher in warmer months, increasing the need for self-storage. The occupancy data highlights this trend, but years 2020 to 2025 look less uniform than the years 2015 to 2019. A pandemic resulting in higher-than-normal residential mobility created increased demand for self-storage, as can be seen in the occupancy data from 2020 to 2021. Subsequently, the industry experienced inflation, higher interest rates, and general uncertainty from 2022 to 2025, which has brought occupancy back down to more normal levels. Although self-storage sees demand from customers in all stages of life, good or bad, self-storage is not immune to the volatility we’ve seen in recent history, as evidenced by the occupancy data.
See Charts 7.3, 7.4, 7.5, 7.6, 7.7, 7.8, and 7.9.
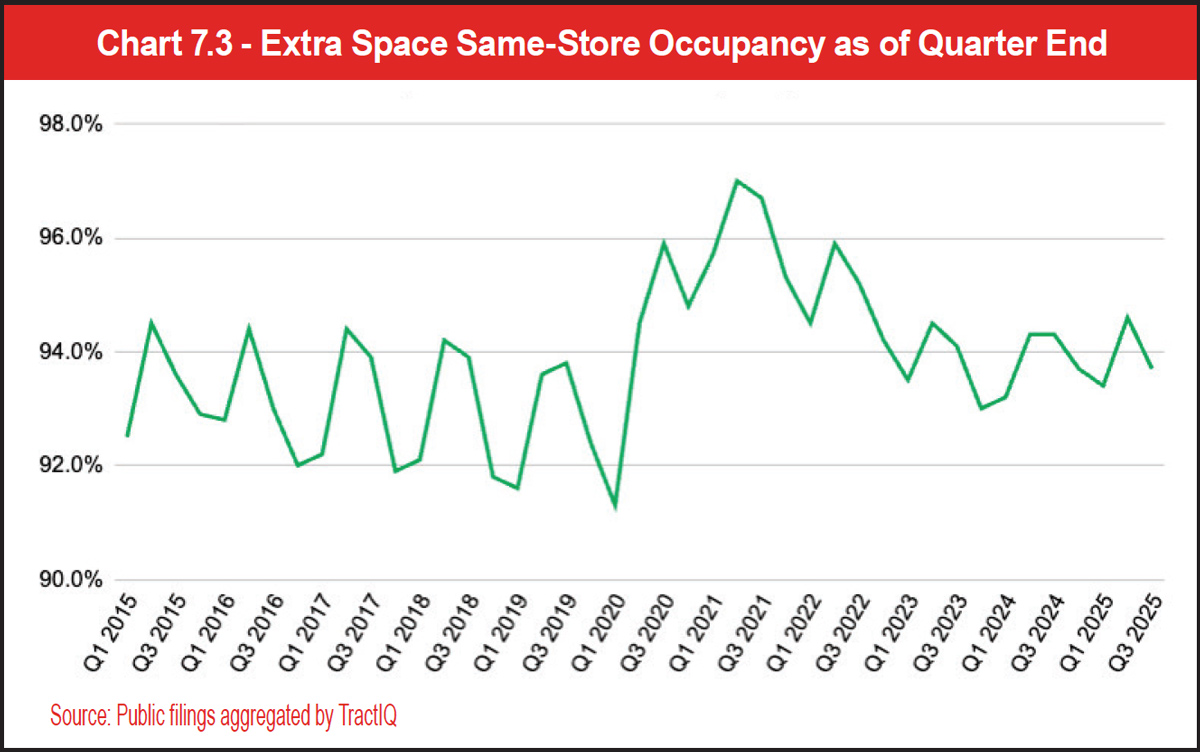
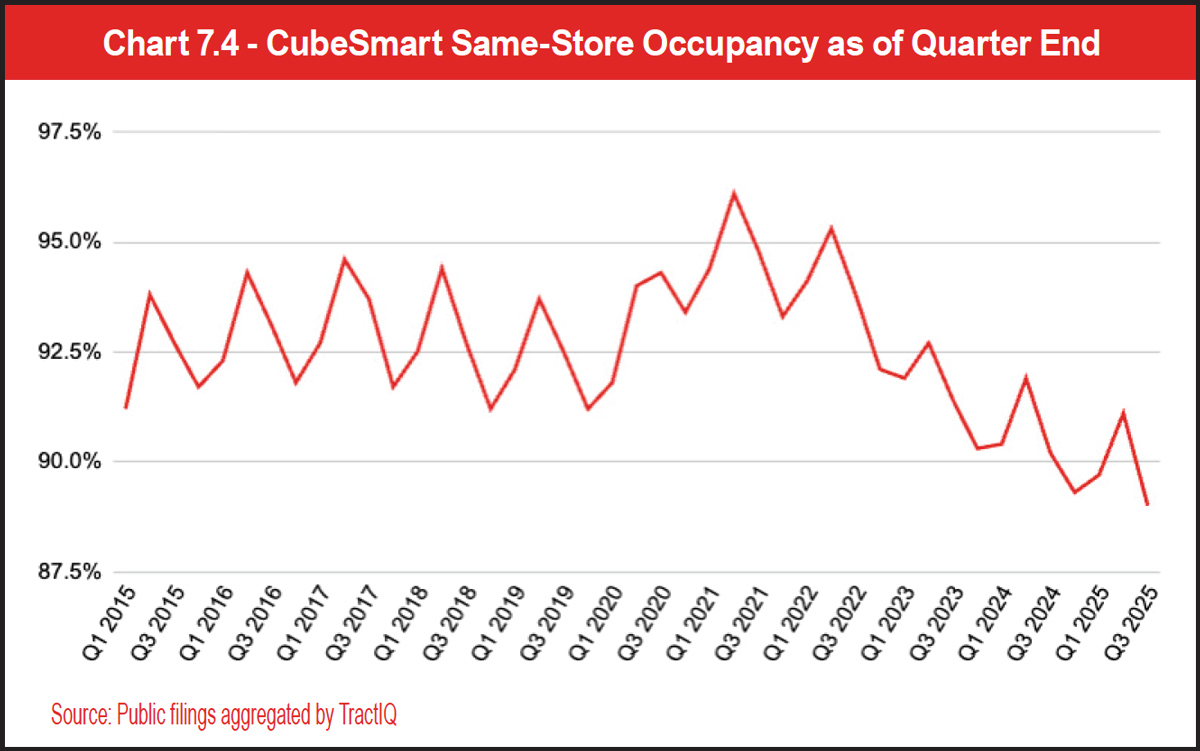
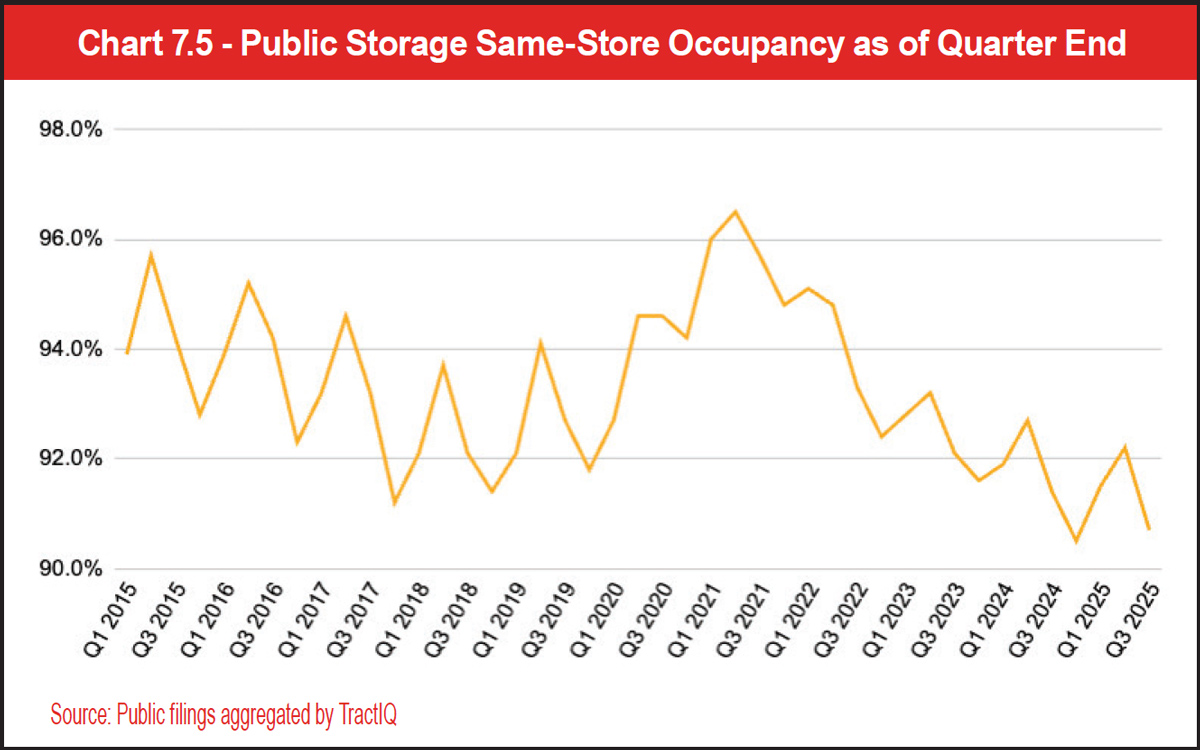
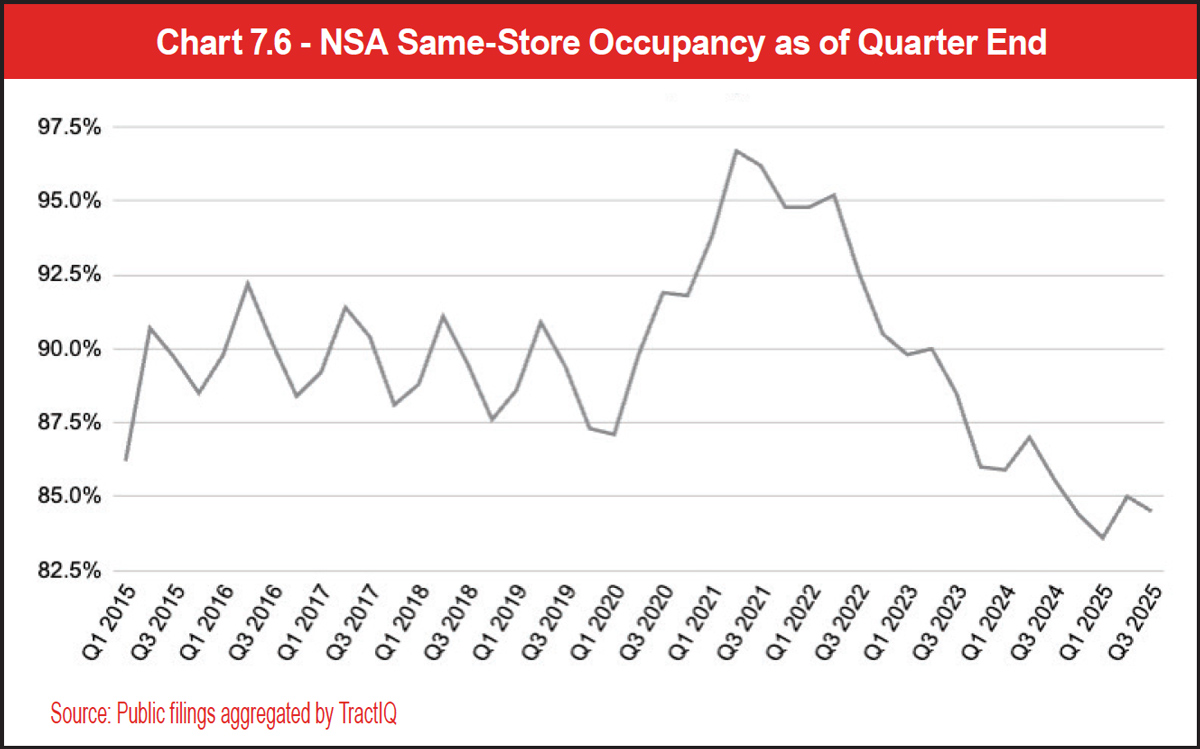
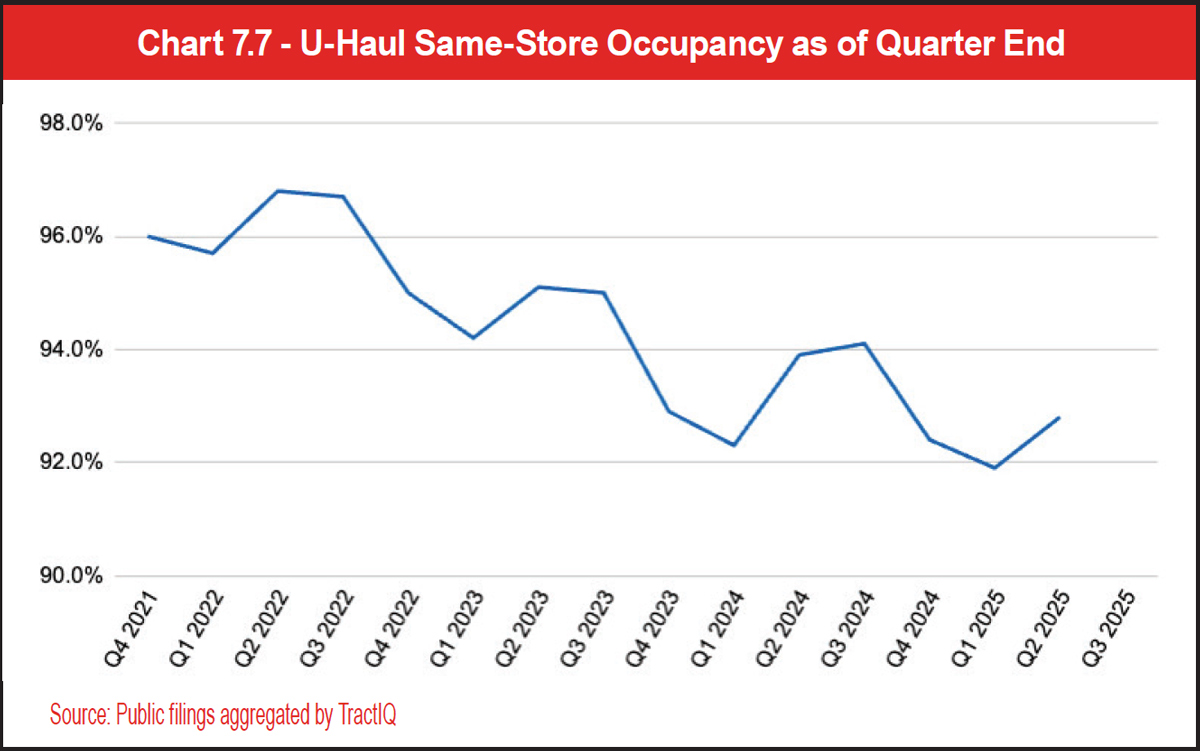
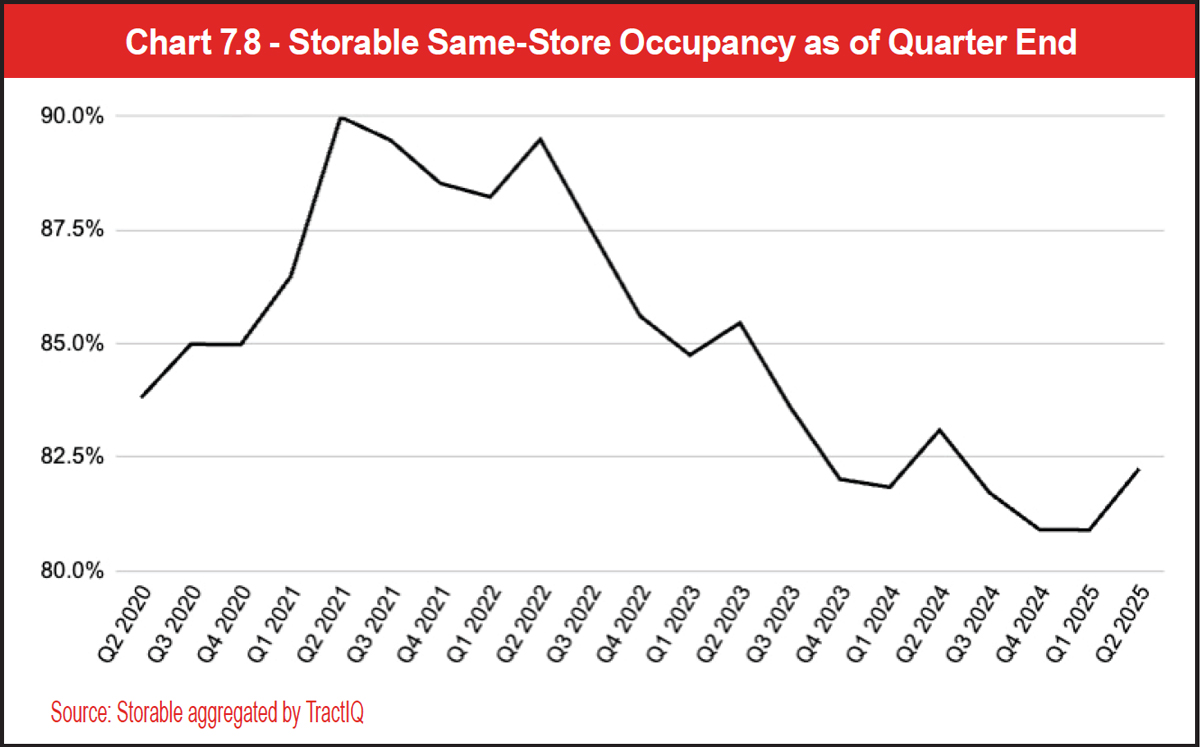
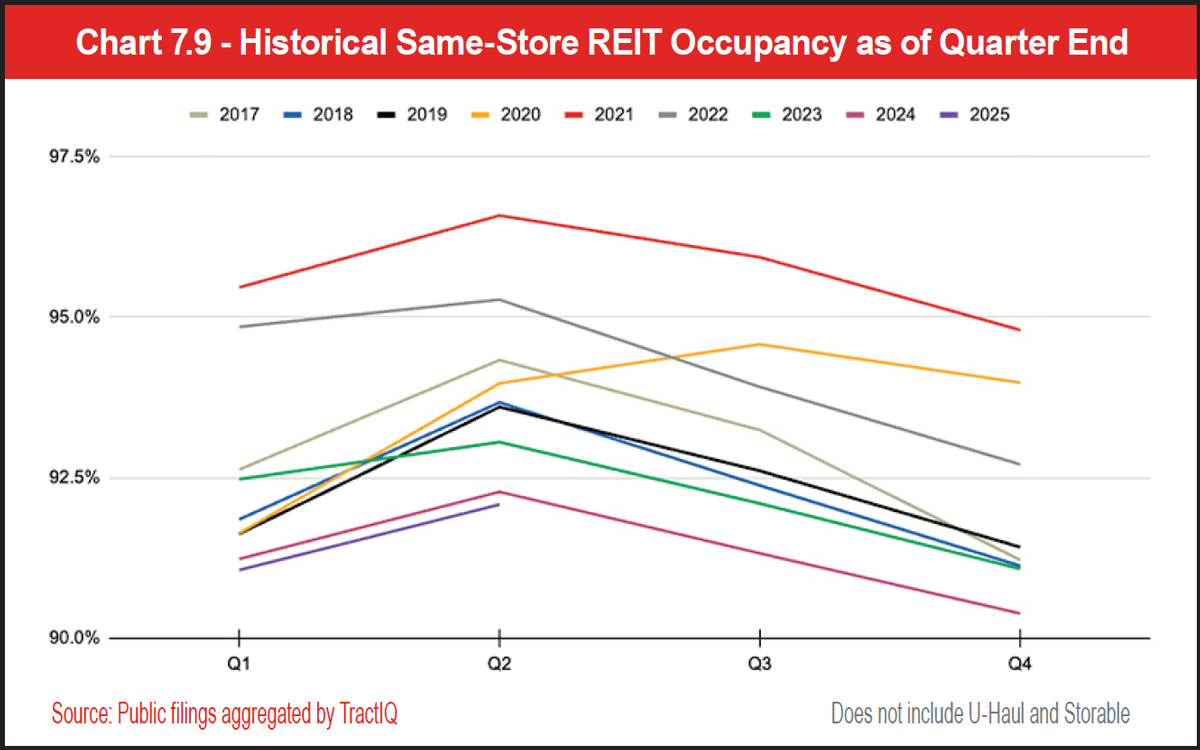
- Seasonality – You will notice distinct highs and lows in the chart showing increased occupancy in Q2/Q3 and decreased occupancy in Q4/Q1. The data highlights a higher need for storage during the spring/summer months, when residential migration is typically higher.
- 2020 was abnormal – The COVID-19 pandemic year created outsized demand for self-storage due to increased residential mobility, which is why Q3 and Q4 occupancy were higher than Q2 for that year (the only time this has happened in the last eight years).
- 2025 hits rock bottom – The first 2 quarters of 2025 have recorded the lowest occupancy levels since 2017. Inflation, high interest rates, and general uncertainty have been challenges for the overall real estate market since 2022, resulting in lower occupancy. It will be interesting to see if occupancy has truly bottomed out, or if 2026 will set a new record.
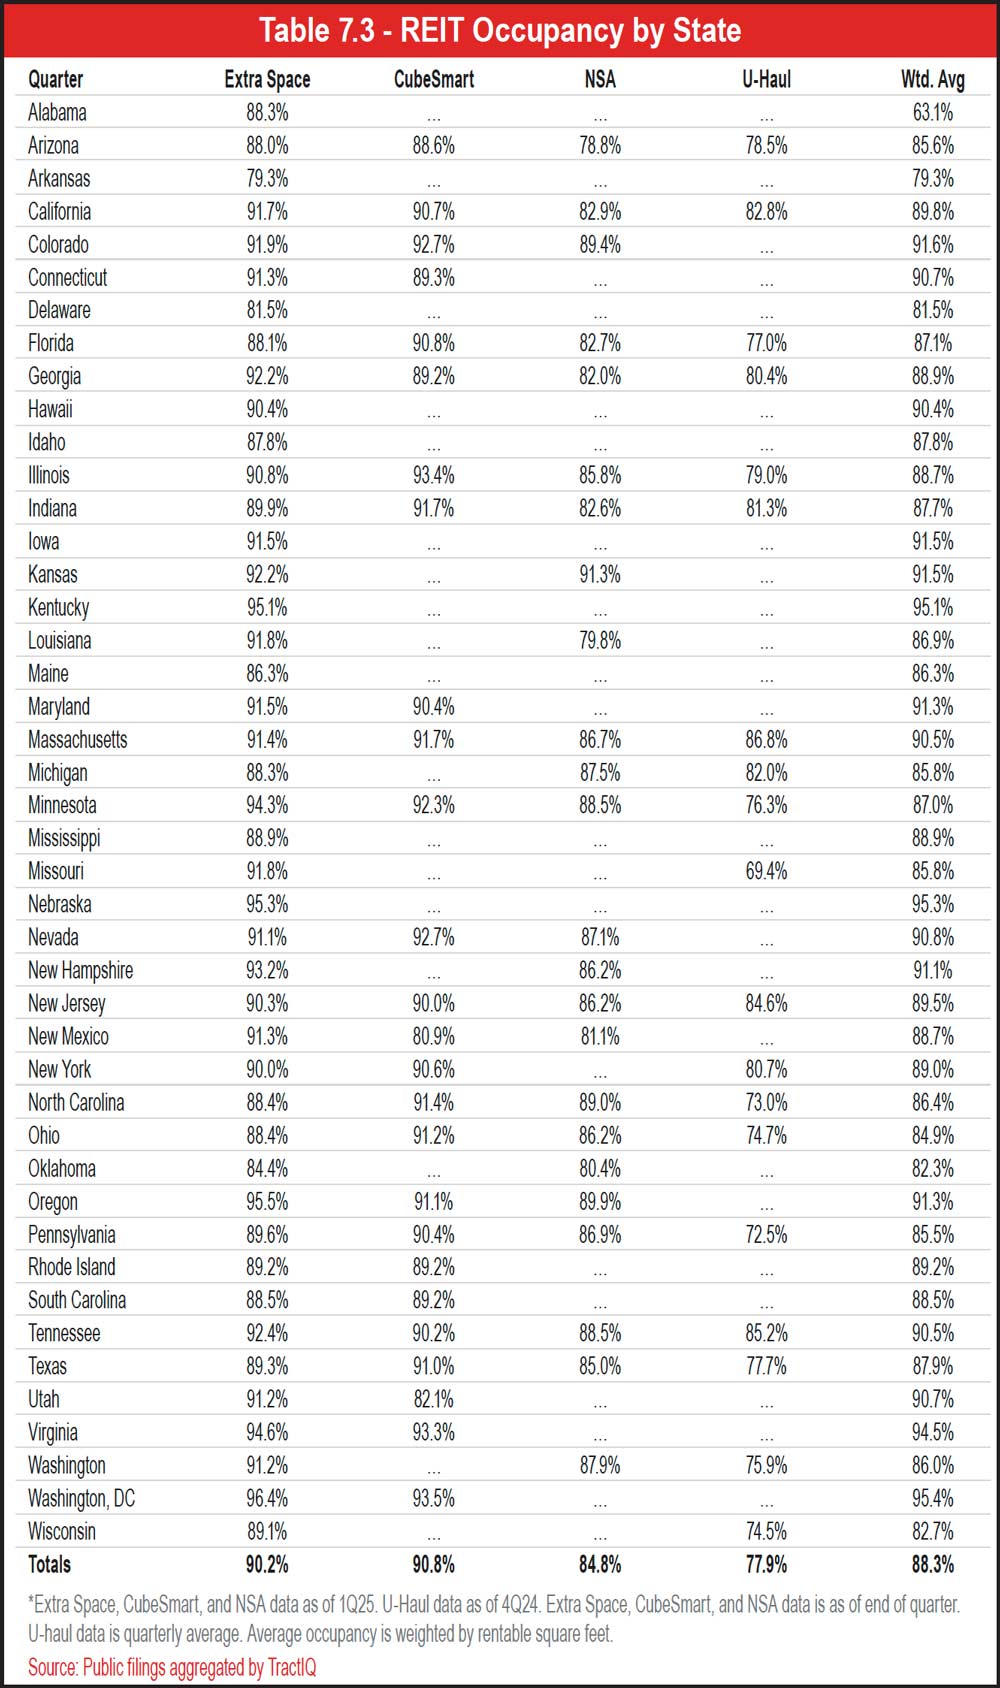
The data in Table 7.3 shows occupancy by state from Extra Space, CubeSmart, U-Haul, and NSA. This data includes same-store and non-same-store facilities, which means this data includes facilities that are stabilized and those that are not. Non-stabilized facilities could include facilities that just finished construction and are leasing up, or facilities that just finished leasing up but need more time to increase and mature rental rates. This state data is interesting because it gives a more realistic understanding of where REIT occupancy actually stands across each state and the nation.
See Table 7.3.
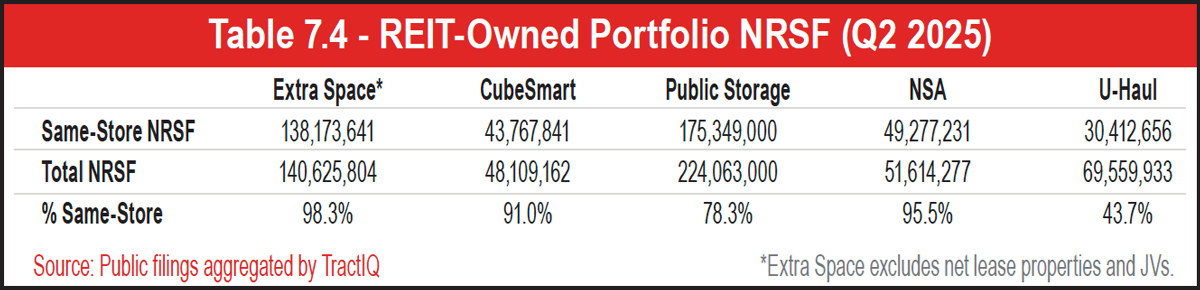
See Table 7.4.
There are 16 states that report occupancy above 90 percent: Colorado, Connecticut, Hawaii, Iowa, Kansas, Kentucky, Maryland, Massachusetts, Nebraska, Nevada, New Hampshire, Oregon, Tennessee, Utah, Virginia, and Washington, D.C. The rest of the states report occupancy between 80 percent and 90 percent. Please keep in mind the data may be skewed from two angles: limited reporting from multiple sources and limited facilities included in the reporting. For example, Extra Space Storage is the only company that reports occupancy for Arkansas, and their sample size is only 4 facilities.
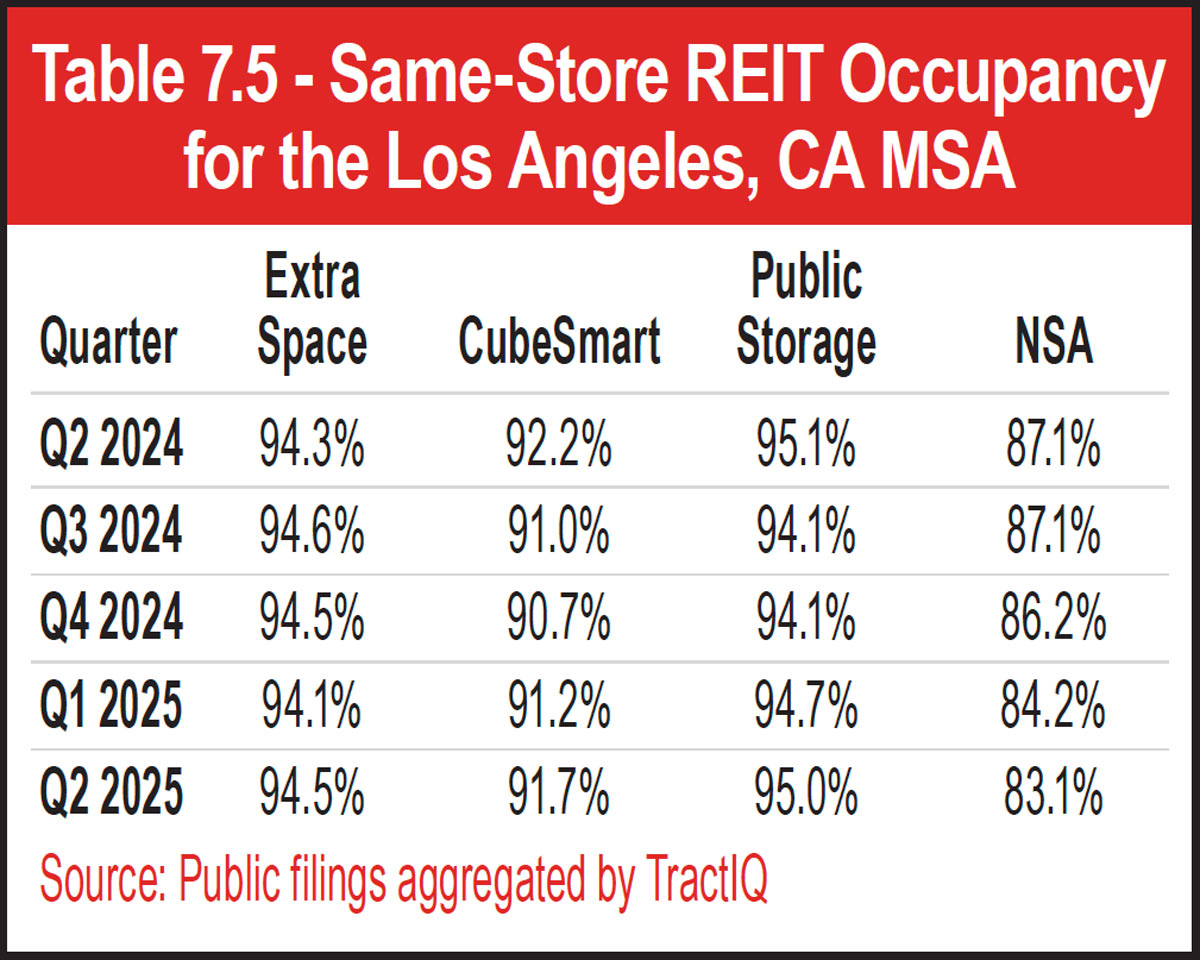
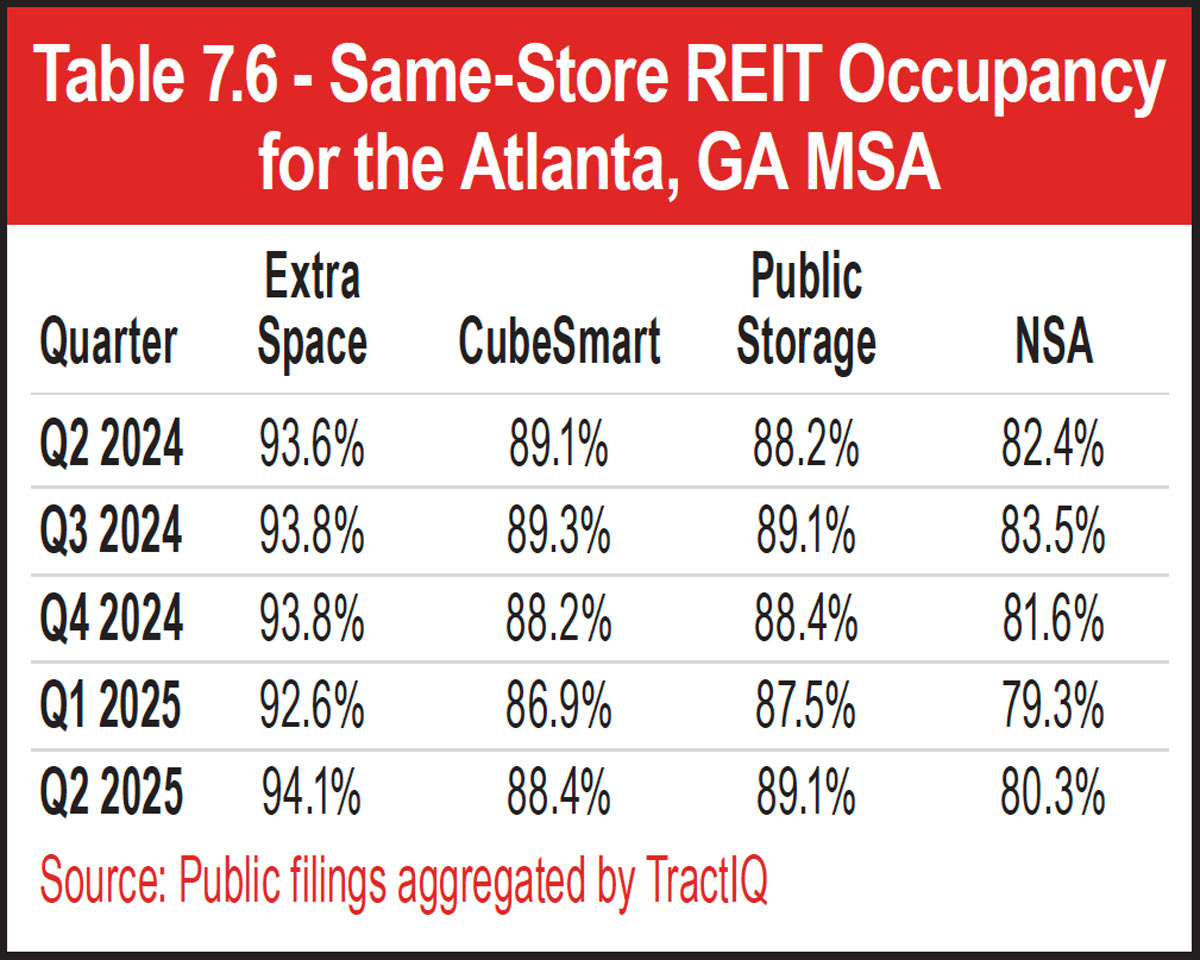
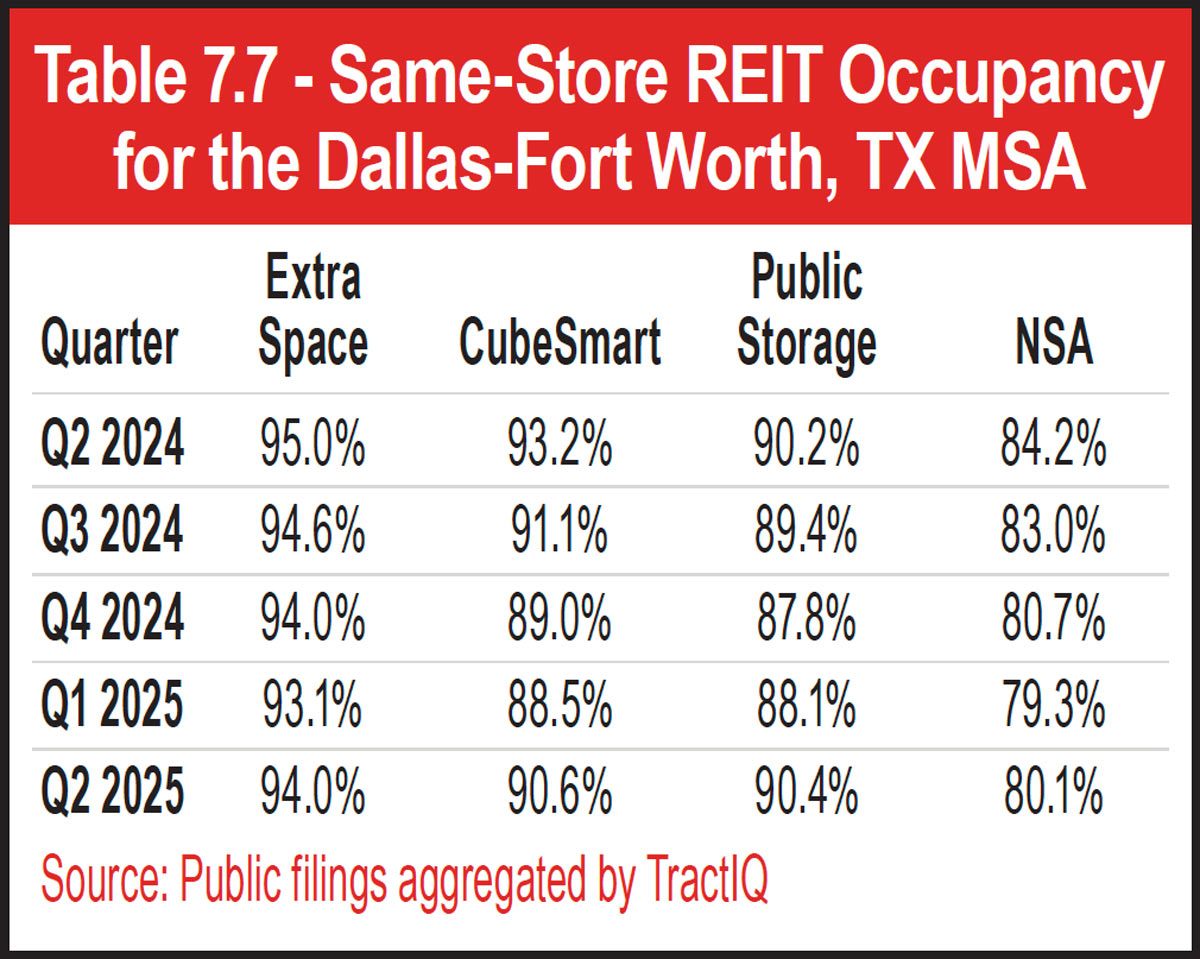
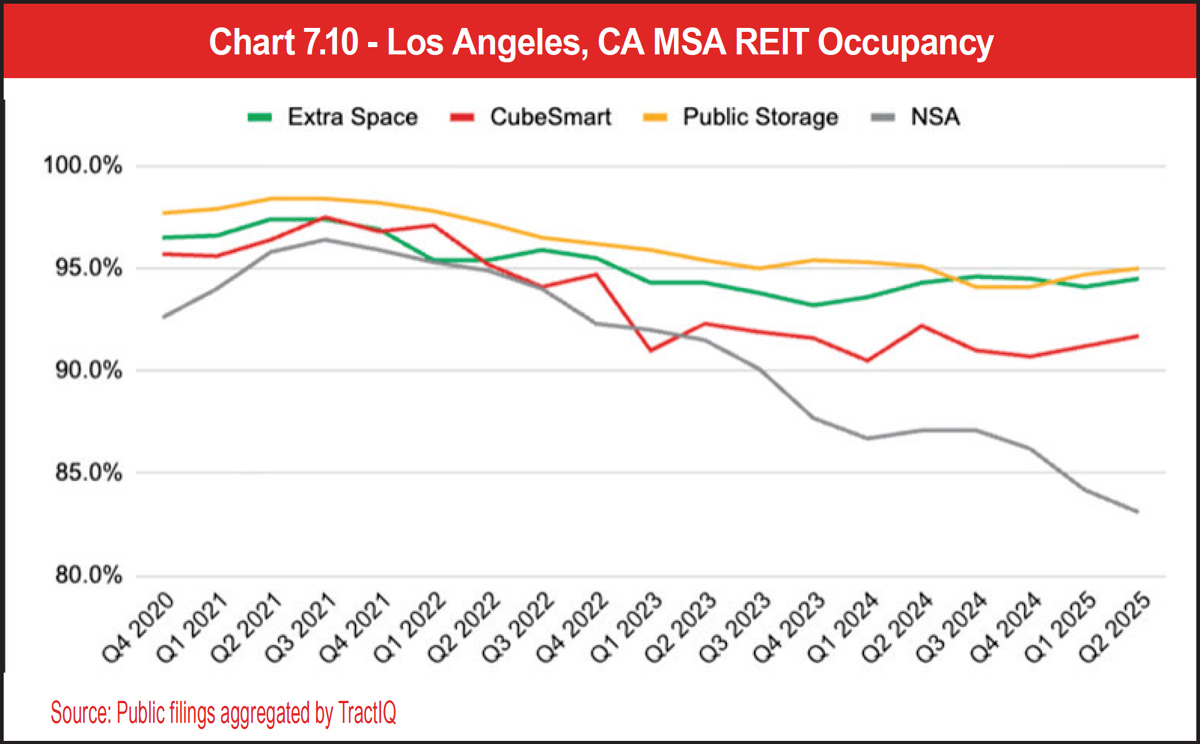
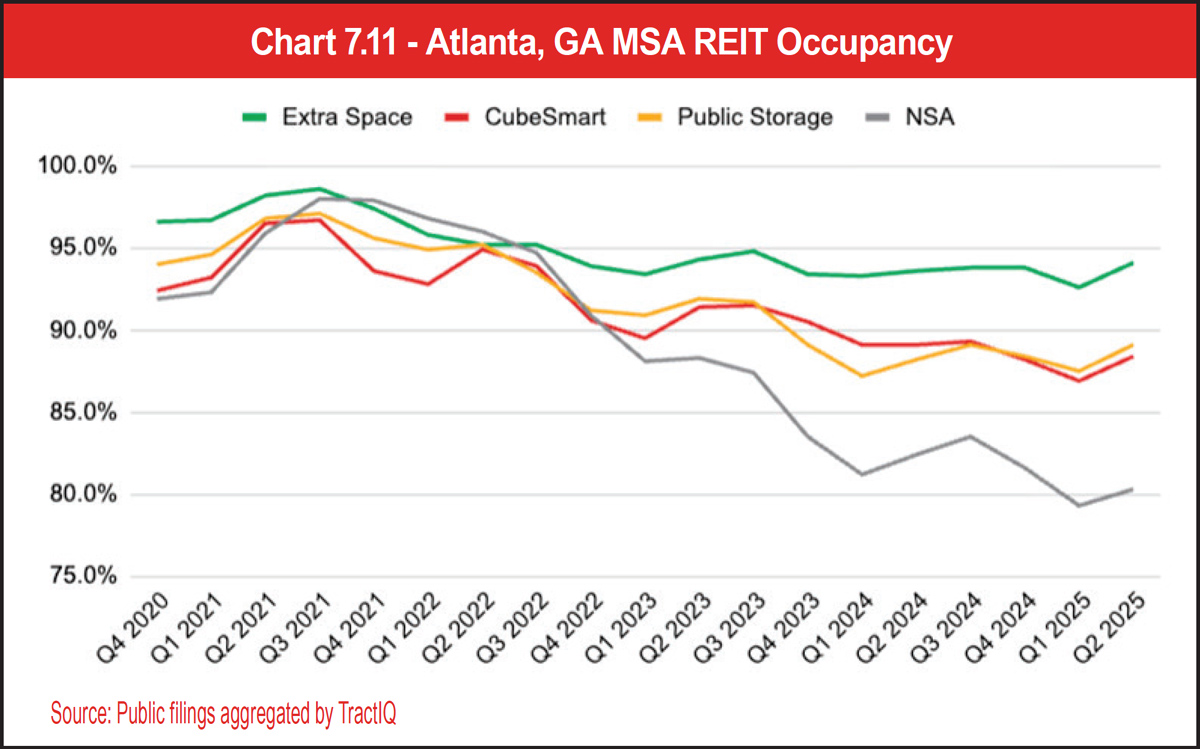
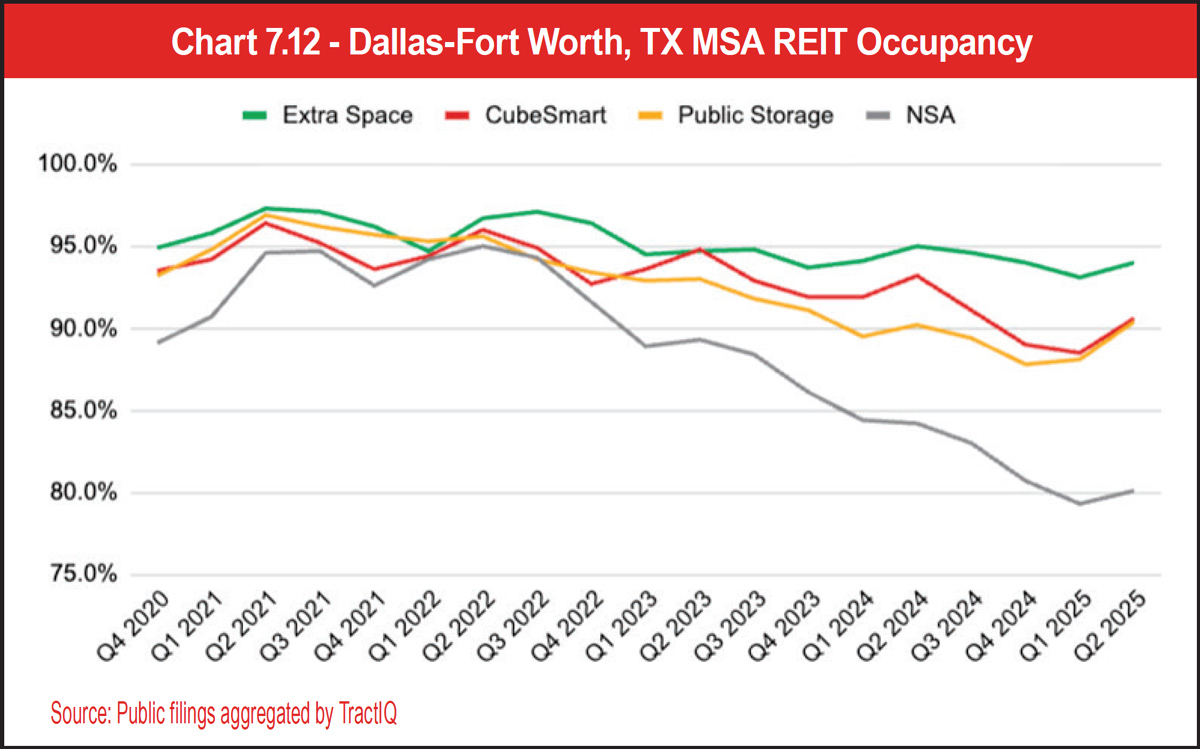
In Tables 7.5, 7.6, and 7.7, we can see occupancy data for Los Angeles, Atlanta, and Dallas. Dallas and Atlanta experienced self-storage booms during the COVID-19 pandemic (2021 to 2022) due to higher residential mobility. As a result, developers felt justified in building more self-storage during this time for these MSAs. On the other hand, Los Angeles was an MSA that experienced emigration during the COVID-19 pandemic. Less self-storage supply was introduced in Los Angeles than Dallas and Atlanta during this time. In general, MSAs that overbuilt self-storage facilities due to the pandemic boom underperformed during 2023 to 2024, and as of the second quarter of 2025, these MSAs are now seeing signs of recovery from an occupancy perspective. This is supported by the Los Angeles, Dallas, and Atlanta occupancy data shown in Charts 7.10, 7.11, and 7.12.
See Tables 7.5, 7.6, and 7.7.
See Charts 7.10, 7.11, and 7.12.
See Tables 7.8, 7.9, 7.10, 7.11, 7.12, 7.13, 7.14, 7.15, 7.16, 7.17, and 7.18.
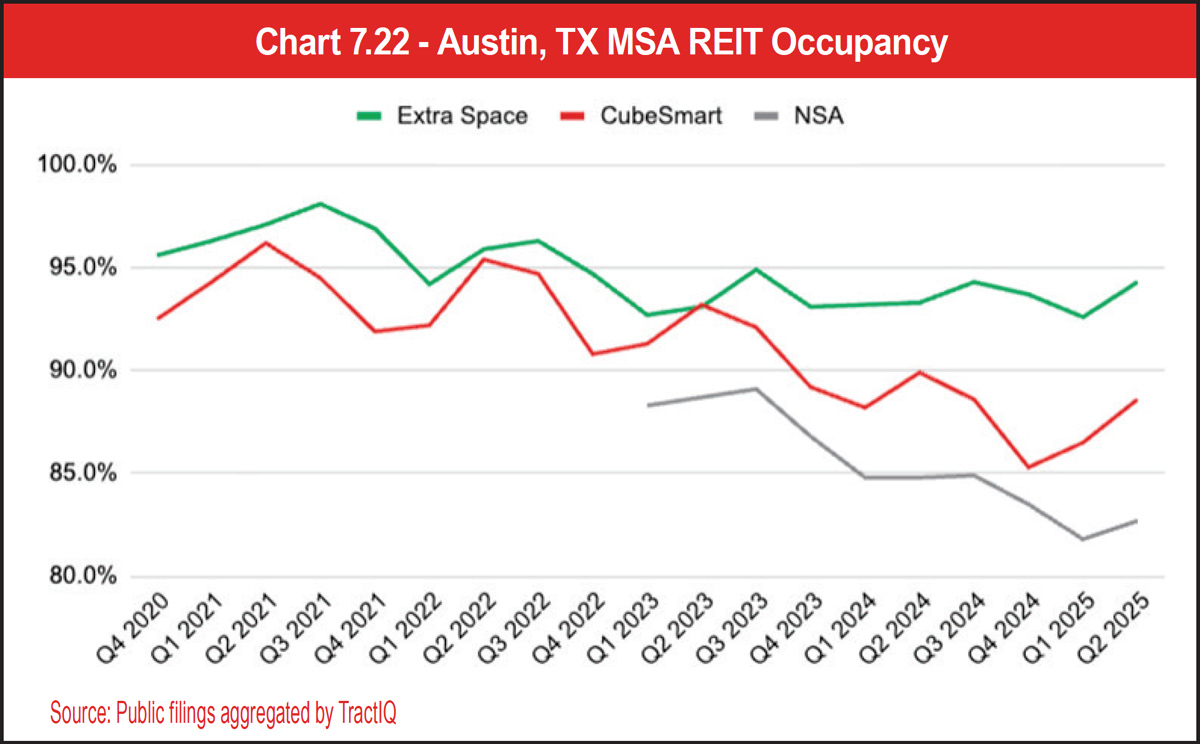
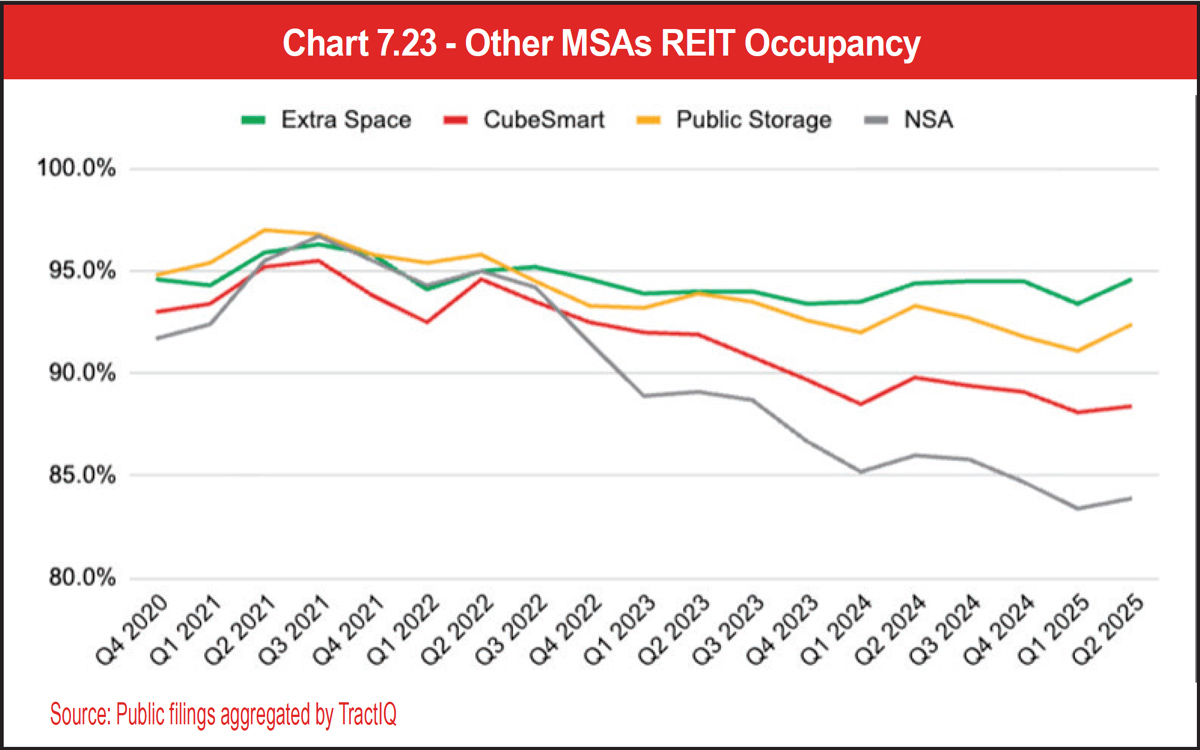
See Charts 7.13, 7.14, 7.15, 7.16, 7.17, 7.18, 7.19, 7.20, 7.21, 7.22, and 7.23.
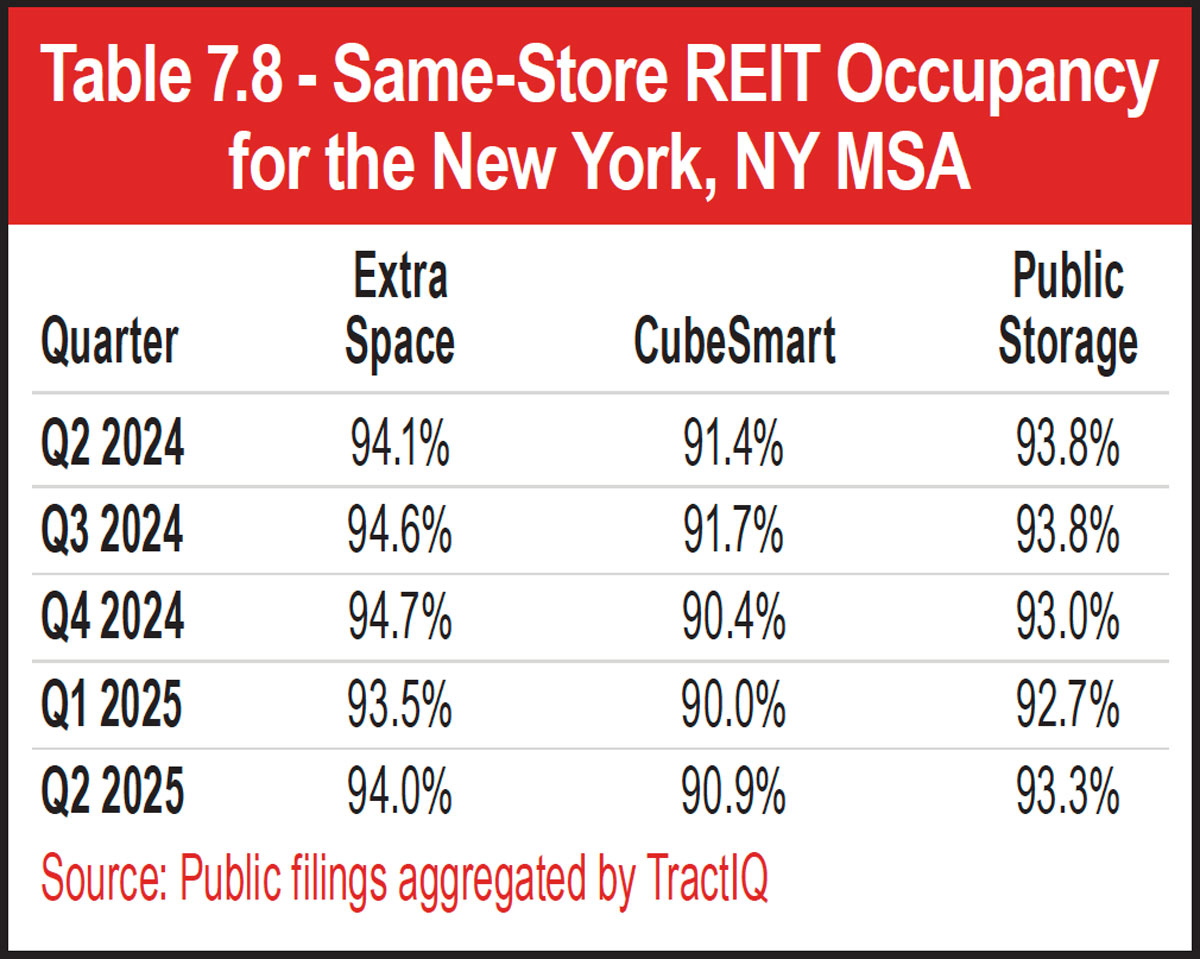
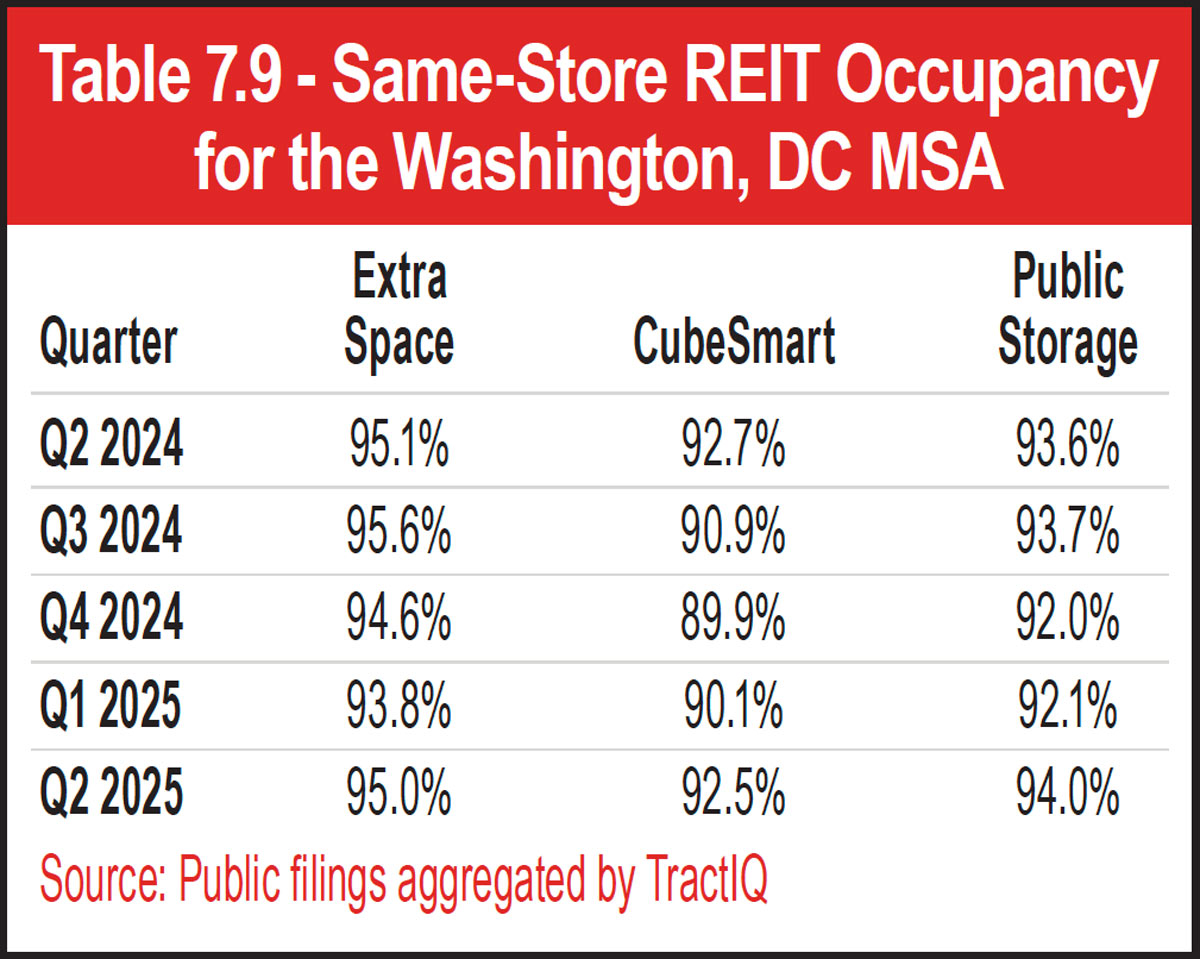
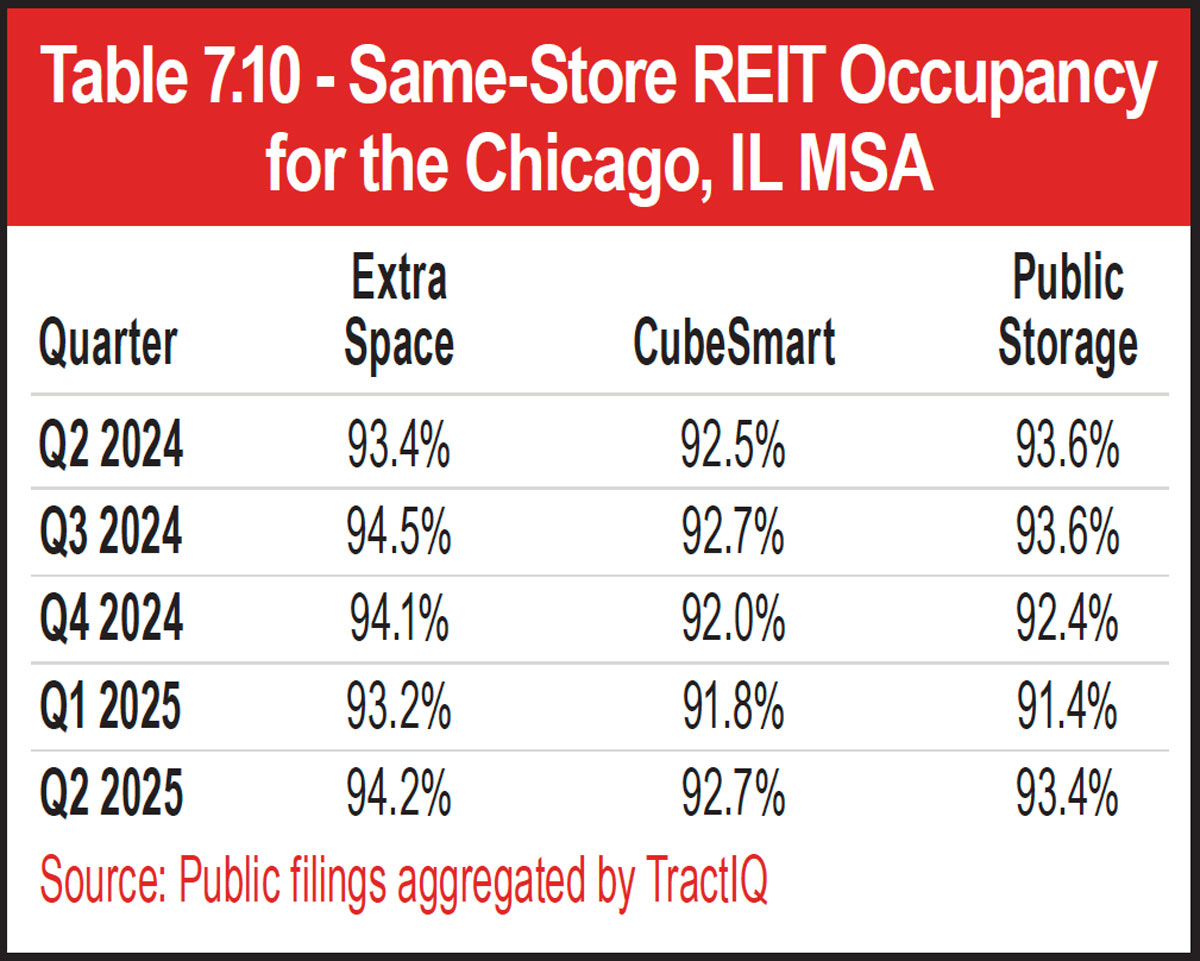
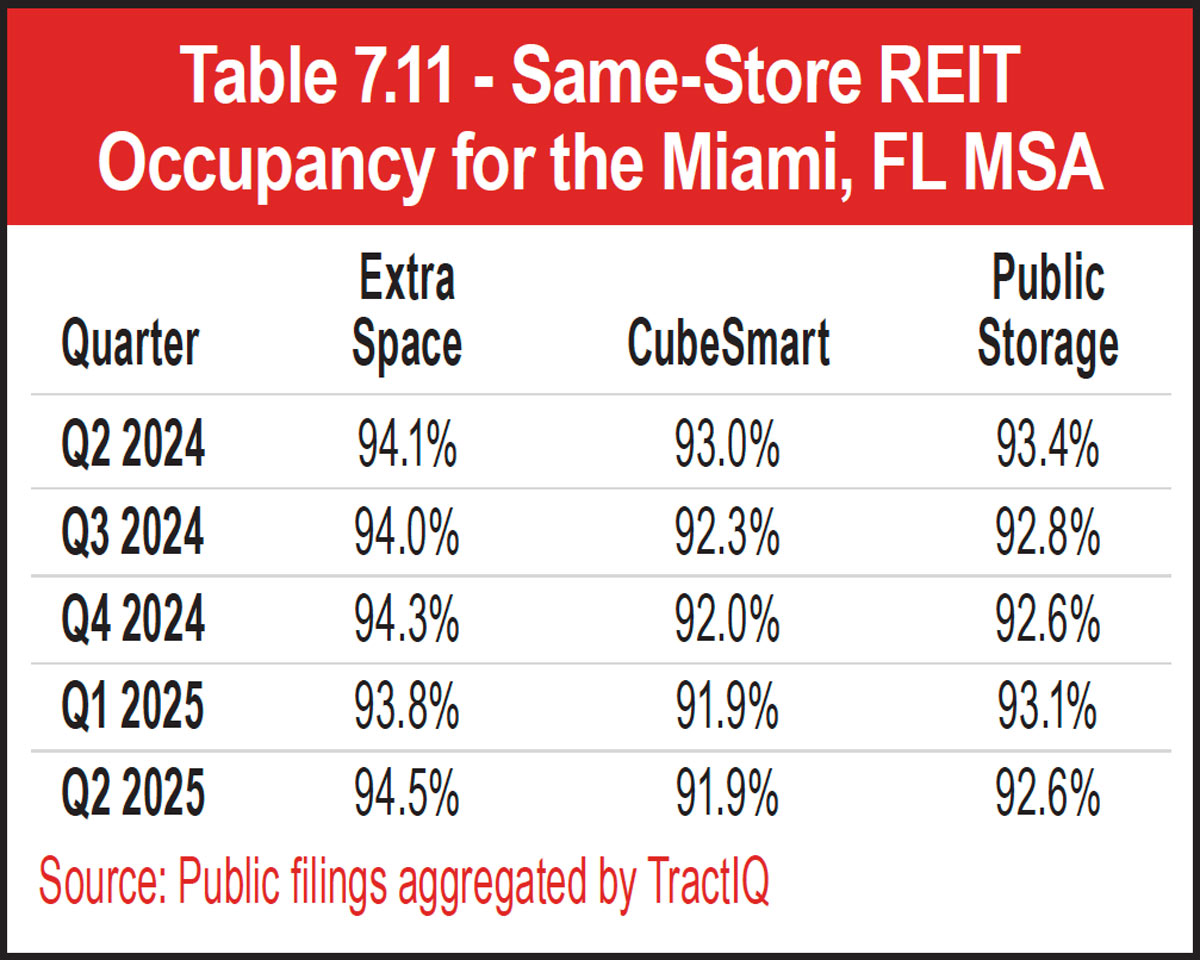
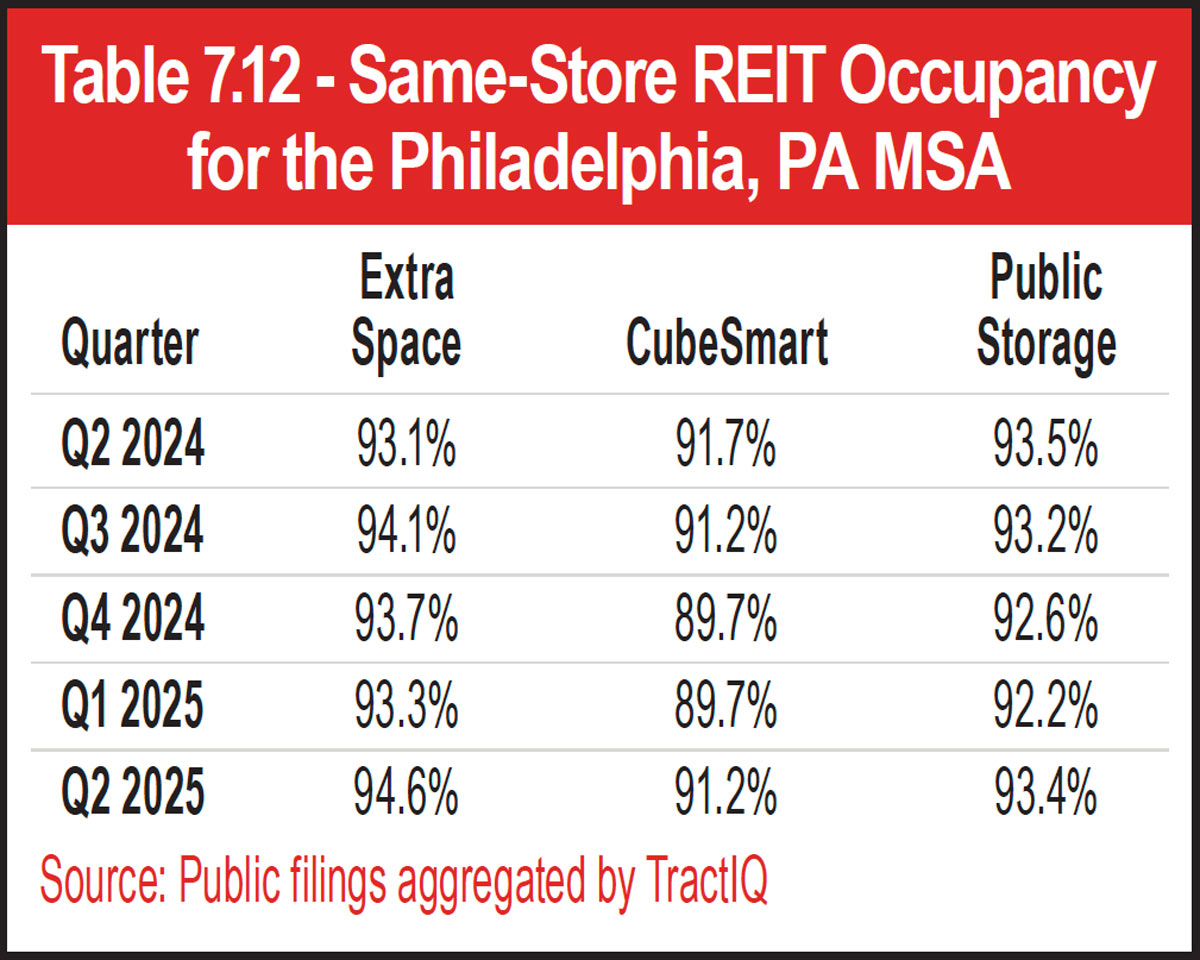
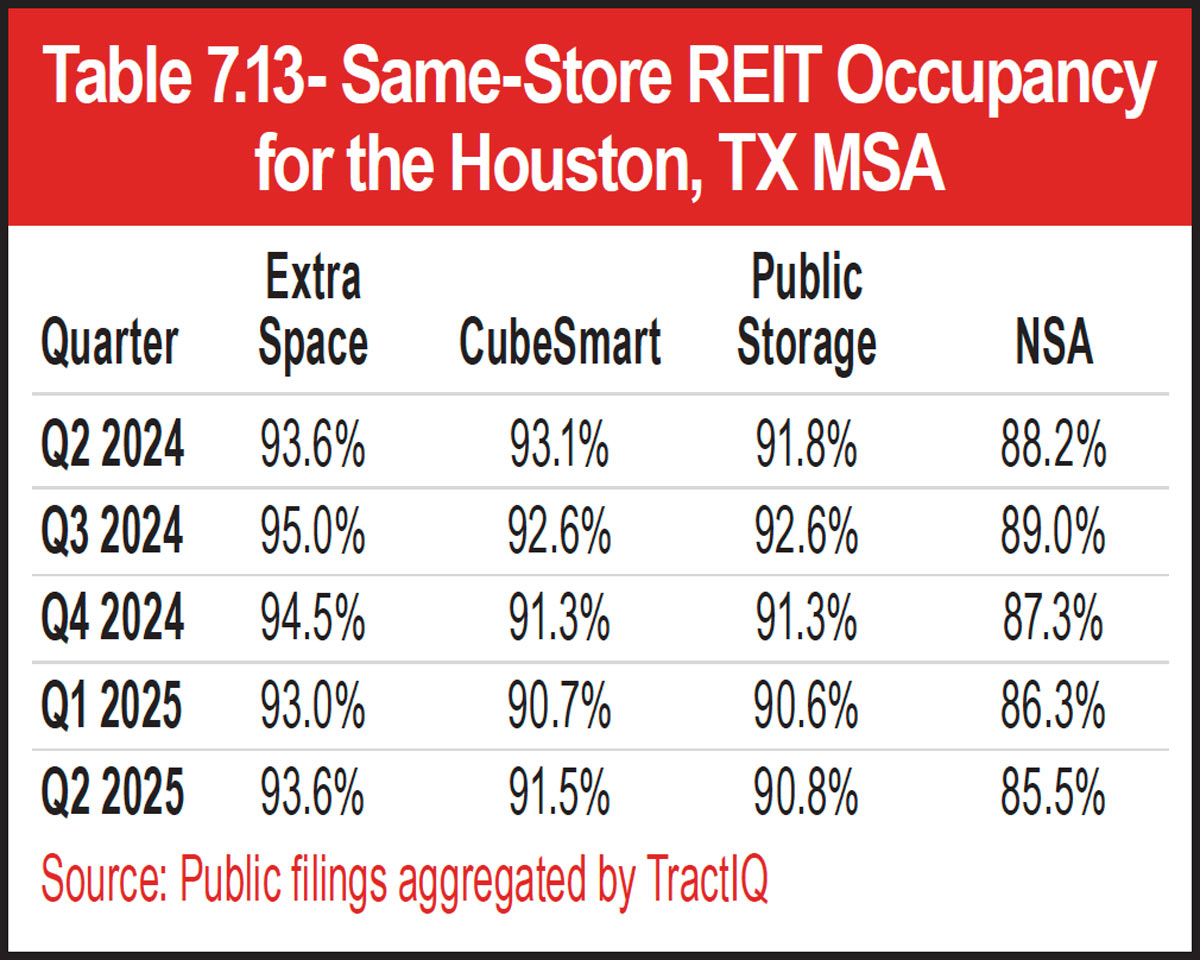
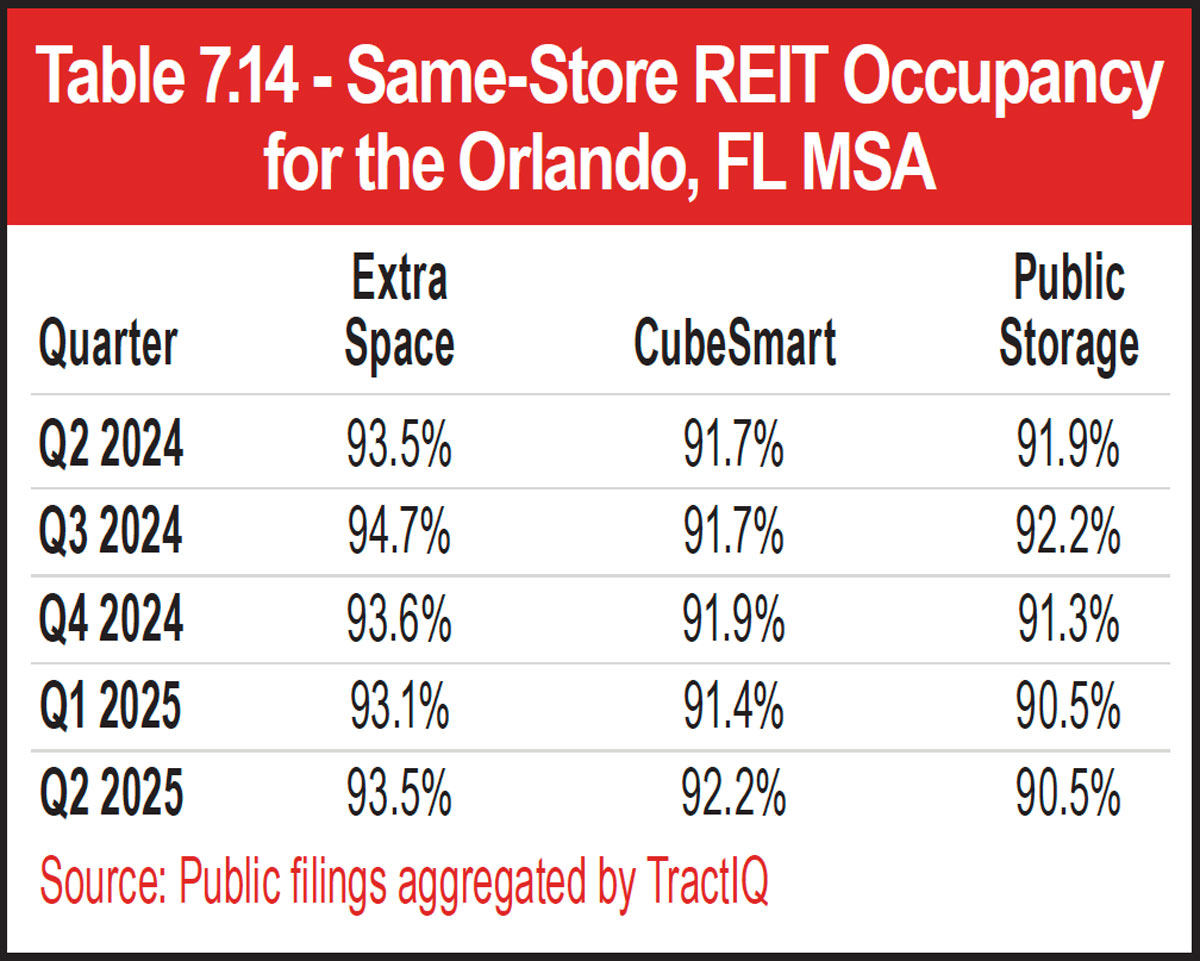
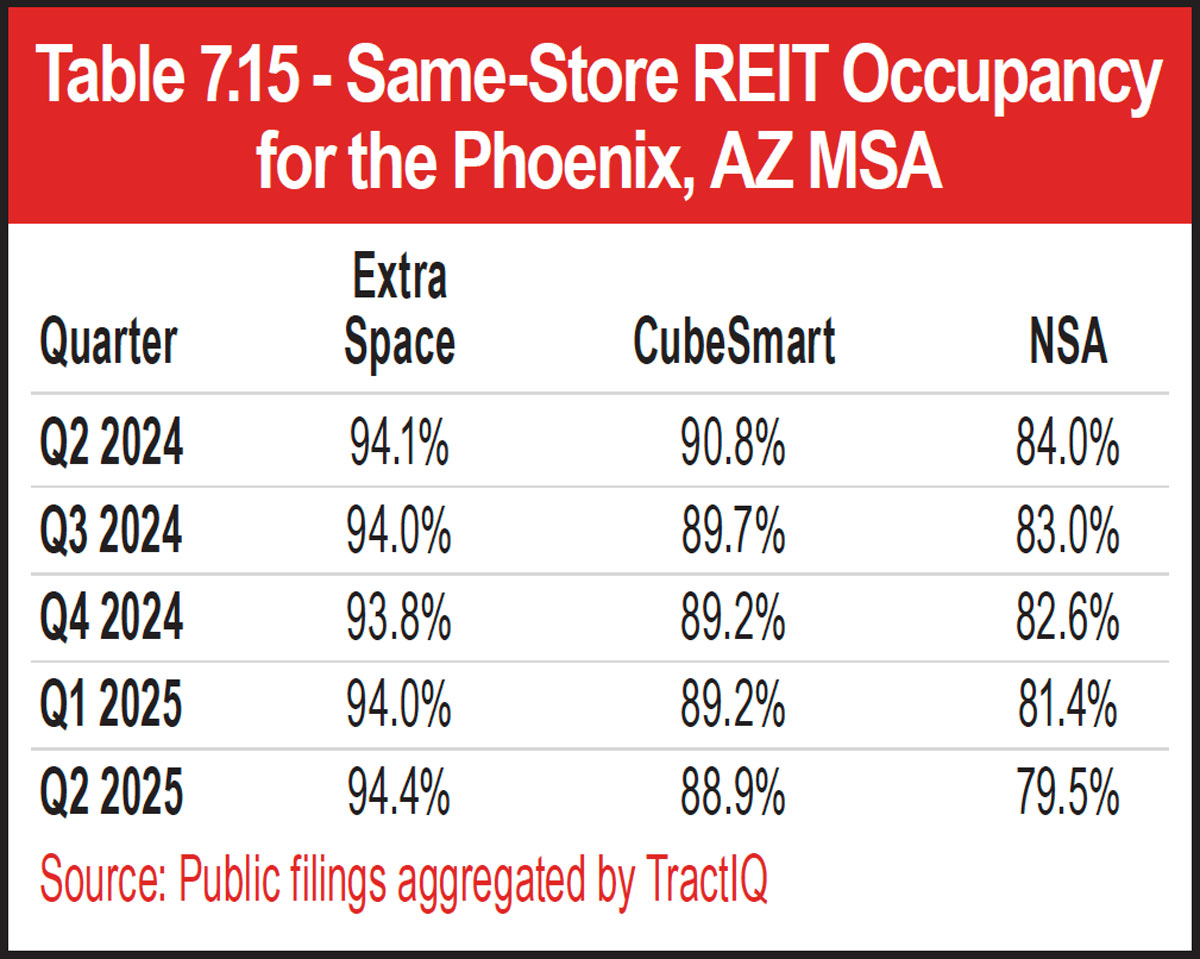
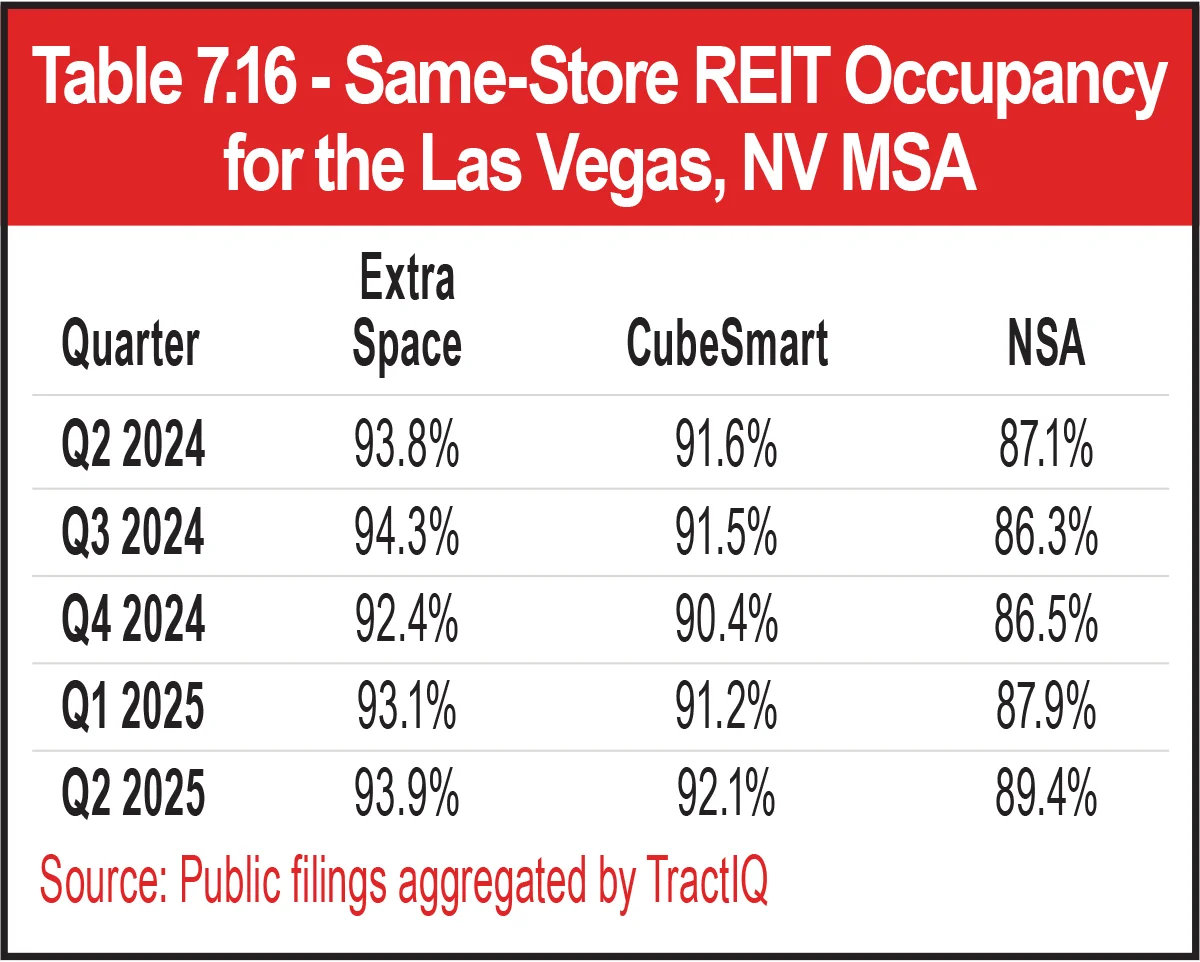
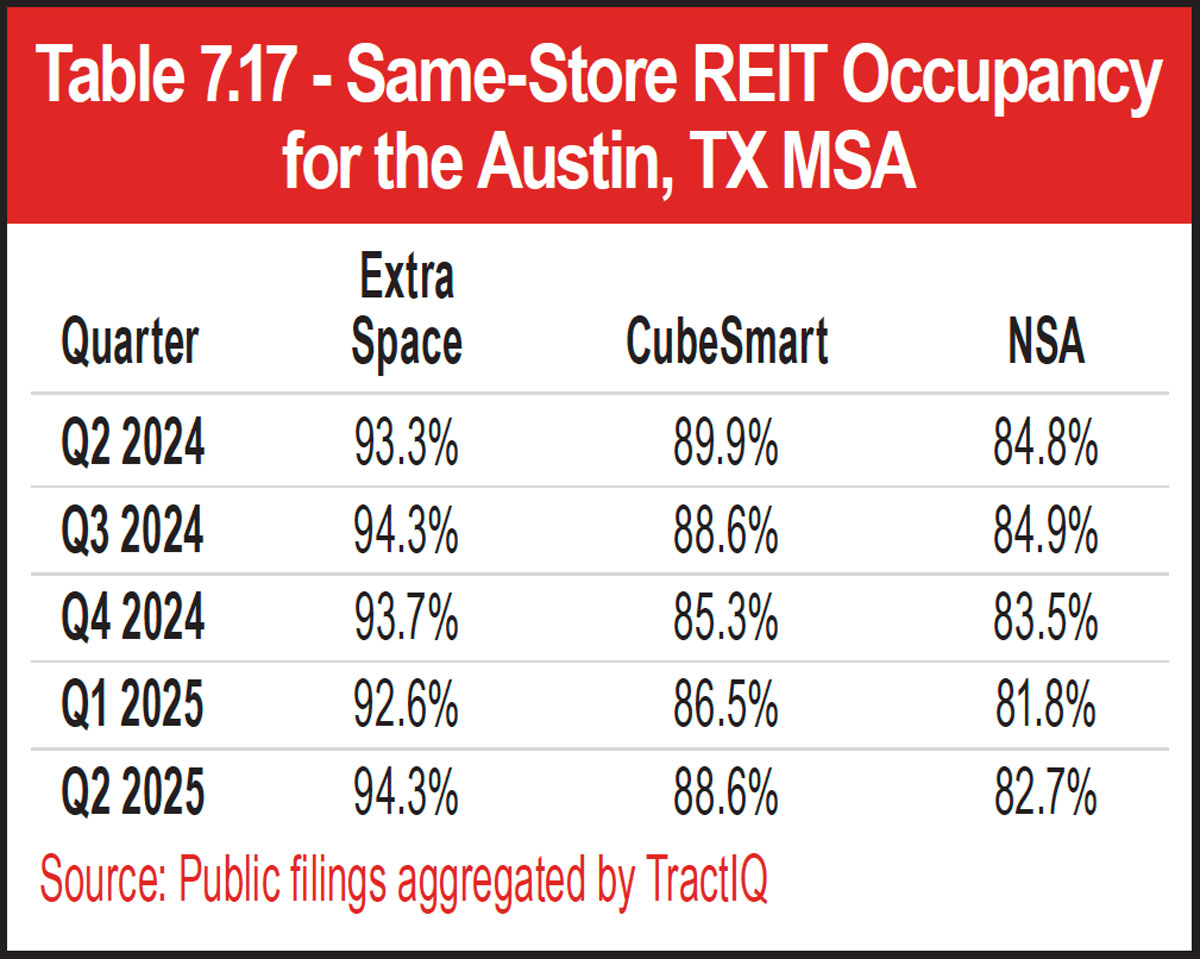
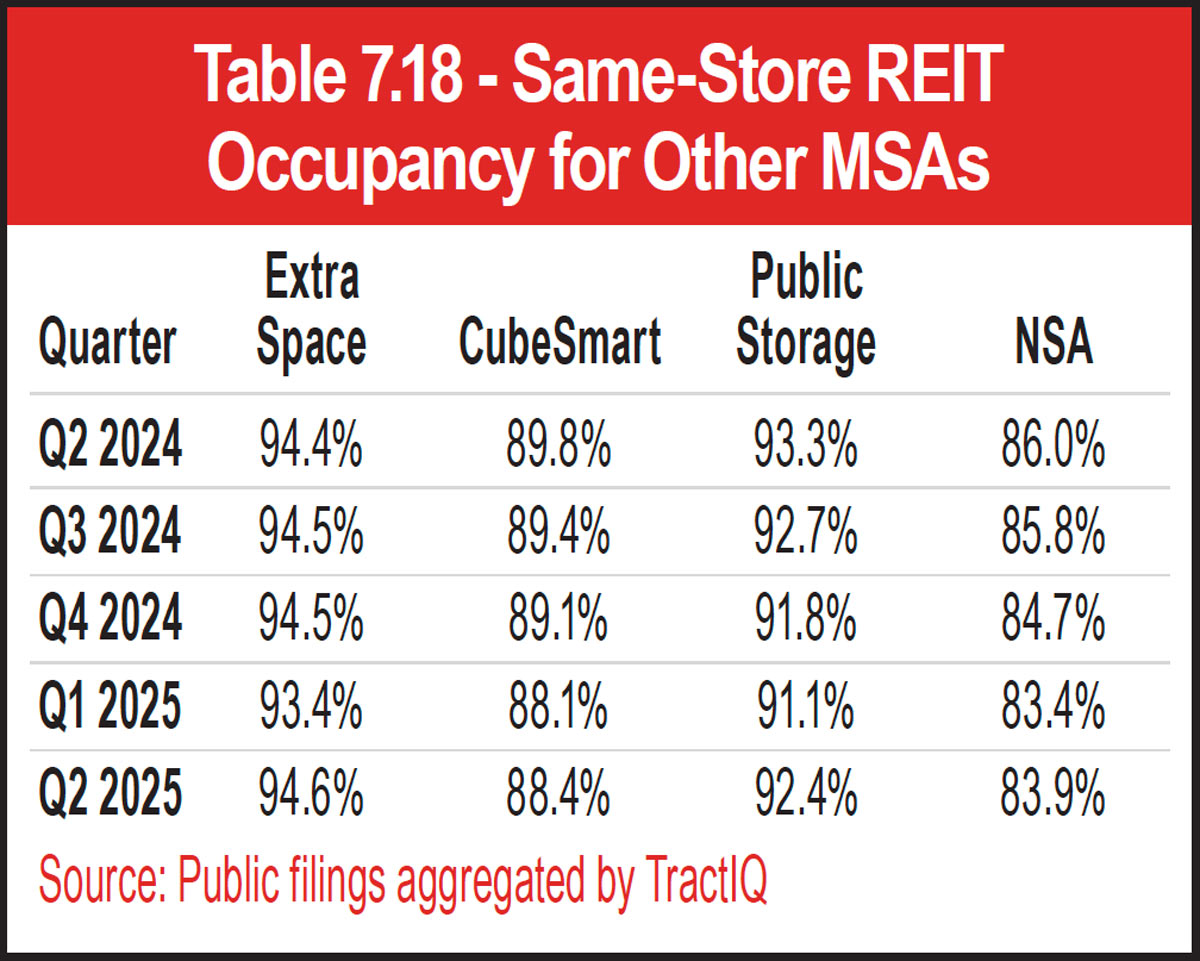
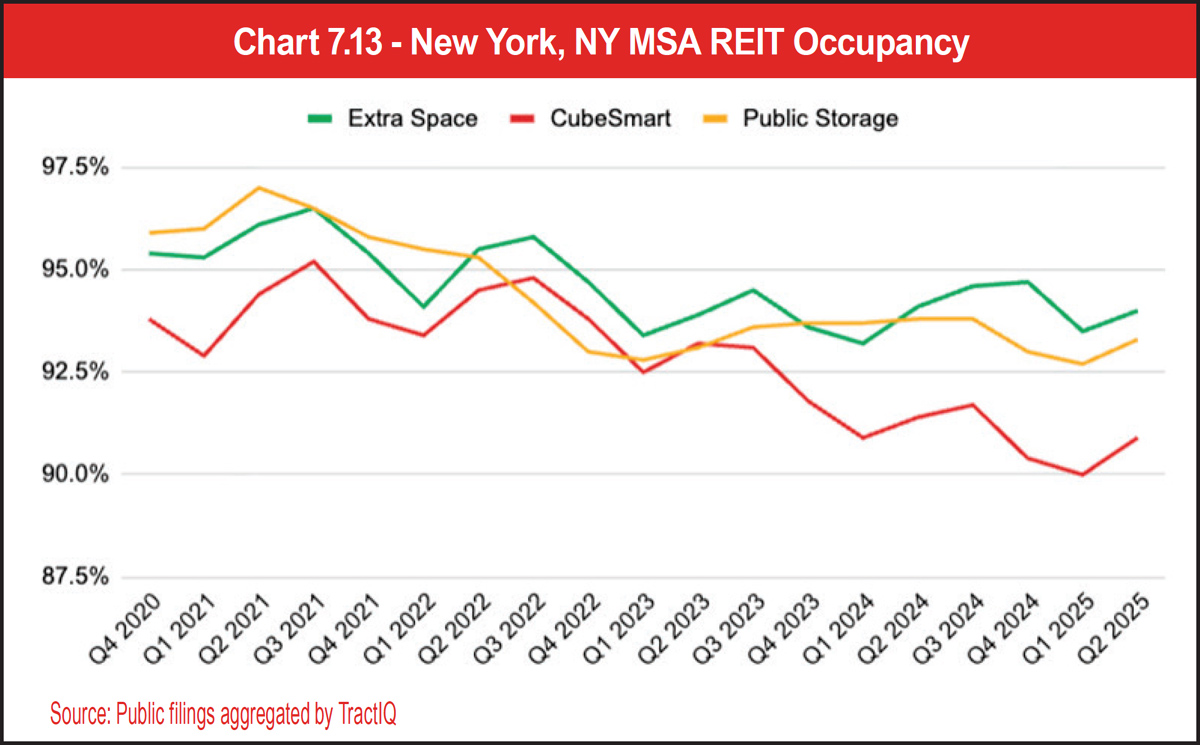
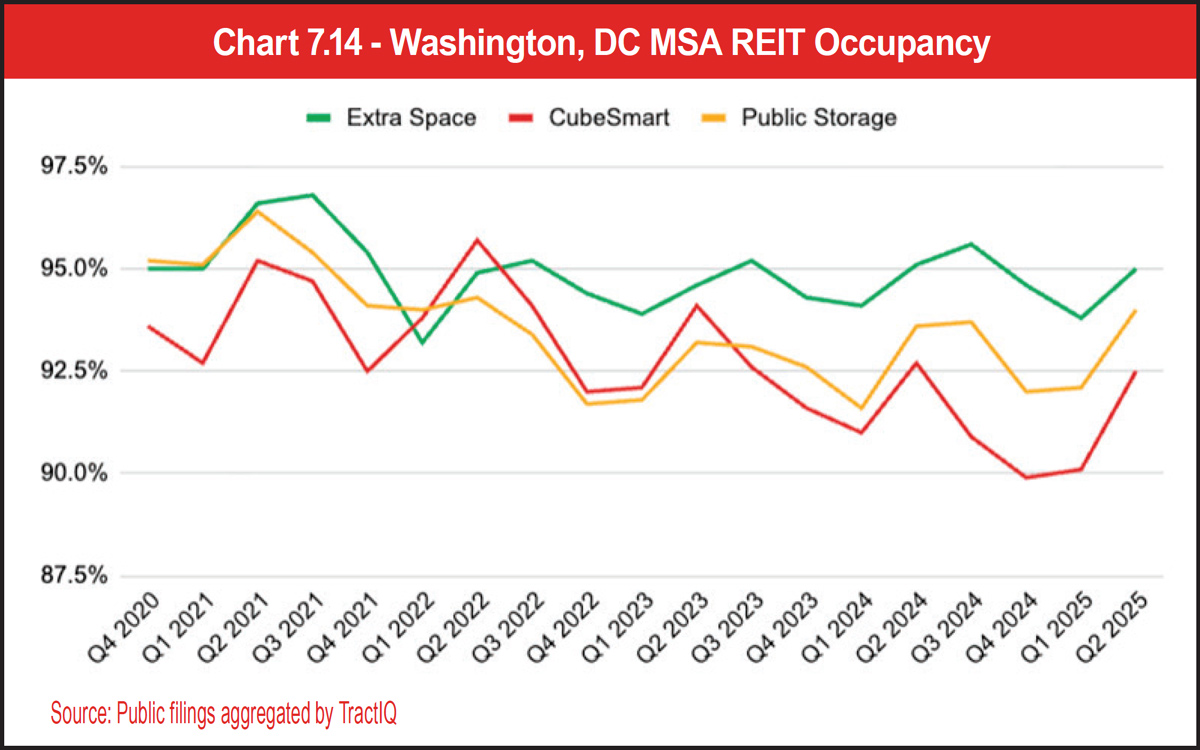
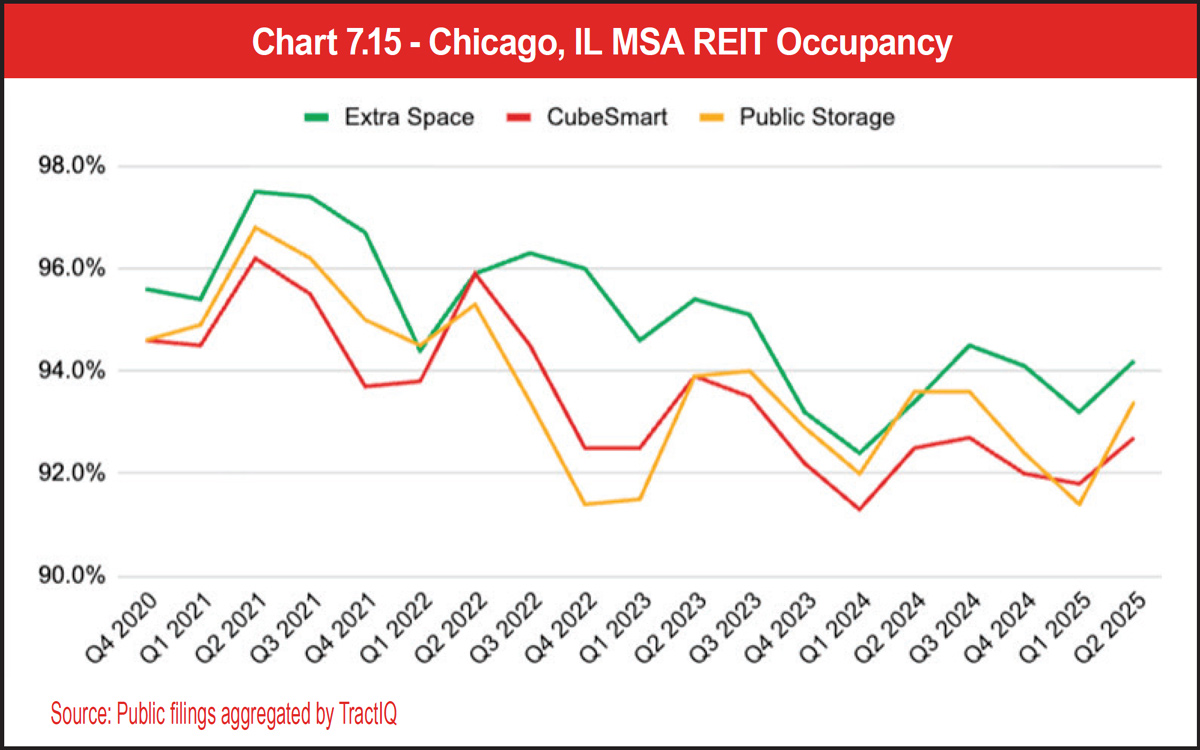
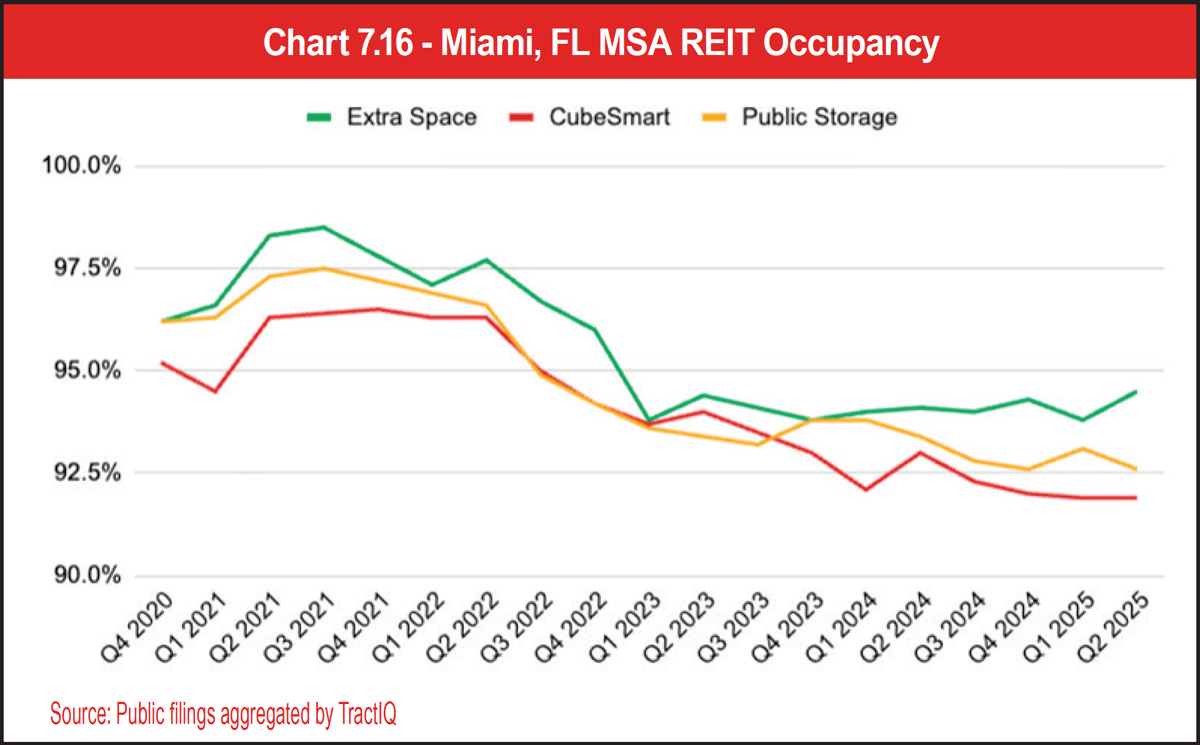
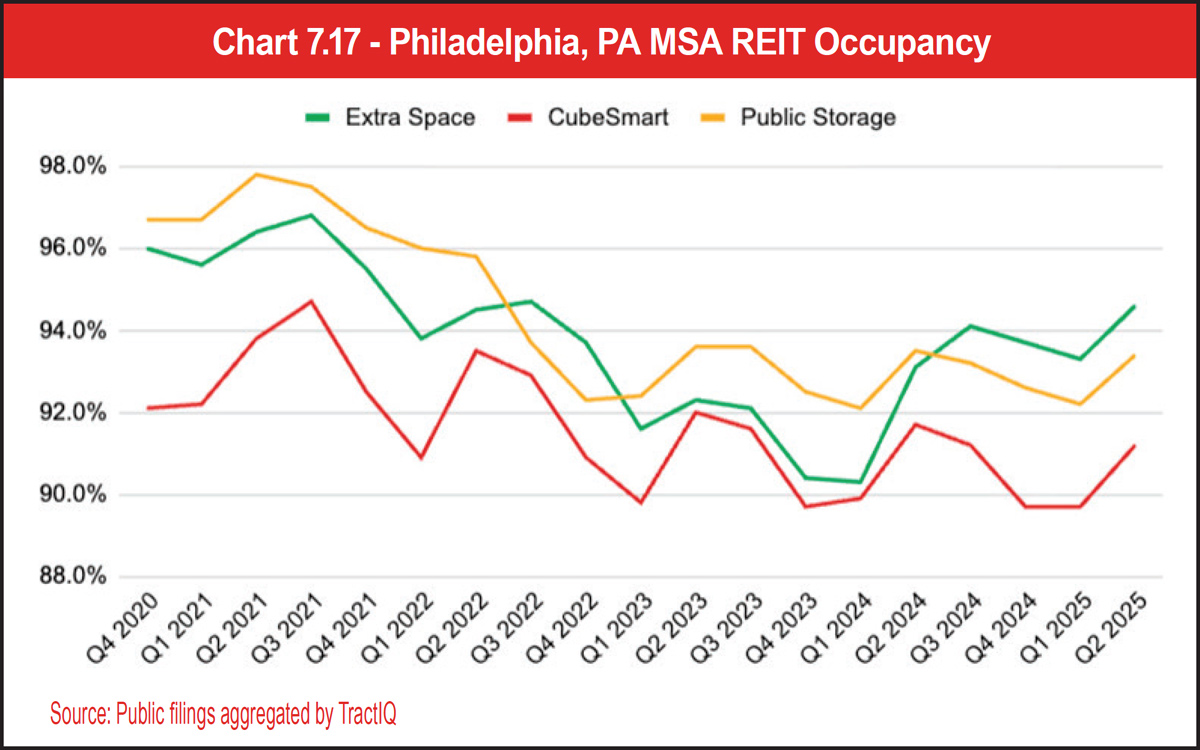
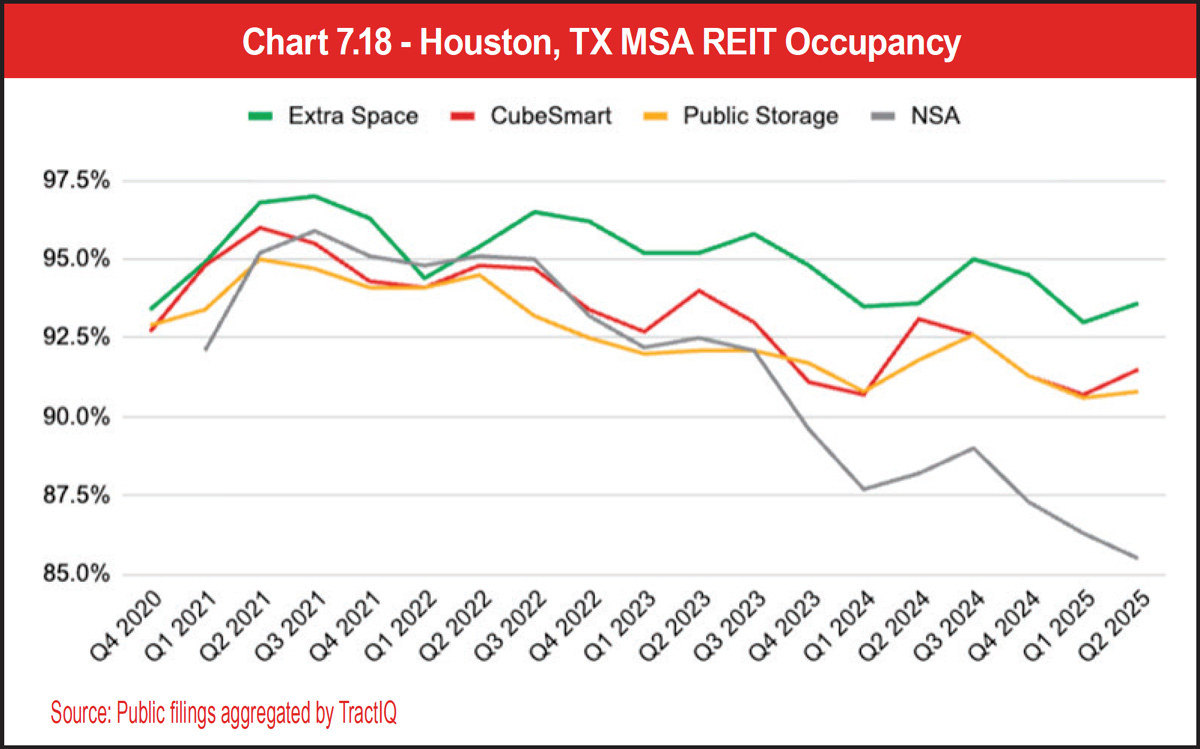
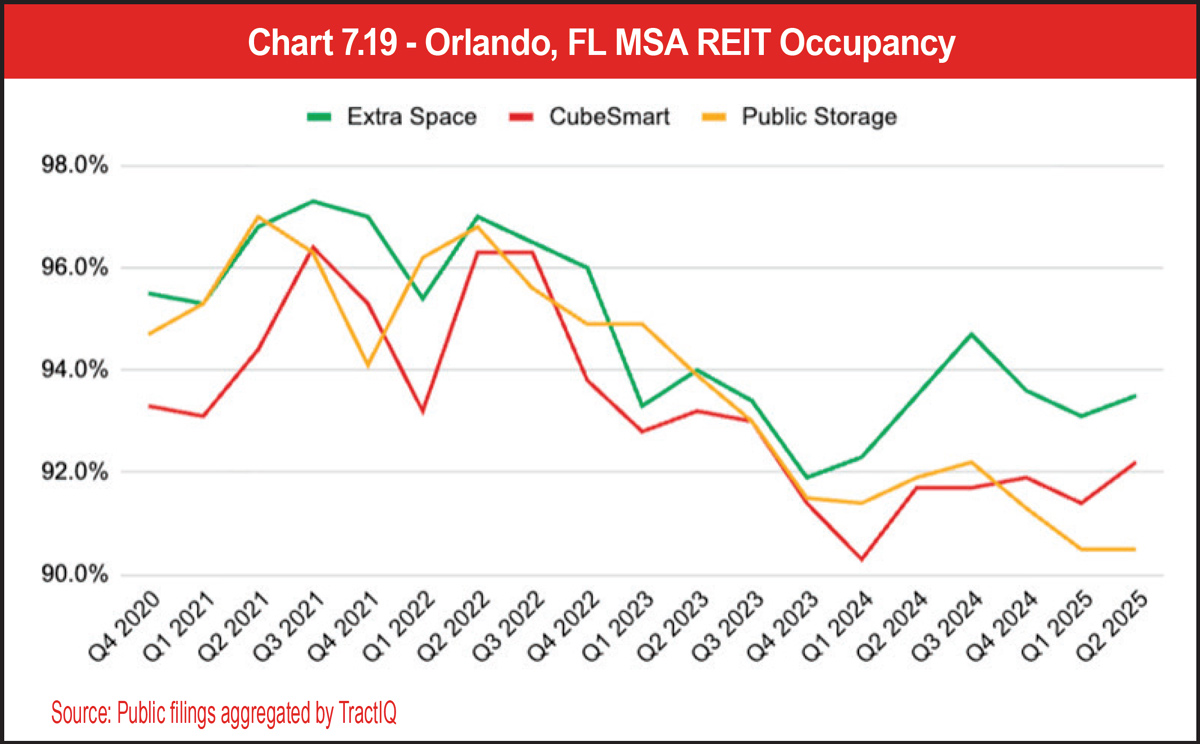
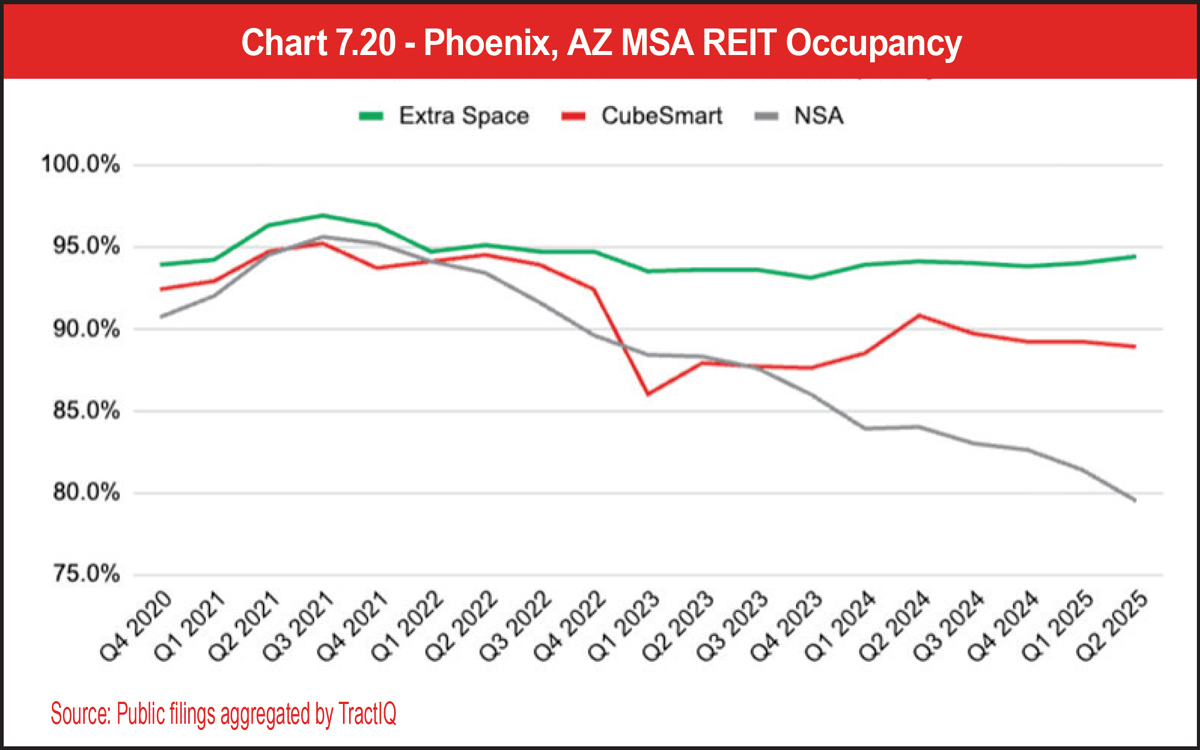
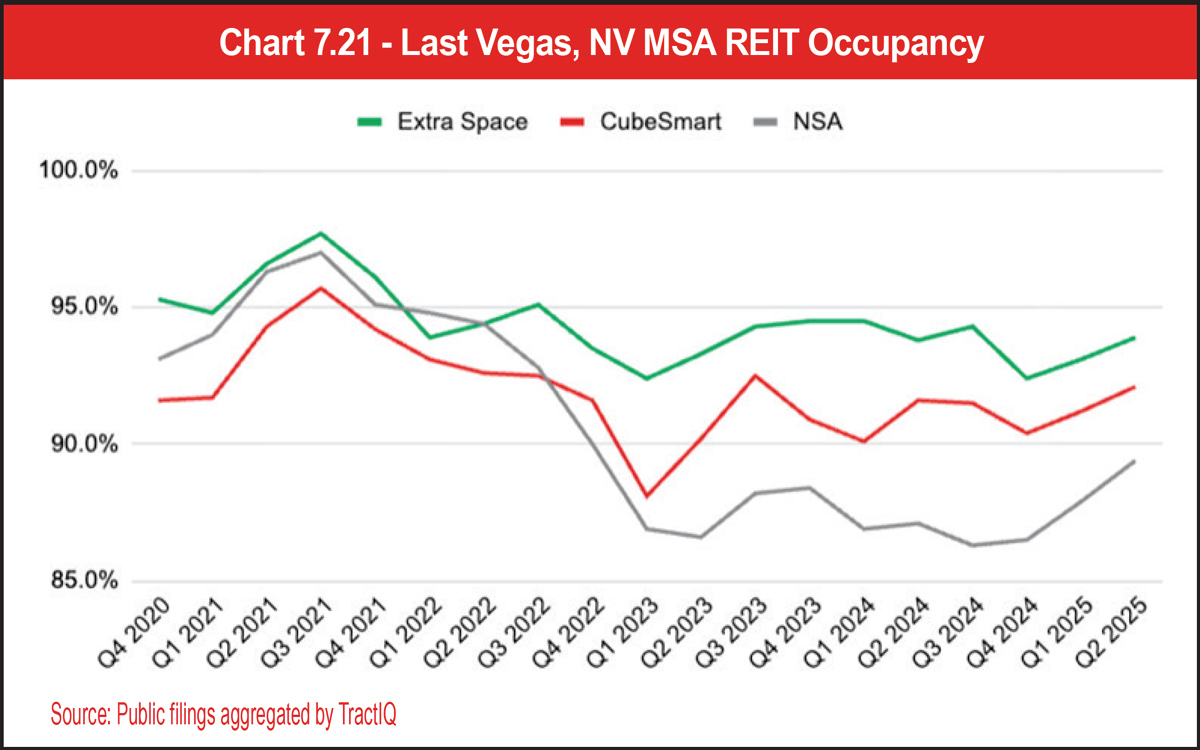
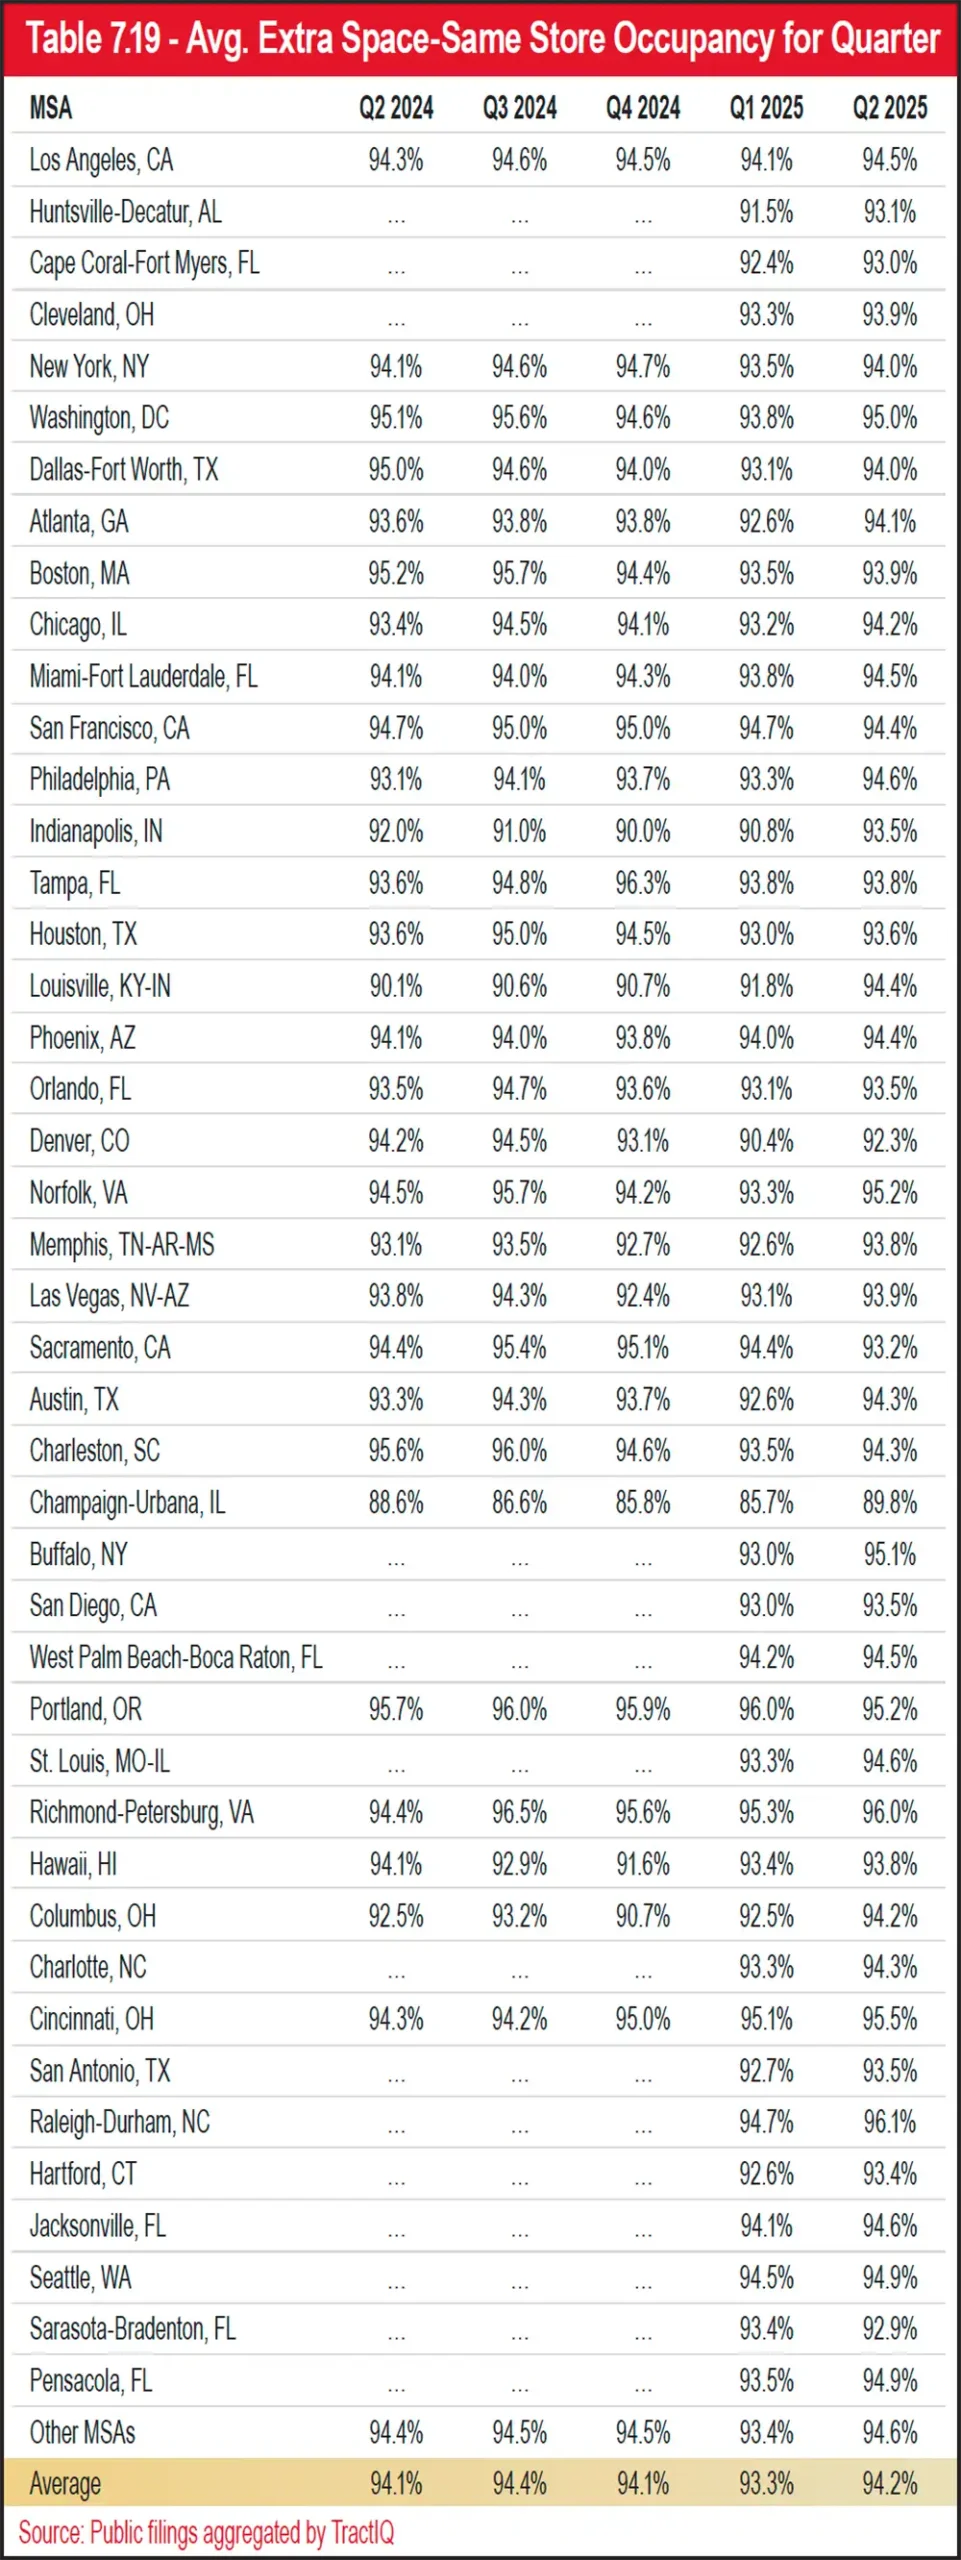
Interestingly, the only MSA in Extra Space’s same-store portfolio that is below 90 percent occupied over the last five quarters is the Champaign-Urbana, Ill., MSA. As of the latest quarter, the Raleigh-Durham, N.C., MSA had the highest occupancy out of all reported MSAs at 96.1 percent. Overall year-over-year occupancy has increased slightly by 0.1 percent percentage points.
See Table 7.19.
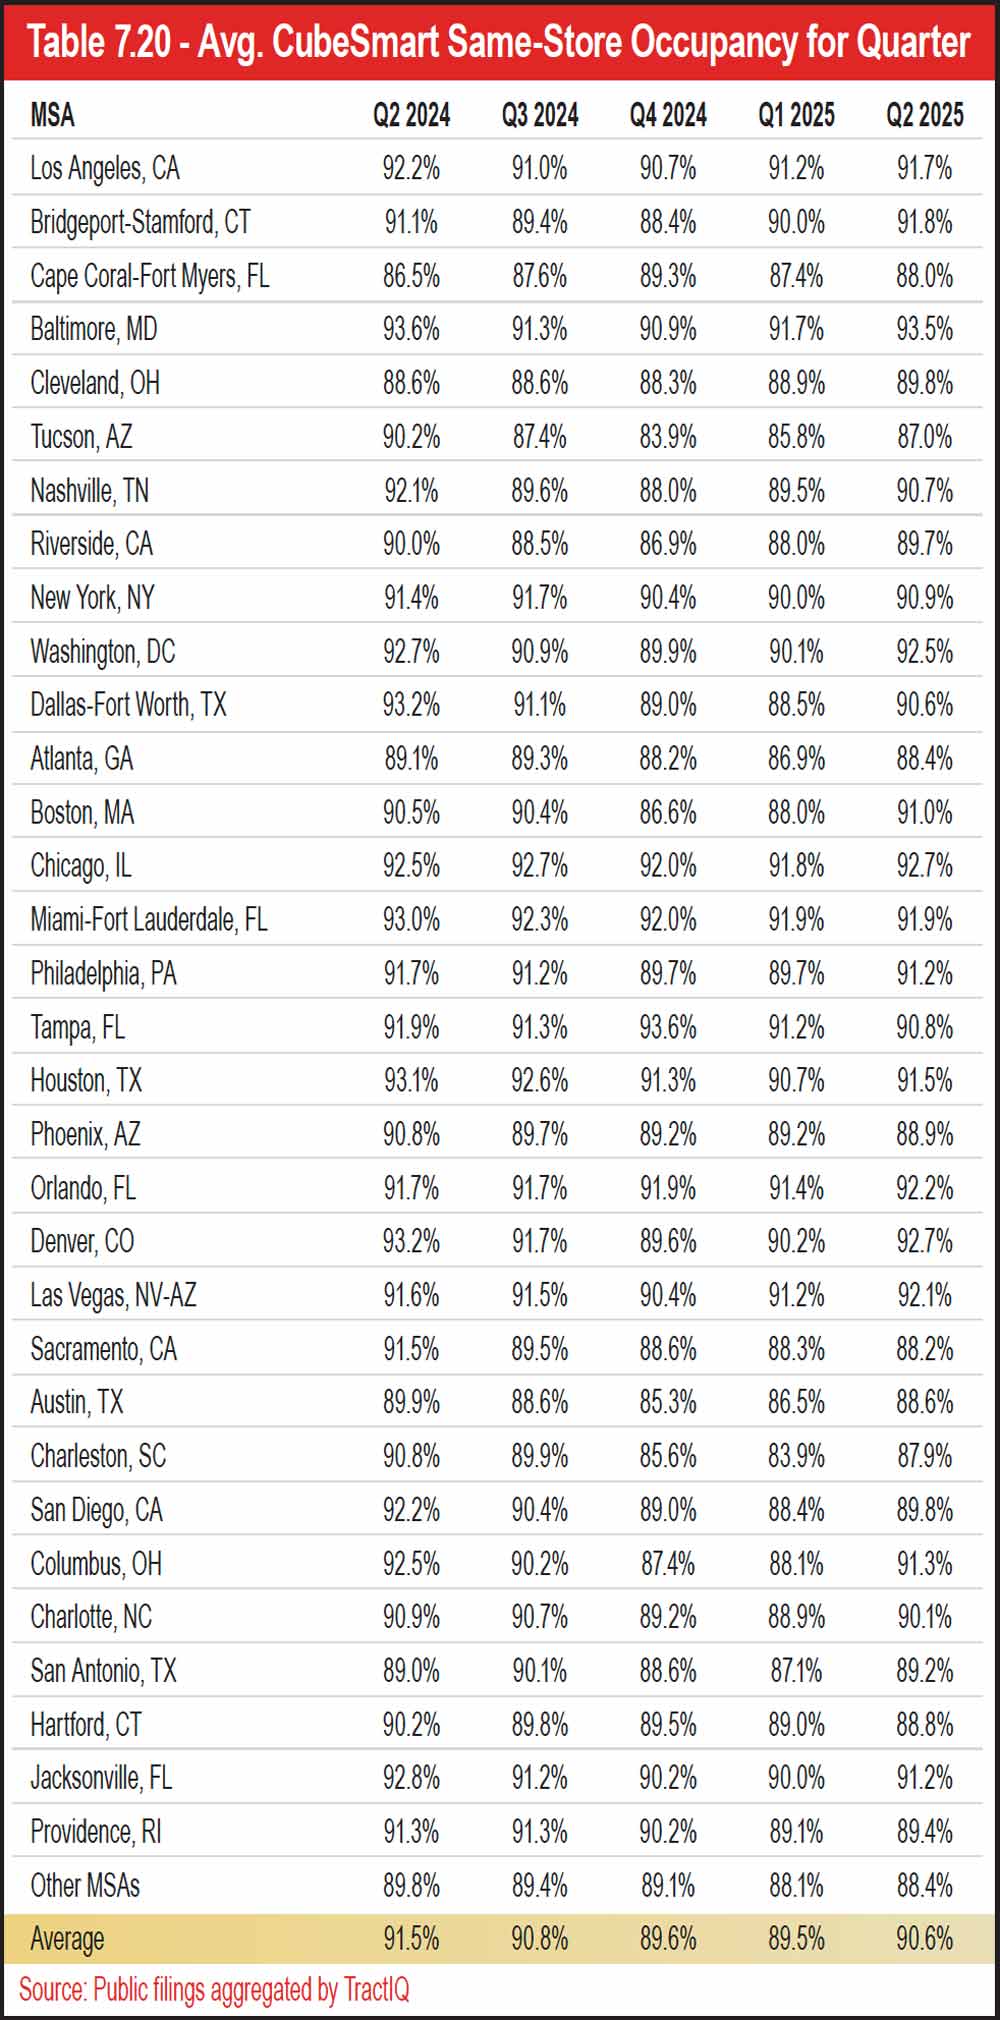
You will notice that CubeSmart reported an overall occupancy rate of 89.6 percent in Q4 2024 and 89.5 percent in Q1 2025. This was the first-time same-store occupancy for CubeSmart dipped below 90 percent since 2015. This puts into perspective how challenging of a time it is for the self-storage industry currently. As of Q2 2025 however, occupancy is back up above 90 percent, a good indicator. The MSA that had the lowest reported occupancy for CubeSmart was Tucson, Ariz., at 87.0 percent. The MSA with the highest reported occupancy for CubeSmart was Baltimore, Md., at 93.5 percent, as of Q2 2025.
See Table 7.20.
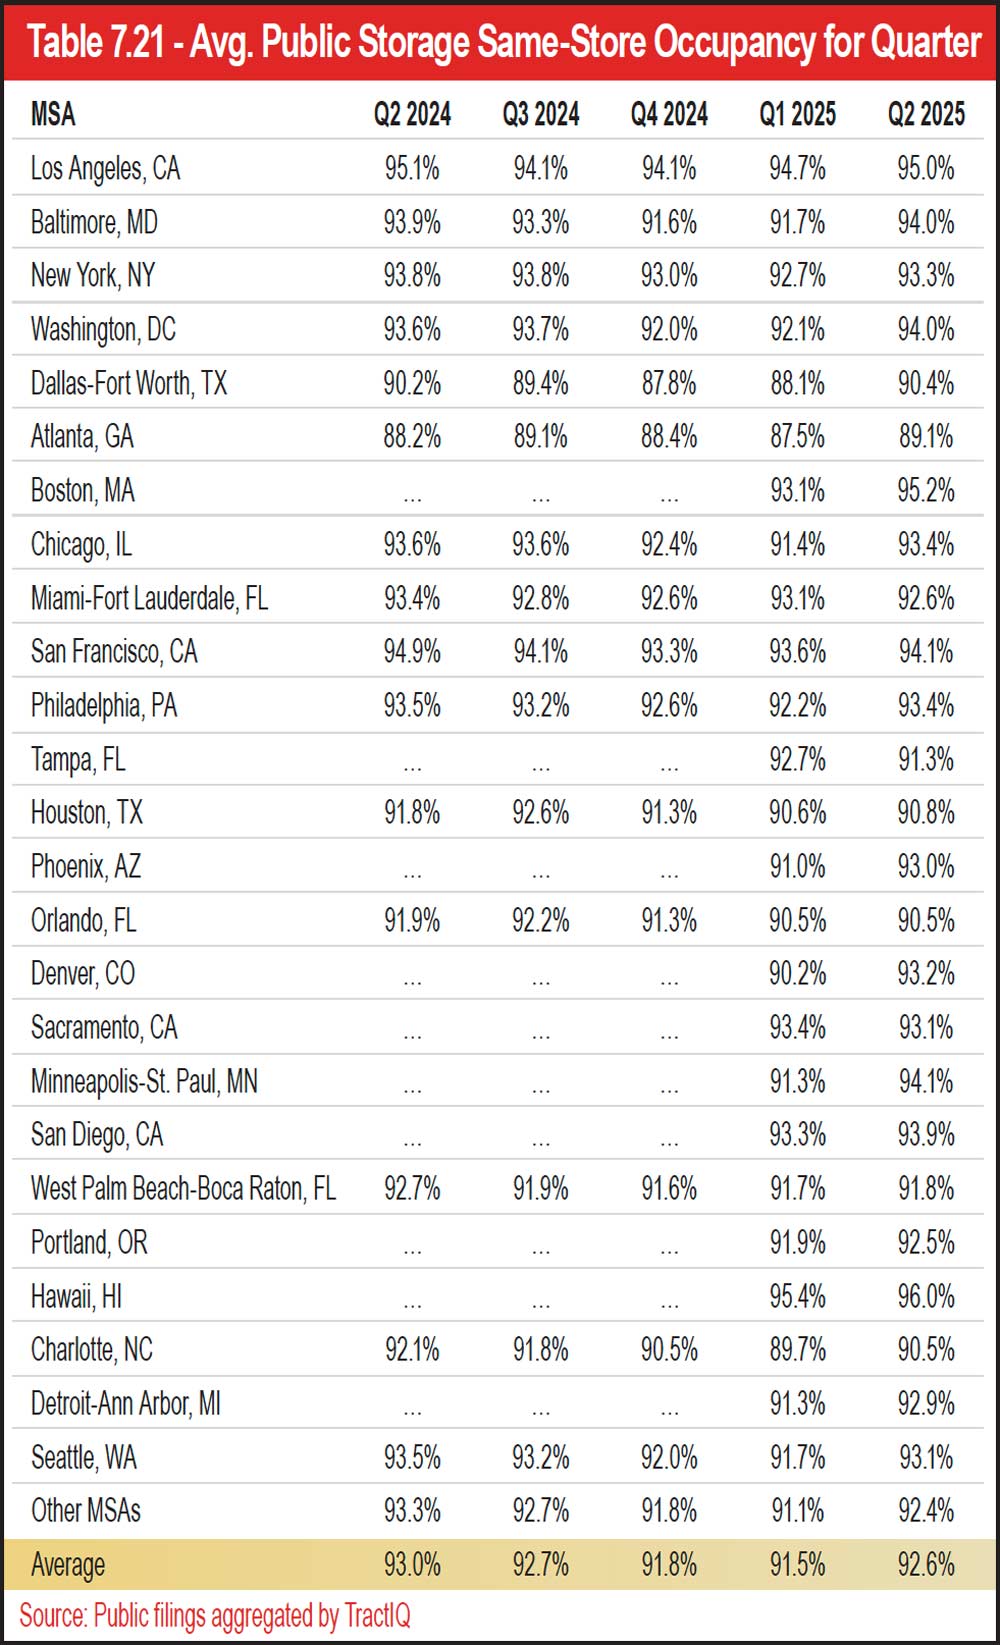
See Table 7.21.
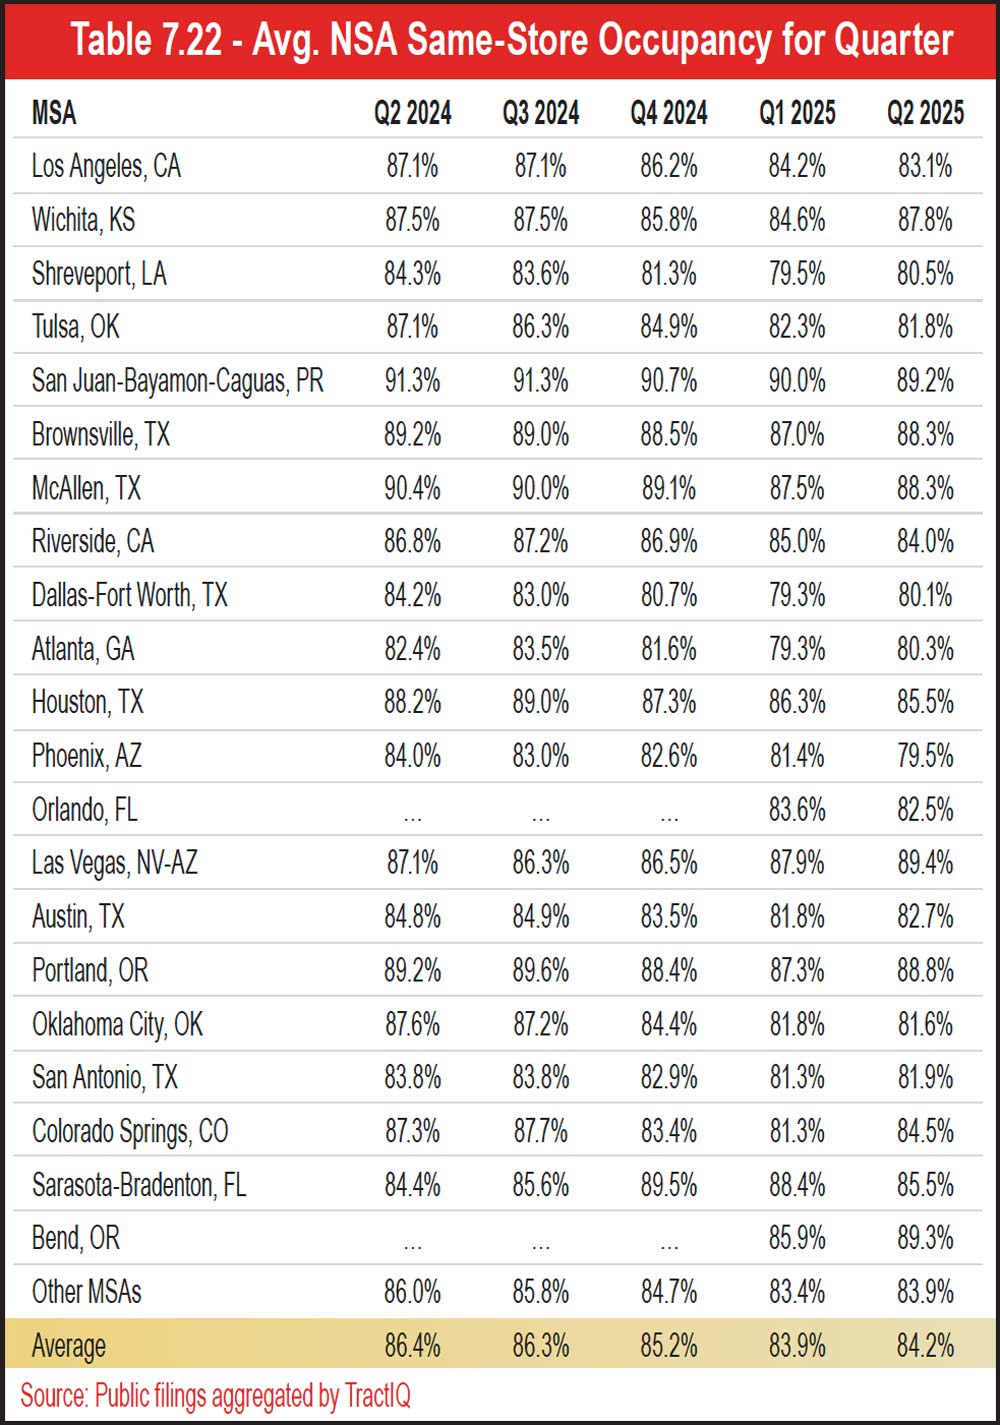
Similar to CubeSmart, occupancy in Q1 2025 for NSA was the lowest recorded since 2015, but it has since rebounded in Q2 2025. There was one MSA that reported occupancy lower than 80 percent for NSA as of the latest quarter: Phoenix, Ariz. The highest reported occupancy for NSA as of the latest quarter in the United States was the Bend, Ore., MSA at 89.3 percent.
See Table 7.22.





elf-storage is a fast-paced, seasonal business where customers typically sign monthly leases, which can be a double-edged sword. Self-storage operators often increase customer rental rates as the demand for storage grows within a market. This responsiveness helps operators capture revenue quickly in times of strong demand. On the flip side, as demand weakens or prices increase too much, customers can leave at a moment’s notice.
Due to the monthly nature of the self-storage business, rental rates vary widely at the facility level, let alone within a submarket. Tracking rental rate trends can provide valuable insights when it comes to self-storage supply and demand. Before diving into the insights these rental rates can provide, let’s define some key terms that are foundational to understanding self-storage pricing dynamics:
- Web Rates – The rates advertised online, often discounted to attract price-sensitive shoppers. These typically include short-term promotional pricing.
- Street Rates – The street rate for a particular unit is the rate that a customer would be charged if they were to walk in off the “street” and rent a unit in person at the facility. Given that customers are less likely to price-shop in this scenario, the street rate is typically higher than the web rate.
- In-place or Achieved Rates – The actual rates paid by existing tenants, which can exceed both web and street rates due to regular existing customer rent increases (ECRIs) after the initial promotional period.
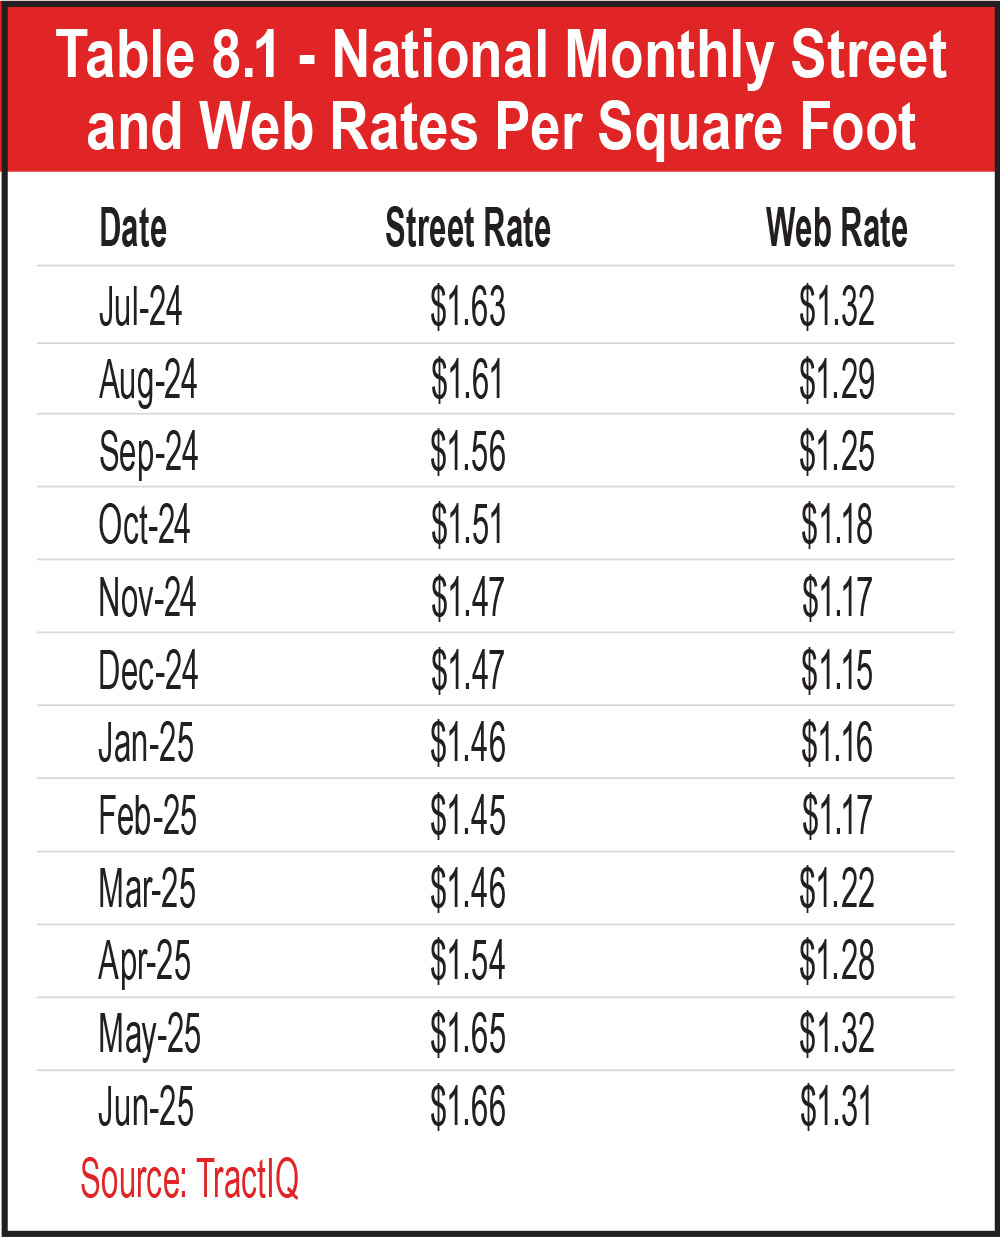
See Table 8.1.
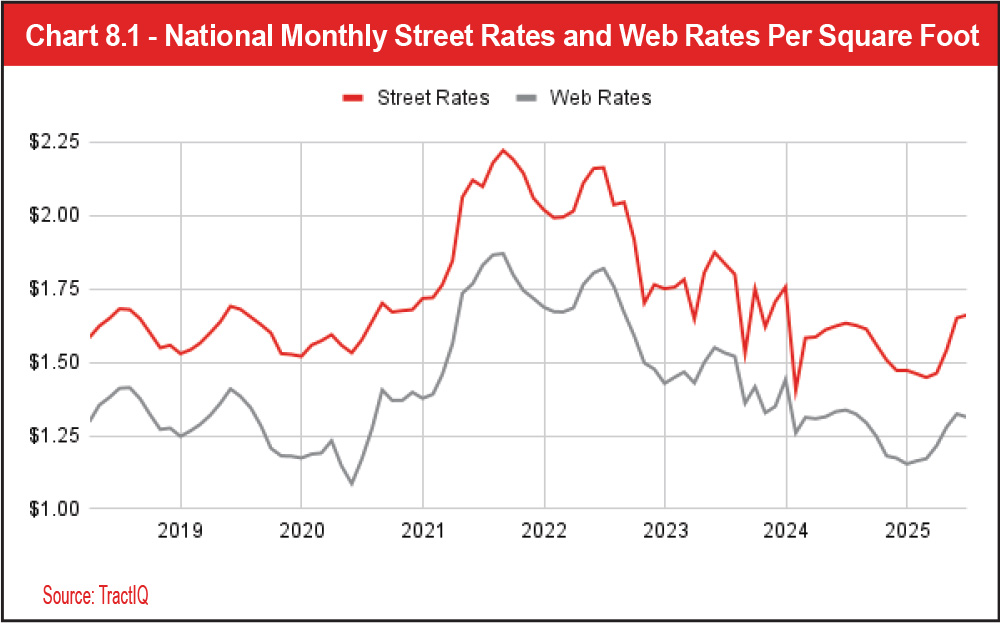
See Chart 8.1.
Year-over-year growth in Chart 8.2 has been positive for street rates four out of the last 12 months. From 2023 to 2024, street rate growth was positive only one month out of the 12-month period. From 2022 to 2023, there weren’t any months with positive year-over-year street rate growth. This suggests pricing power is improving and the magnitude at which rates are declining is leveling out. Even though street rates are seeing some improvement, you will notice from Chart 8.3 that web rates are still declining year over year across the board. Web rates have not had a positive year-over-year growth month since December 2023. However, like street rates, the magnitude at which web rates are declining is leveling out. This data suggests that operators are still heavily discounting rates to attract customers. It appears web rates and street rates are finding their footing in a market environment that still lacks demand.
See Charts 8.2 and 8.3.
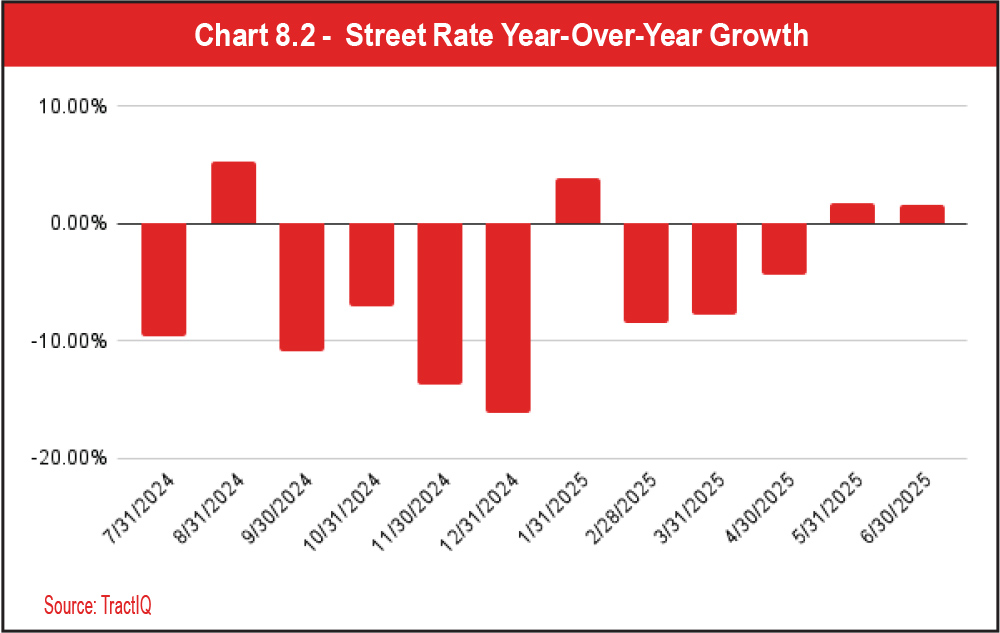
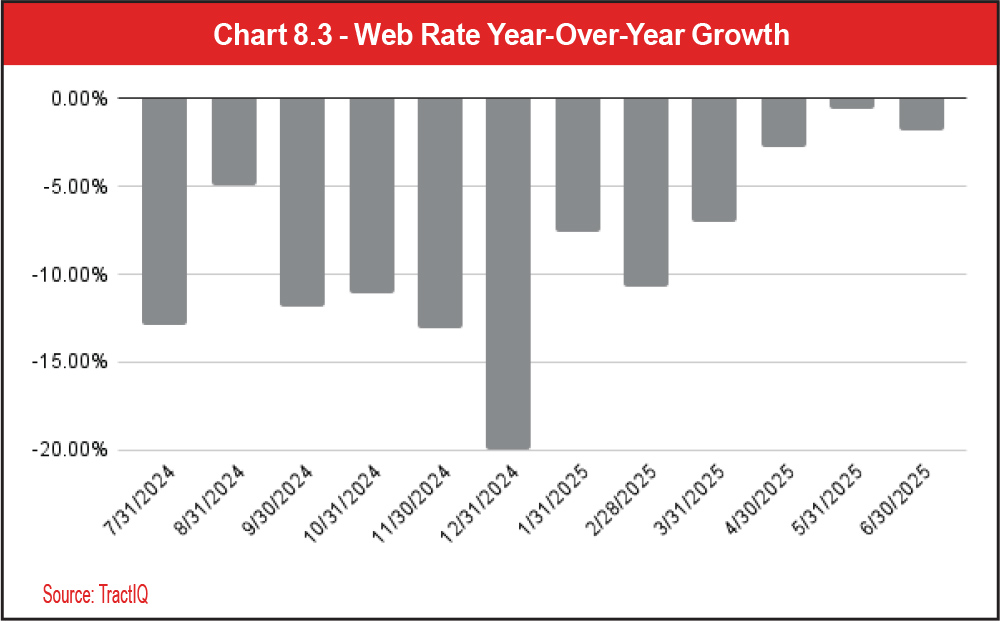
See Chart 8.4 and Table 8.2.
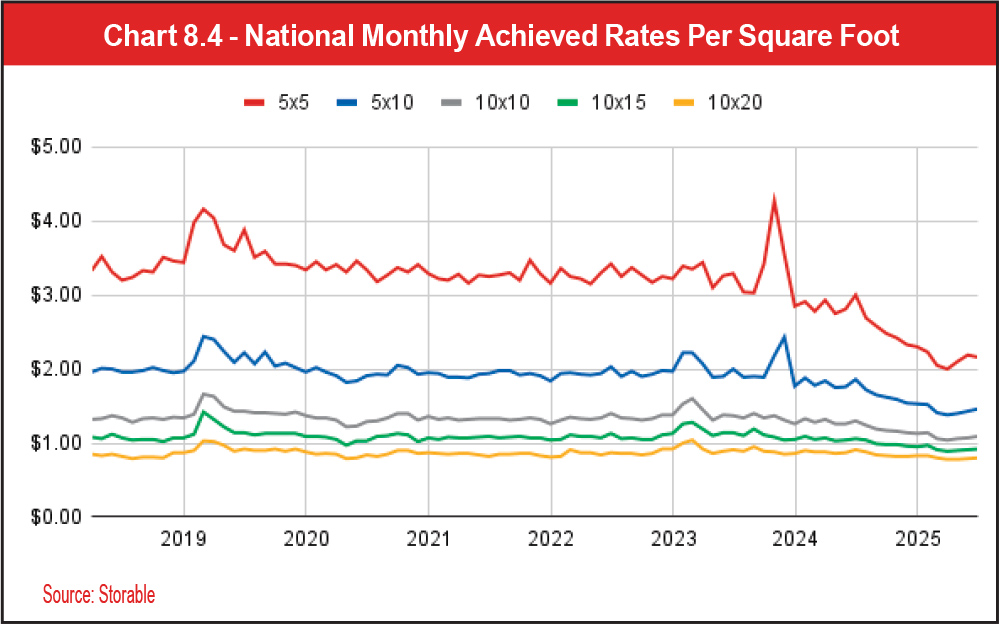
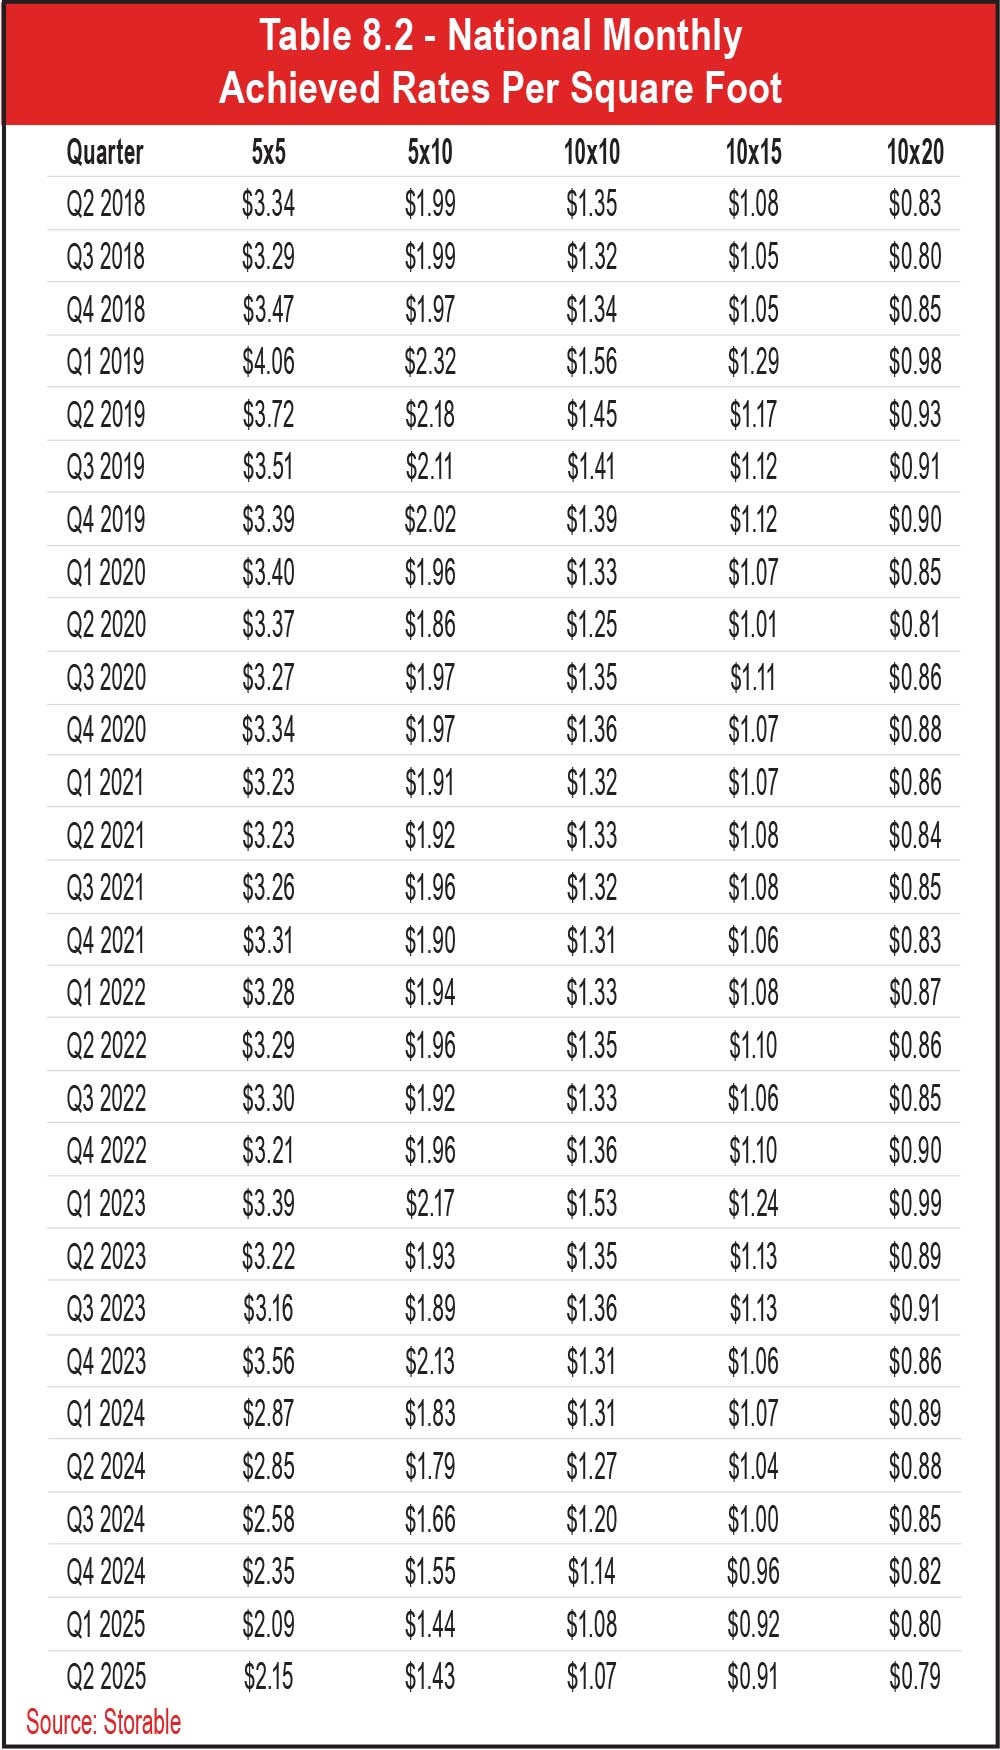
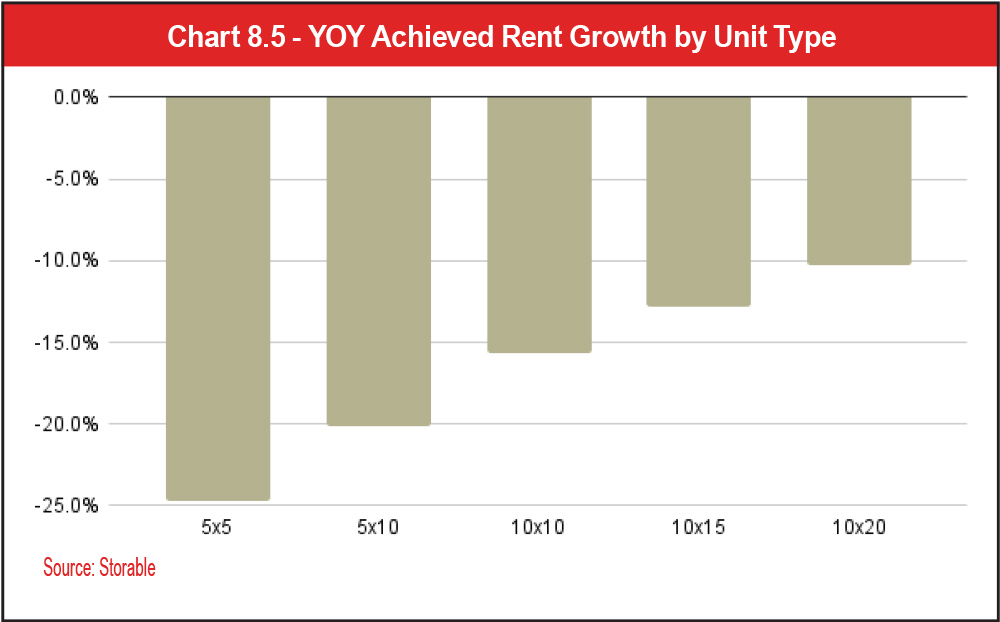
See Chart 8.5
You can see the relationship between street rates and achieved rates in Charts 8.6, 8.7, 8.8, 8.9, 8.10, and 8.11. Please note that this data represents non-REIT managed facilities. You will notice that the street rates for some unit sizes are better predictors of achieved rates than other unit sizes. For example, for 5-by-5 units, street rates have historically been below achieved rates. However, in Q2 2024 5-by-5 street rates went above achieved rates; the difference increased to 15.3 percent by Q2 2025. It appears that street rates and achieved rates have been relatively in line with one another for the 5-by-10 and 10-by-10 units since 2018. For larger unit sizes (10-by-15 and 10-by-20), street rates have historically remained above achieved rates. It is also interesting to note that street rates are above achieved rates for all unit sizes currently, when that hasn’t been the case historically for 5-by-5 and 5-by-10 units. This highlights the stark decrease in achieved rates across the board over the last year.
See Charts 8.6, 8.7, 8.8, 8.9, 8.10, and 8.11.
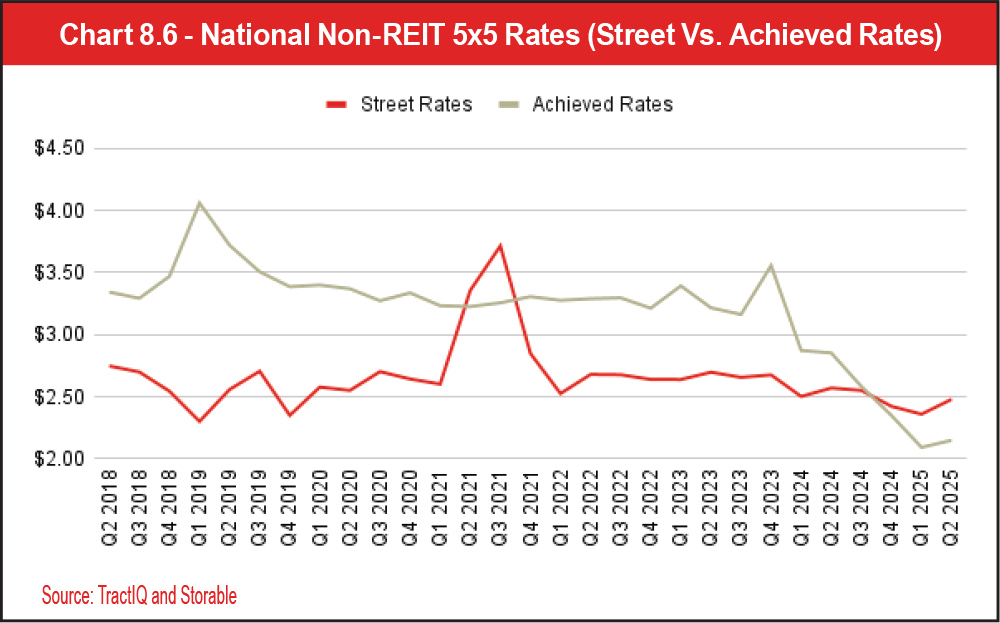
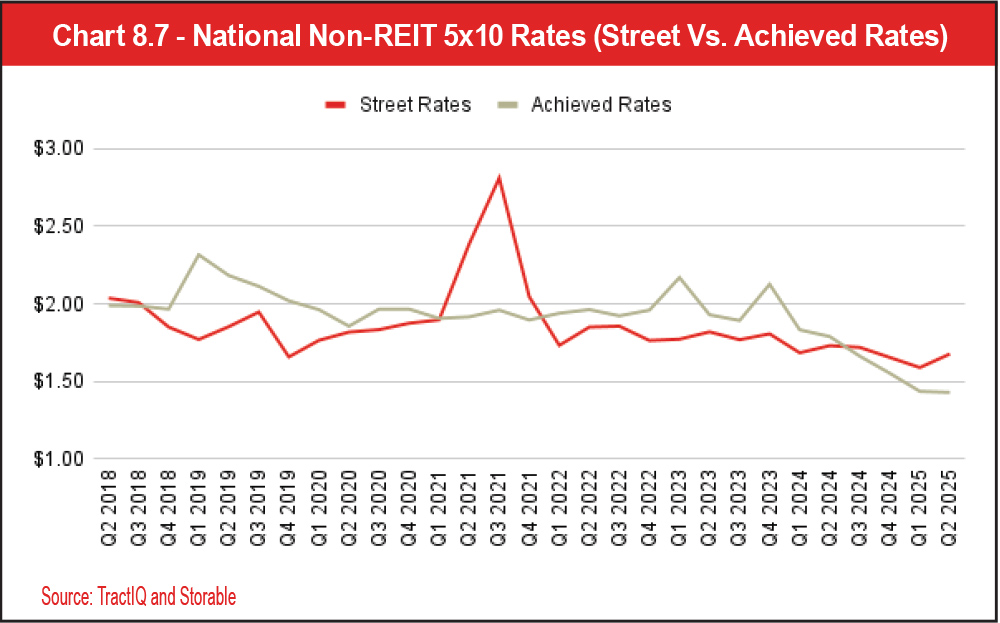
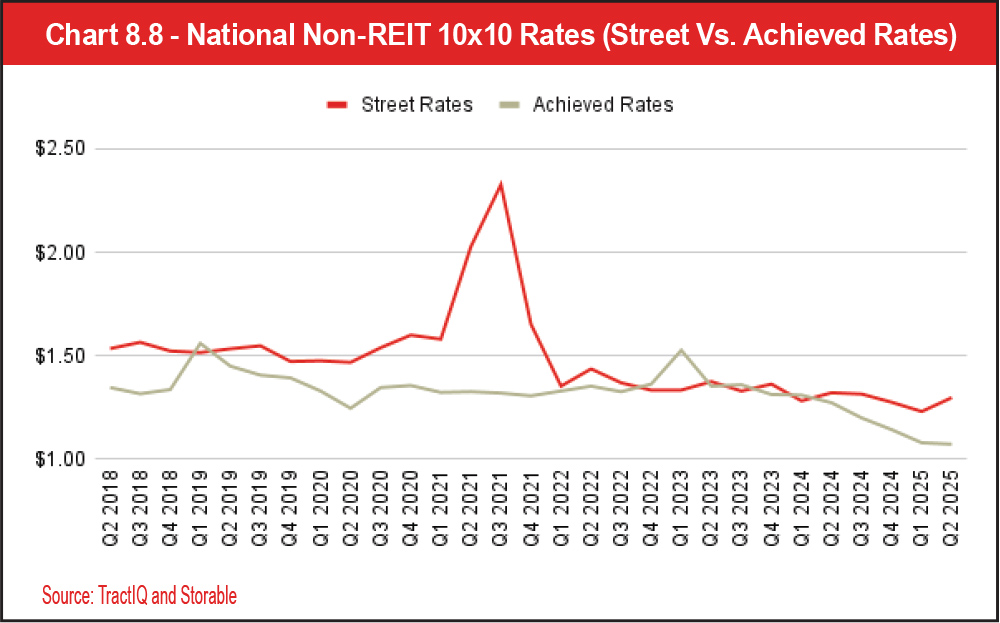
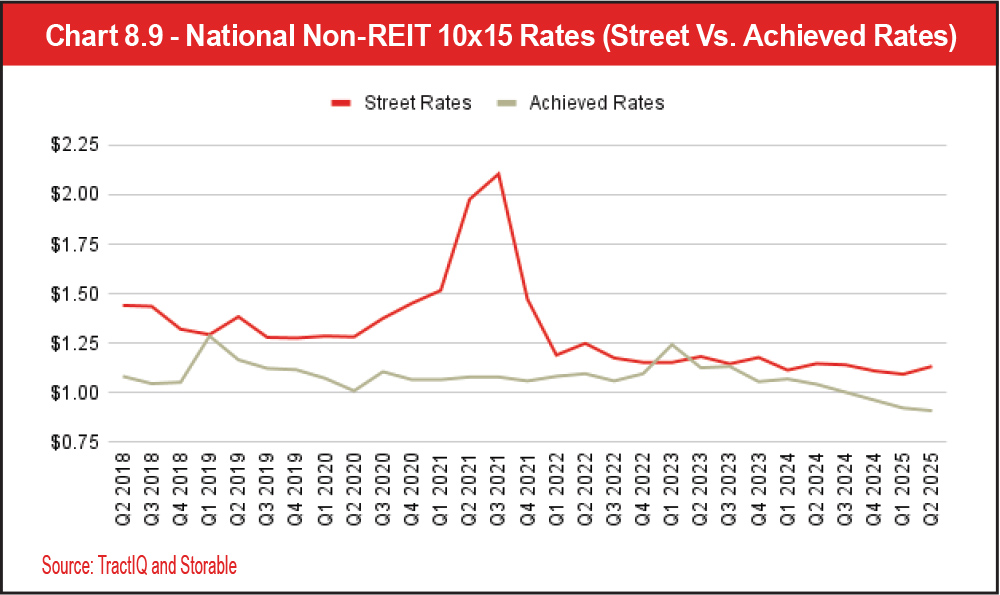
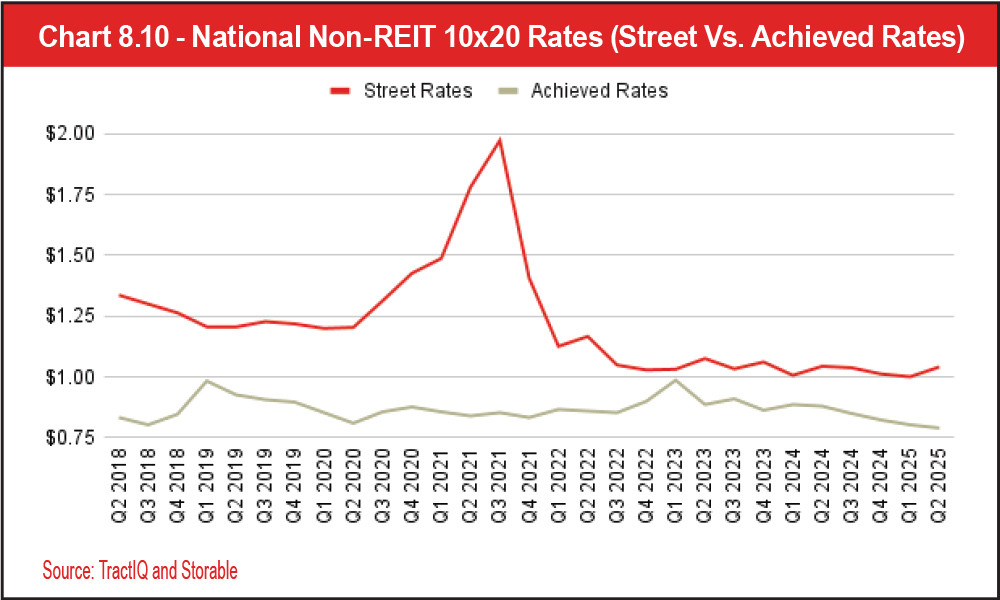
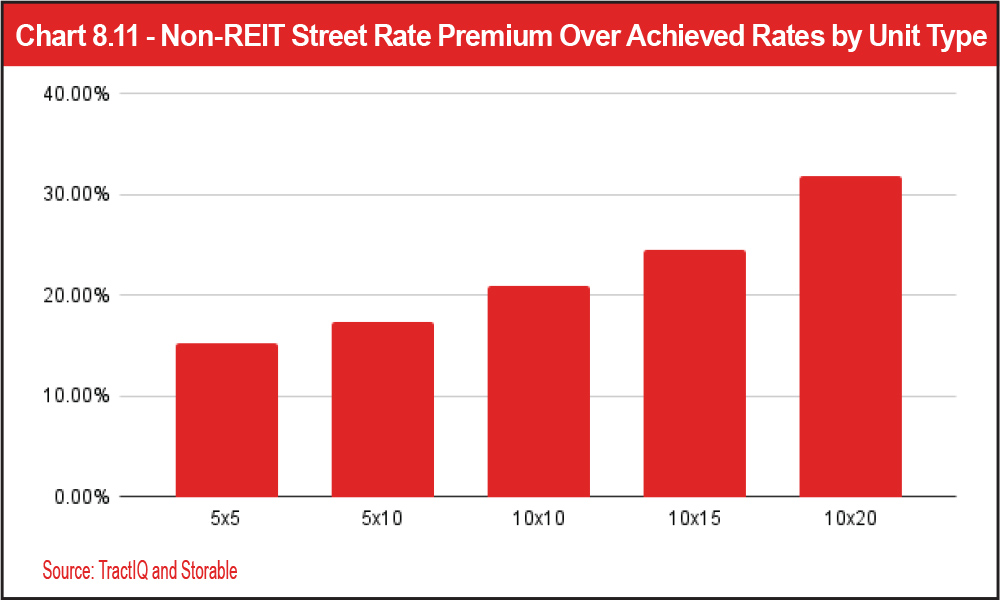
Another interesting observation from the charts is the delayed spike in achieved rates after an increase in street rates. As you can see from the data, street rates for all unit sizes started increasing in 2020, culminating at a peak in Q3 2021. Roughly 18 months later, a small increase in achieved rates can be observed in each of the charts. This may suggest to operators that it takes approximately 18 months for street rate changes to affect achieved rates. Understanding the relationship between street rates and achieved rates can provide valuable insights to storage professionals when analyzing deals, performing market analysis, or looking at advertised rates of competitors.
See Tables 8.3 and 8.4.
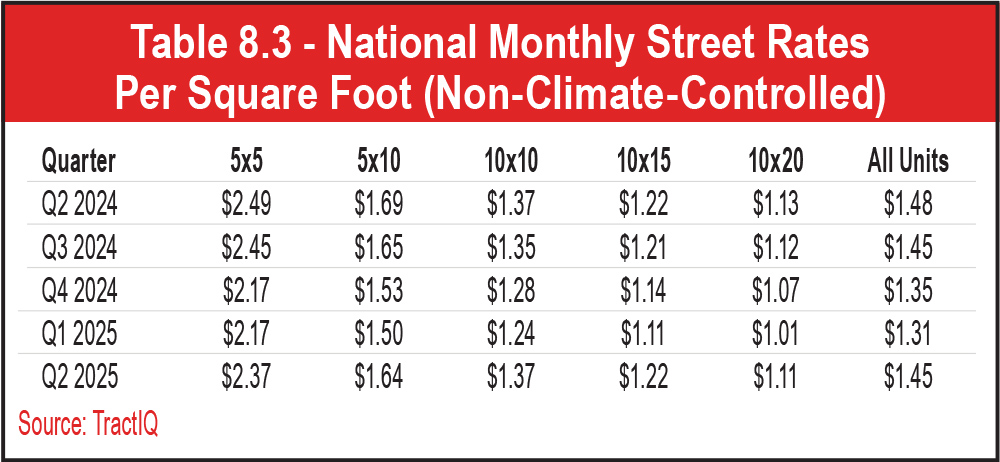
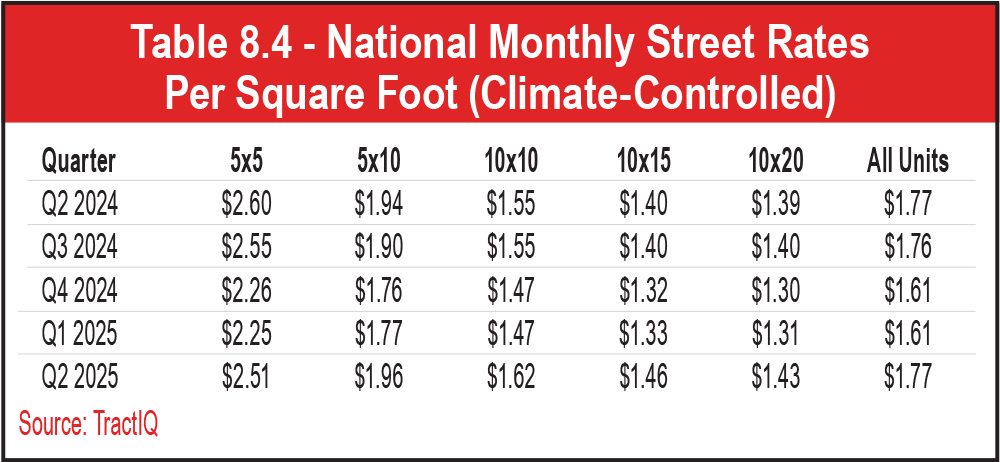
1. The year-over-year growth performance across all storage unit sizes is a mixed bag, with non-climate-controlled units experiencing a negative 1.97 percent year-over-year (YOY) growth overall and climate-controlled units experiencing a 0.07 percent YOY growth overall. This variability shouldn’t come as a surprise given the state of the self-storage industry over the last few years. The positive 0.07 percent YOY growth for climate-controlled units is actually the first positive growth recorded since Q2 2022. Non-climate-controlled units have also experienced weakness since Q2 2022. The only quarter since then where non-climate-controlled units experienced positive YOY growth was Q4 2023 (positive 1.32 percent YOY). Although non-climate-controlled units still experienced negative YOY growth in the latest quarter, the decline is modest and leveling out when compared to recent history. Overall, this could be a positive sign for the industry, suggesting pricing power may be strengthening for climate-controlled and non-climate-controlled units. Only time will tell if this slowdown in declining rental rates is a blip on the radar or an early sign of demand returning to the industry.
2. Climate-controlled units out-performed non-climate-controlled units over the last year. The popularity of climate-controlled storage has steadily grown over time. Customers more and more desire somewhere to store their precious belongings where they are safe from extreme temperatures. According to the SSA’s 2025 Self Storage Demand Study, more than 30 percent of renters are willing to pay extra for a unit that is air conditioned and where the humidity is controlled. On average, over the last 25 quarters, climate-controlled units have outperformed non-climate-controlled units from a year-over-year growth perspective 19 out of the 25 quarters.
3. Smaller units have suffered the most over the last year. The reason for this is difficult to pinpoint, but it may be due to oversupply. During the COVID-19 pandemic, a hot housing market led to record self-storage demand. However, supply chain issues as well as inflation raised construction costs and interest rates. Many of the new self-storage developments over the last two to three years have favored a unit mix with smaller unit sizes. This is because smaller units command a higher rent per square foot, which helps justify higher cost per square foot construction numbers as well as higher interest rates. Once the industry works through the COVID-era storage supply, we may see smaller unit pricing strengthen.
See Charts 8.12 and 8.13.
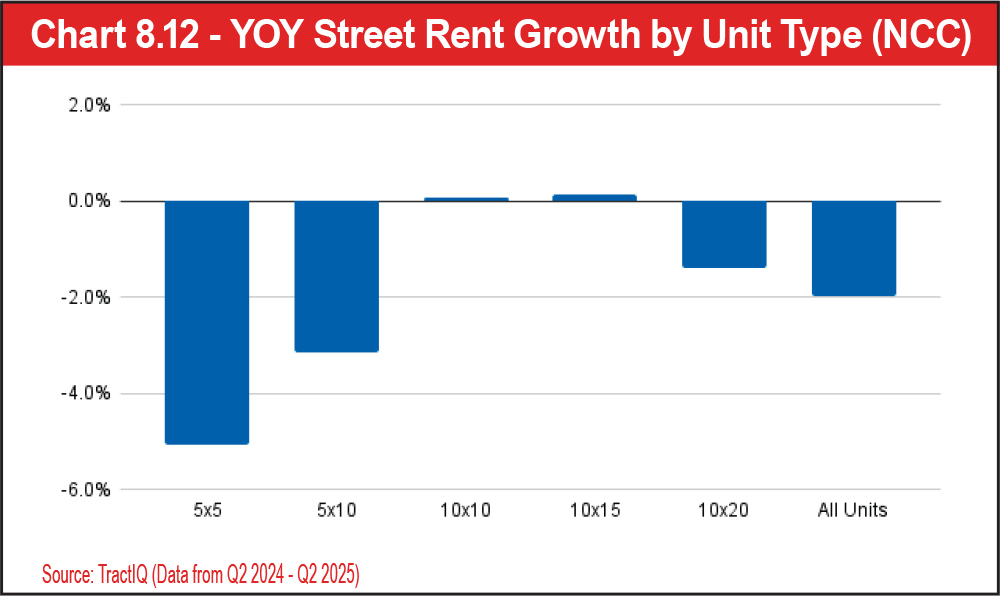
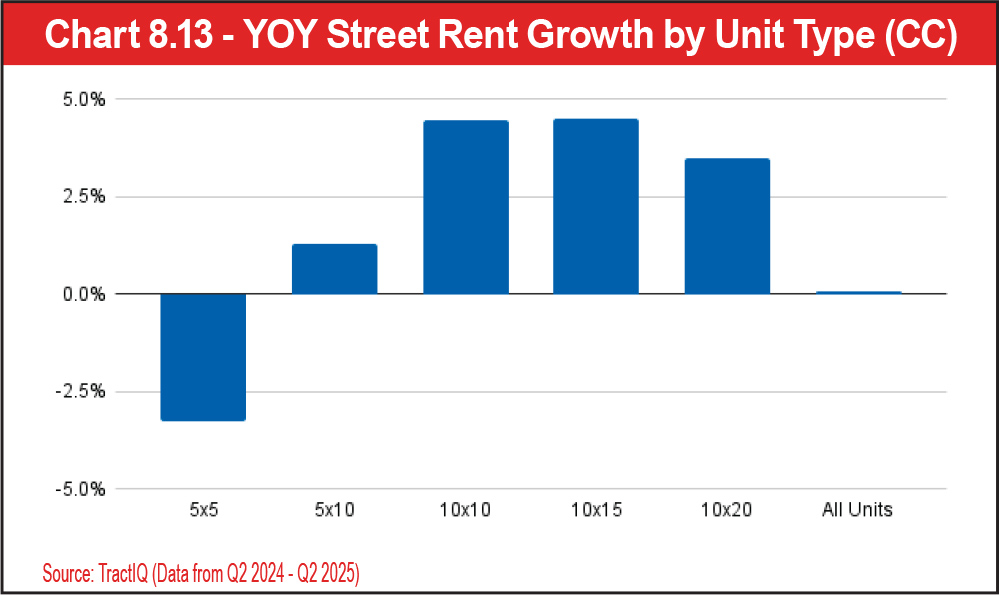
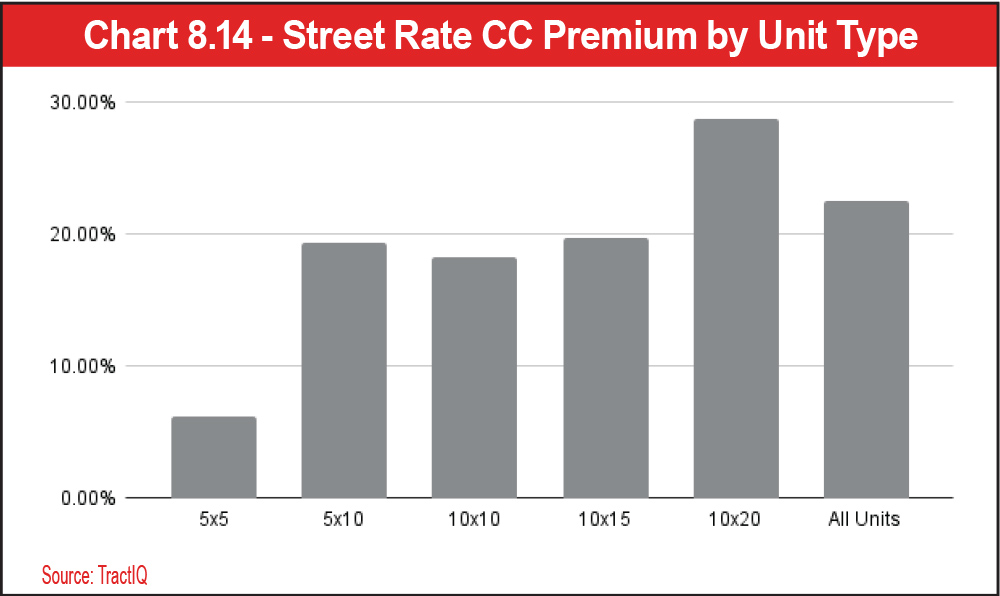
See Chart 8.14.
Items that benefit the most from climate-controlled protection tend to be large items such as furniture, appliances, and mattresses. It would be very challenging, or impossible, to fit a full-sized couch in a 5-by-5 unit. If a customer has multiple large items that need climate protection, the customer is left with no choice but to upgrade to a larger unit. In short, customers may see little value difference from a 5-by-5 that is climate controlled and a 5-by-5 that is not because what they are storing doesn’t need climate protection. Customers with larger, climate-sensitive items are willing to pay more to protect those items because they are more valuable, and customers don’t want to risk renting a unit with no climate protection.
Another reason larger units command a higher climate-controlled premium could be due to availability. According to TractIQ, only approximately 34 percent of 10-by-20 units are climate controlled. Compare this to the 5-by-5 unit size, where roughly half of units are climate controlled. A lower supply of large climate-controlled units creates higher demand, rates, and premiums.
In addition, Charts 8.15, 8.16, 8.17, 8.18, and 8.19 show that rental rates for both climate-controlled and non-climate-controlled units are lower than, or very close to, 2018 rental rate levels. The elevated rental rates in 2021 to 2022 were due to high demand from the COVID-19 pandemic. Since then, rates have steadily decreased from lack of demand and increased supply. From Q4 2024 to Q2 2025, rental rates for all unit sizes and climate types have increased. Is this a return to regular seasonality? Or is this truly an early sign of returning demand to the industry? It will be interesting to see in 2026 and beyond if rental rates continue to decline, flatten, or increase.
See Charts 8.15, 8.16, 8.17, and 8.18.
See Tables 8.5 and 8.6.
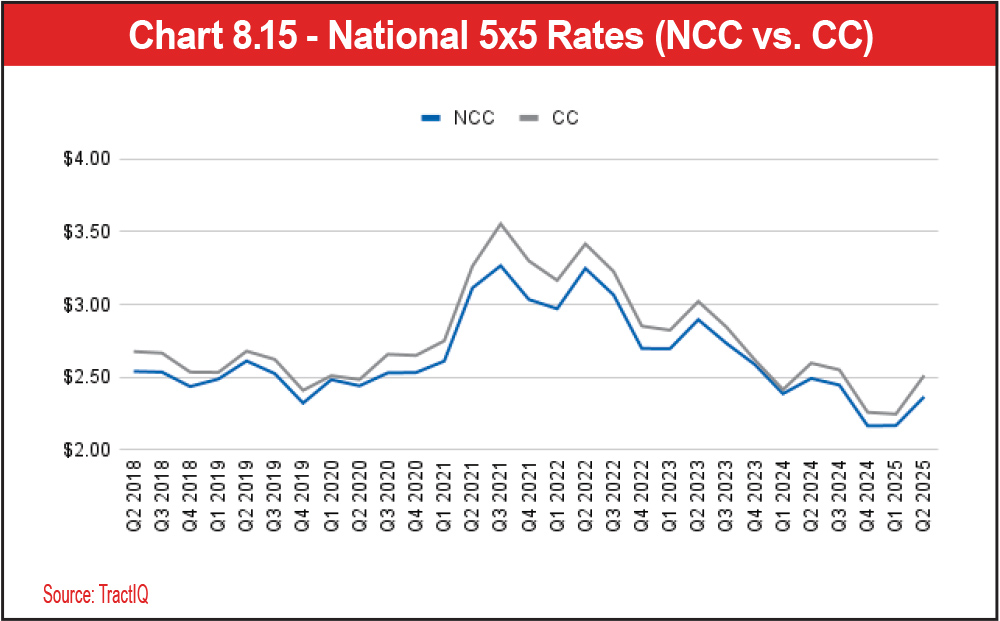
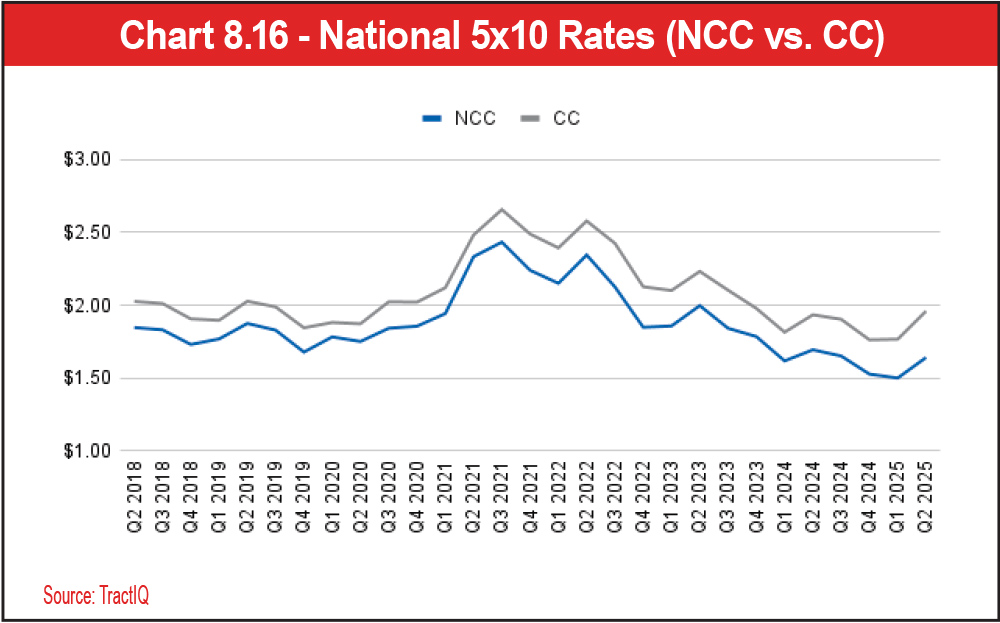
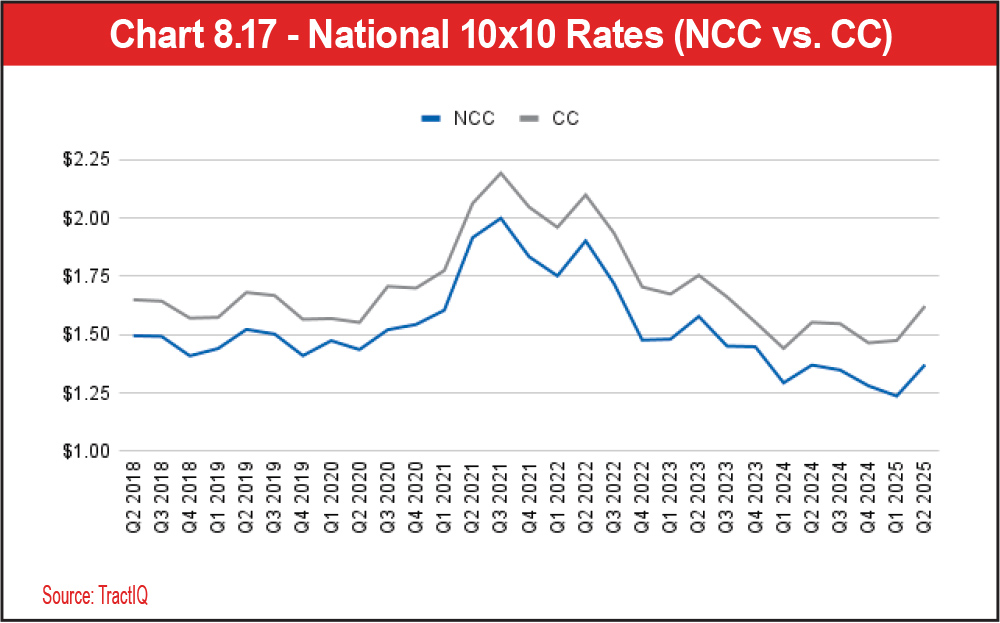
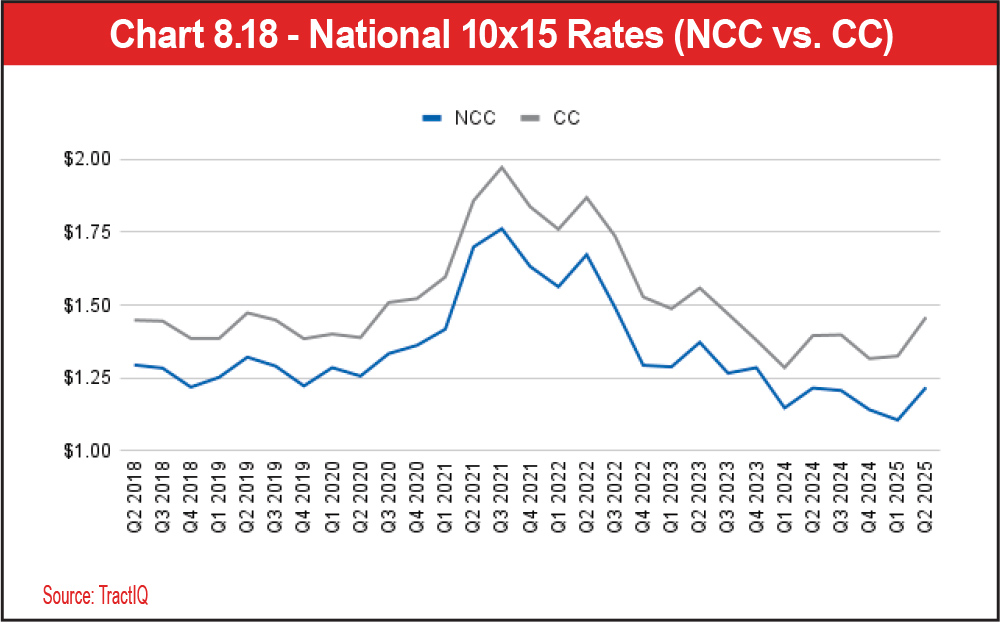
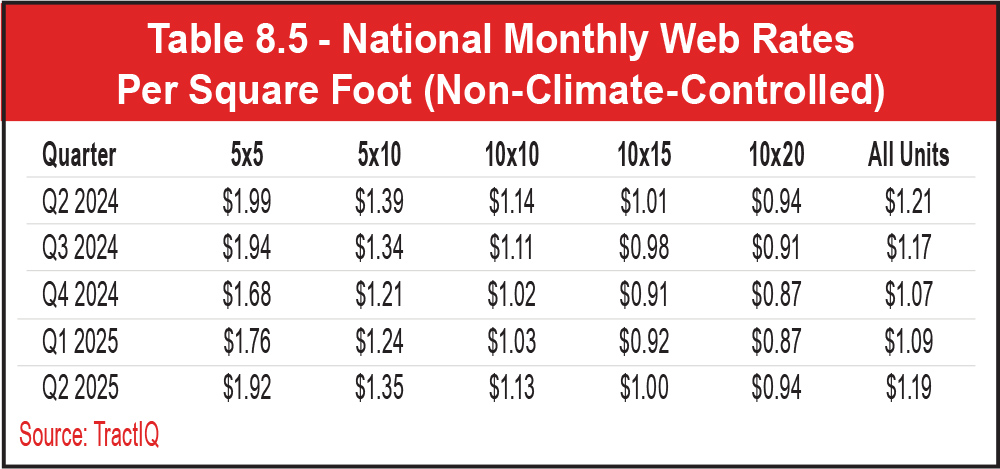
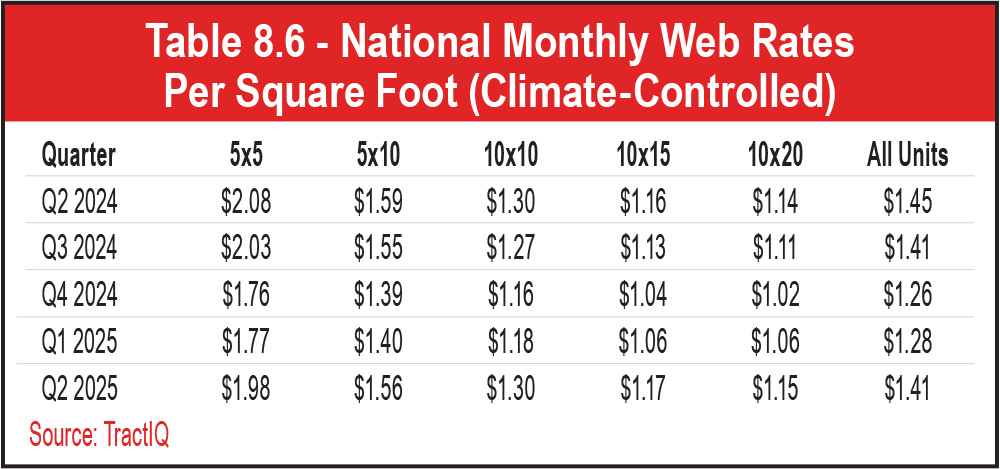
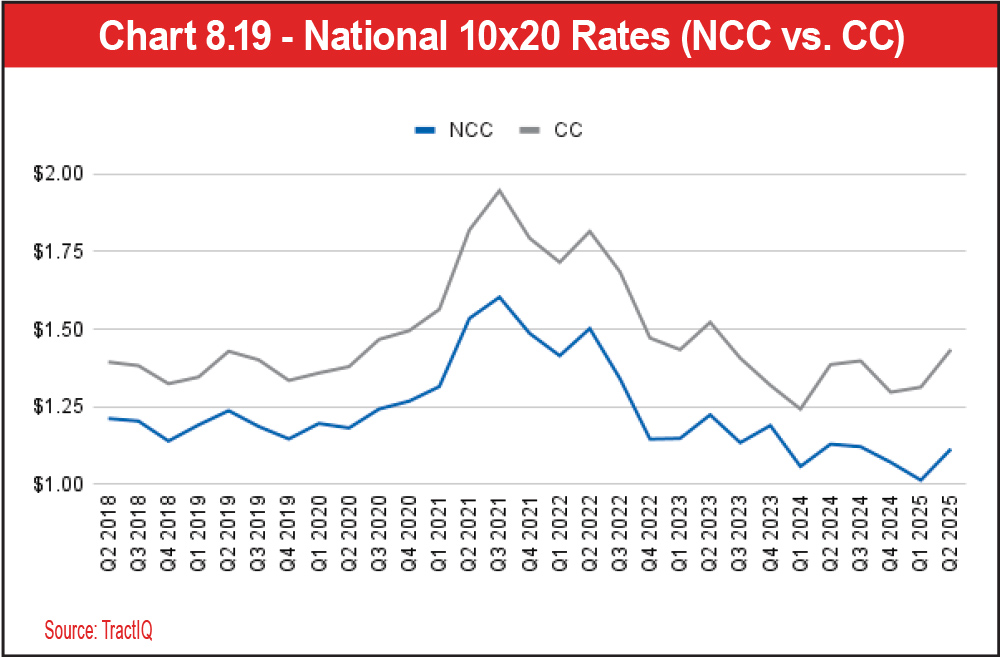
See Charts 8.20 and 8.21.
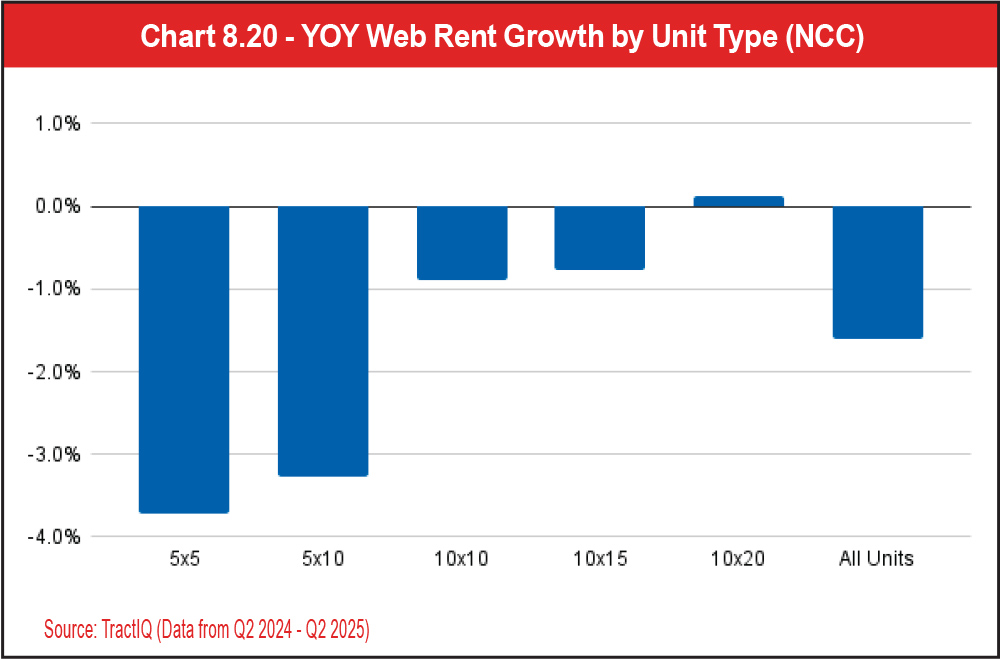
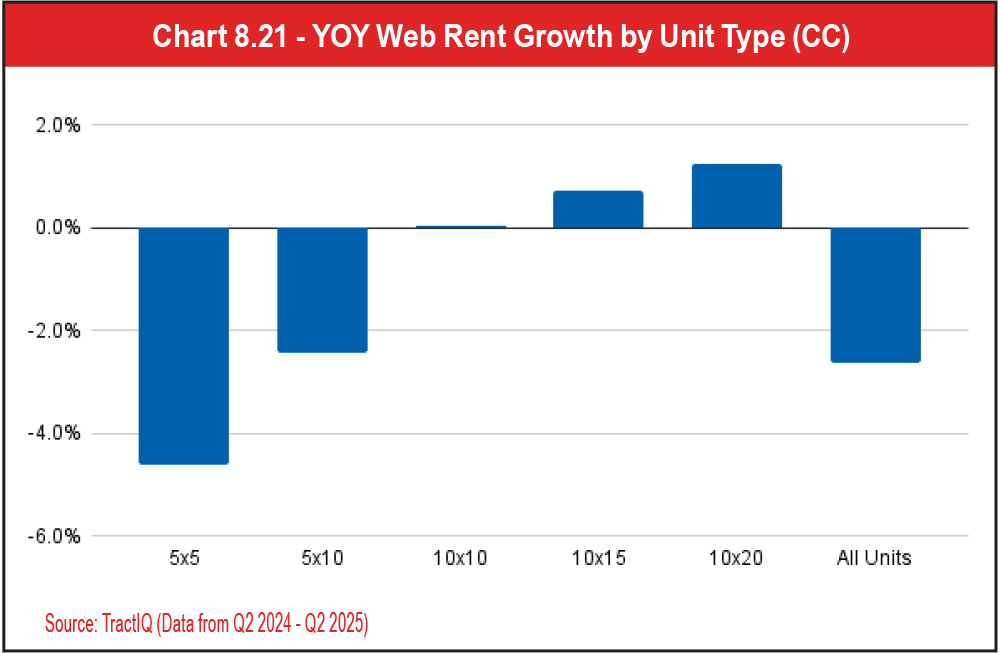
See Table 8.7 and Chart 8.22.
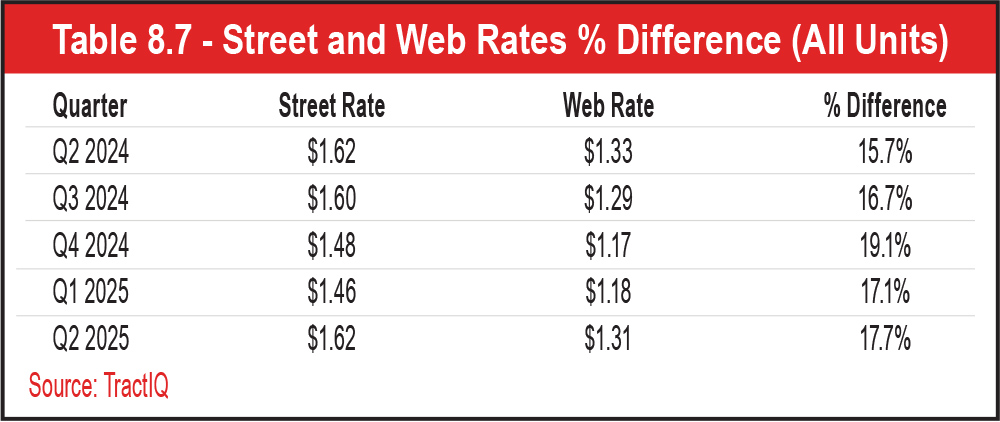
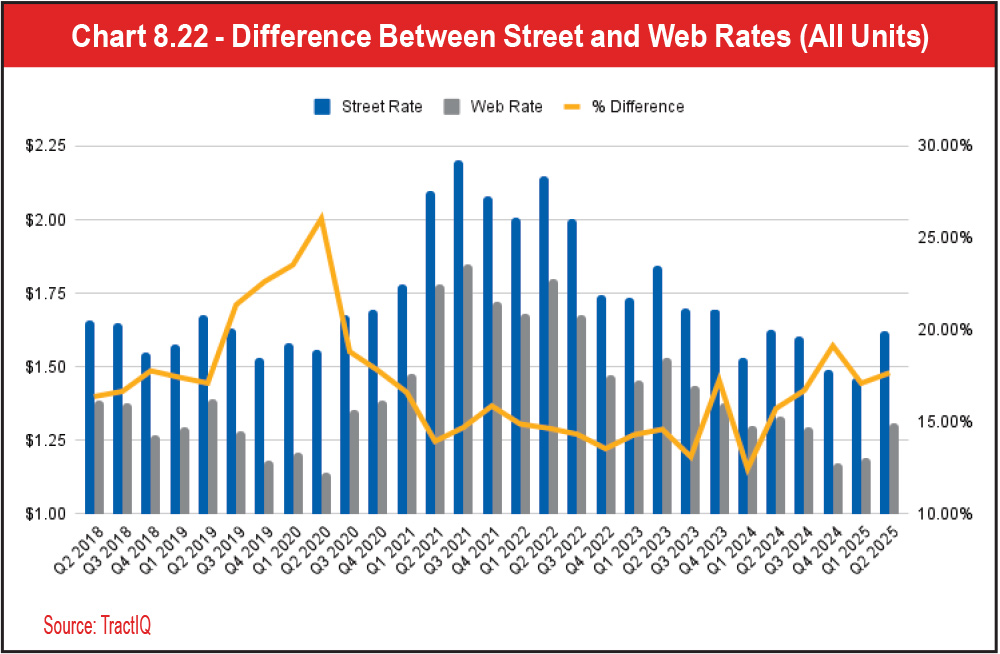
See Chart 8.22.
Things changed in late 2020 when demand for self-storage significantly increased due to the COVID-19 pandemic. During this time, people relocated from populous city centers to suburban areas. Interest rates were also extremely low (3.0 percent by September 2021 according to the National Association of Realtors), making it more affordable to change residences. According to the SSA’s 2025 Self Storage Demand Study, moving is a major demand driver for self-storage. Thirty percent of renters from the study who have short-term rental needs indicated they use storage because they are moving. As a result of lower interest rates and migration from city centers during COVID, demand for self-storage skyrocketed.
Evidence of this can be seen in Chart 8.22. You can see discounting started to decrease in late 2020 (yellow line). Because demand was high, operators gained more pricing power and did not have to discount web rates as much to attract customers. Operators seized the opportunity in 2021 by raising street rates approximately 35 percent and reducing discounting to below 15 percent at the peak.
Since 2022, the self-storage industry has been negatively impacted by oversupply, increasing interest rates, and falling home sales. Because the market was so “hot” from 2020 to 2022, developers were justified in building more self-storage due to high demand. According to the U.S. Census Bureau, self-storage construction spending of $6.9 billion in 2023 marked a 24 percent increase over 2022. Oversupply creates more competition between operators and shifts pricing power to the customer. The difference between street rates and web rates has been elevated since 2023, reaching nearly 20 percent in Q4 2024. As of Q2 2025, discounting is still elevated at 17.7 percent, up slightly from Q1 2025 (17.1 percent). Although street rates and web rates increased from Q1 2025 to Q2 2025, these rates are still at 2018 to 2019 levels. The discounting trend is a good indicator of demand and the state of the industry. It will be interesting to see if discounting stays elevated or starts to decrease in 2026 and beyond.
See Tables 8.8, 8.9, and 8.10.
See Chart 8.23.
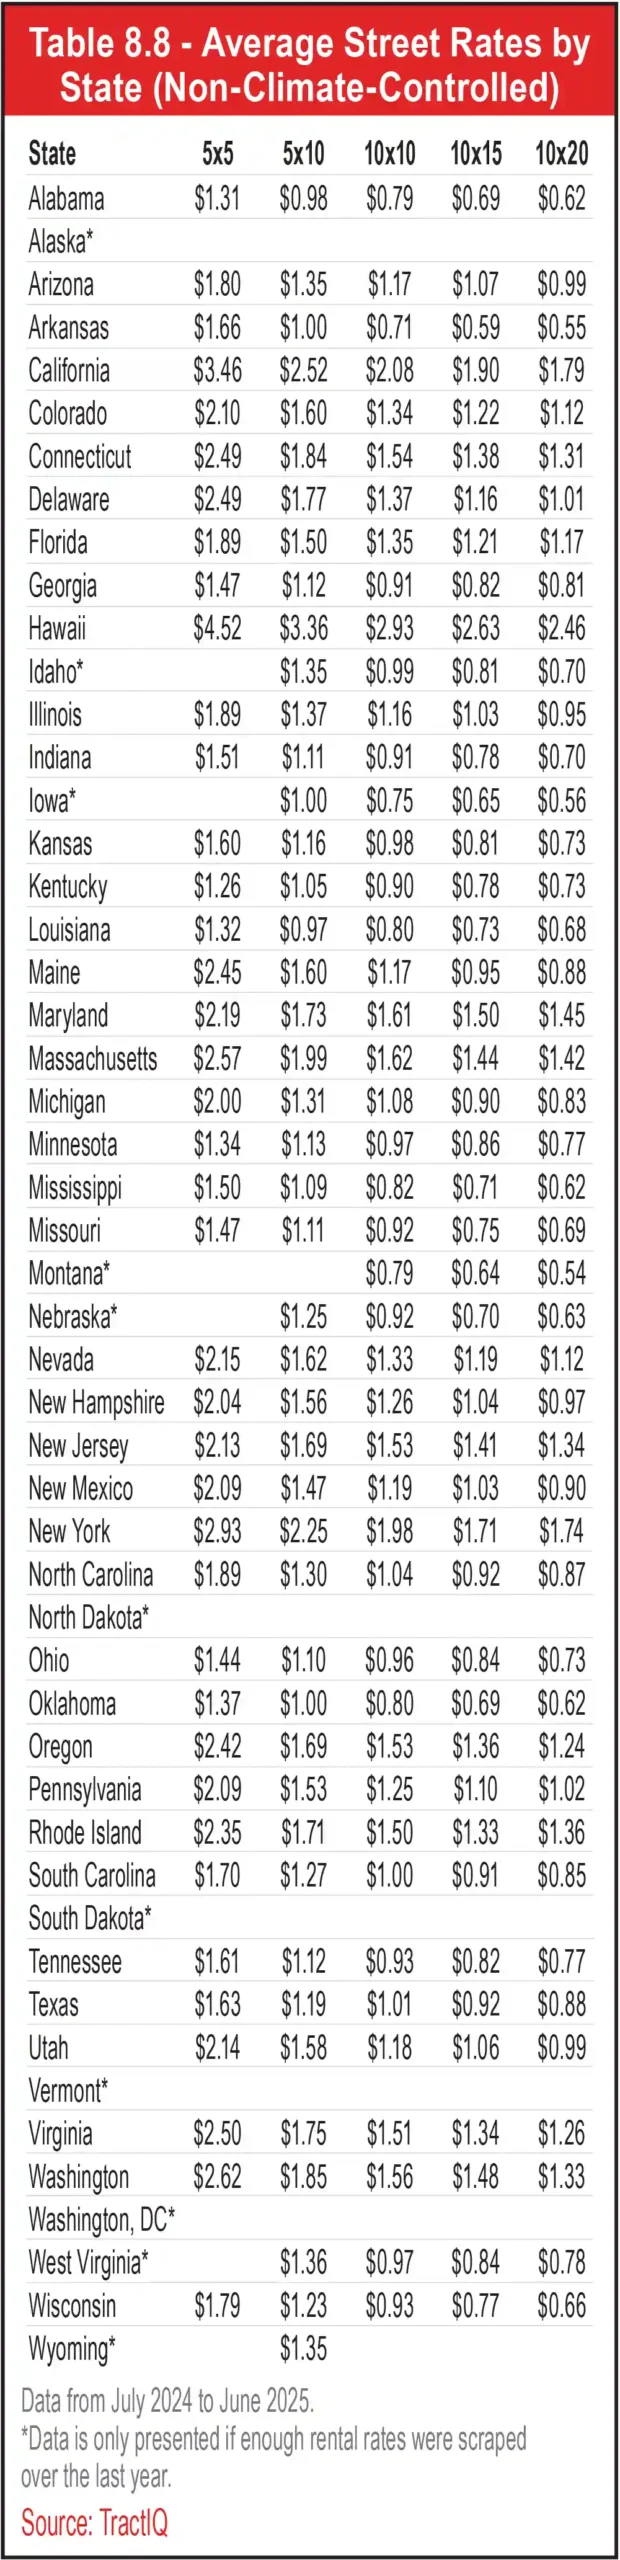
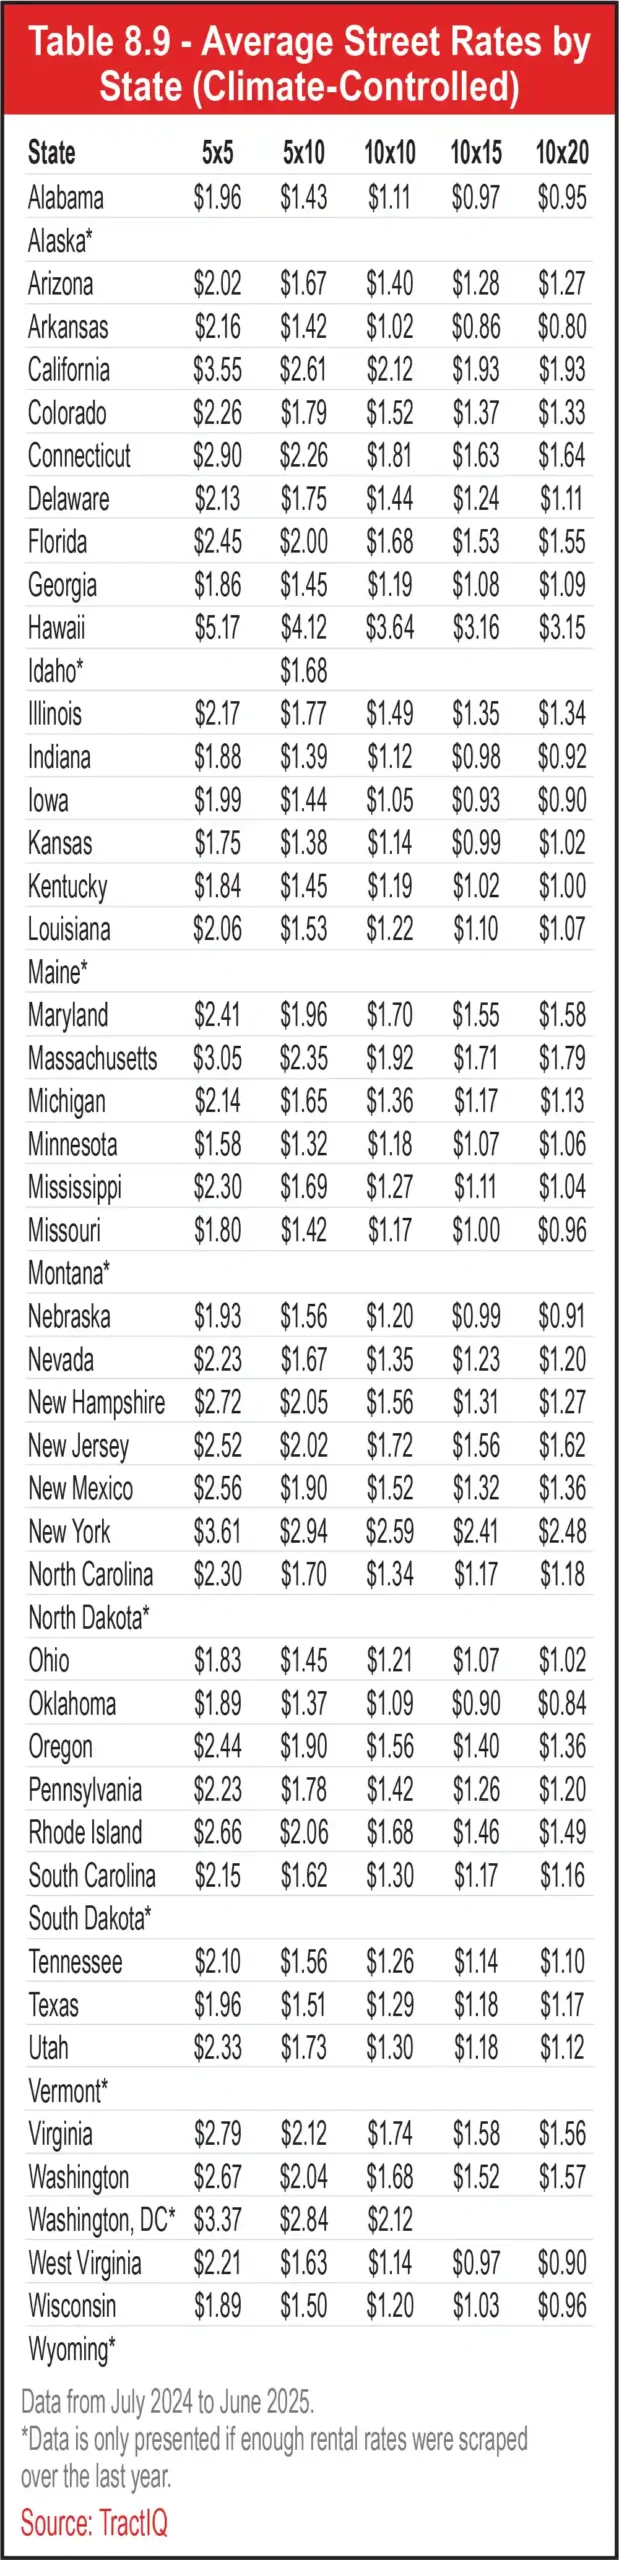

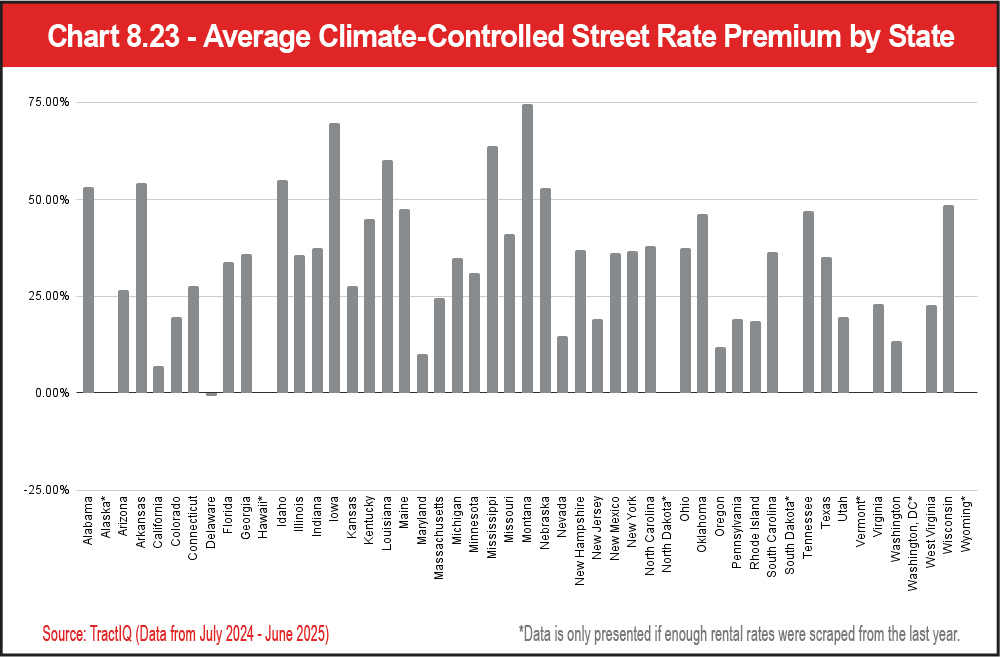
It is no surprise that high humidity states or states with extreme temperatures top the charts for the highest climate-controlled premium. These states include Alabama, Arkansas, Idaho, Iowa, Louisiana, Mississippi, Montana, and Nebraska. States that have the lowest climate-controlled premium include California, Delaware, Maryland, Nevada, and Oregon, likely due to lower temperature and/or humidity extremes. Interestingly, Delaware (-0.81 percent) is the only state where non-climate-controlled units are commanding higher prices than climate-controlled units, on average over the last year.
As discussed earlier in this section, street rate year-over-year growth has been a mixed bag across unit sizes and climate types. As you can see in Table 8.11 and Chart 8.24, states also were a mixed bag of YOY rental rate growth for non-climate-controlled units. However, the following states experienced the most positive non-climate-controlled rental rate growth year over year:
- New Mexico (up 11.1 percent)
- Nebraska (up 8.1 percent)
- Louisiana (up 6.2 percent)
- Oregon (up 5.9 percent)
See Table 8.11 and Chart 8.24.

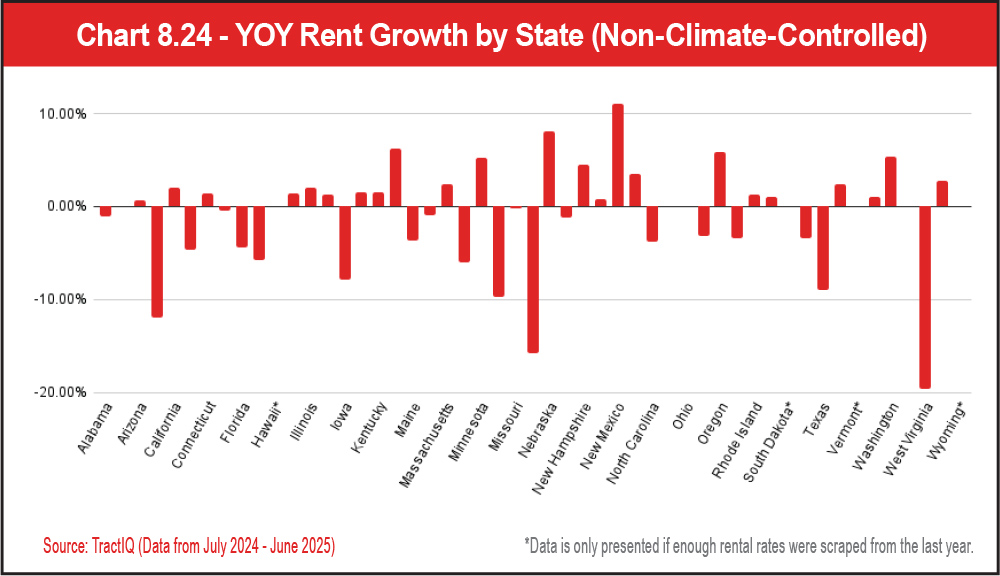
- Louisiana (up 22.8 percent)
- Minnesota (up 14.4 percent)
- Delaware (up 14.3 percent)
- Illinois (up 12.0 percent)
A few states that top the charts for the biggest year-over-year decline in climate street rates include Nevada (down 7.0 percent), Montana (down 6.9 percent), and Arkansas (down 6.7 percent). You will also notice in Table 8.11 that the state with the highest average non-climate-controlled street rate per square foot was California at $2.30. The state with the lowest average non-climate-controlled street rate per square foot was Iowa at $0.72. In Table 8.12, the state with the highest average climate-controlled street rate per square foot was New York at $2.84. The state with the lowest average climate-controlled street rate per square foot was Arkansas at $1.13.
See Table 8.12 and Chart 8.25.

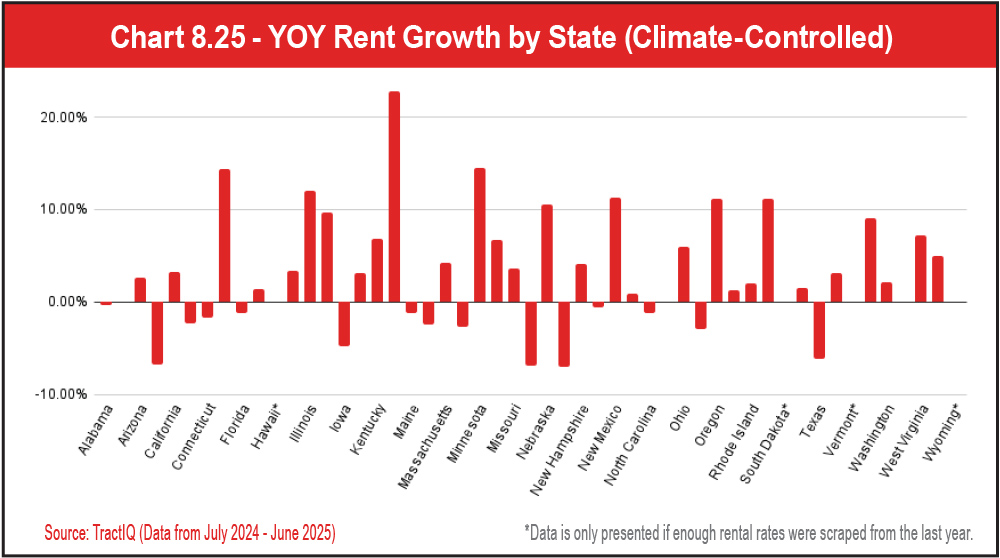
Tables 8.13 and 8.14 show average street rates for non-climate-controlled and climate-controlled units by MSA over the last year. We have included data on the top 25 MSAs and then an additional “All Other MSAs” category. Table 8.15 and Chart 8.26 show the climate-controlled street rate premium for each MSA. As mentioned previously, this data represents how much more operators and owners are able to charge customers on move-in (street rates) for a climate-controlled unit versus a non-climate-controlled unit.
See Tables 8.13, 8.14, and 8.15.
See Chart 8.26.
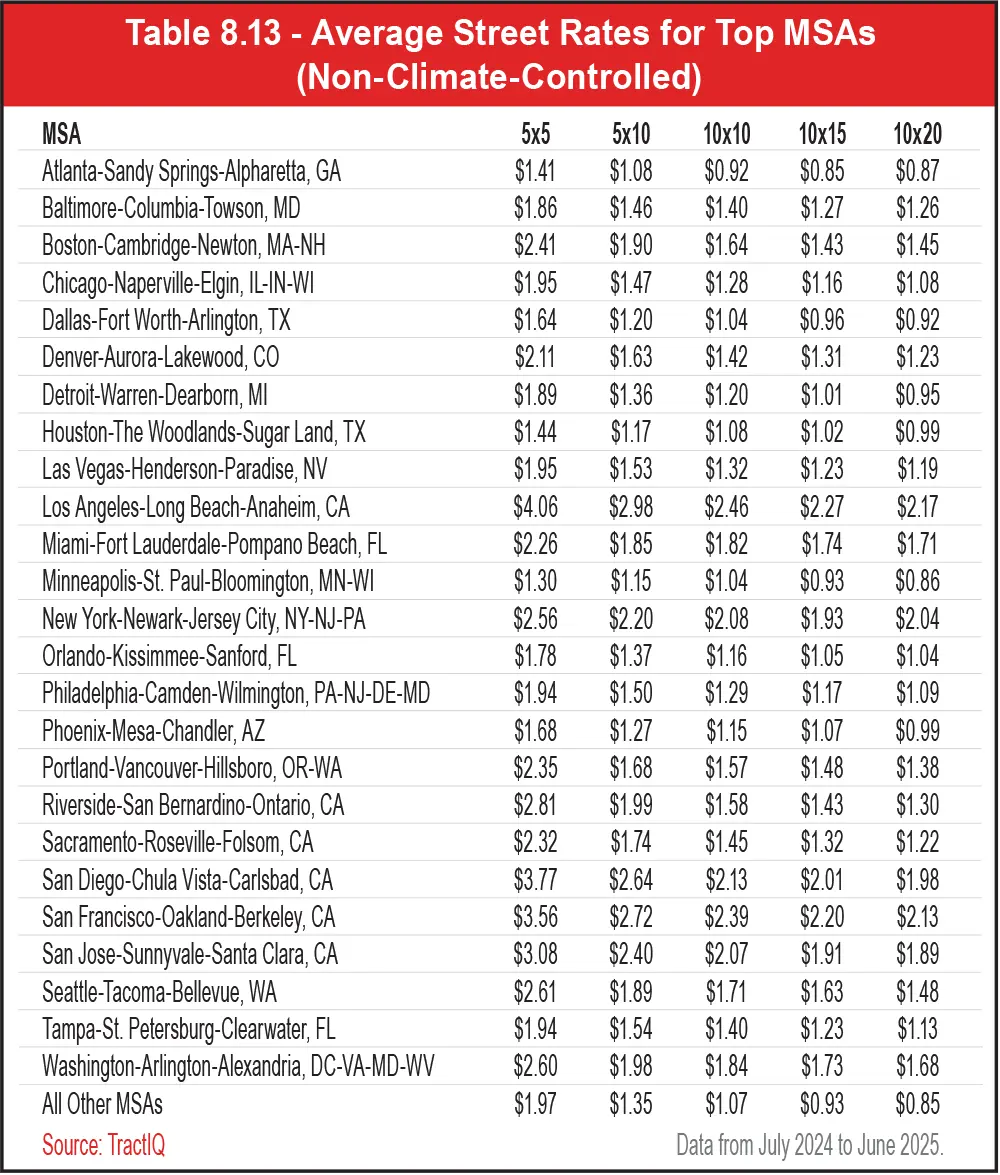
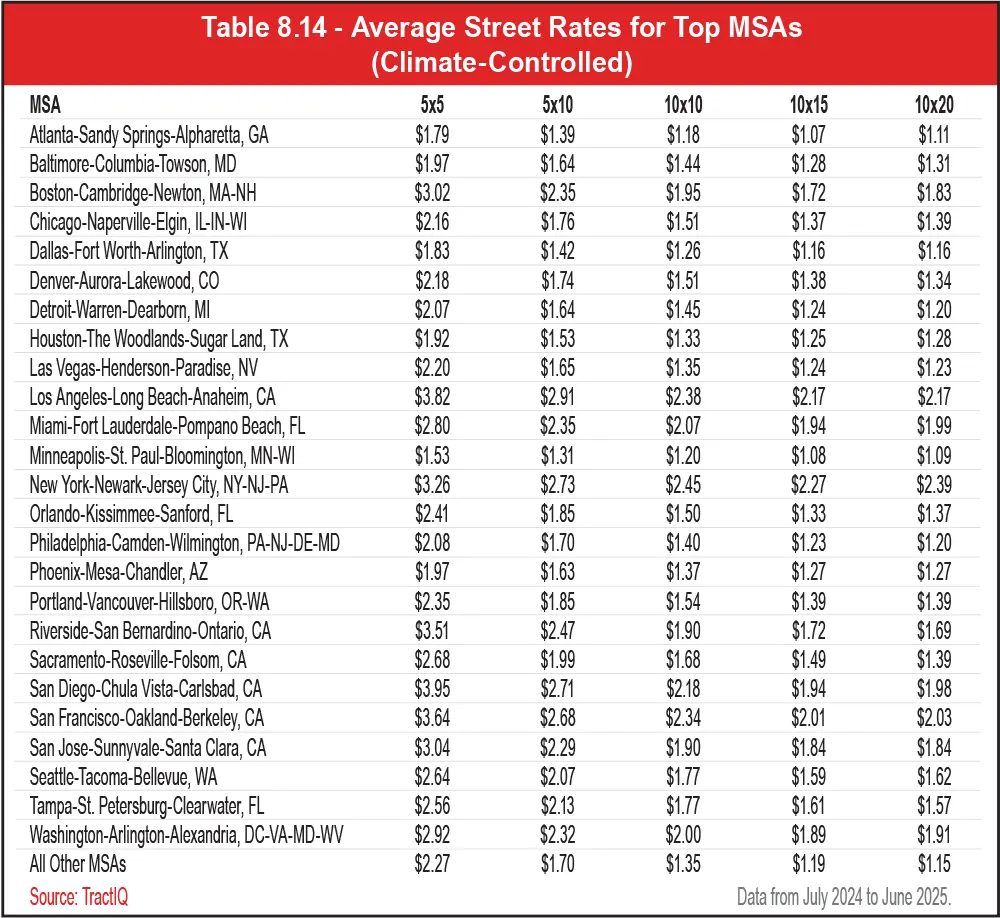
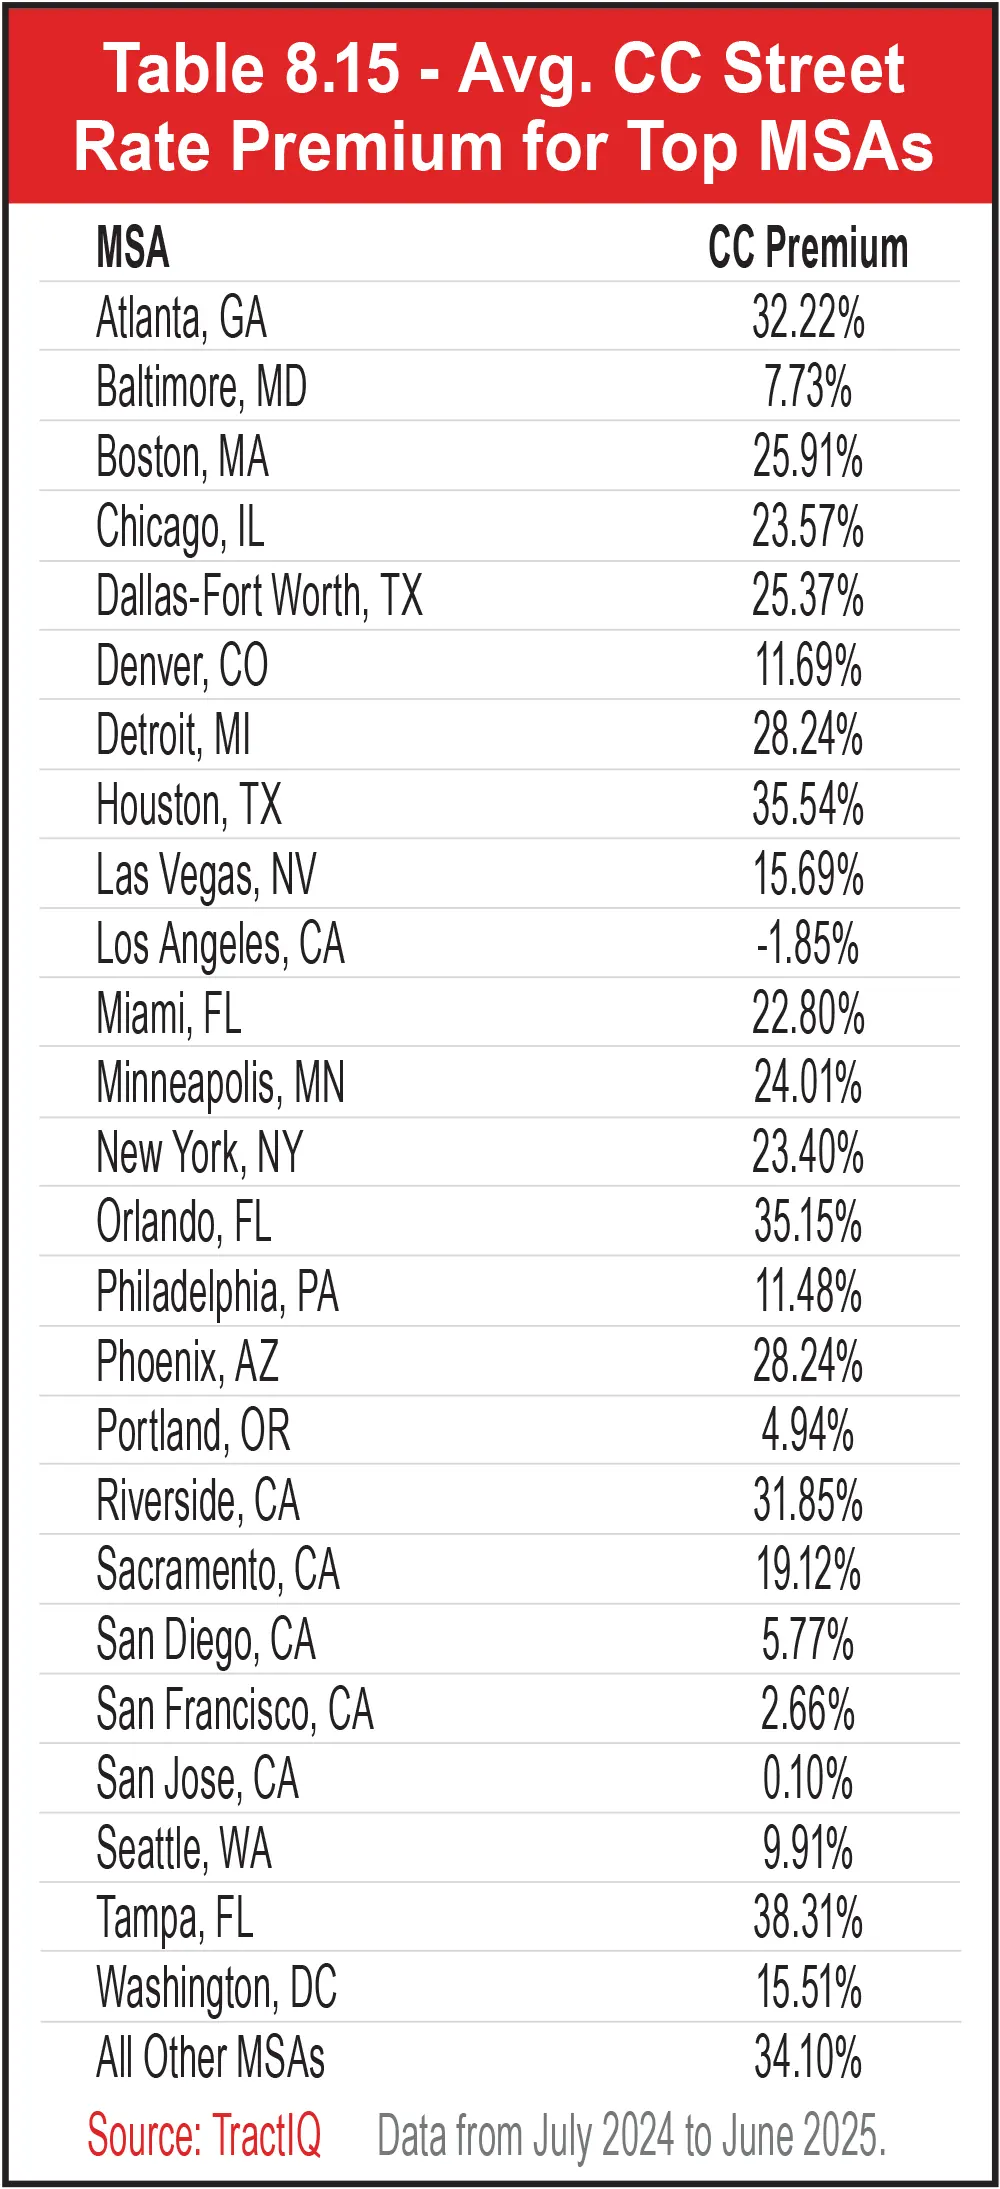
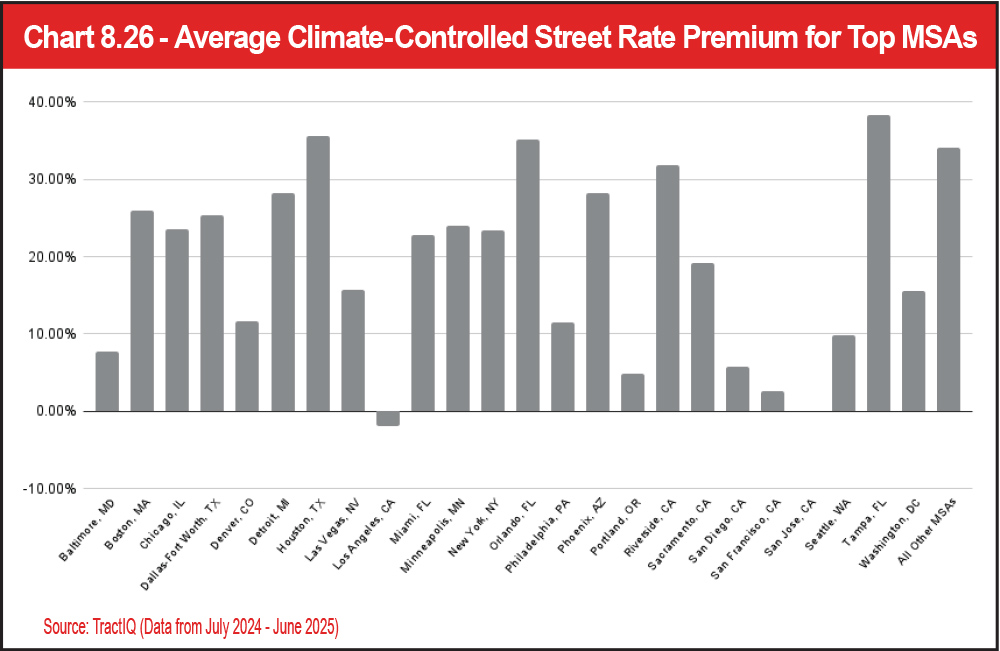
- Los Angeles, Calif. (down 1.8 percent)
- San Jose, Calif. (up 0.1 percent)
- San Francisco, Calif. (up 2.6 percent)
- Portland, Ore. (up 4.9 percent)
- San Diego, Calif. (up 5.7 percent)
It’s no surprise that most of these MSAs are in California, where there is a lack of extreme temperature or humidity. Also unsurprisingly, the MSAs with the highest climate-controlled street rate premiums are locations with high humidity:
- Tampa, Fla. (38.3 percent)
- Houston, Texas (35.5 percent)
- Orlando, Fla. (35.1 percent)
Roughly half of the top MSAs experienced year-over-year non-climate-controlled rental rate growth, with the following MSAs leading the pack:
- Portland, Ore. (up 7 percent)
- San Jose, Calif. (up 7 percent)
- Minneapolis, Minn. (up 6 percent)
- Los Angeles, Calif. (up 4 percent)
- San Francisco, Calif. (up 4 percent)
See Table 8.16 and Chart 8.27.
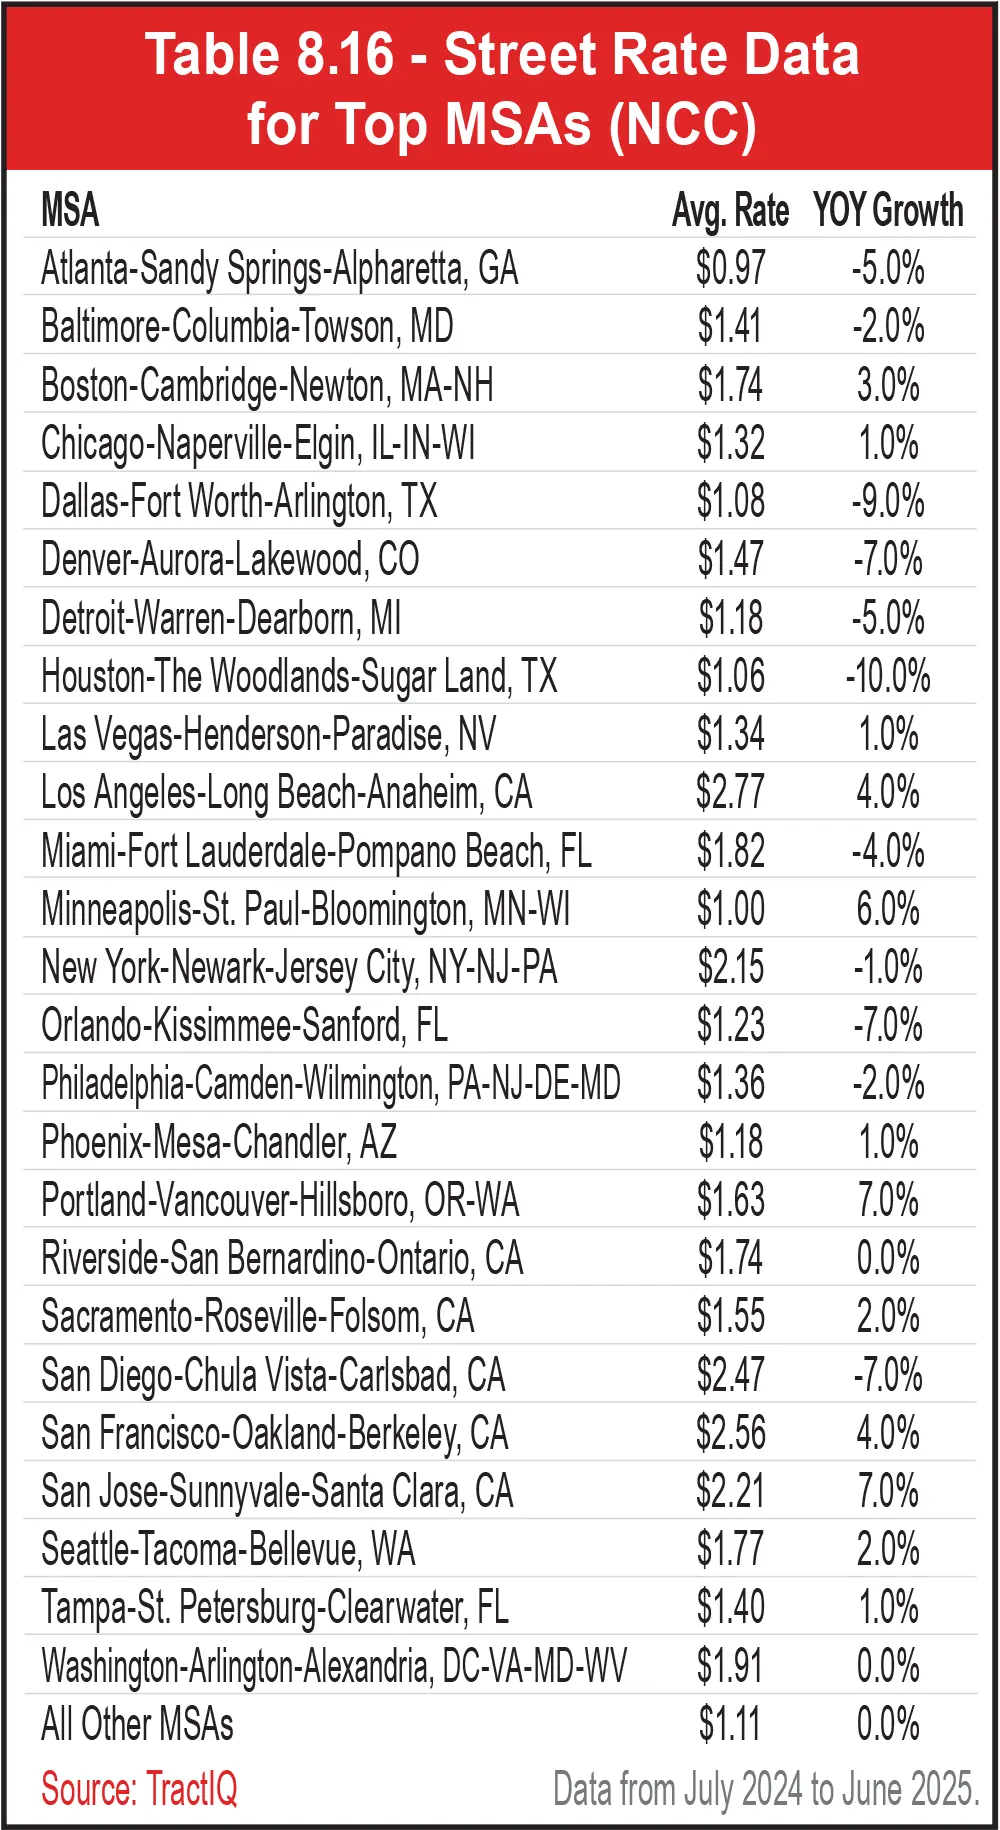
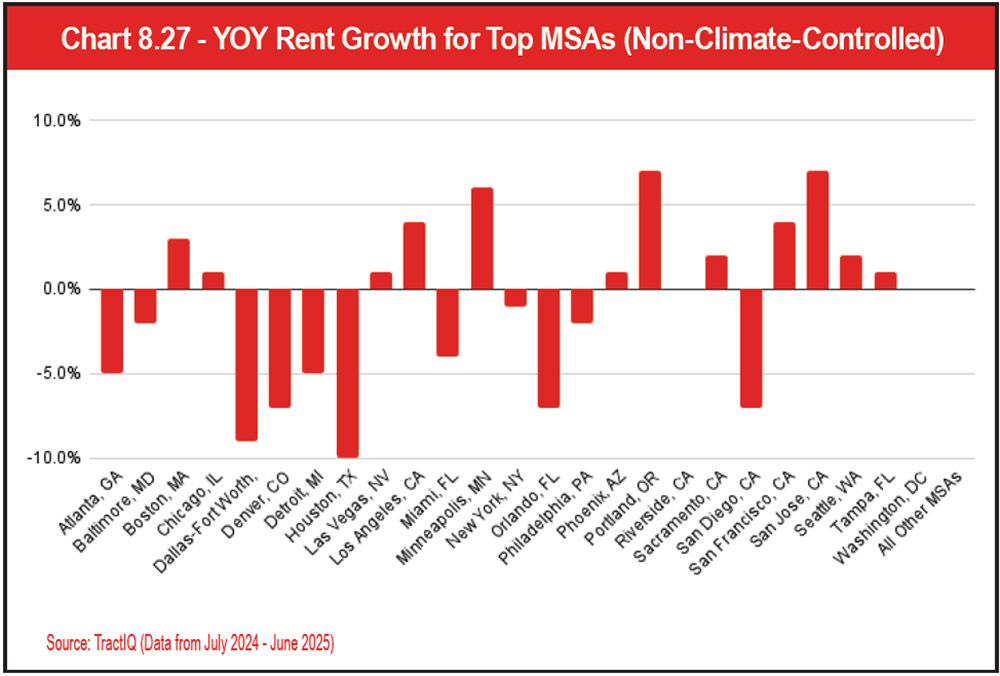
- San Jose, Calif. (up 16 percent)
- Minneapolis-St, Paul, Minn. (up 15 percent)
- Chicago, Ill. (up 13 percent)
- Portland, Ore. (up 10 percent)
- Tampa, Fla. (up 9 percent)
Las Vegas, Nev. (down 7 percent); Orlando, Fla. (down 7 percent); Houston, Texas (down 6 percent); and Dallas-Ft. Worth, Texas (down 6 percent) were the MSAs that experienced the greatest decline in climate-controlled rental rates year over year. In conjunction with decreasing rates, these states all have higher supply to work through, measured by development-to-existing-inventory percent (Nevada at 8.3 percent, Florida at 19.2 percent, and Texas at 7.9 percent).
See Table 8.17 and Chart 8.28.
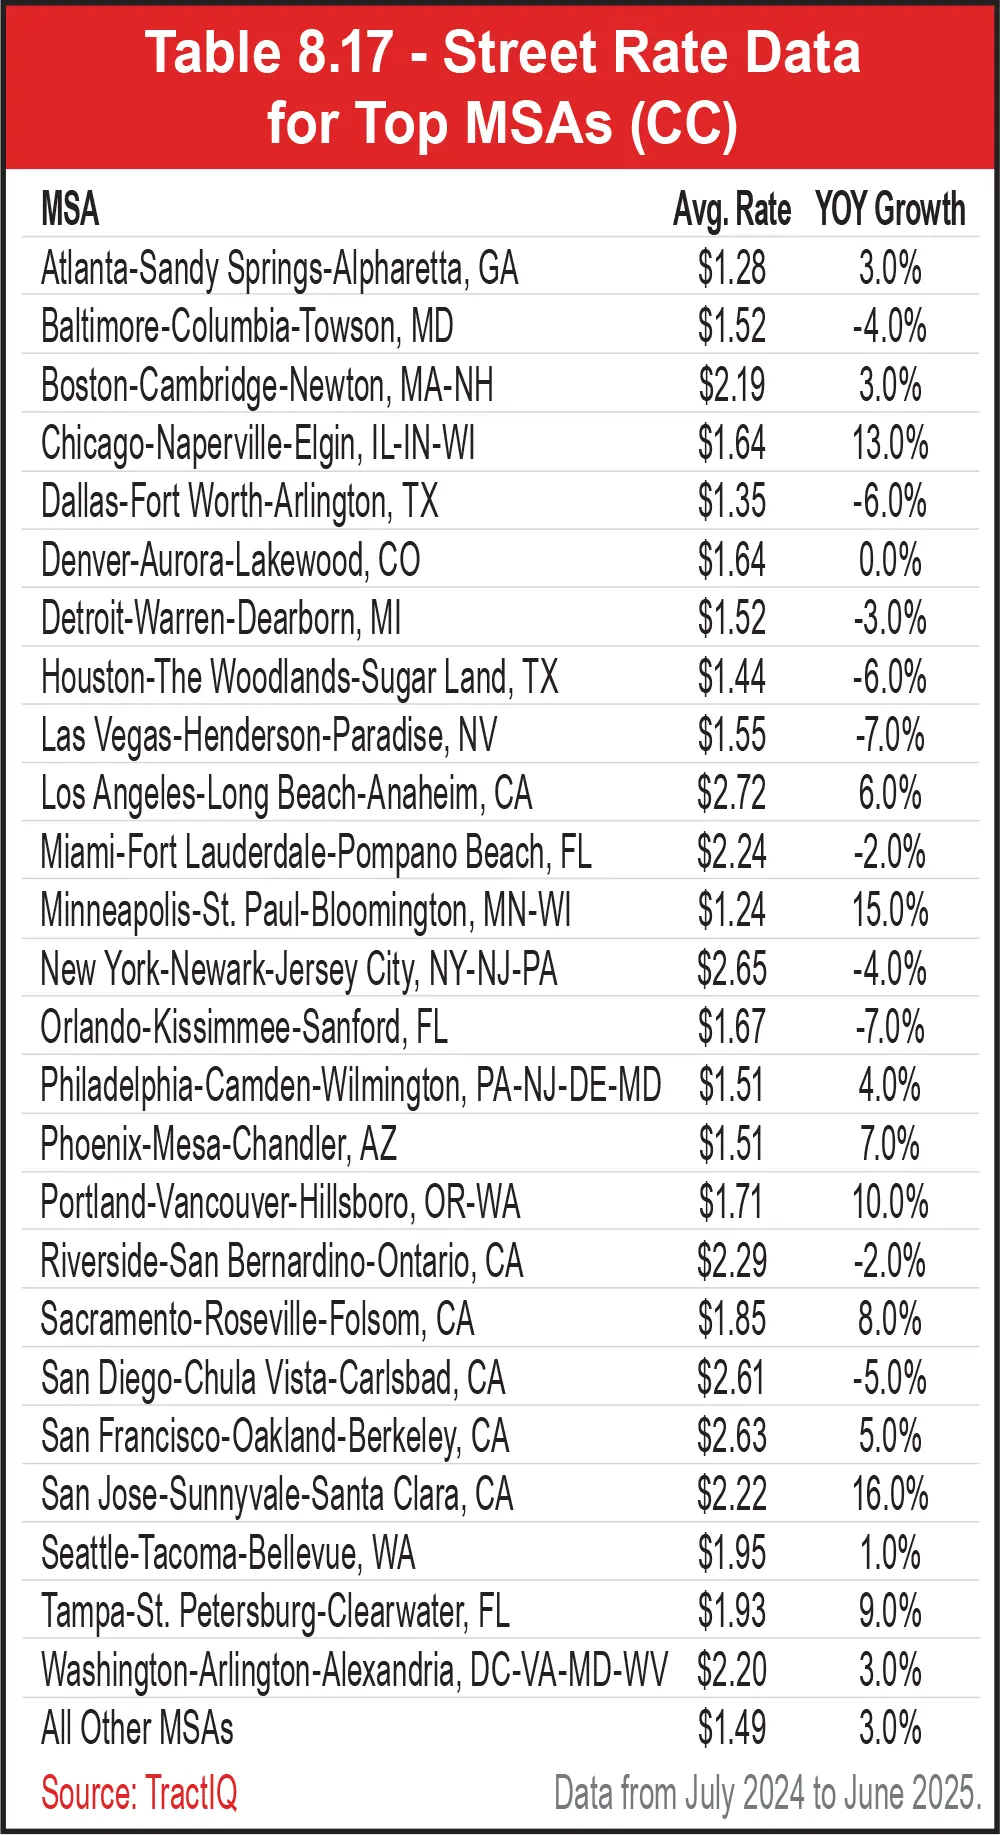
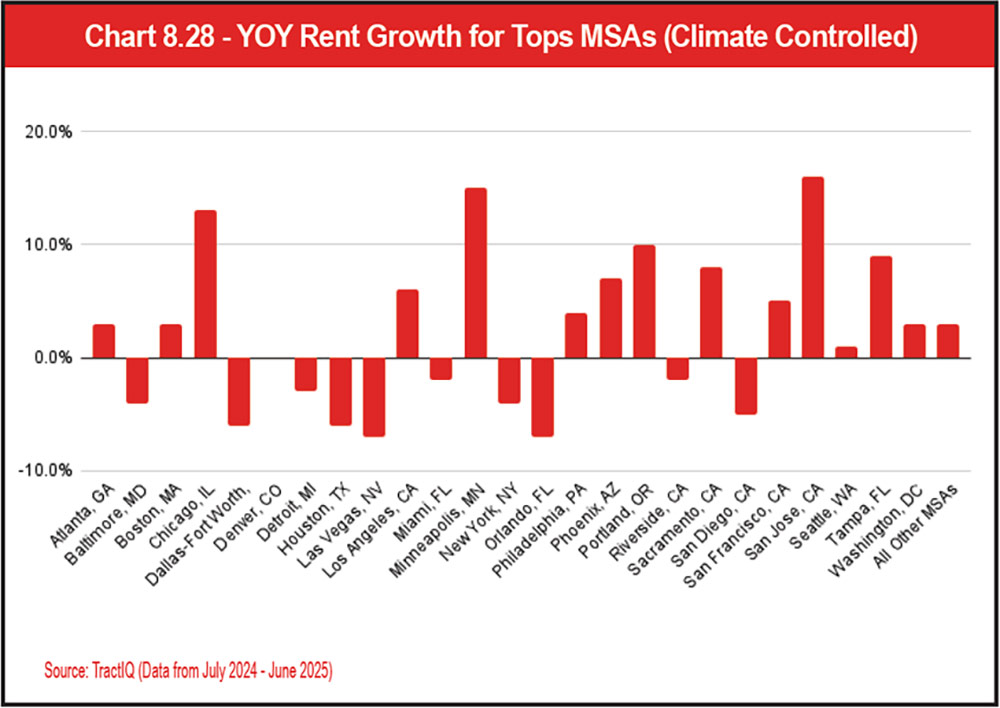

 tbs@trachte.com

- Self-Storage Buildings
- Door & Hallway Systems
- Conversions
- Boat/RV Buildings
- Canopies
- Portables


about recent price discounts!
IDEAL FOR SELF-STORAGE & RESIDENTIAL USE
IDEAL FOR SELF-STORAGE & RESIDENTIAL USE

IDEAL FOR LIGHT COMMERCIAL USE & BOAT/RV
IDEAL FOR LIGHT COMMERCIAL USE & BOAT/RV








They gain reach they can’t build alone.
Through shared brand presence and collective online momentum, the Storelocal community helps independents show up stronger, get found faster, and compete more effectively—while staying fully independent.

very successful self-storage business begins with one universal truth: People rent from people they trust. While technology, automation, and AI have transformed nearly every part of the industry, trust remains the most powerful marketing tool there is. Universal Storage Group (USG) has seen time and again that the operators who outperform their competitors aren’t necessarily the ones with the biggest marketing budgets—they’re the ones who understand their communities, communicate with heart, and deliver service that feels personal.
In 2026, the best marketing strategies blend the timeless with the modern. It’s no longer about choosing between grassroots and digital, but about merging them so community presence drives credibility and digital visibility drives reach. Marketing today is not a single campaign or department; it’s an operating philosophy that touches every interaction, every impression, and every customer relationship. When done intentionally, it doesn’t just fill units—it builds legacy.
Today, national operators may dominate Google Ads and aggregator listings, but independent and regional facilities have something money can’t buy: authentic local trust. The customer who meets you at a chamber of commerce event, sees your name at a school fundraiser, or gets a thank-you note from your manager already believes in you before they ever click “rent.”
Modern marketing has also expanded beyond awareness. It now includes data analysis, consistent follow-up, and community storytelling. It’s how operators express who they are, what they stand for, and why renters can count on them. USG teaches that marketing is not just a business tactic—it’s a leadership responsibility. Every facility, every team member, and every email tells the story of your brand.
When your team volunteers at local events, donates space for a coat drive, or partners with a nearby apartment complex, your brand becomes more than a logo. It becomes a neighbor. That visibility translates into trust, and then loyalty—and loyalty translates into revenue.
USG believes in leading with empathy and service. Every customer interaction is a chance to live its mantra: “Be the Solution and Top of Mind, Market and Industry.” That philosophy drives everything from on-site signage to social media posts. USG doesn’t just want customers to know they exist—USG wants them to feel that USG understands their needs and can solve their problems. Whether it’s a family downsizing after decades in one home, a student storing summer belongings, or a small business expanding inventory, every customer deserves to know that their situation matters.
When you approach your marketing through that lens, community relationships deepen and long-term trust forms naturally. People remember kindness and connection far longer than a discount code.
USG recommends dividing the year into quarters and aligning campaigns with local rhythms. Spring focuses on moving season, thus partnering with real estate offices and apartment complexes. Summer centers on community visibility through festivals, open houses, and outdoor events. Fall shifts to local schools, college transitions, and small-business partnerships. Winter celebrates customer appreciation and charitable giving.
Consistency also requires budgeting. Marketing isn’t an expense—it’s an investment in occupancy growth. A thoughtful budget (typically one percent to three percent of gross revenue) should include clear categories for spending and accountability. USG recommends dividing funds among community engagement, digital subscriptions (CRM, Constant Contact, Canva, paid ads), seasonal décor or events, and a fully functional website.
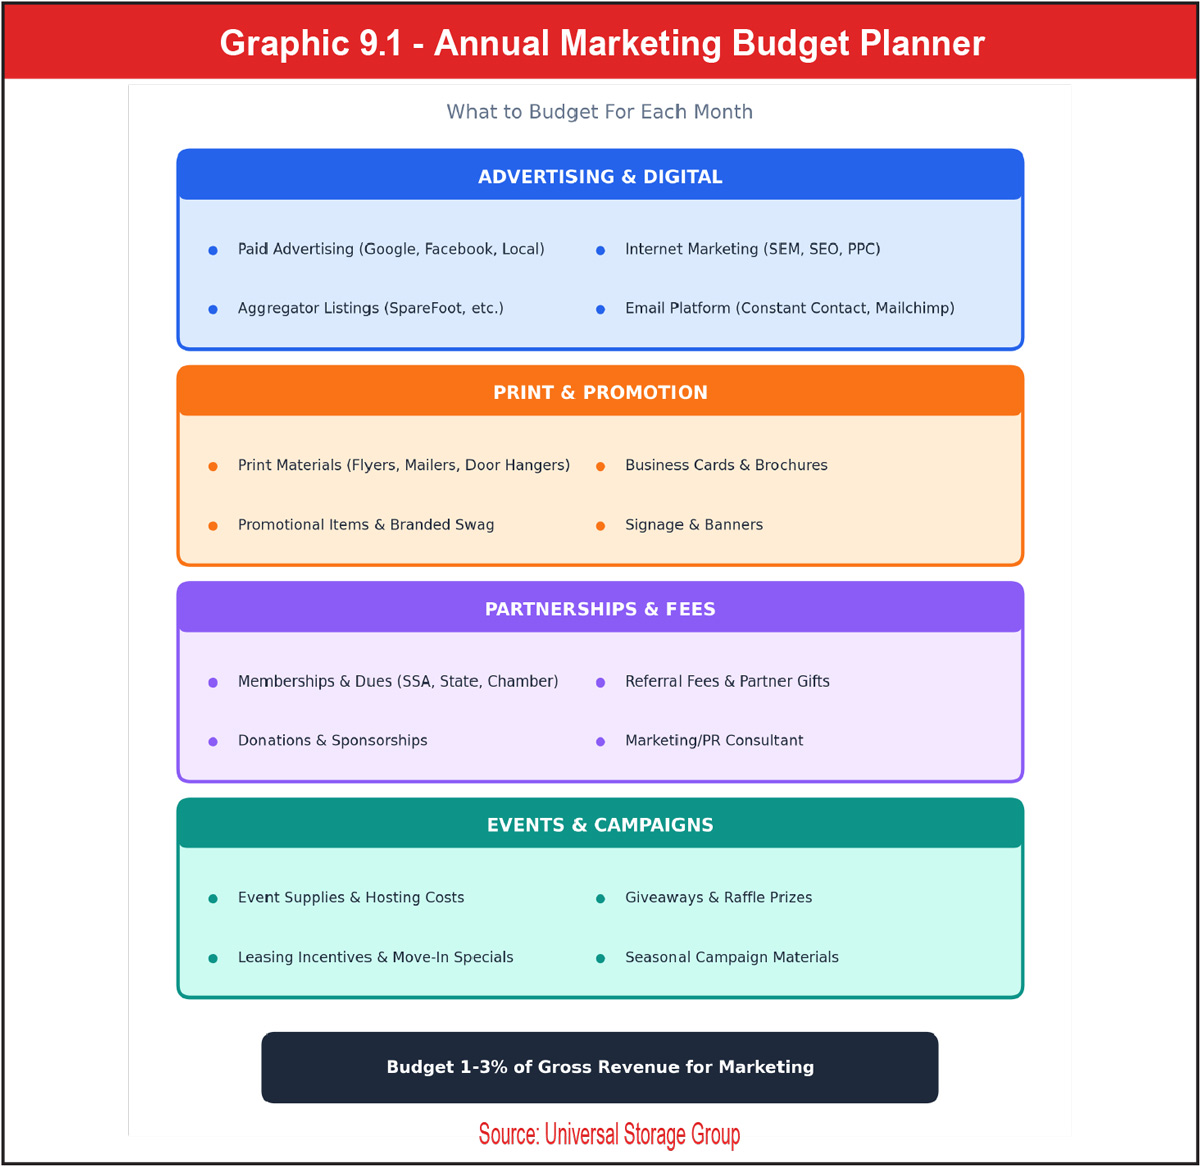
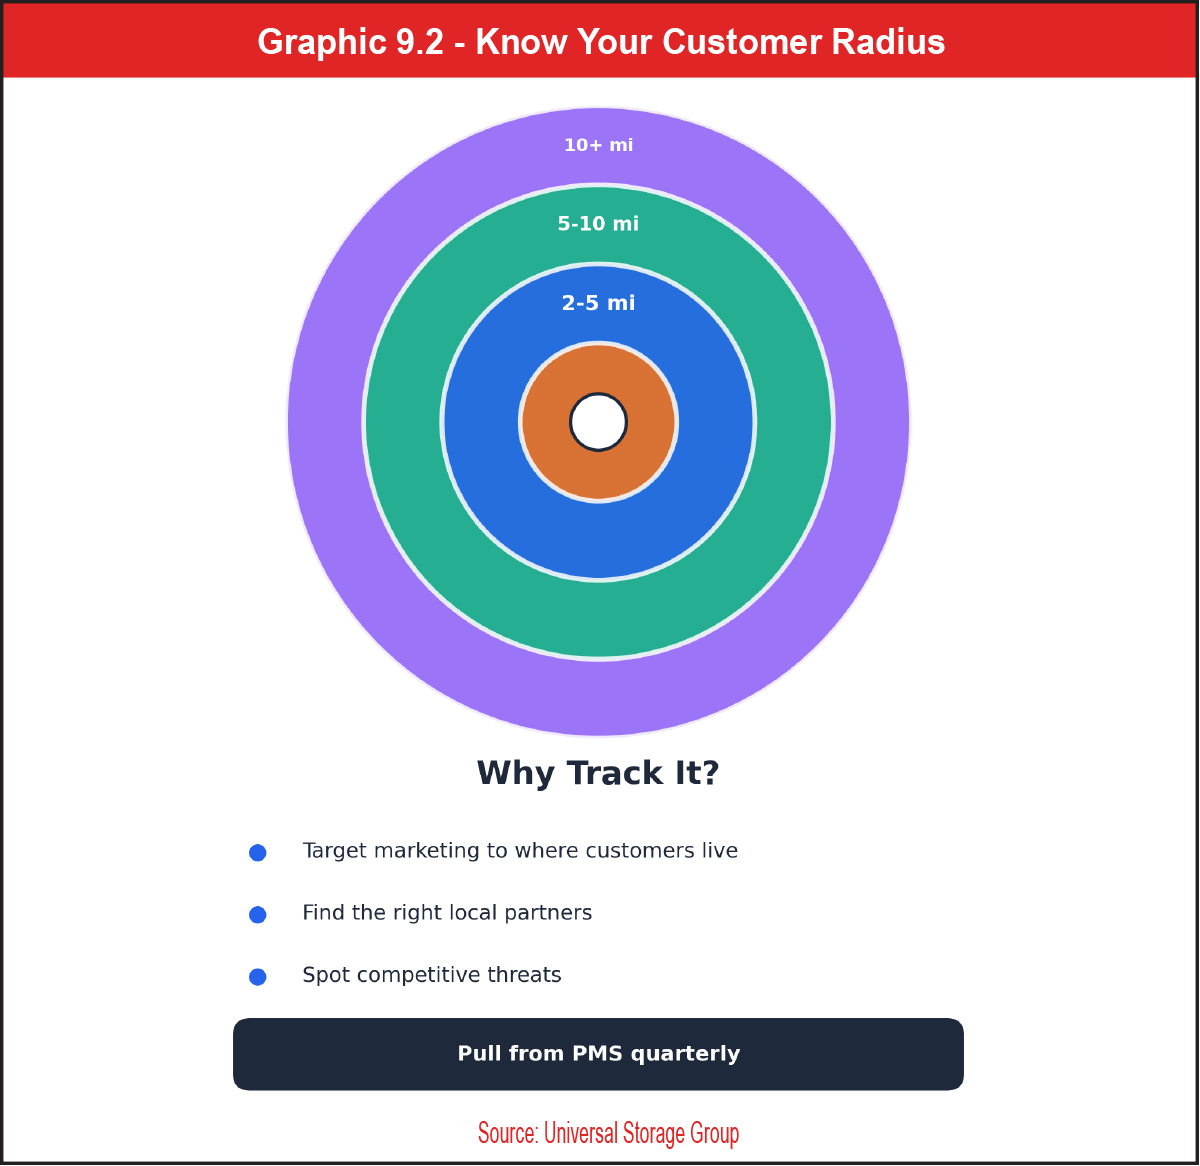
For 2026, forward-thinking operators are also exploring cost-effective TV streaming media advertising. Platforms like Hulu, Roku, and YouTube now allow operators to run short, ZIP-code-targeted commercials for surprisingly low cost. This modern twist on “billboard marketing” brings your brand directly into local living rooms and mobile devices—often at a fraction of traditional ad pricing.
Transparency builds confidence among your team. When managers know their marketing resources, they take ownership of how those funds are used. A property near a lake might invest in branded towels or waterproof pouches, while a downtown facility may opt for tote bags and reusable coffee mugs. Empowering site-level decision-making ensures that your marketing feels relevant and authentic, not forced or generic.
See Graphic 9.2.
USG’s onboarding program trains managers to think like marketers from day one. They learn how to log outreach activity, identify potential business partnerships, and follow up strategically. USG sets measurable monthly goals, such as a target number of outreach visits, hours spent in community engagement, and local partnerships formed. These are tracked through its Marketing Call Report, which keeps progress visible and encourages consistent effort.
But structure alone isn’t enough. Recognition matters. Each month, USG highlights top marketers across its portfolio, celebrating those who drive referrals, host events, or creatively promote their sites. A small bonus, shout-out, or even a feature in the company newsletter fuels pride and momentum.
Empowered managers think differently. They stop waiting for corporate marketing to fill the pipeline and start creating opportunities on their own. They understand that marketing isn’t something that happens “out there”—it happens every time they pick up the phone or greet a walk-in. When your team owns that mindset, your marketing becomes unstoppable.
Events also generate priceless content for your digital channels. Photos of happy customers, charity drives, and community partnerships tell a powerful story online, boosting engagement and improving your search relevance. Every handshake at an event becomes a potential online review, and every post or tag amplifies your reach.
Among USG’s favorite creative outreach ideas is what is called the “phantom referral.” It’s a playful, proactive strategy to generate new business partnerships. They might visit a nearby apartment complex or real estate office with a few pizzas and say, “Someone mentioned a new tenant said they were referred from here, but we didn’t catch a name. Lunch is on us, and next time, make sure we know who to send the $50 check to!”
The secret is there wasn’t actually a referral—yet. The gesture breaks the ice, makes the team smile, and sparks curiosity. Suddenly, that leasing agent or realtor wants to earn that referral check for real. It’s human psychology at its friendliest—and it works.
Beyond phantom referrals, genuine appreciation also drives results. Handwritten thank-you notes, birthday cards, and small tokens of gratitude remind partners that you value them. Whether you drop off doughnuts to a local business or sponsor a charity walk, the return on those efforts is far greater than their cost. Over time, those relationships become referral pipelines that sustain occupancy even during slow seasons.
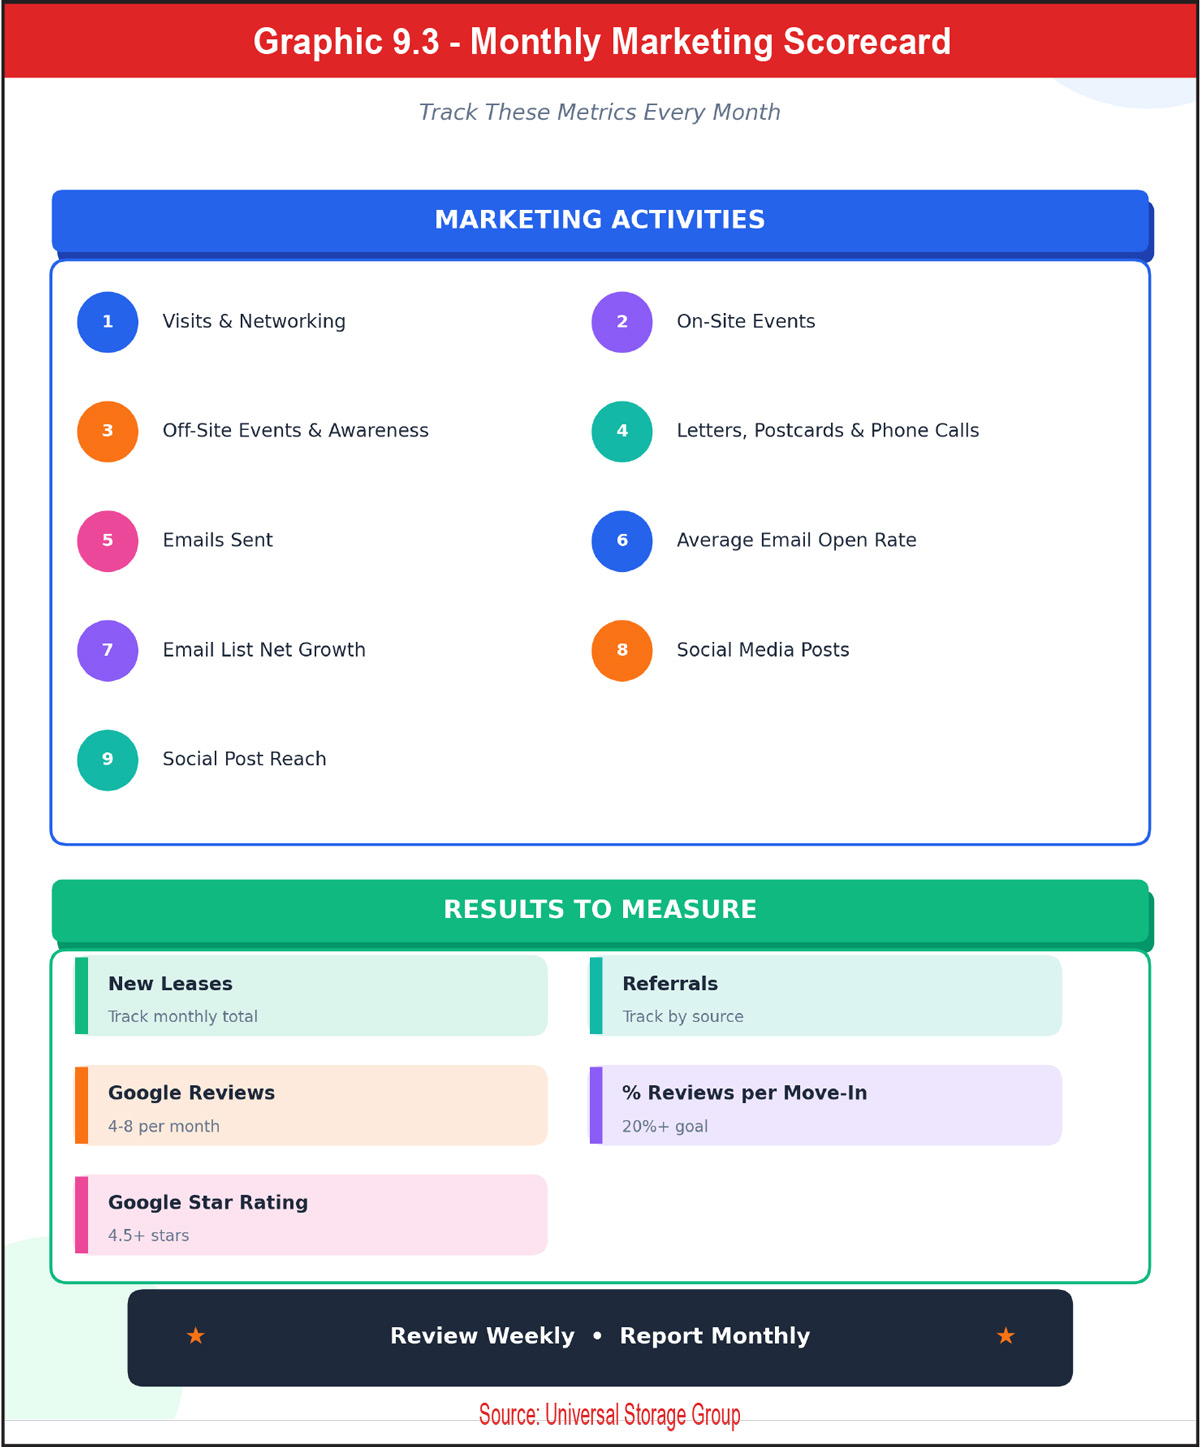
See Graphic 9.3.
These numbers tell a story. Facilities that maintain steady, visible outreach often experience stronger, more consistent growth in occupancy and lead quality. While digital ads can produce quick spikes, grassroots consistency builds reputation equity that lasts. The most profitable operators are those who blend both, combining local credibility with strong digital systems.
Data from operational software, CRMs, and website analytics should also guide where you invest your time. If most of your leads come from apartment partnerships, double down there. If your online leads convert at a higher rate, fine-tune your website experience. The key is to let the data inform your next move without losing the personal touch that differentiates you.
See Graphics 9.4 and 9.5.
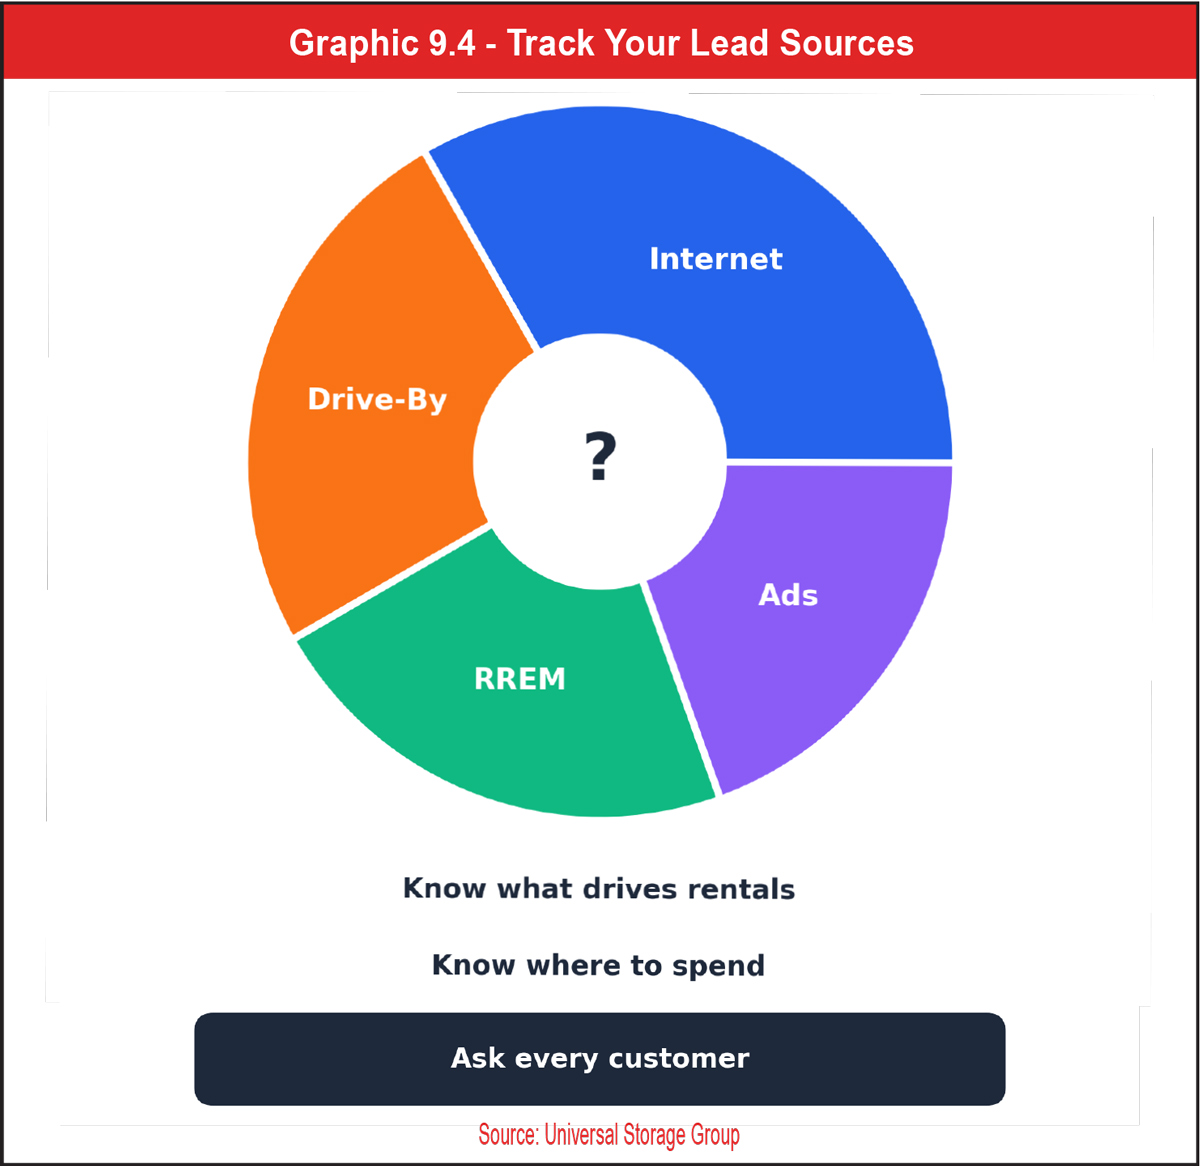
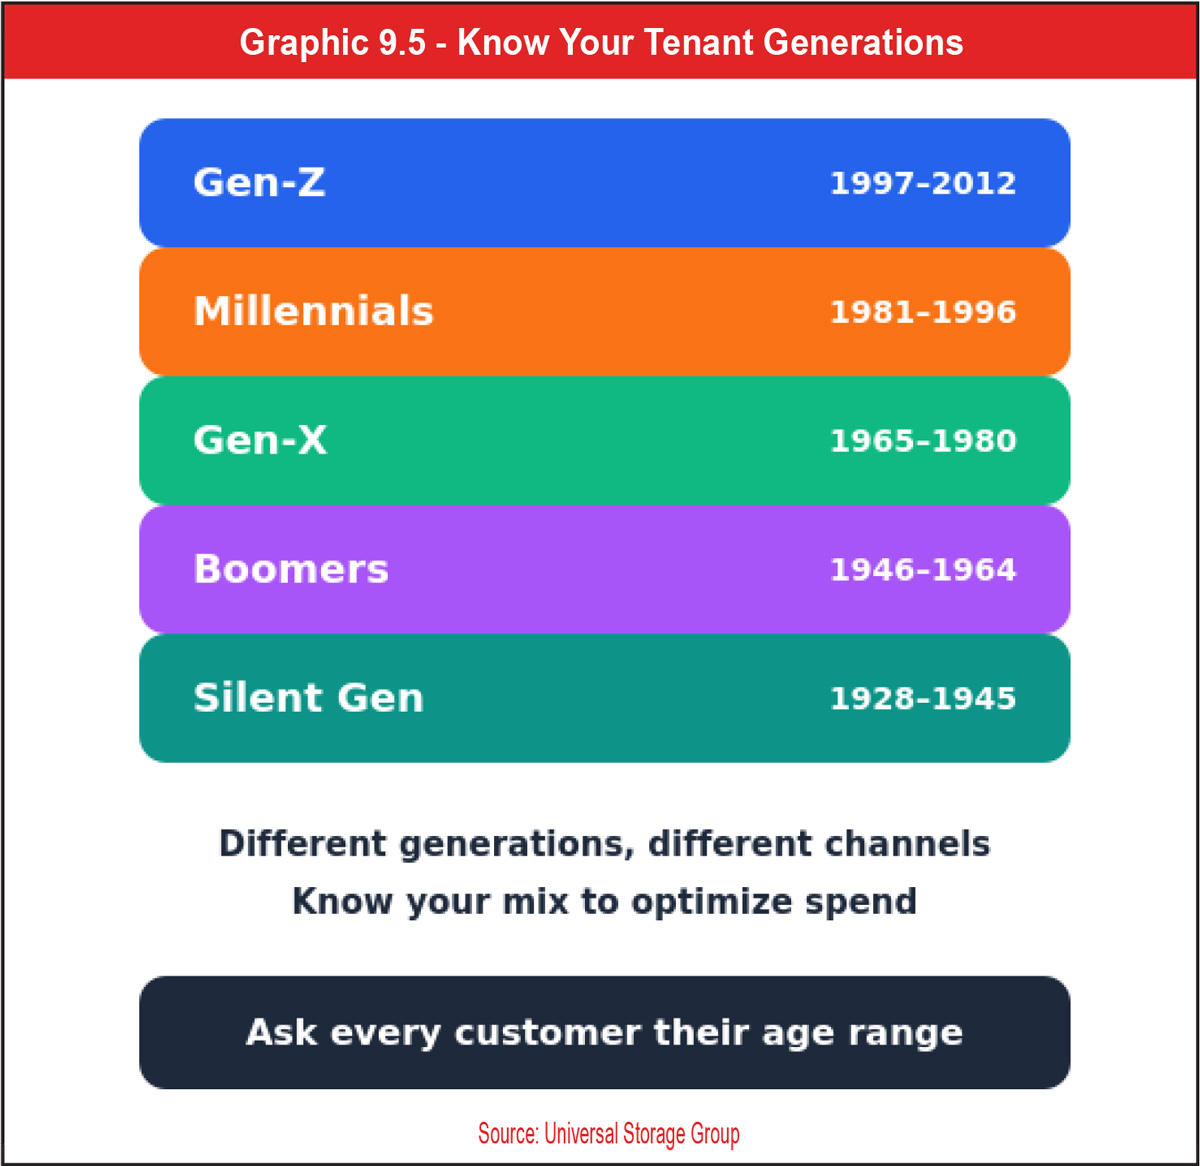
When customers associate your name with reliability and integrity, they stop comparing prices and start choosing you for peace of mind. A spotless facility, a friendly manager, and a familiar name in the community outweigh a few dollars of savings elsewhere. That’s the power of reputation, and it’s earned through years of intentional, community-minded marketing.
Even as technology evolves, the human factor remains your greatest competitive edge. REITs can outbid you online, but they can’t out-
relationship you locally. Your team’s visibility, warmth, and responsiveness are the qualities that make your marketing matter.
That’s why USG recommends partnering with a strong, reputable self-storage website provider such as Storage Pug to make sure your local reputation is reflected digitally. A professional, well-optimized website showcases your brand’s personality and performance. It connects your local story to the broader digital marketplace, ensuring that every potential renter experiences the same authenticity online that they would in person.
In 2026, marketing success belongs to operators who combine both worlds. Community builds trust. Digital builds reach. Together, they build momentum.
Let’s start with what hasn’t changed: Customers are using the internet to find and rent their storage units.
- 41 percent of renters begin their storage journey online, and even more searched for storage at some point in their renting process, according to the Self Storage Association.
- 80 percent of U.S. consumers search online for local businesses on a weekly basis, according to brightlocal.com.
This means that most of your potential customers will see some part of your digital footprint, so it’s essential that you make the right impression.
See Graphic 9.6.
In storage terms that means, more than ever, potential customers are starting their journey by searching “storage units near me,” and your Google Business Profile may be the first impression they have of your business.
A profile with professional photos, updated facility information, and five-star reviews is non-negotiable! The efficacy of a strong GBP is only growing.
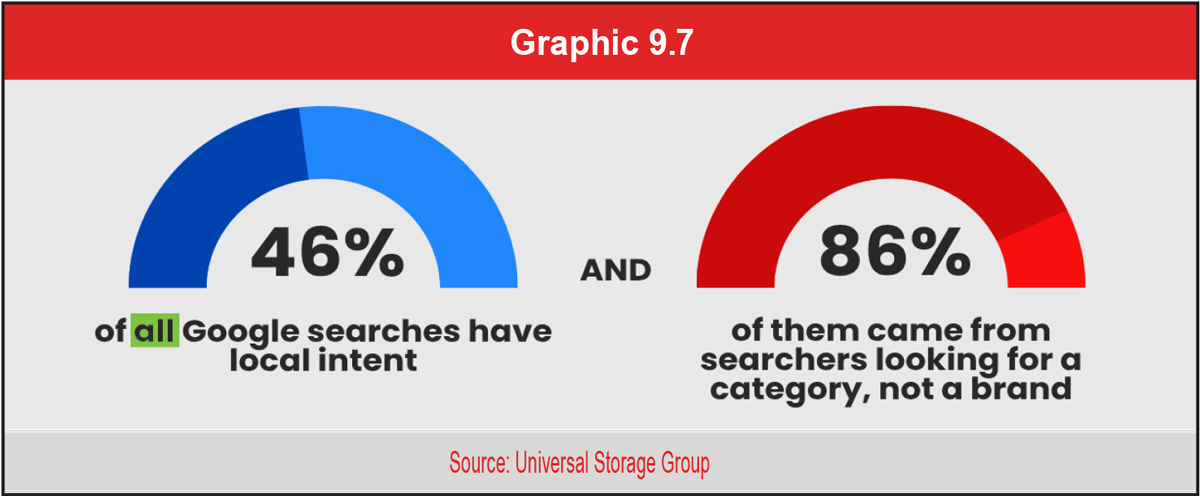
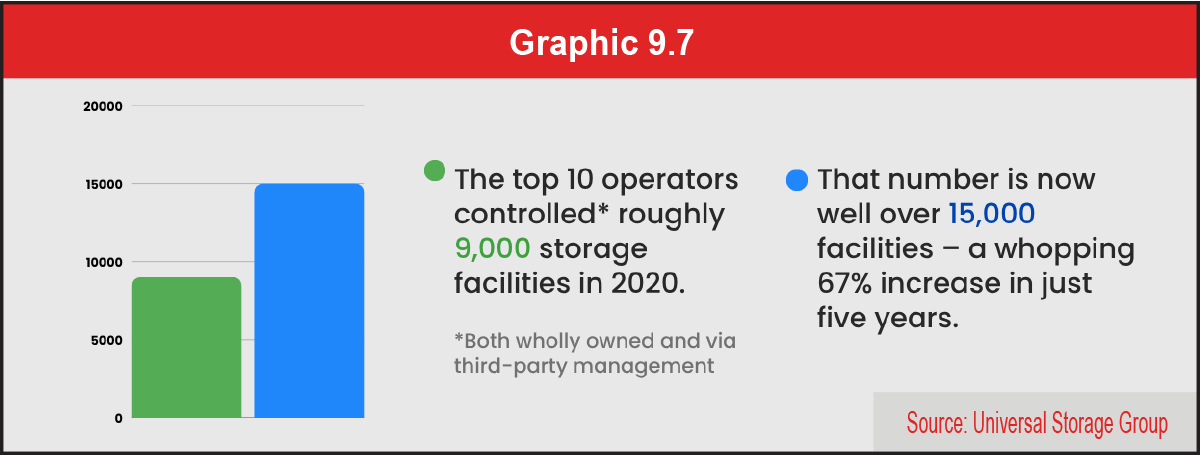
According to Linearity, 88 percent of consumers are unlikely to return to a website if they have a bad experience, and 89 percent will choose a competitor instead. All of your online efforts (and even most of your physical marketing) will send potential customers to your website, so it’s essential that it communicates your business, your amenities, and customer trust right away. And most importantly is that a potential customer can rent a unit in as few clicks as possible. Like your Google Business Profile, your website should be packed with strong photos and lots of reviews, and it should be designed with a storage customer in mind.
See Graphic 9.7.
For more perspective, the top 100 operators owned a combined 12,000 facilities in 2020. In 2025, just the top 10 alone is well past that.
This massive consolidation means a few things:
- The big operators have more buying power. They can spread their marketing costs over more locations.
- Bigger websites typically mean more traffic. Google isn’t perfect, but it is an algorithm. If lots of users are visiting a site, it will assume a new searcher wants to as well.
- They have access to bigger teams, more talent, and sophisticated tools.
- Pricing transparency is key. Make it clear and easy to understand. And don’t be afraid to experiment with value pricing. With price-sensitive markets, it takes attention to get it right and keep it right.
- Track everything. Know how many people view your website, how many call you, and most importantly, how many rent from you! Use tools like Google Analytics or Google Tag Manager.
- Local search is the leading way customers find self-storage businesses online. Optimize all your SEO (search engine optimization) efforts around your local market.
- Learn Google Ads. Sponsored ads are taking up more and more space on the search results page. Google is experimenting with placing ads in different locations, making it harder for searchers to find unpaid options.
See Graphic 9.8.
- Use pay-per-click (PPC) as needed. In many tertiary and even secondary markets, a big Google Ads or pay-per-click budget isn’t necessary. Ad spend should always have a direct correlation to occupancy.
- Spend smart. If you are spending money on Google, have a firm grasp on your customer lifetime value and your cost per acquisition (CPA). You can only know how much to spend if you know how much you’ll make.
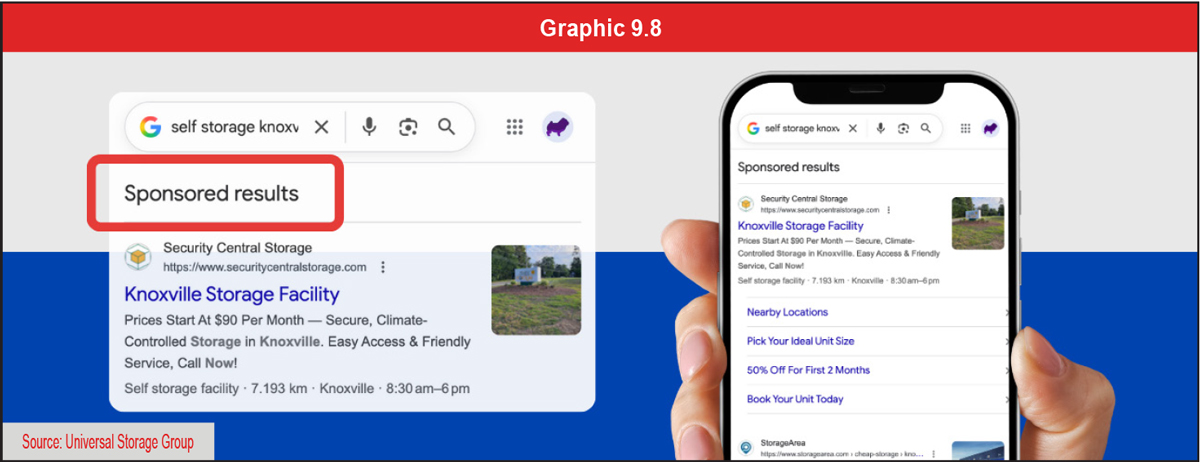
See Graphic 9.9.
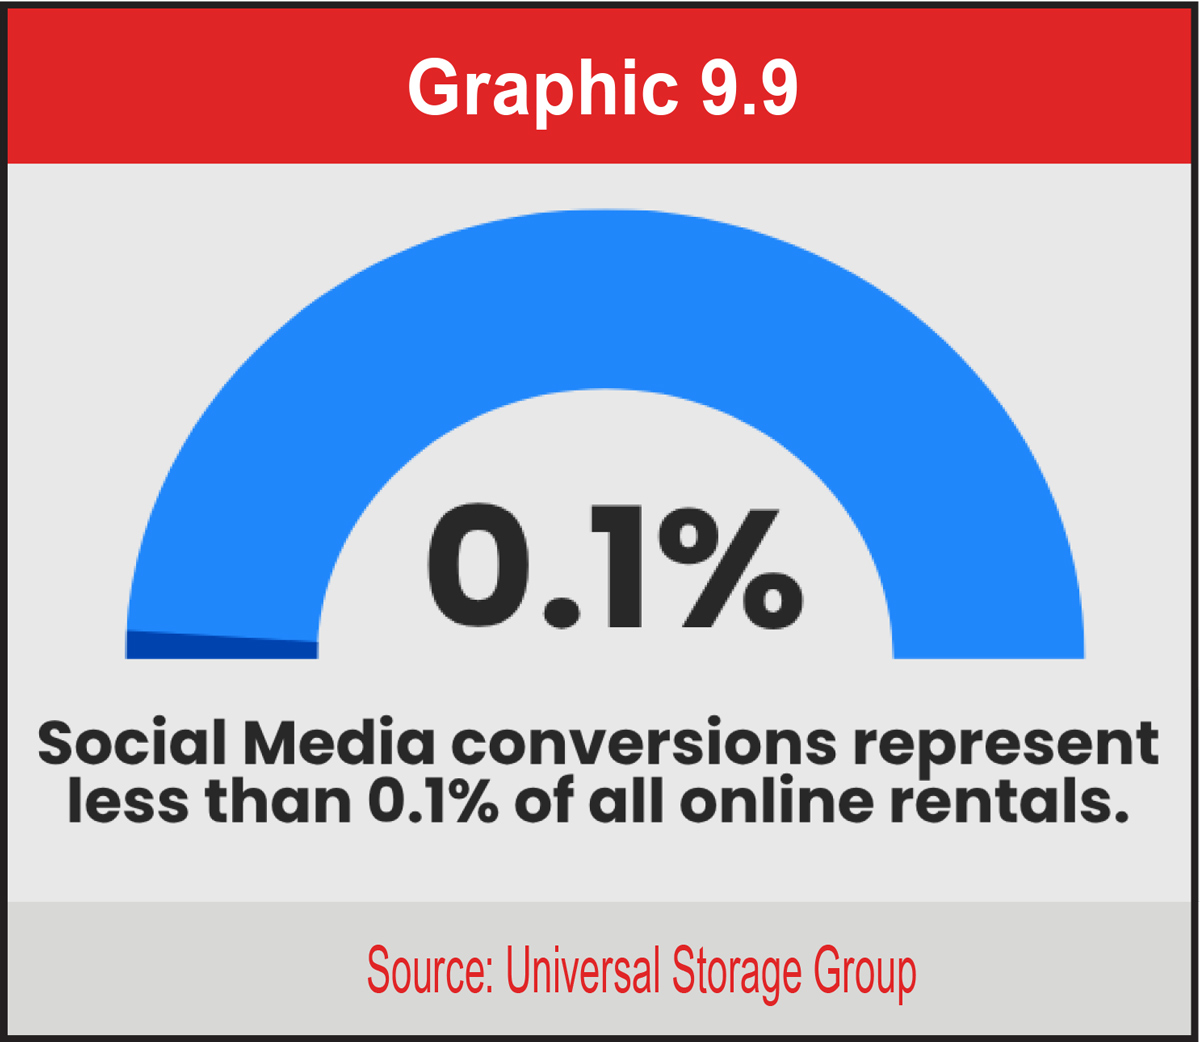
- Get familiar with the big three: ChatGPT (OpenAI), Claude (Anthropic), and Gemini (Google).
- Google’s AI Mode is the new way to search and understanding how your business might appear in those results is critical. Here’s the good news: These AI search tools are not looking for anything magical on your website. Much like Google (and traditional Organic SEO), these tools are reading the content and pulling the information from your website to share with searchers. The more info you have that’s relevant and useful, the better.
- Explore, cautiously. AI will almost always give you an answer, but it may just be the wrong one. Top operators are using AI to expedite tedious processes and tasks more than they are outsourcing judgment calls or strategy.
How do you evaluate for conversion? Be your customer. Focus on what they see when they show up. Ask yourself, “Do I like what I see? Would I rent here? If I wanted to rent here, how easy would it be? How do I get my lock? When can I access my stuff?” Make sure your website and GBP answer these questions.
Most operators haven’t rented a unit in years or, in some cases, ever! Take time once or twice a year to rent a unit from yourself or your neighbors. Evaluate that experience and make improvements.






nderstanding the dynamics of the complete rental experience helps operators make important business decisions about marketing, staffing, the use of technology, and on-site services. This section builds on the customer traits data in Section 5, adding critical site information statistics to help you optimize your business and maximize your profits. Taken from the SSA’s 2025 Self Storage Demand Study, data is analyzed and compared by region, urbanization, customer type, and other factors.
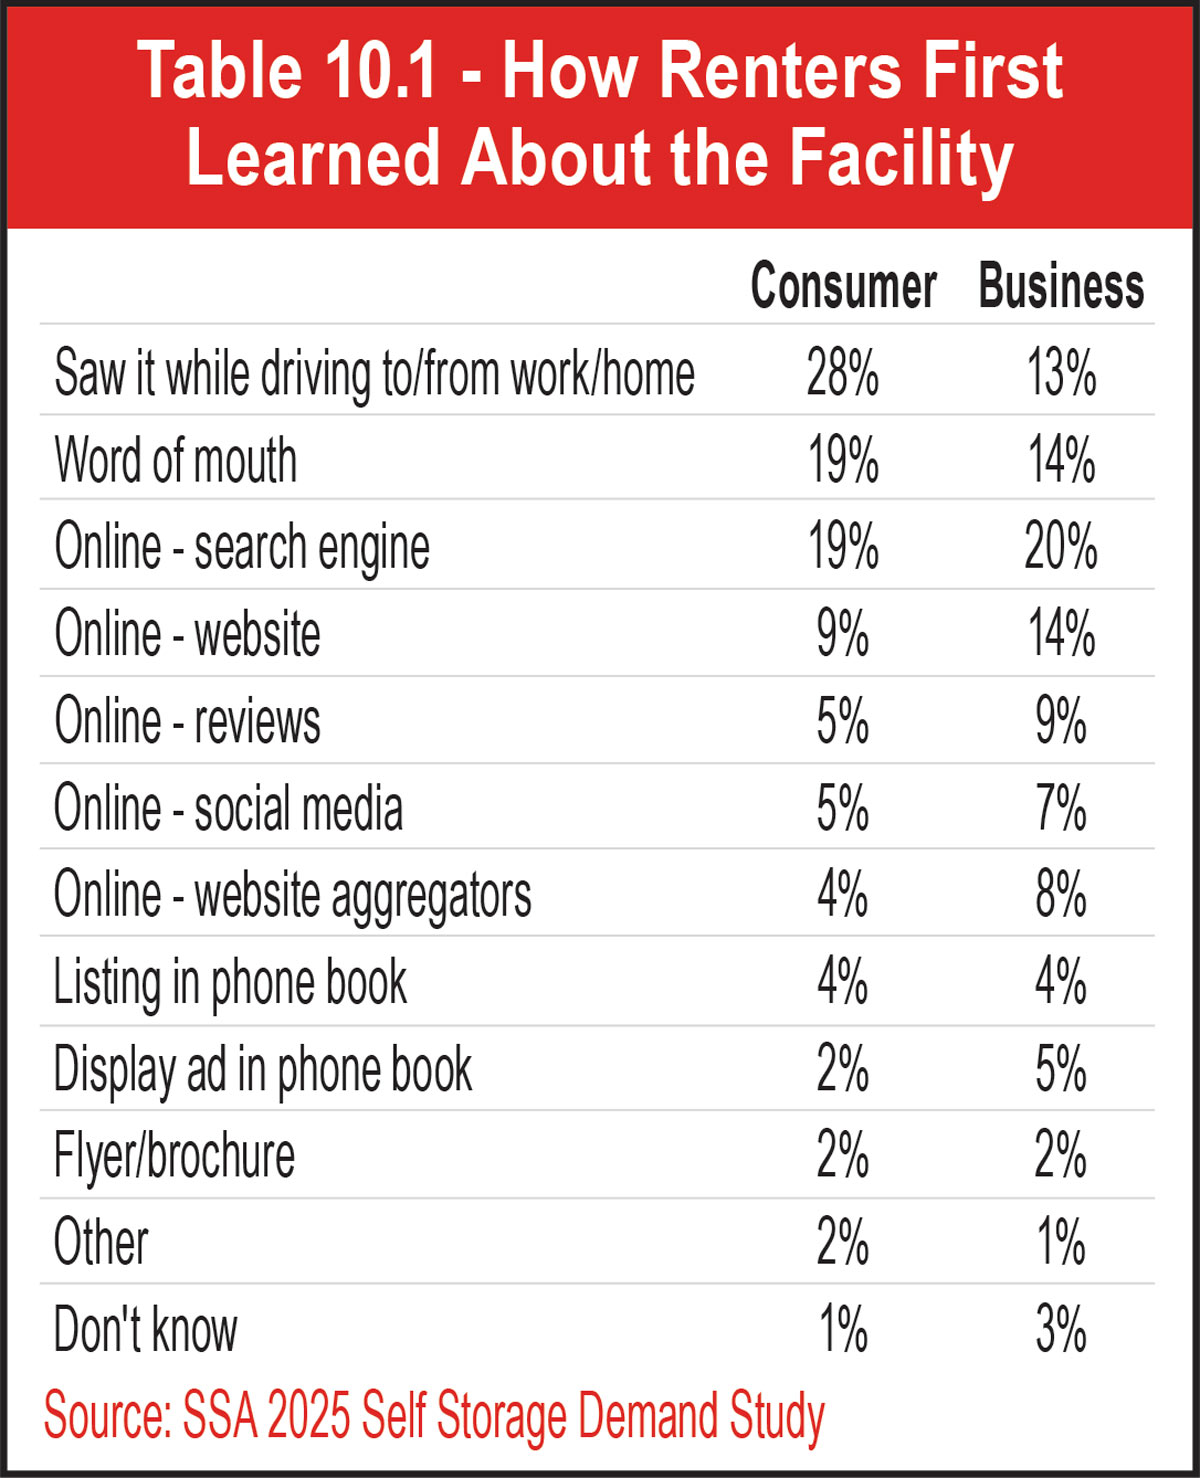
This underscores the importance of having a location with a high traffic count. The greater the number of cars driving by every day, the more visibility you have and the more you are on the mind of the prospect when they develop a need for space. Remember, self-storage is a commodity. People “discover” your facility when they need storage, even if they have driven by your store hundreds of times.
Location seems less important to business renters, though, as only 13 percent of them first learned of a facility via drive-by. It is possible that they end up renting units at facilities that are not located within their daily commute but still close to their place of employment. Online search engine was the way 20 percent of business renters and 19 percent of consumer renters first learned of a facility. Word of mouth and facility websites were two other popular choices for both types of renters, but 5 percent fewer business renters cited word of mouth than consumer renters. Table 10.1 also shows that business renters are twice as likely to learn of a facility through online website aggregators than consumer renters (8 percent vs. 4 percent). Somewhat surprising is the fact that more business renters first learned of a facility through social media or online reviews than consumer renters.
See Table 10.1 and Chart 10.1.
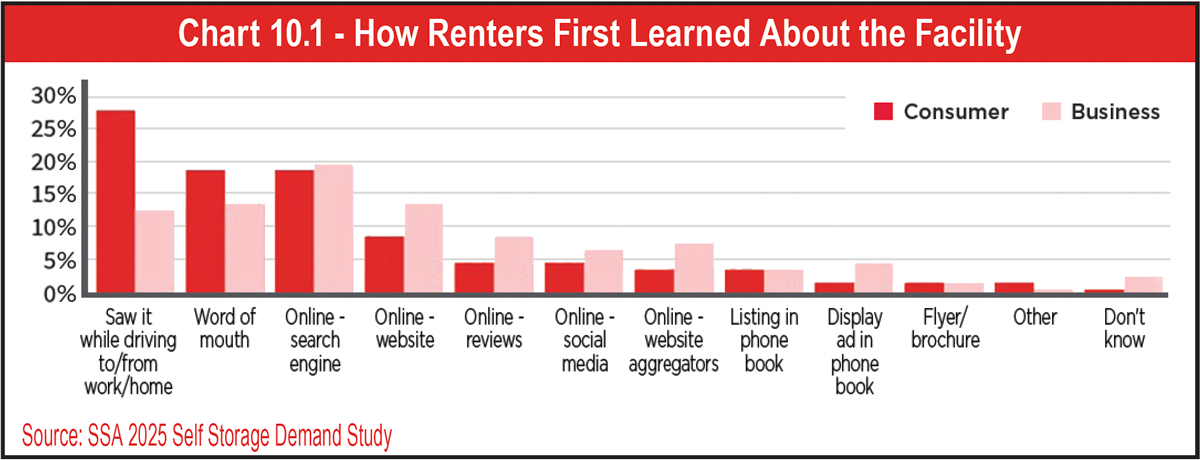
See Chart 10.2.
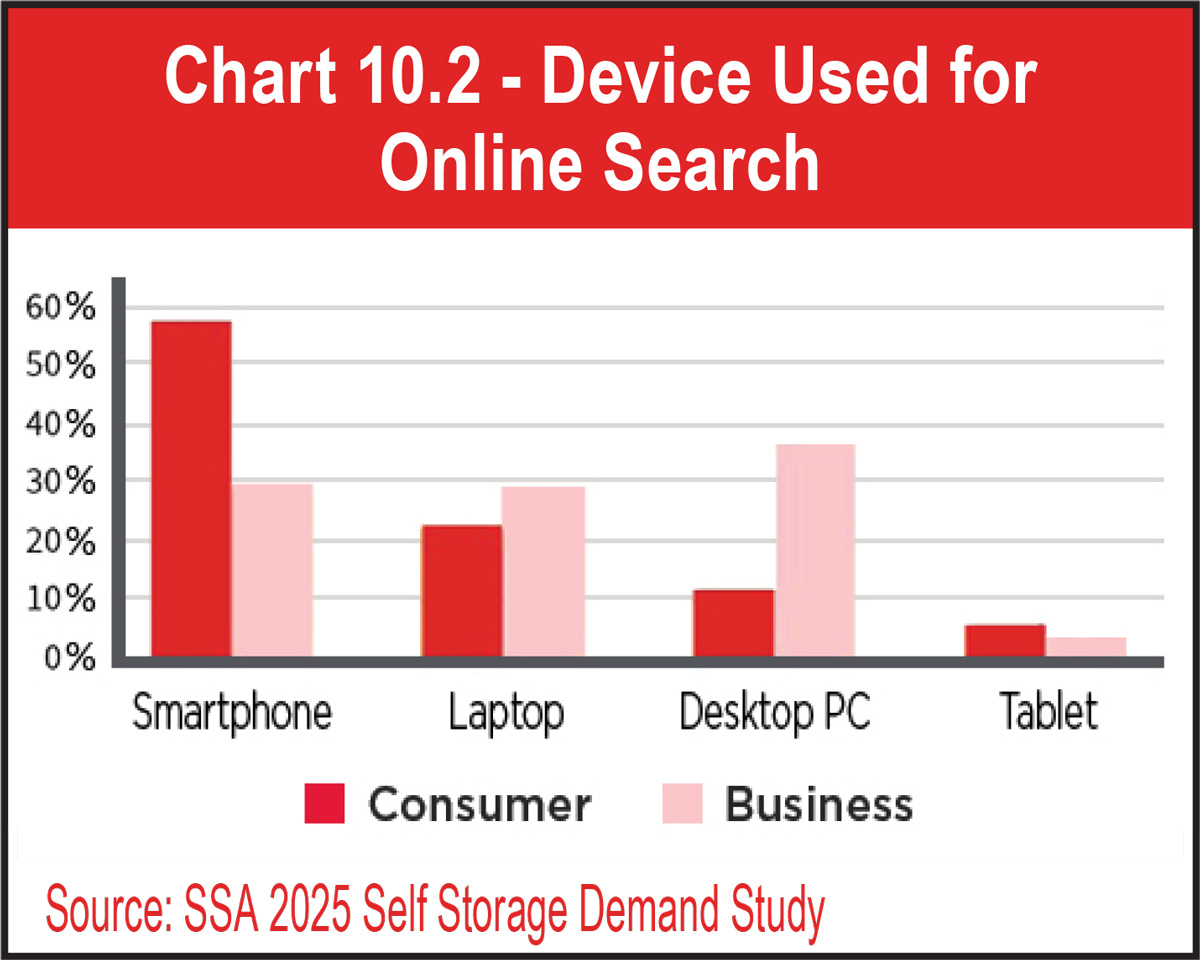
See Chart 10.3.
When first contacting a facility, 38 percent of consumer and business renters pick up the phone. For consumer renters, this percentage has dropped by 5.2 percent since 2023, with that portion of renters opting to instead visit the facility’s website or make an in-person visit in 2025. Compared to consumer renters, business renters are nearly twice as likely to make first contact via email.
See Chart 10.4.
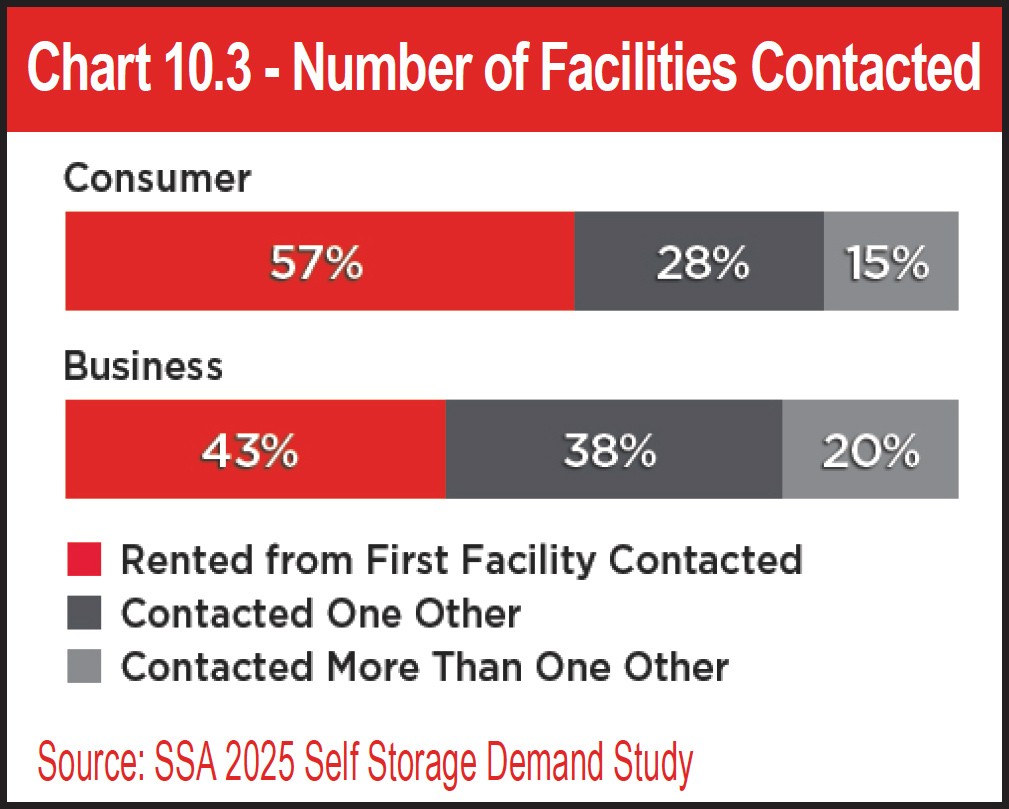
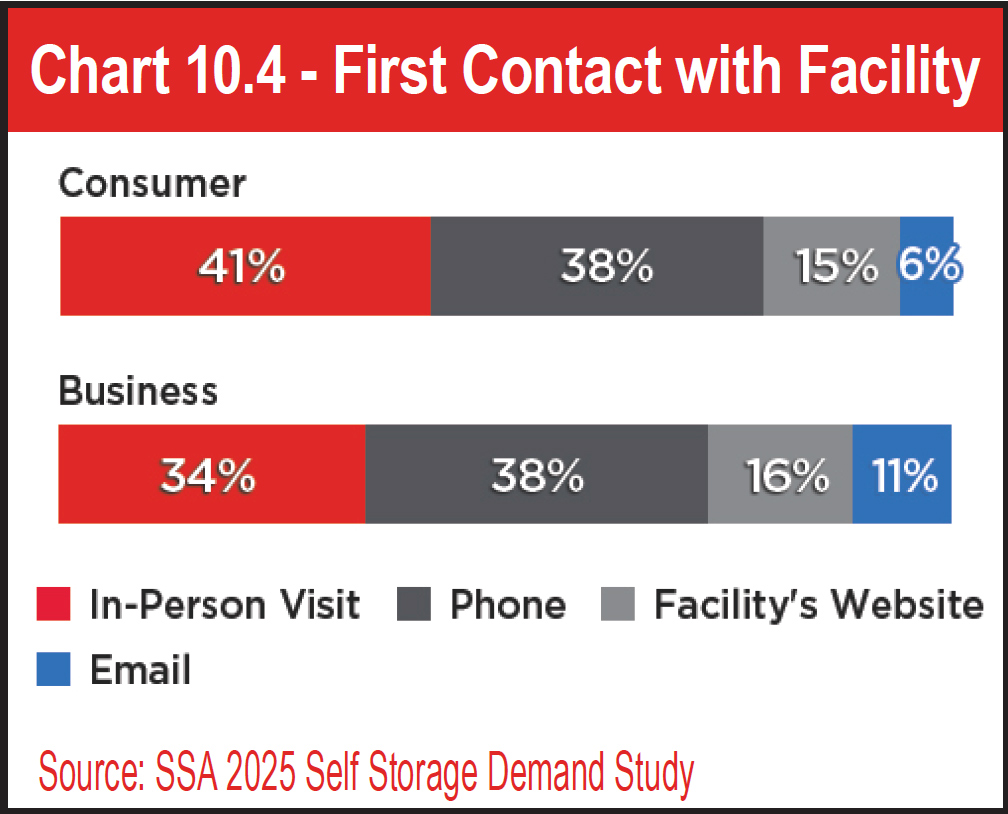
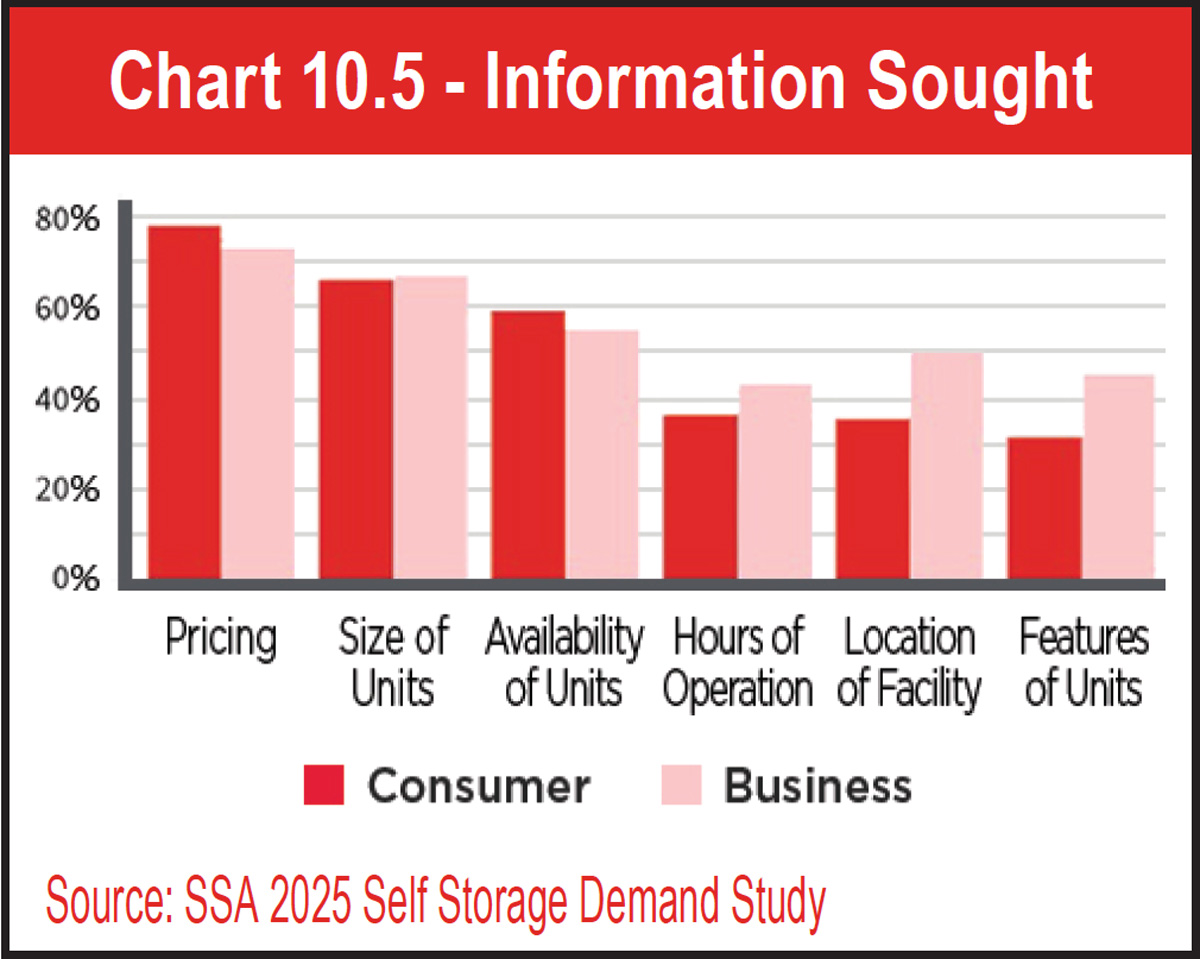
See Chart 10.5.
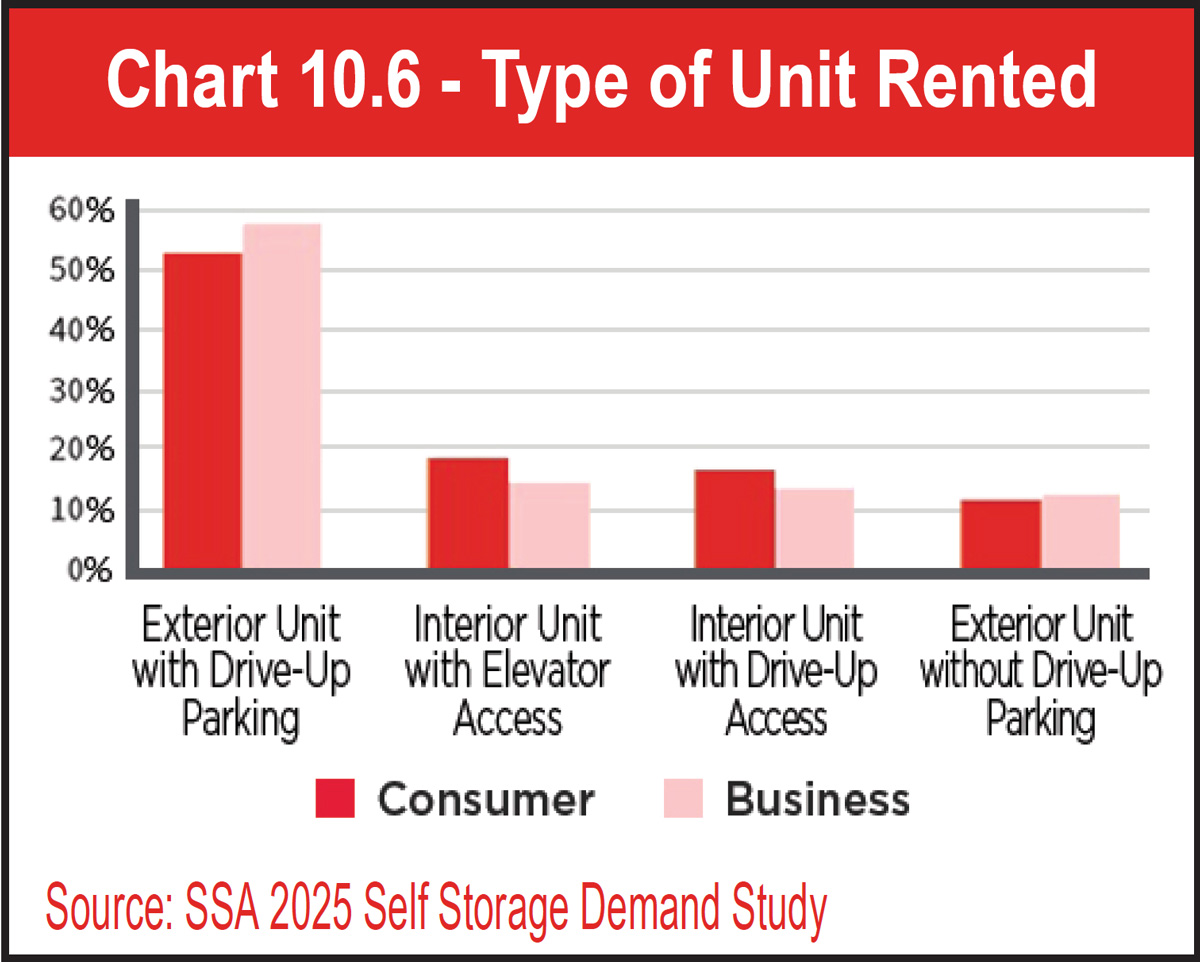
See Chart 10.6.
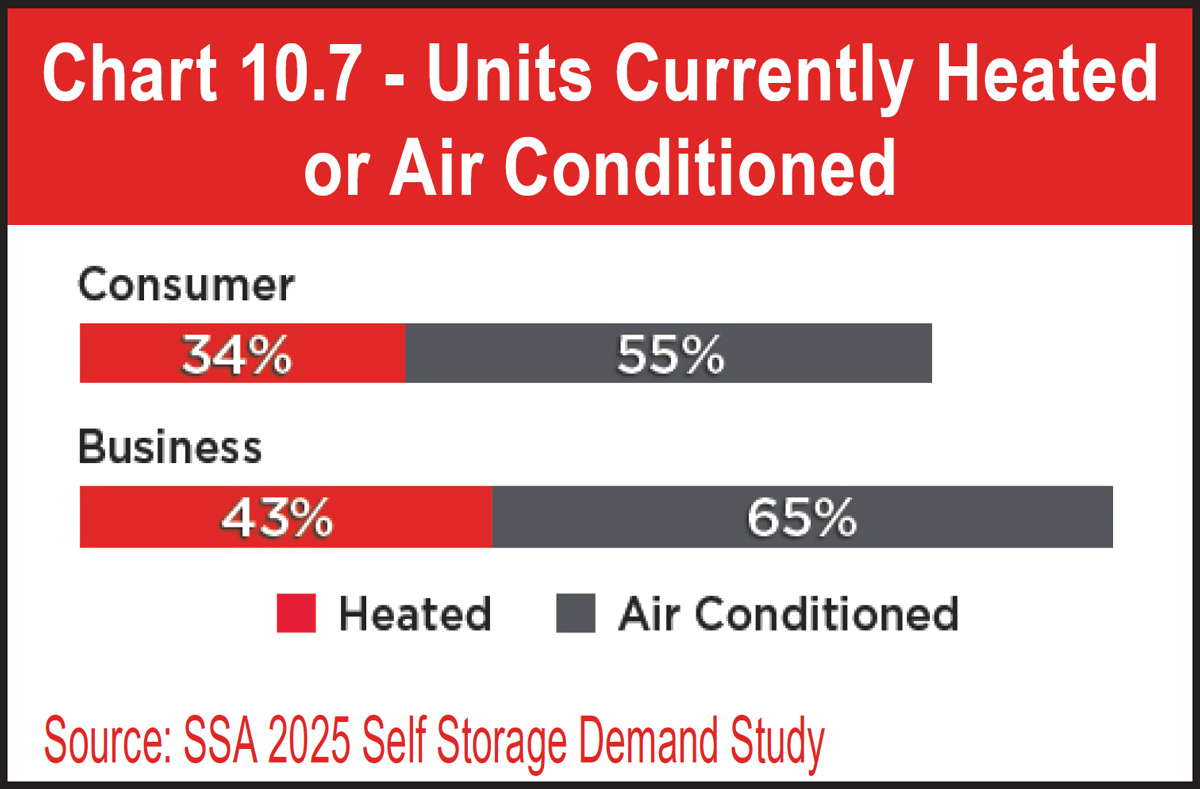
See Chart 10.7.
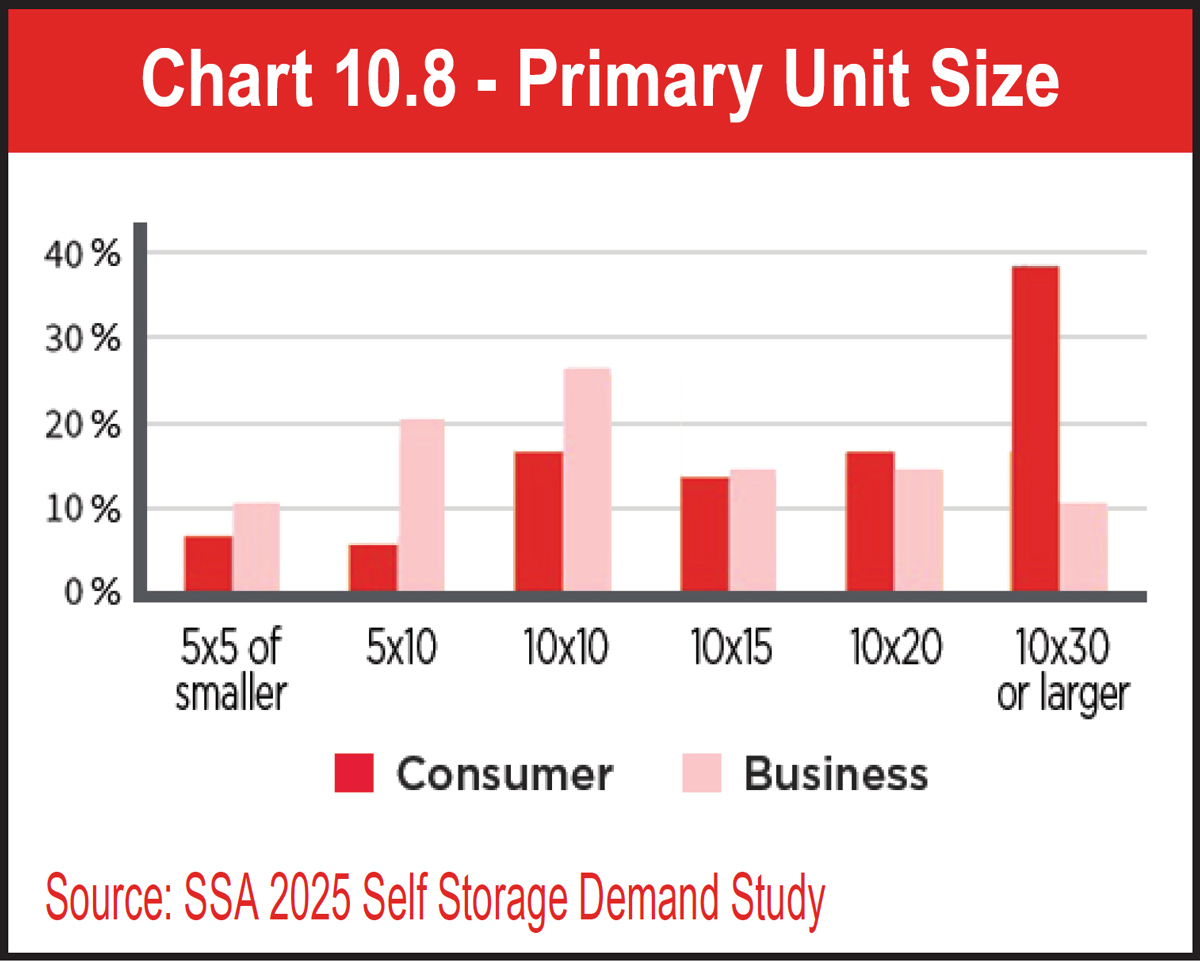
See Chart 10.8.
According to the 2025 Self Storage Demand Study, the top three types of business renters are computers/IT, retail, and manufacturing. These business renters are using self-storage to store inventory (43 percent) and office supplies, furniture, or equipment (41 percent). Because their storage needs are vast, business renters often rent multiple units to adequately house their inventory, supplies, tools, and/or equipment. Thirty percent of business renters rent four or more units. Another 44 percent rent either two or three units, while 26 percent rent only one.
See Chart 10.9.
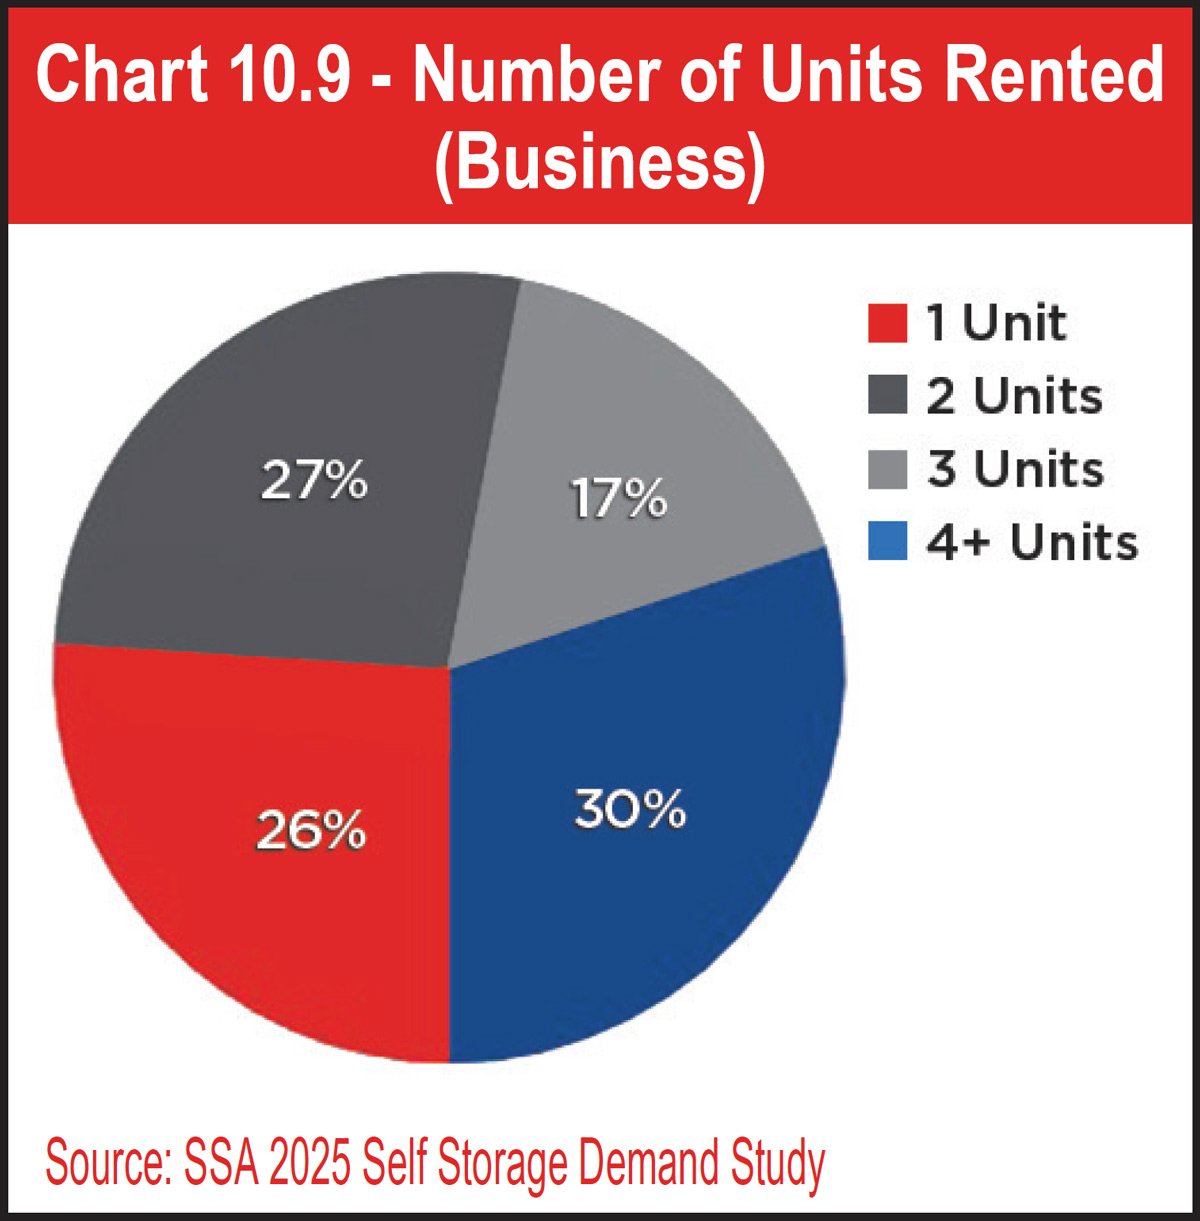
See Charts 10.10a and 10.10b.
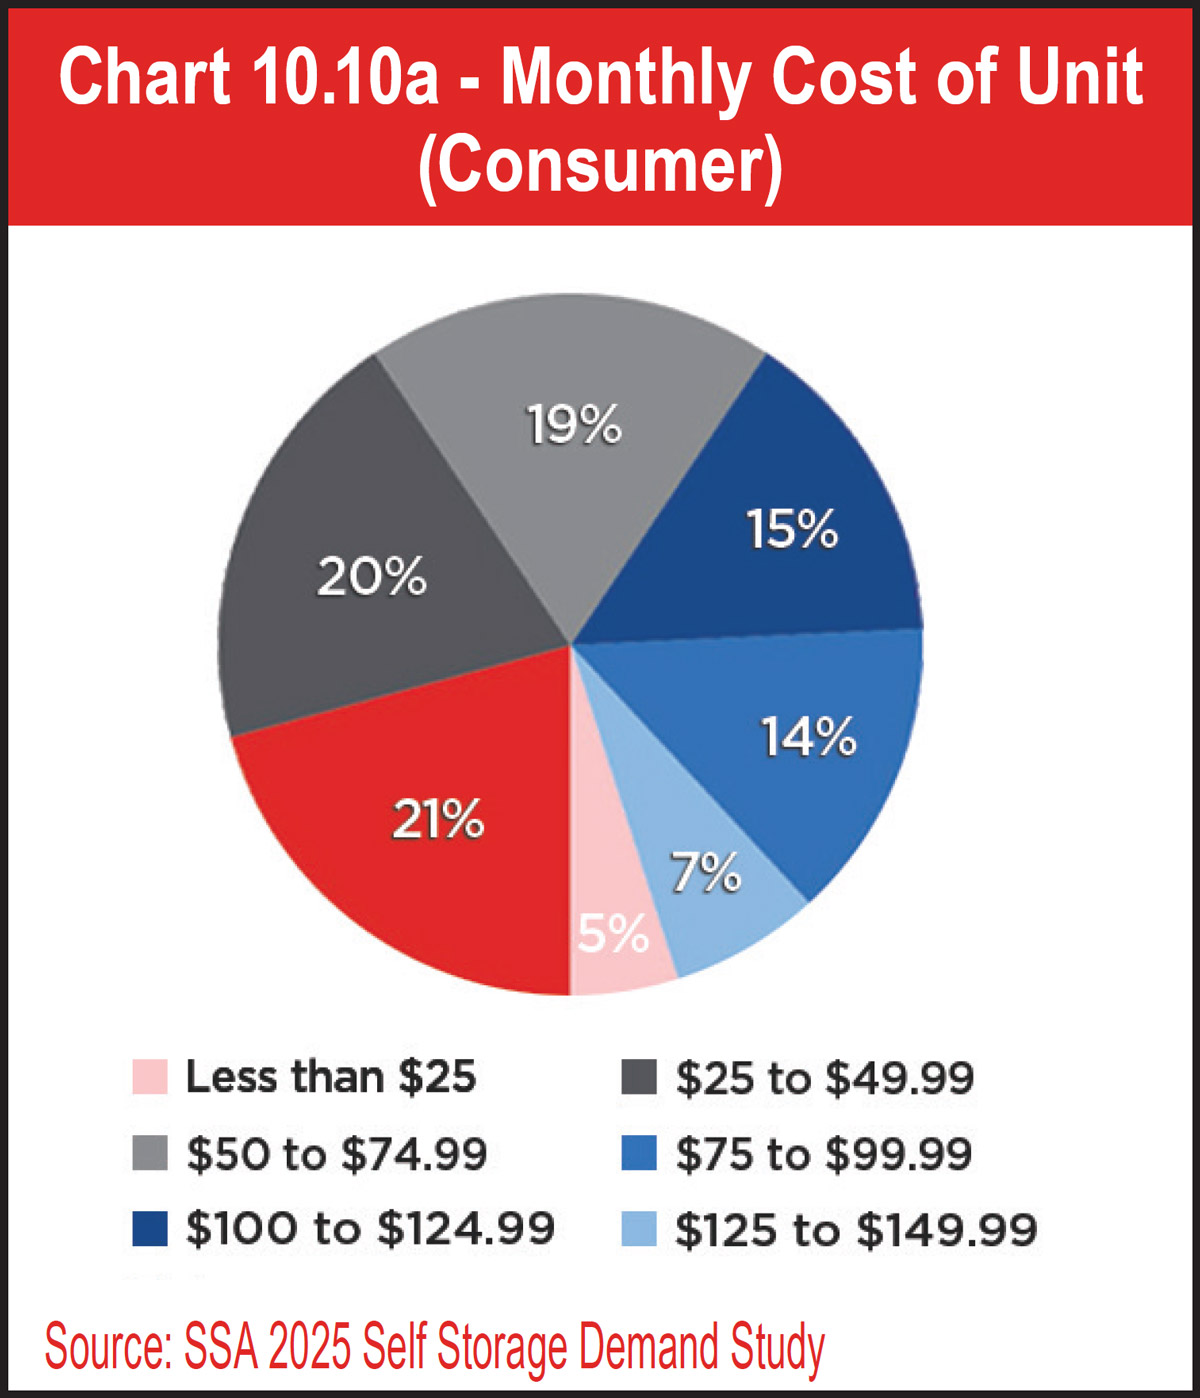
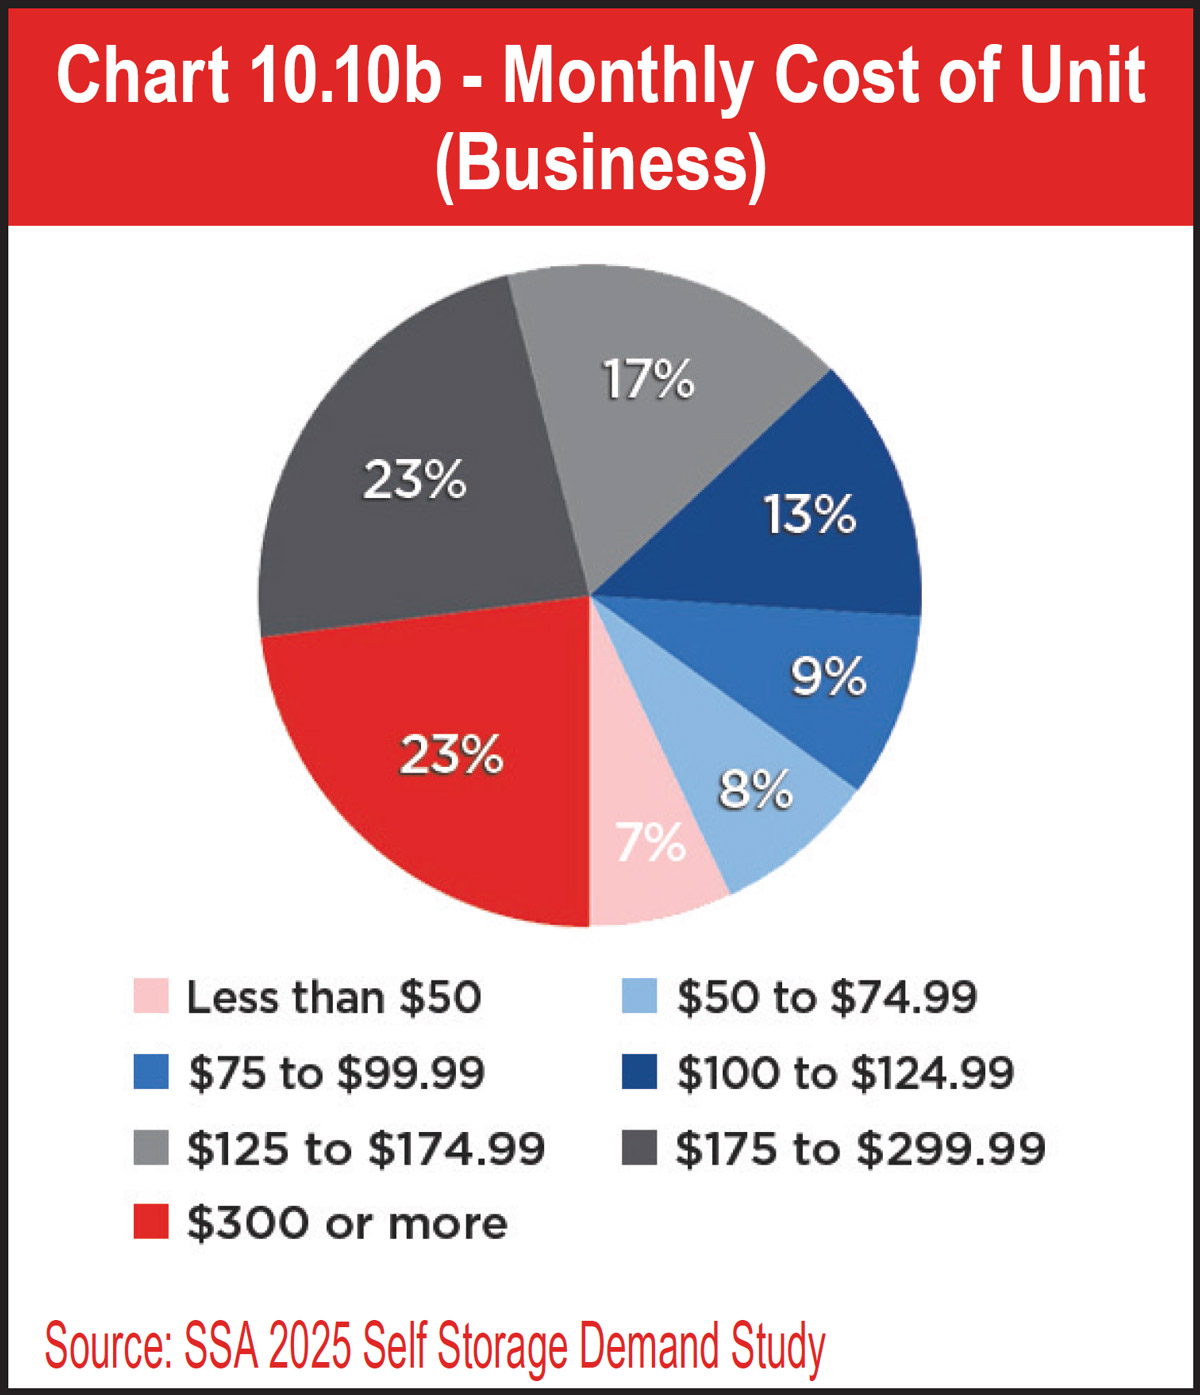
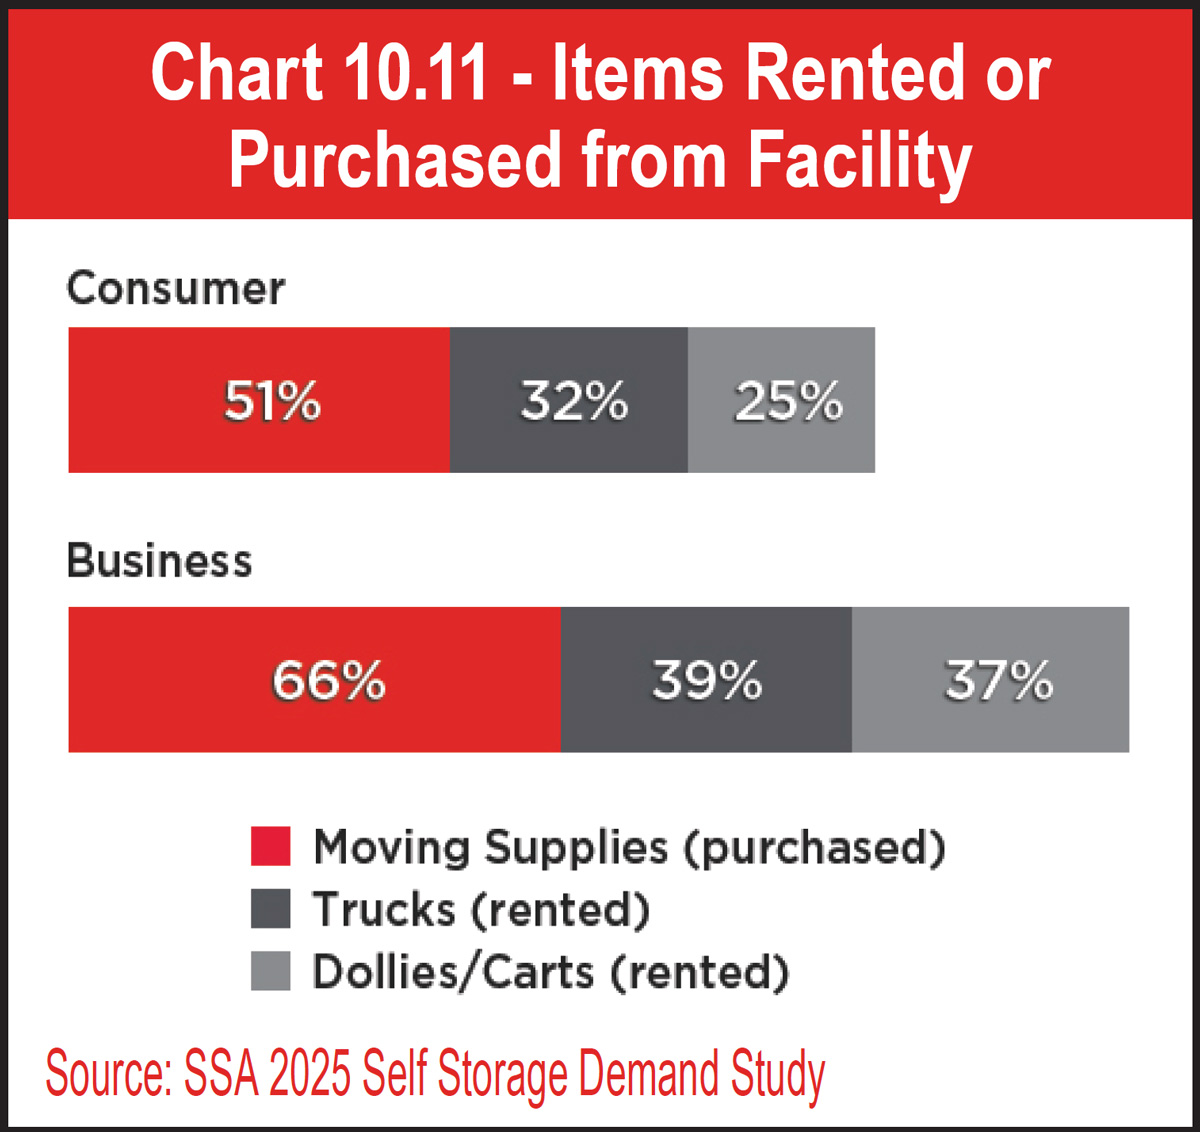
See Chart 10.11.
See Table 10.2.
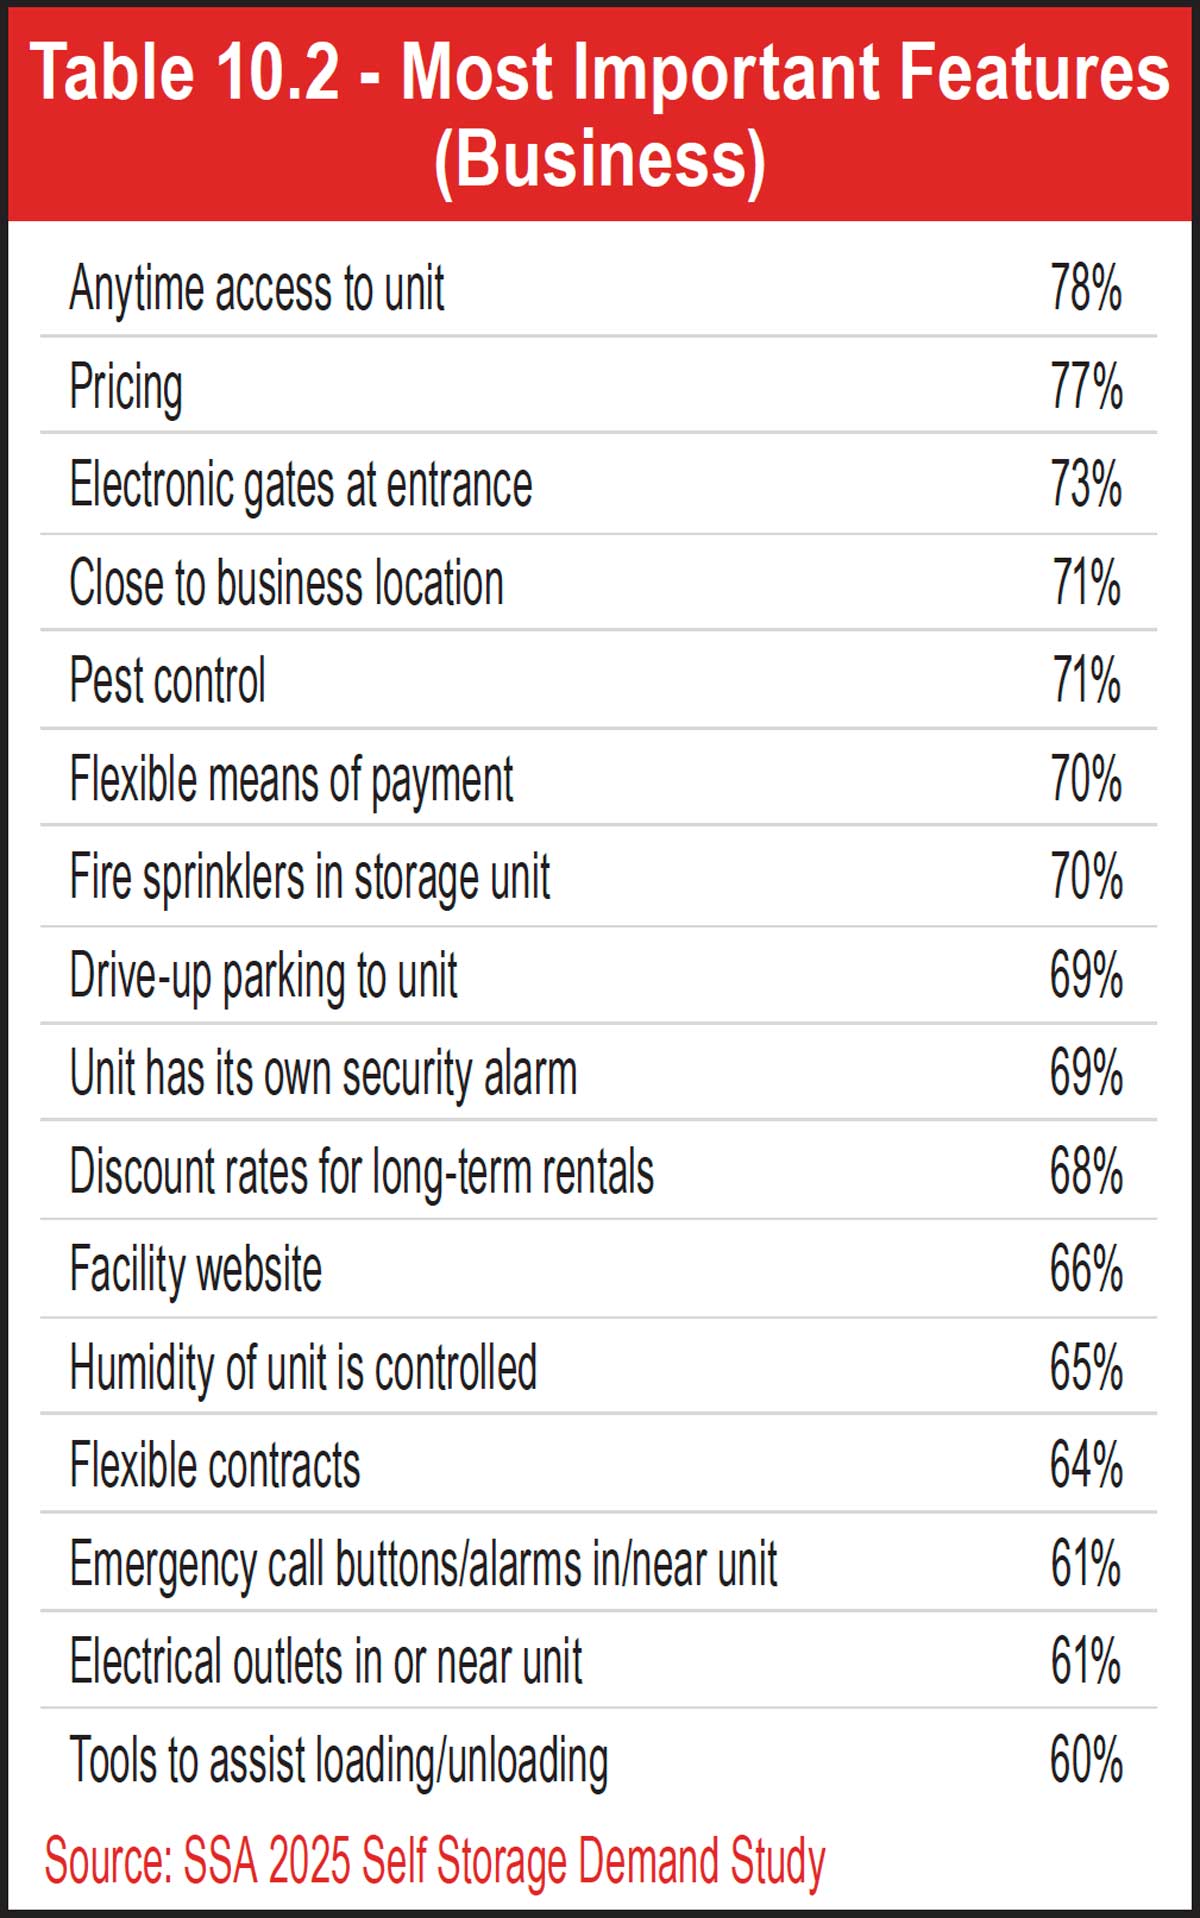
See Table 10.3.
See Chart 10.12.
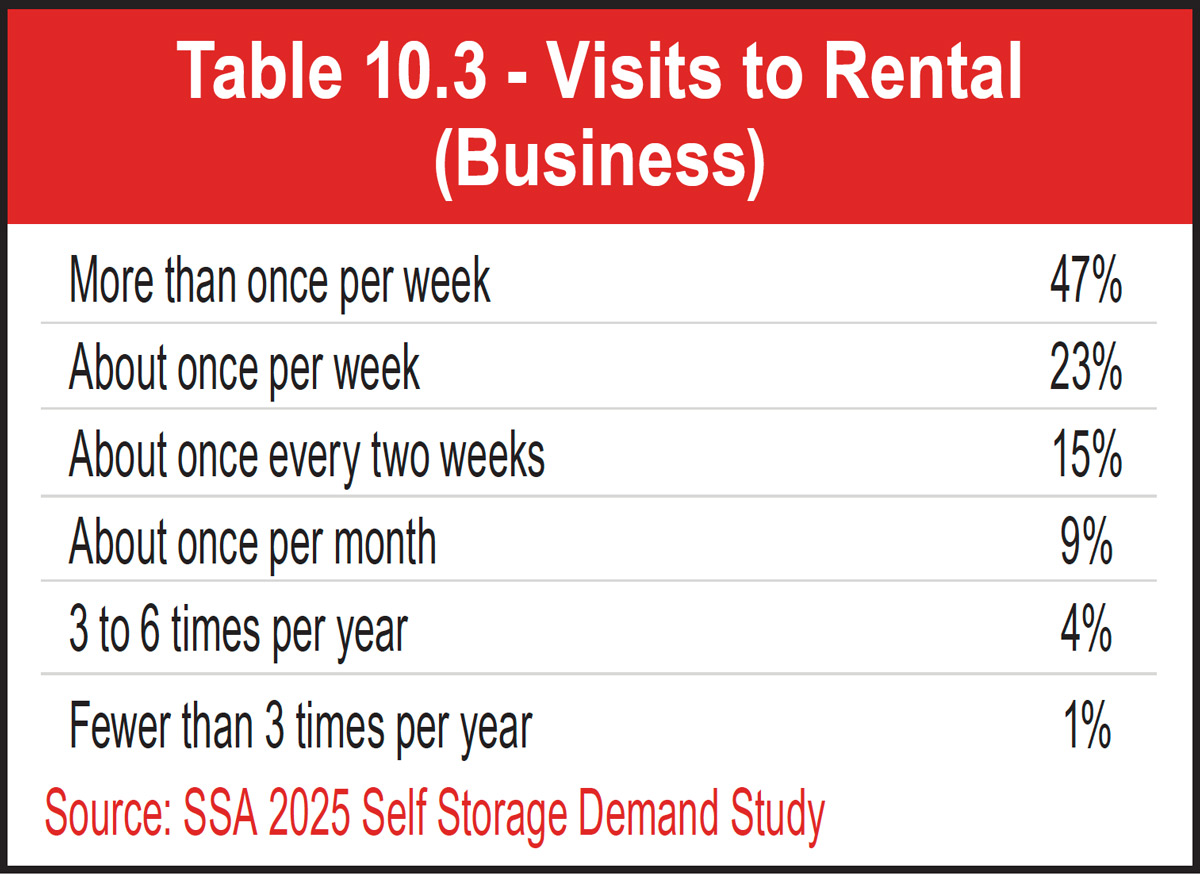
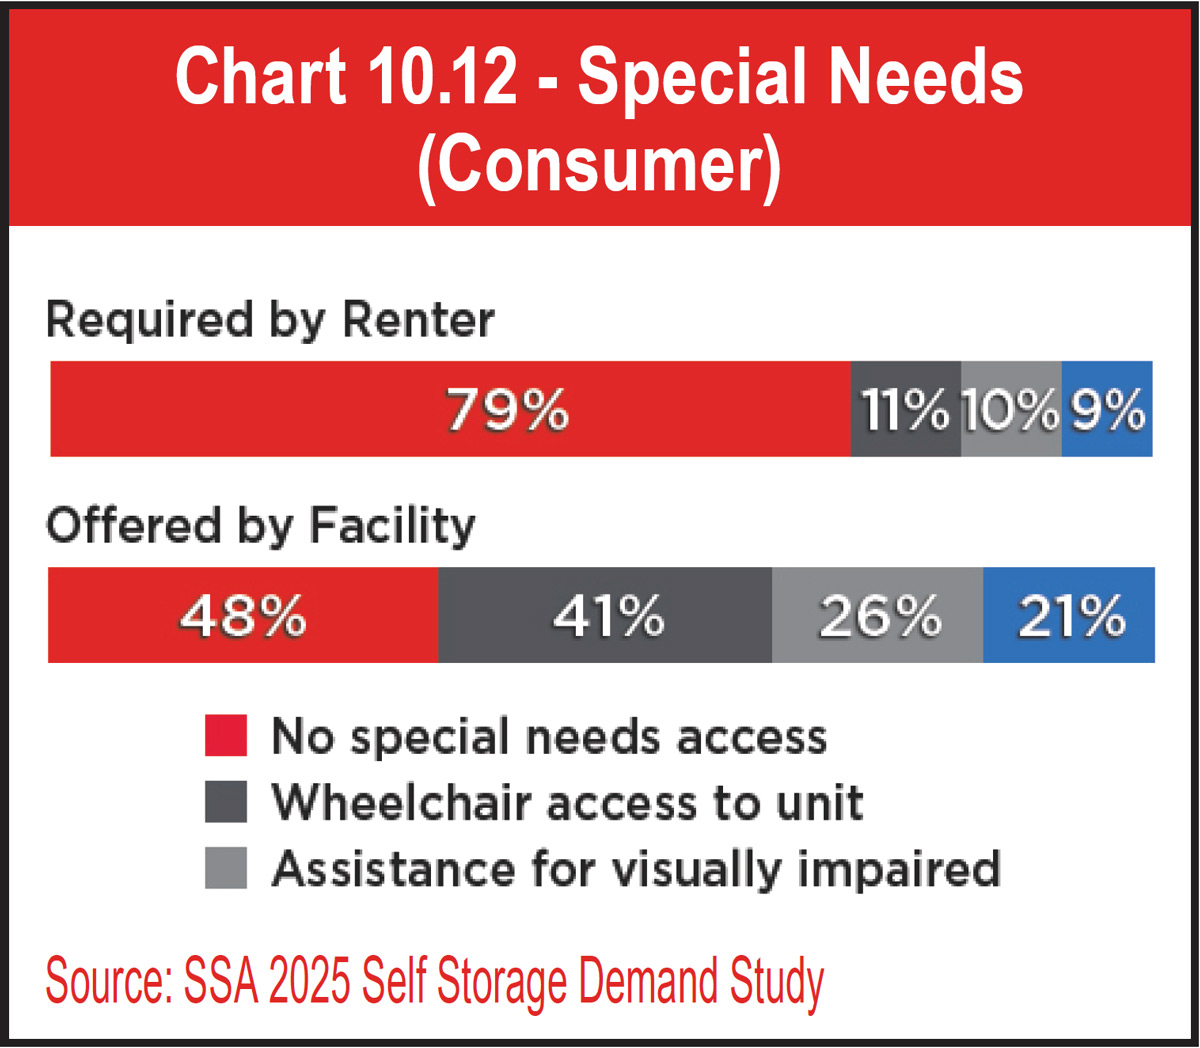
See Chart 10.13.
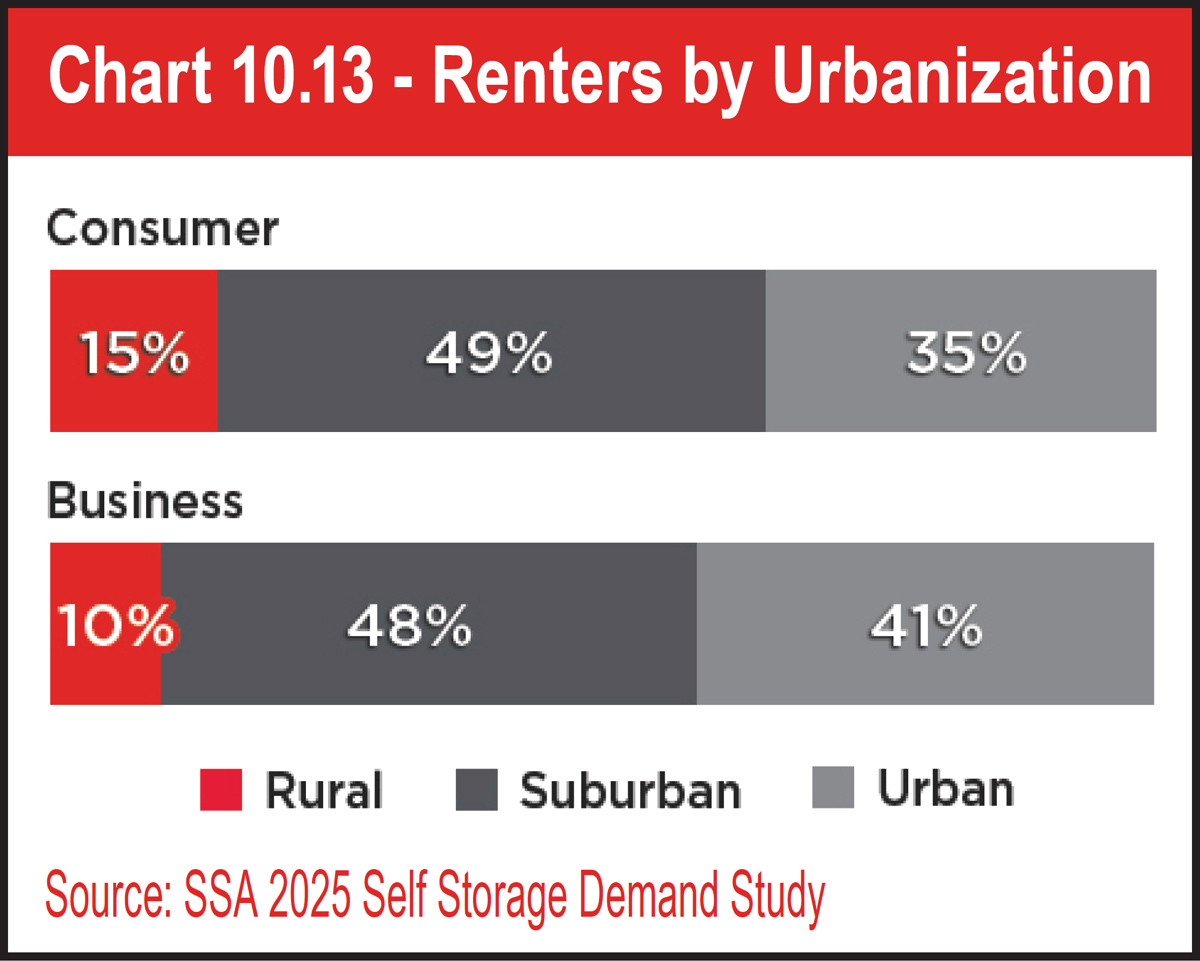
See Charts 10.14a and 10.14b.
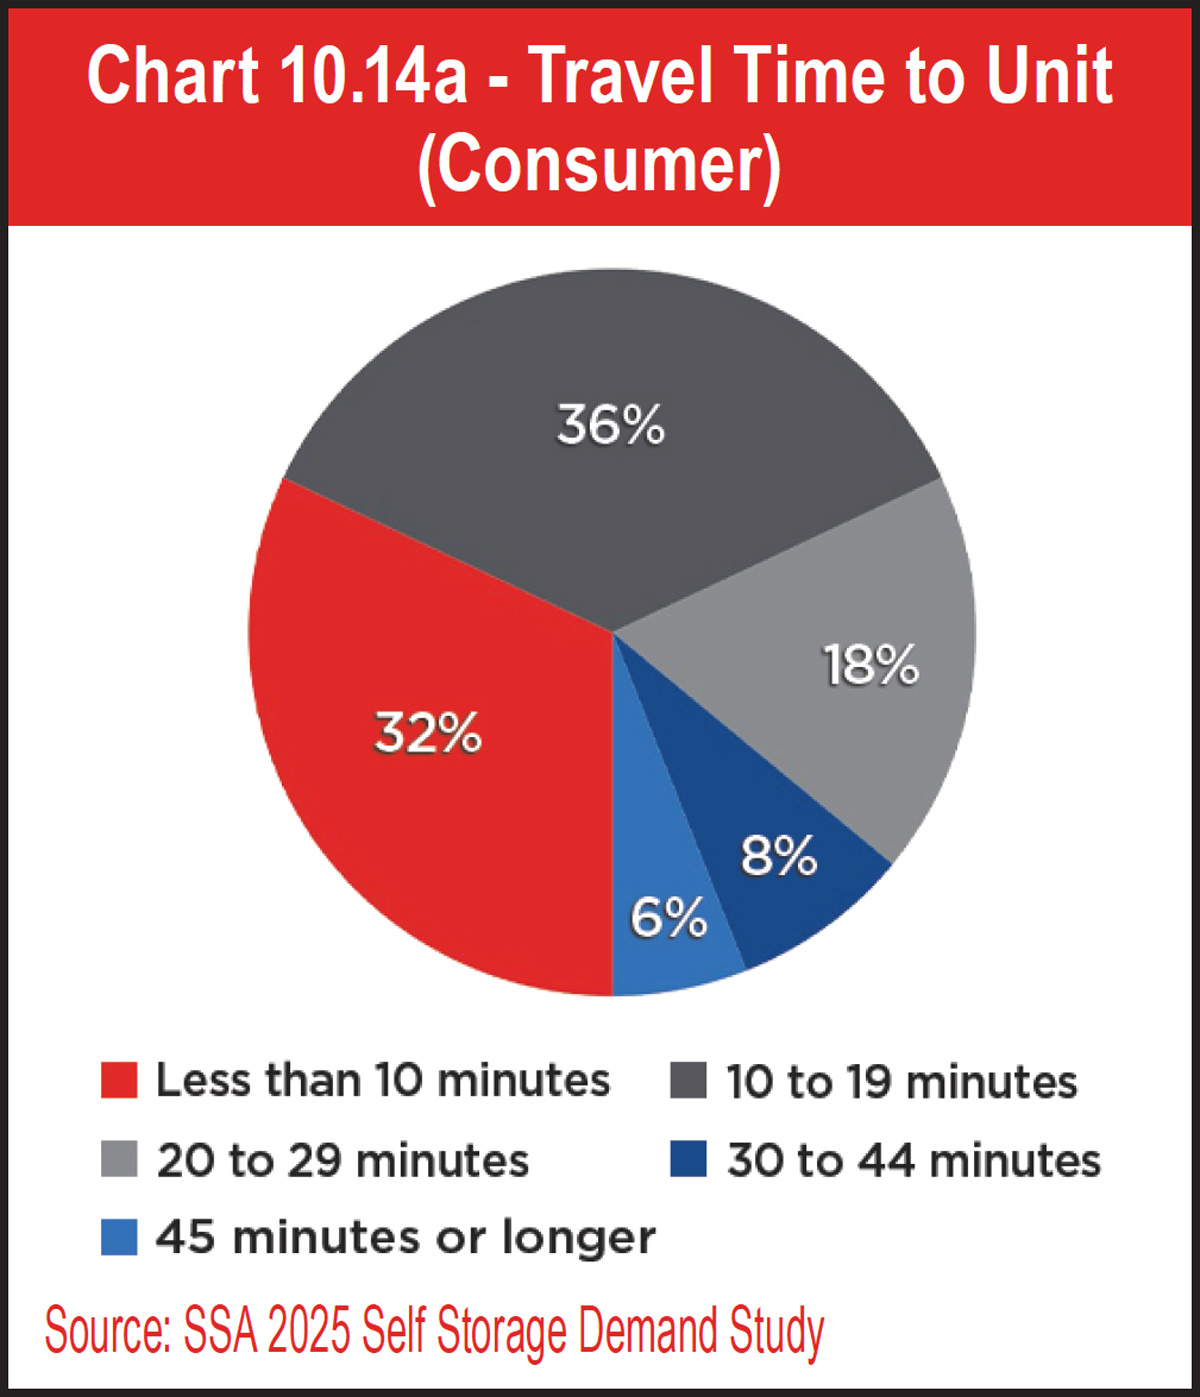
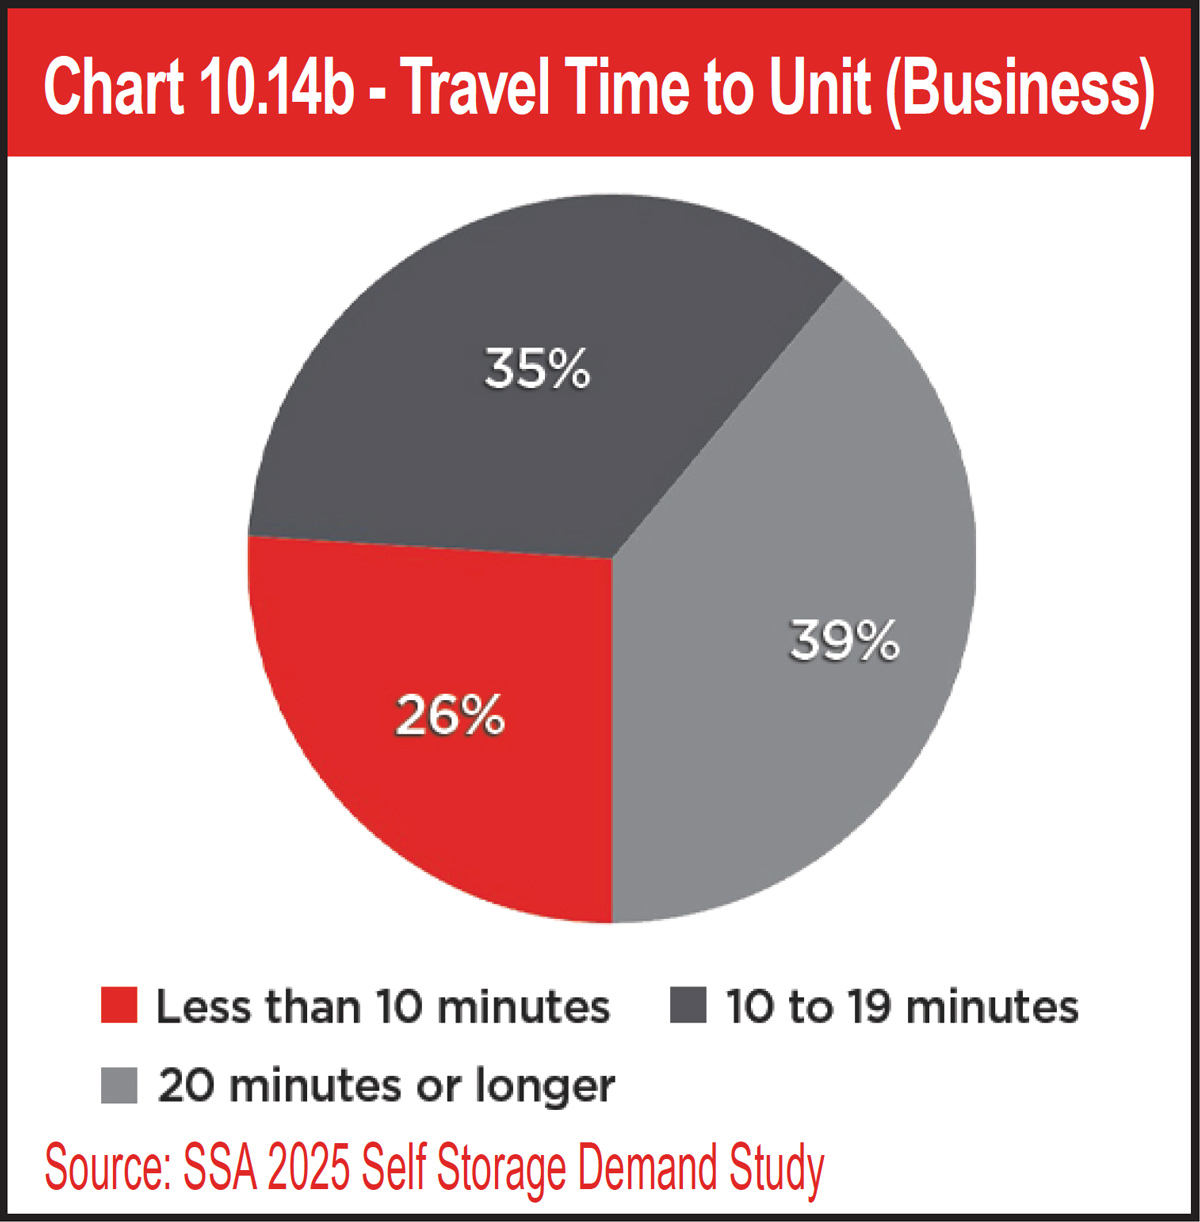
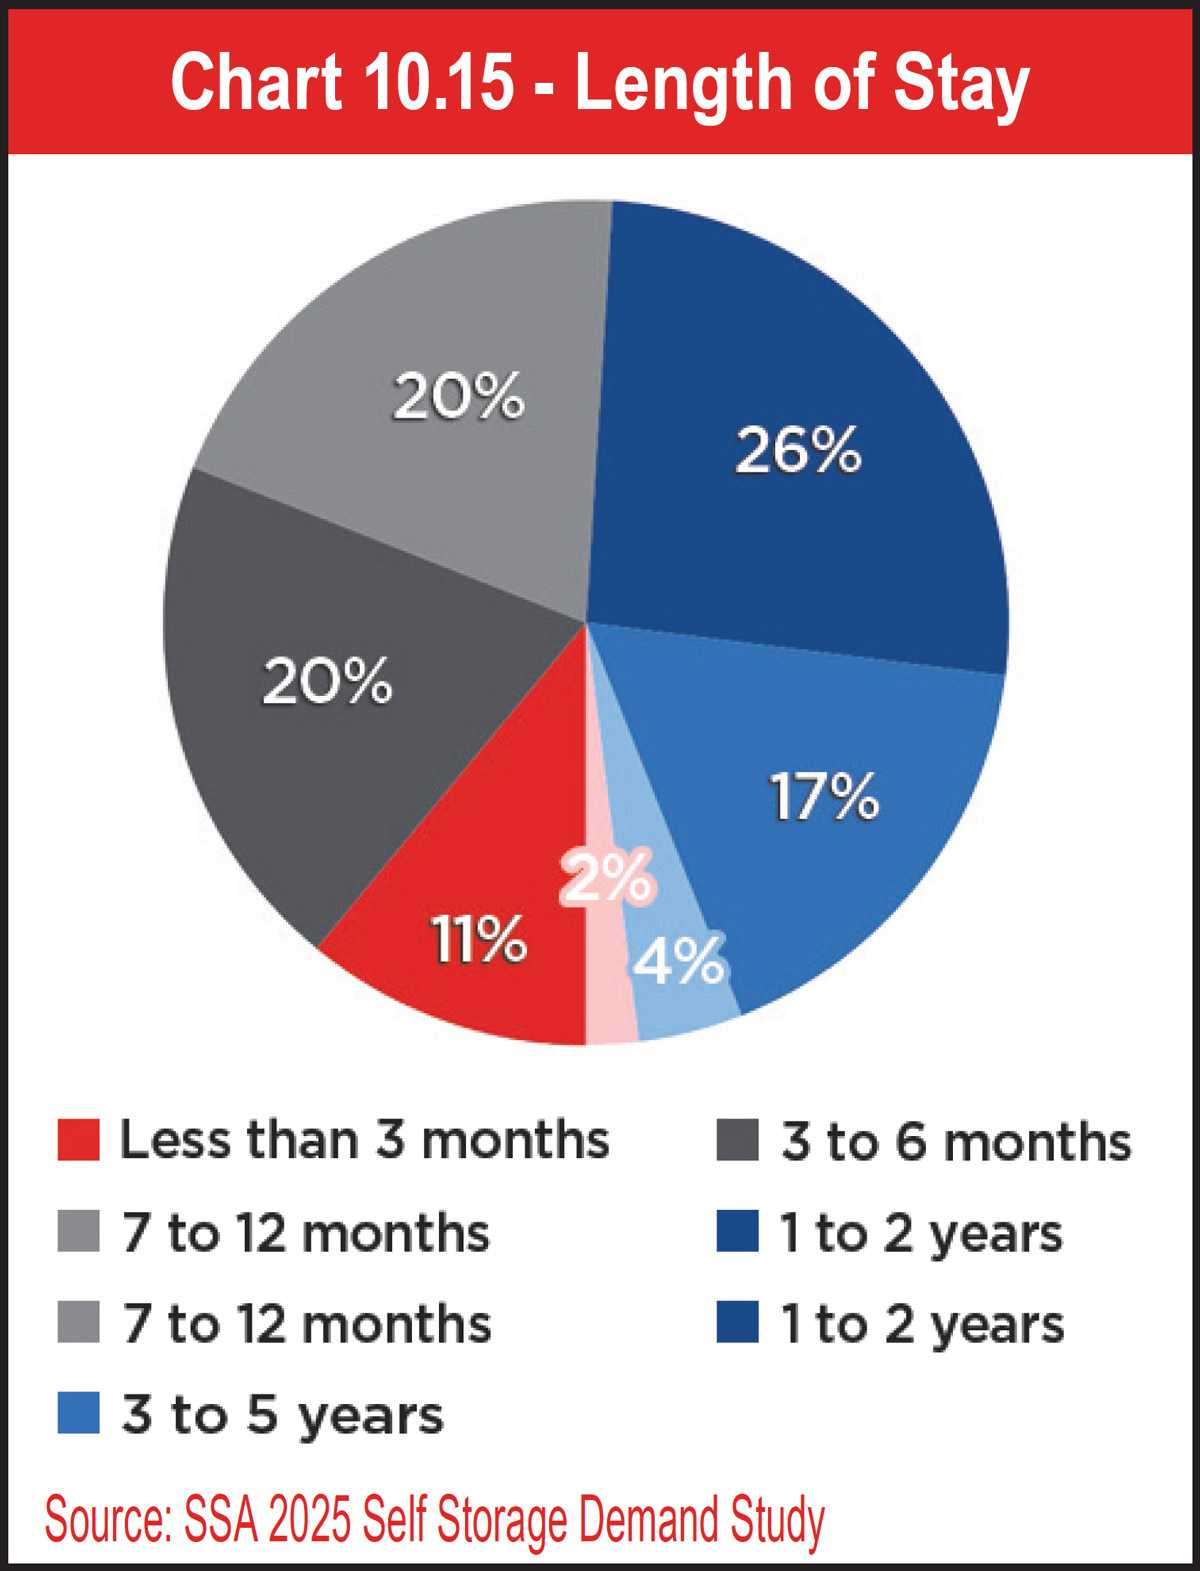
See Chart 10.15.
By generation, boomers are more likely to stay longer than two years than any other age group; in fact, they are twice as likely to stay two years or longer than Gen-Z renters (30 percent vs. 15 percent). Gen-Z renters’ storage needs seem to be more short term, with 26 percent staying three to six months. Millennials primarily stay one to two years (29 percent). As for Gen-X renters, like boomers, they most often rent for longer than two years (27 percent). Chart 10.16 also shows that only approximately one in 10 renters will move out within the first three months regardless of age.
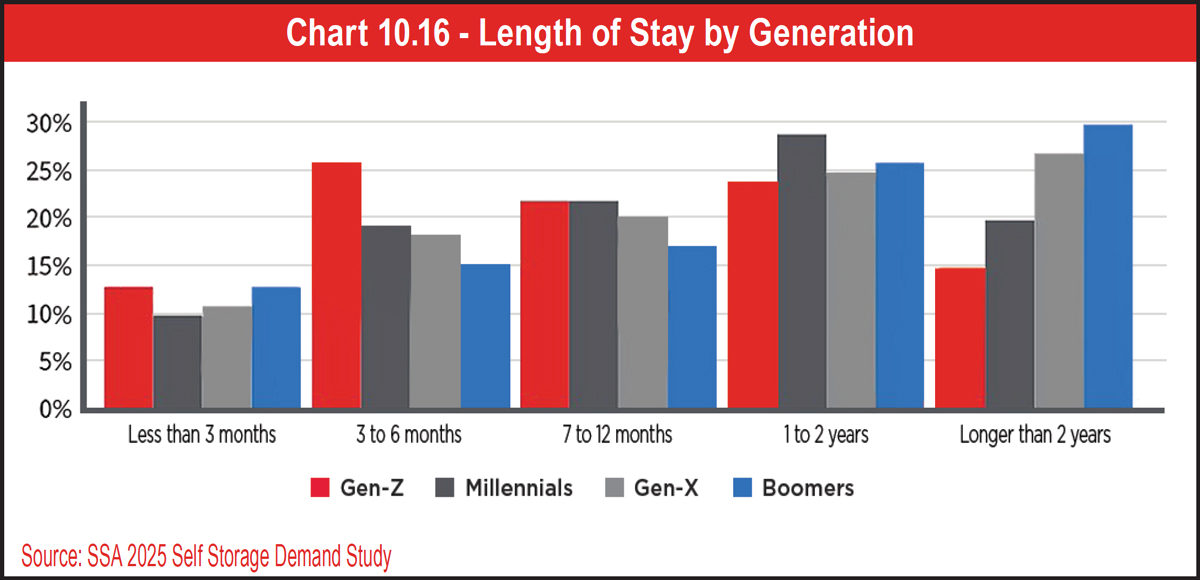
See Chart 10.17.
On a regional level, both the largest and smallest percentages tallied were for the West, where 28 percent of renters stay longer than two years and merely 9 percent stay for less than three months. Overall, renters in all regions tend to stay for one to two years and about 40 percent total stay between three and 12 months.
See Chart 10.18.
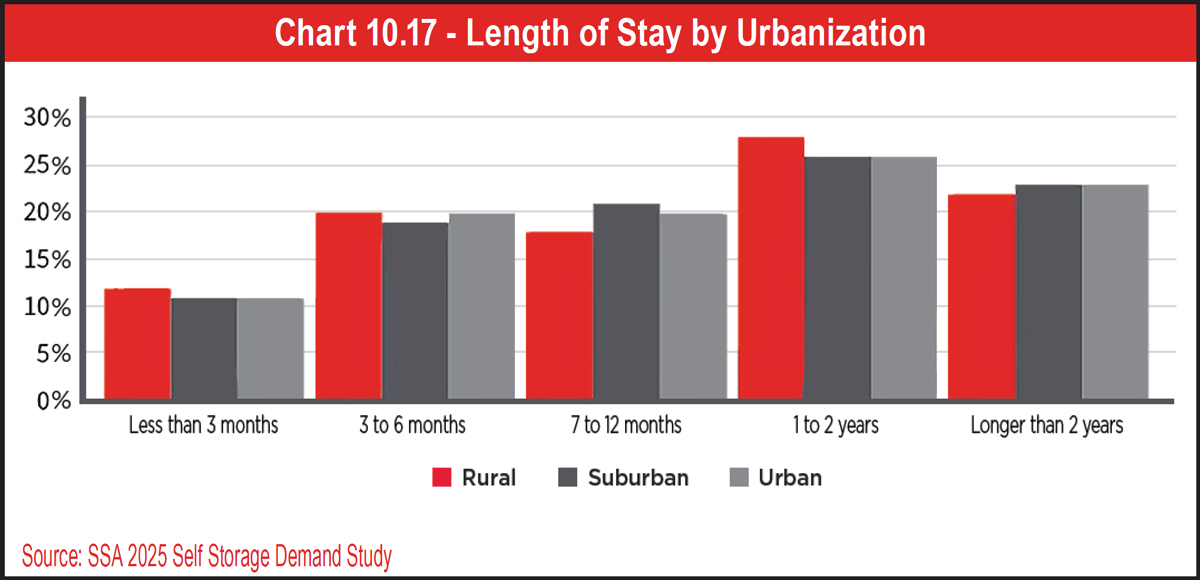
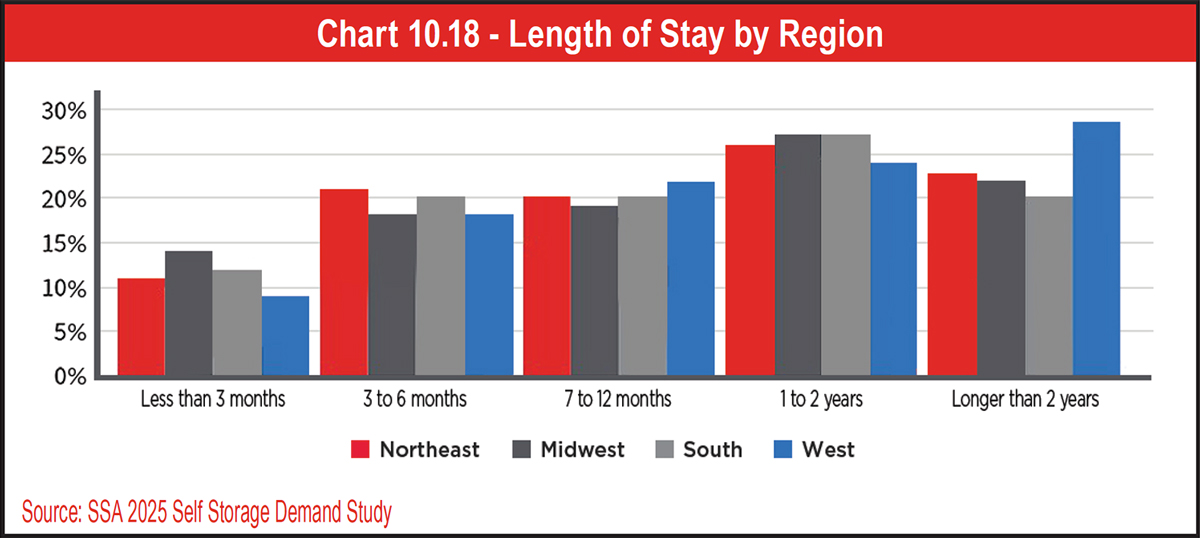
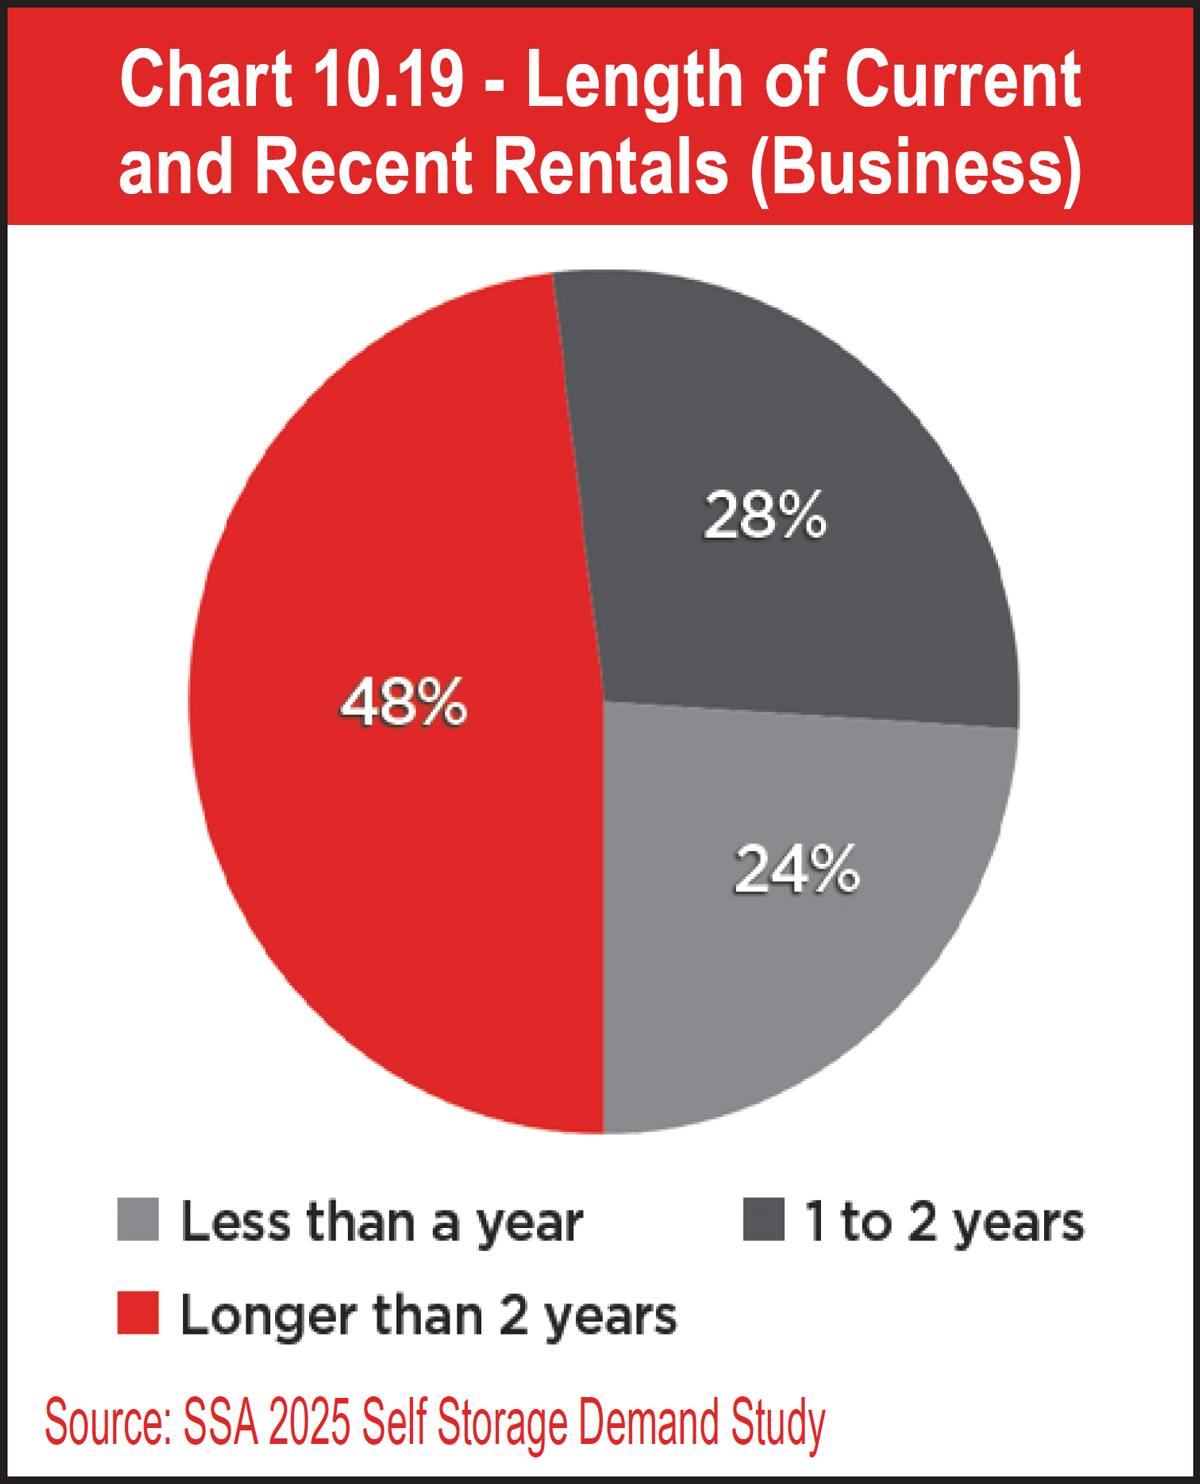
See Chart 10.19.


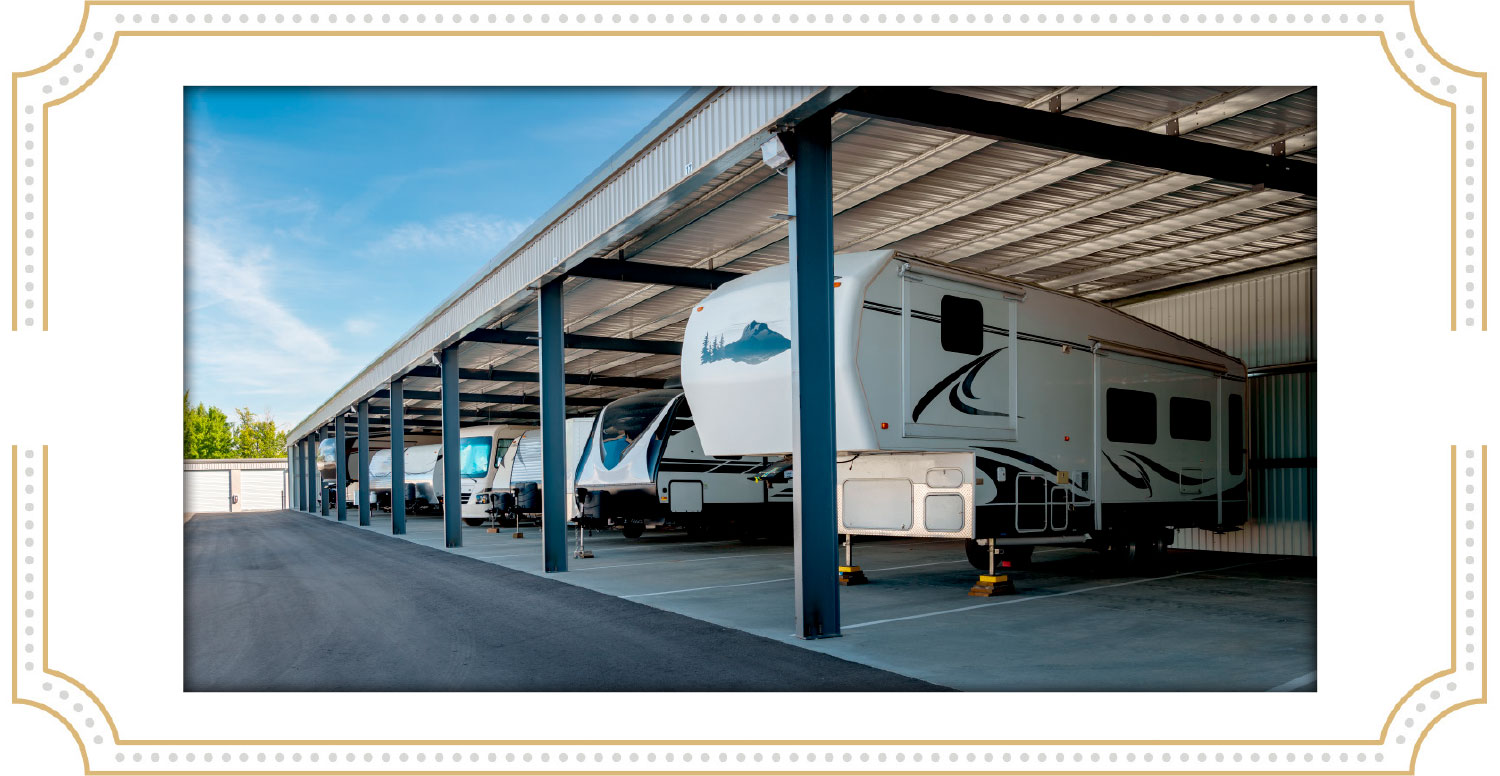
arking rents have improved significantly, up 4.4 percent year over year in September 2025. Advertised annualized rental rates for the main parking unit sizes increased to $6.38 per square foot in September 2025, up 4.4 percent year over year on a same-store basis. Rent growth improved significantly from 1.1 percent as of Yardi Matrix’s April 2025 report and was led by the smallest parking units (10-by-20, 10-by-25, and 10-by-30), which are more commonly used for personal vehicles and smaller boats and more likely to be located at traditional self-storage properties. Rents for these units were up an impressive 5.6 percent, while rents for the medium (12-by-20, 12-by-25, and 12-by-30) and large (12-by-40, 12-by-45, and 12-by-50) units that are more suitable for RVs were up 1.5 percent and 1.1 percent, respectively.
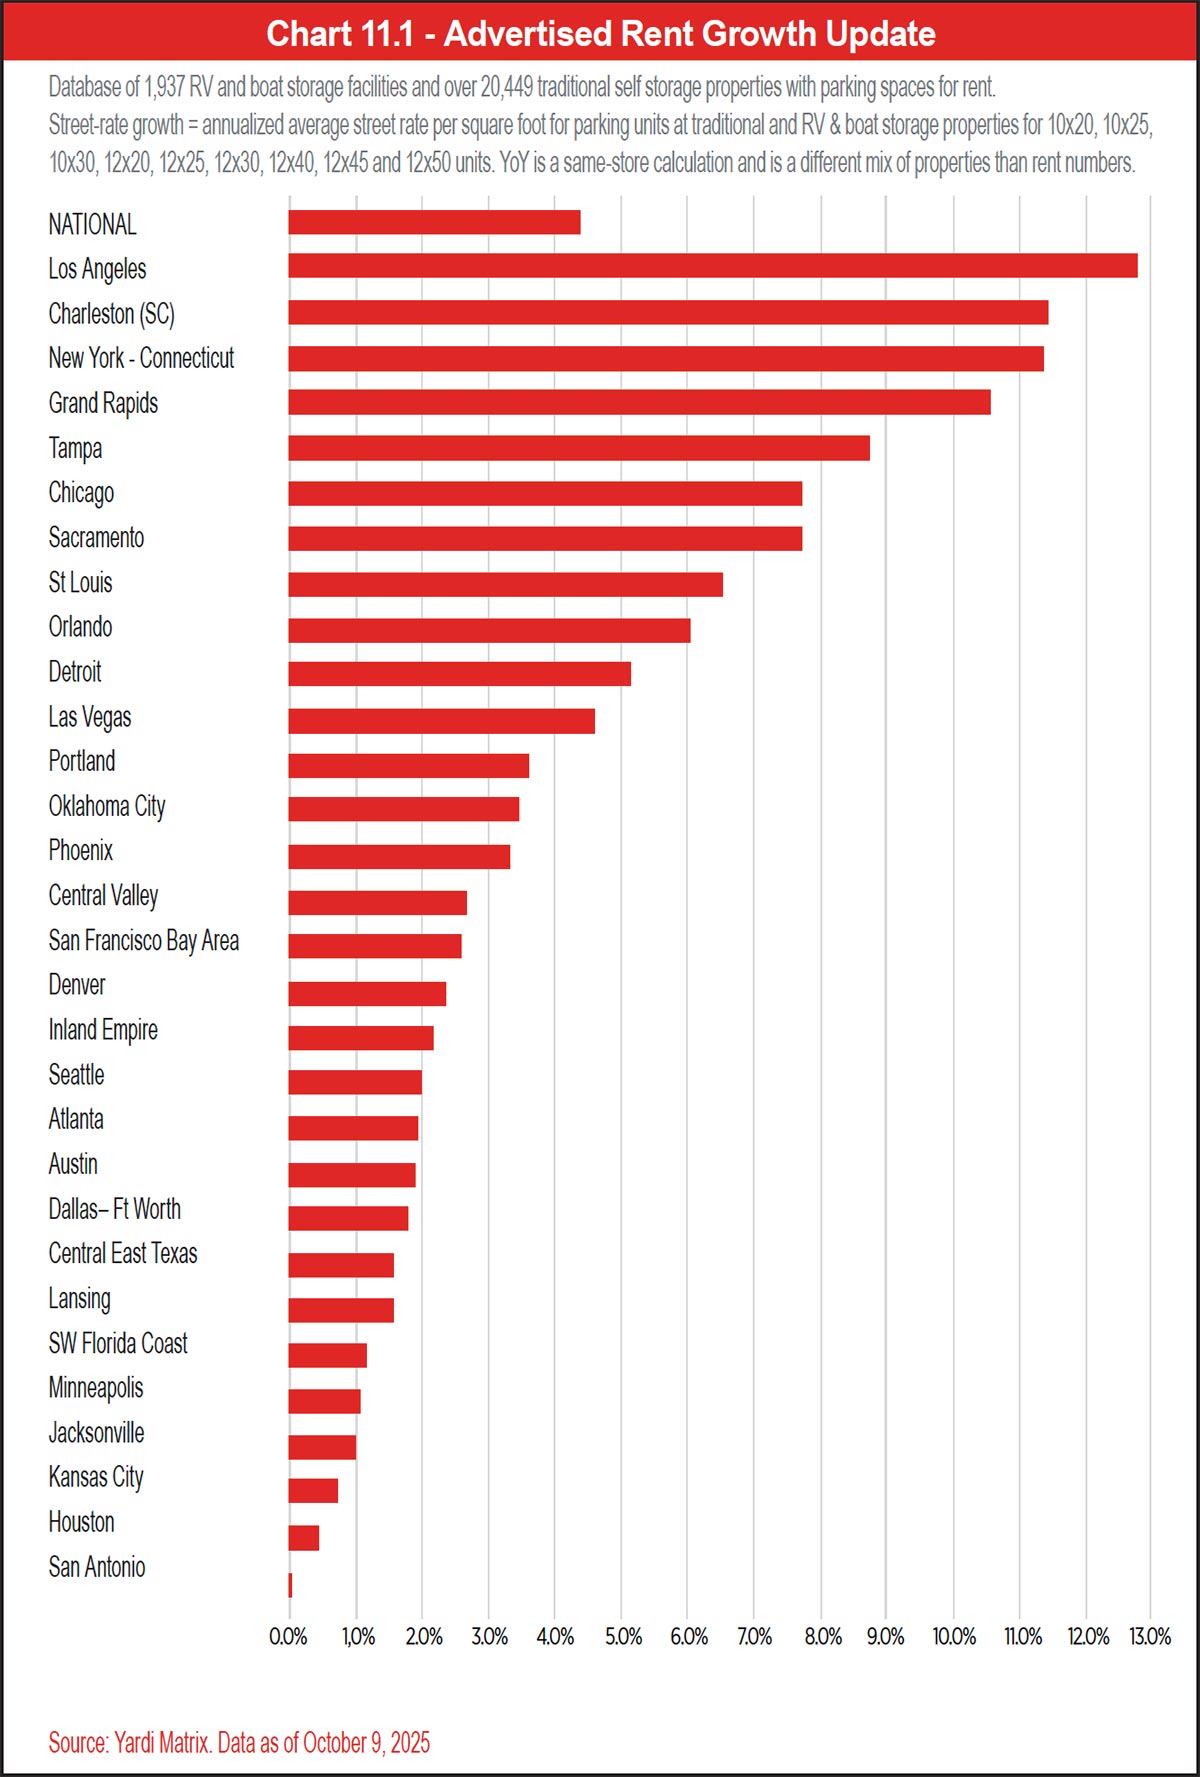
Sun Belt markets with lots of supply delivered over the past few years posted the slowest rent growth, including San Antonio (0 percent), Houston (0.5 percent), Jacksonville (1 percent), the Southwest Florida Coast (1.2 percent), and Dallas (1.9 percent), along with Midwest markets Kansas City (0.7 percent) and Minneapolis (1.1 percent). In these six markets, trailing 36-month supply as a percent of inventory averaged 19.7 percent, compared to 13 percent for the U.S. as a whole.
Development of new dedicated RV and boat storage properties continues to slow from its cyclical peak of 2022 to 2024. Acres under construction in September 2025 equated to 2.3 percent of inventory, down from 3.3 percent in September 2024, while trailing 12-month supply as a percent of inventory was 3.7 percent, compared to 5.3 percent one year ago.
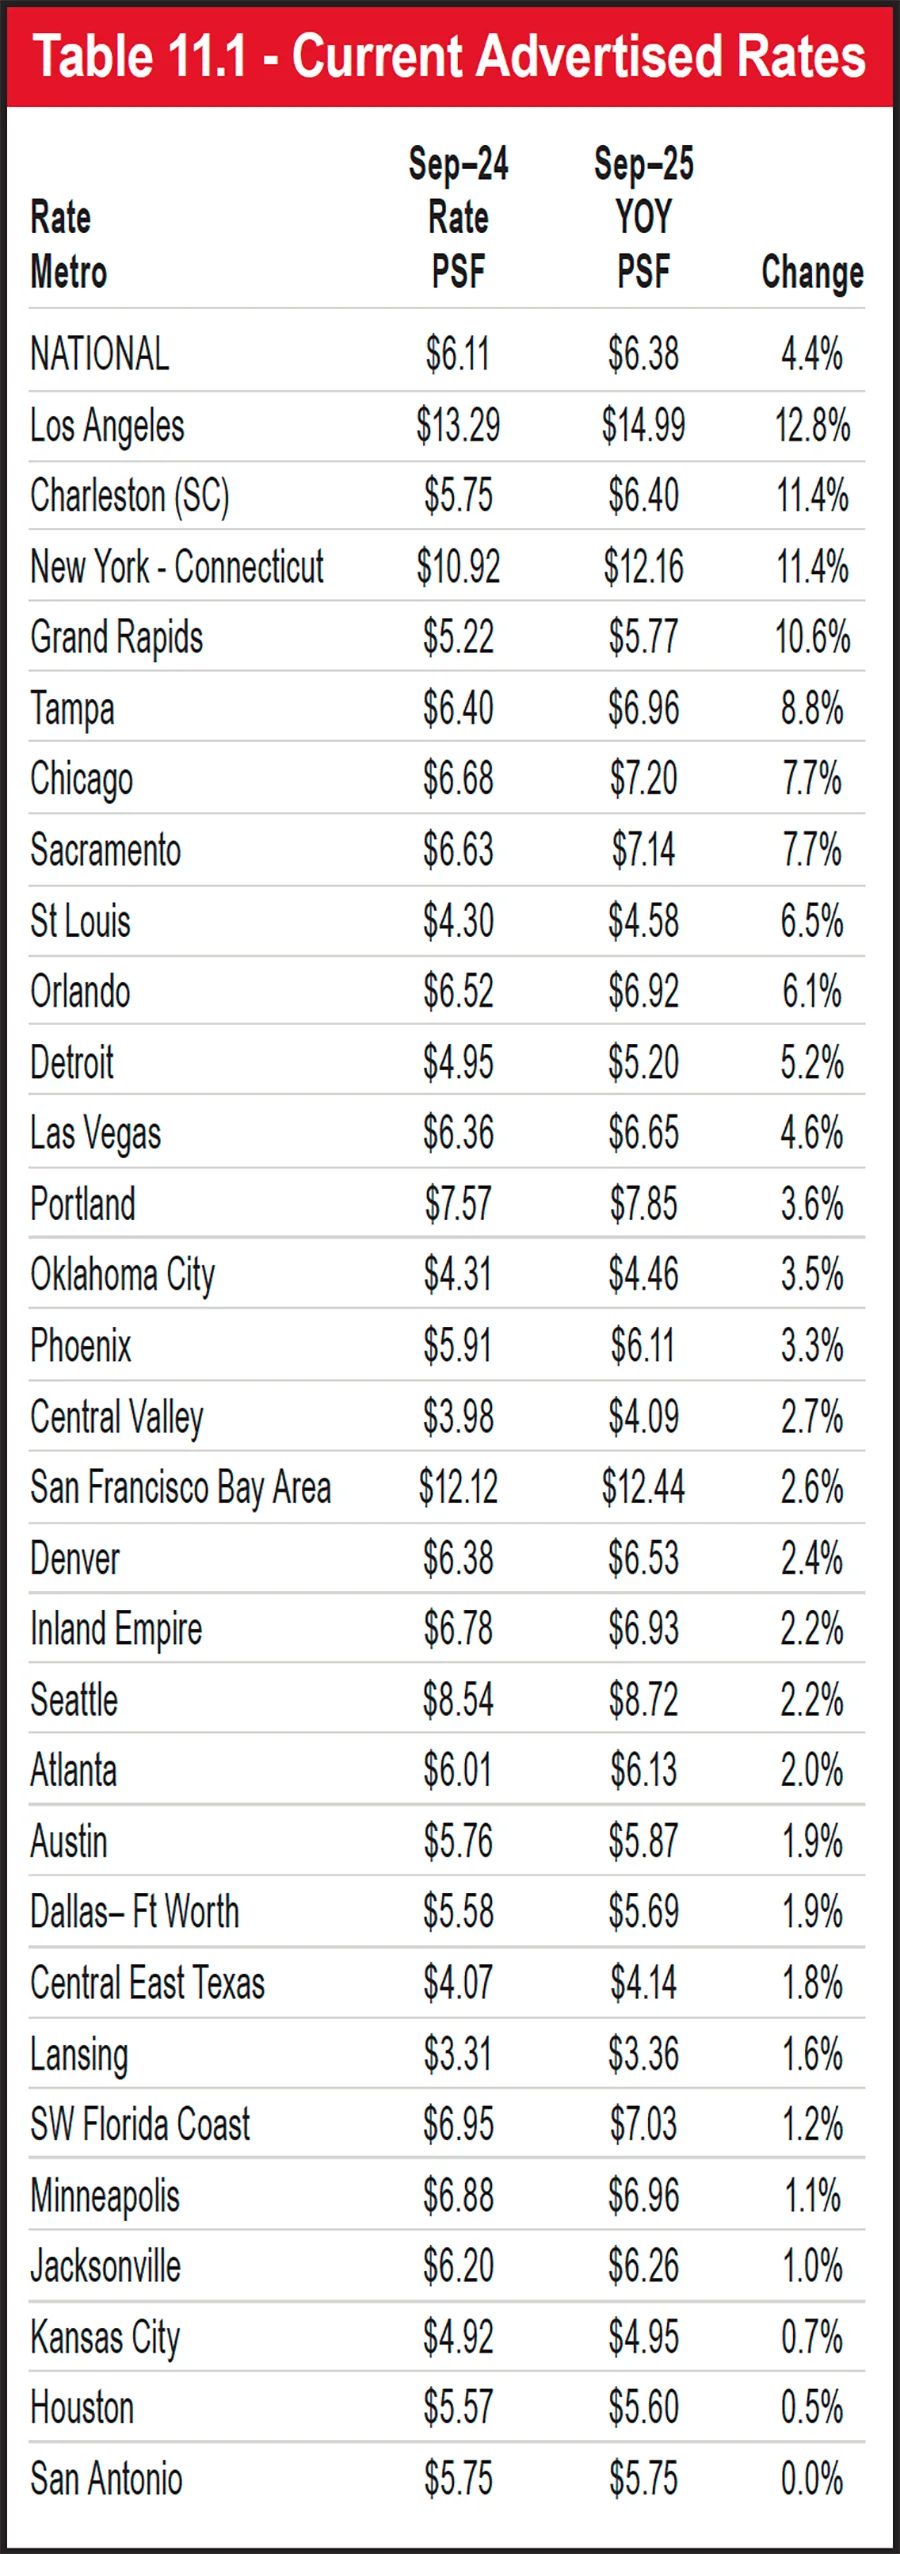
Most of the markets with the strongest parking rent growth have avoided new dedicated RV and boat storage supply this cycle, including Los Angeles, Charleston, New York–Connecticut, Grand Rapids, and Detroit, which have not had any new deliveries in three years, while Tampa, St. Louis, and Orlando have not had any properties deliver in the past 12 months. Chicago stands out since it has had five new properties deliver in the past three years yet still managed to post above-average growth.
See Chart 11.1.
See Table 11.1.
Despite having some of the highest rent levels per square foot, larger metro areas like Los Angeles and New York have seen higher growth rates recently due to a noticeable lack of development and high barriers to new supply. Much of the development activity in recent years has focused on high-growth Sun Belt markets, which has put pressure on rent growth in Texas and Florida in particular. Parts of the Midwest where RVs and boating are popular, such as Kansas City and Minneapolis, have also attracted new supply that has led to weaker rent growth.
See Chart 11.2.
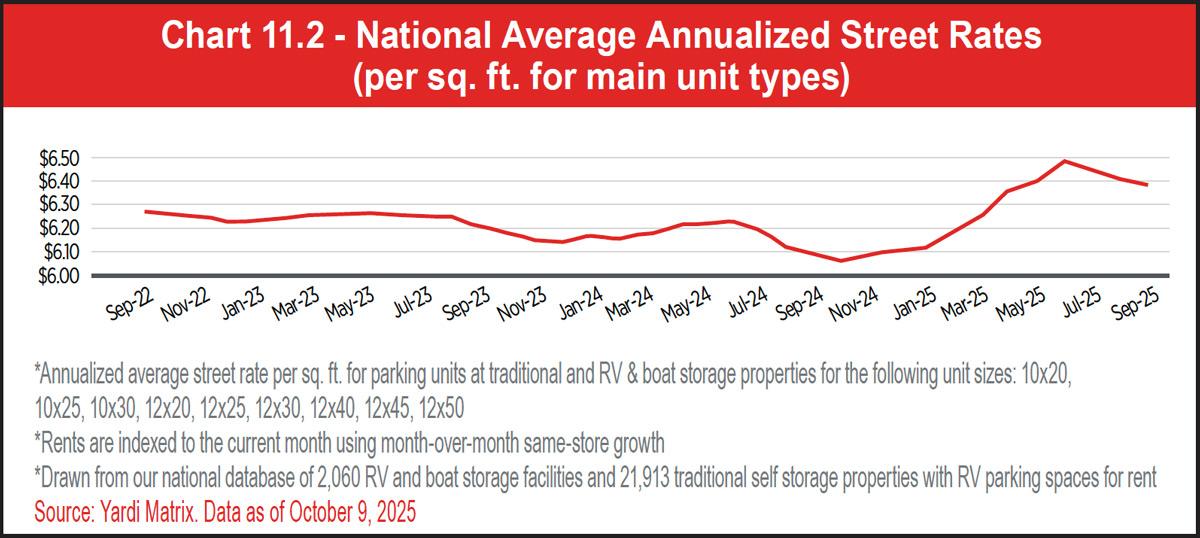
See Table 11.2.
Most of the supply delivered in the past year was concentrated in a few markets, as 13 of the top 30 markets have not had any new facilities built in 12 months. Chicago has seen the greatest percentage increase in supply over this period, although this was due to one 32-plus acre property in Peru, Ill., nearly 100 miles southwest of the city. Looking further back, San Antonio has seen six properties built in the last three years, all in the north suburbs, increasing total supply by nearly 50 percent. Dallas has had by far the most new properties built in the last three years, at 20, followed by Houston (13) and Phoenix (11).
See Chart 11.3.
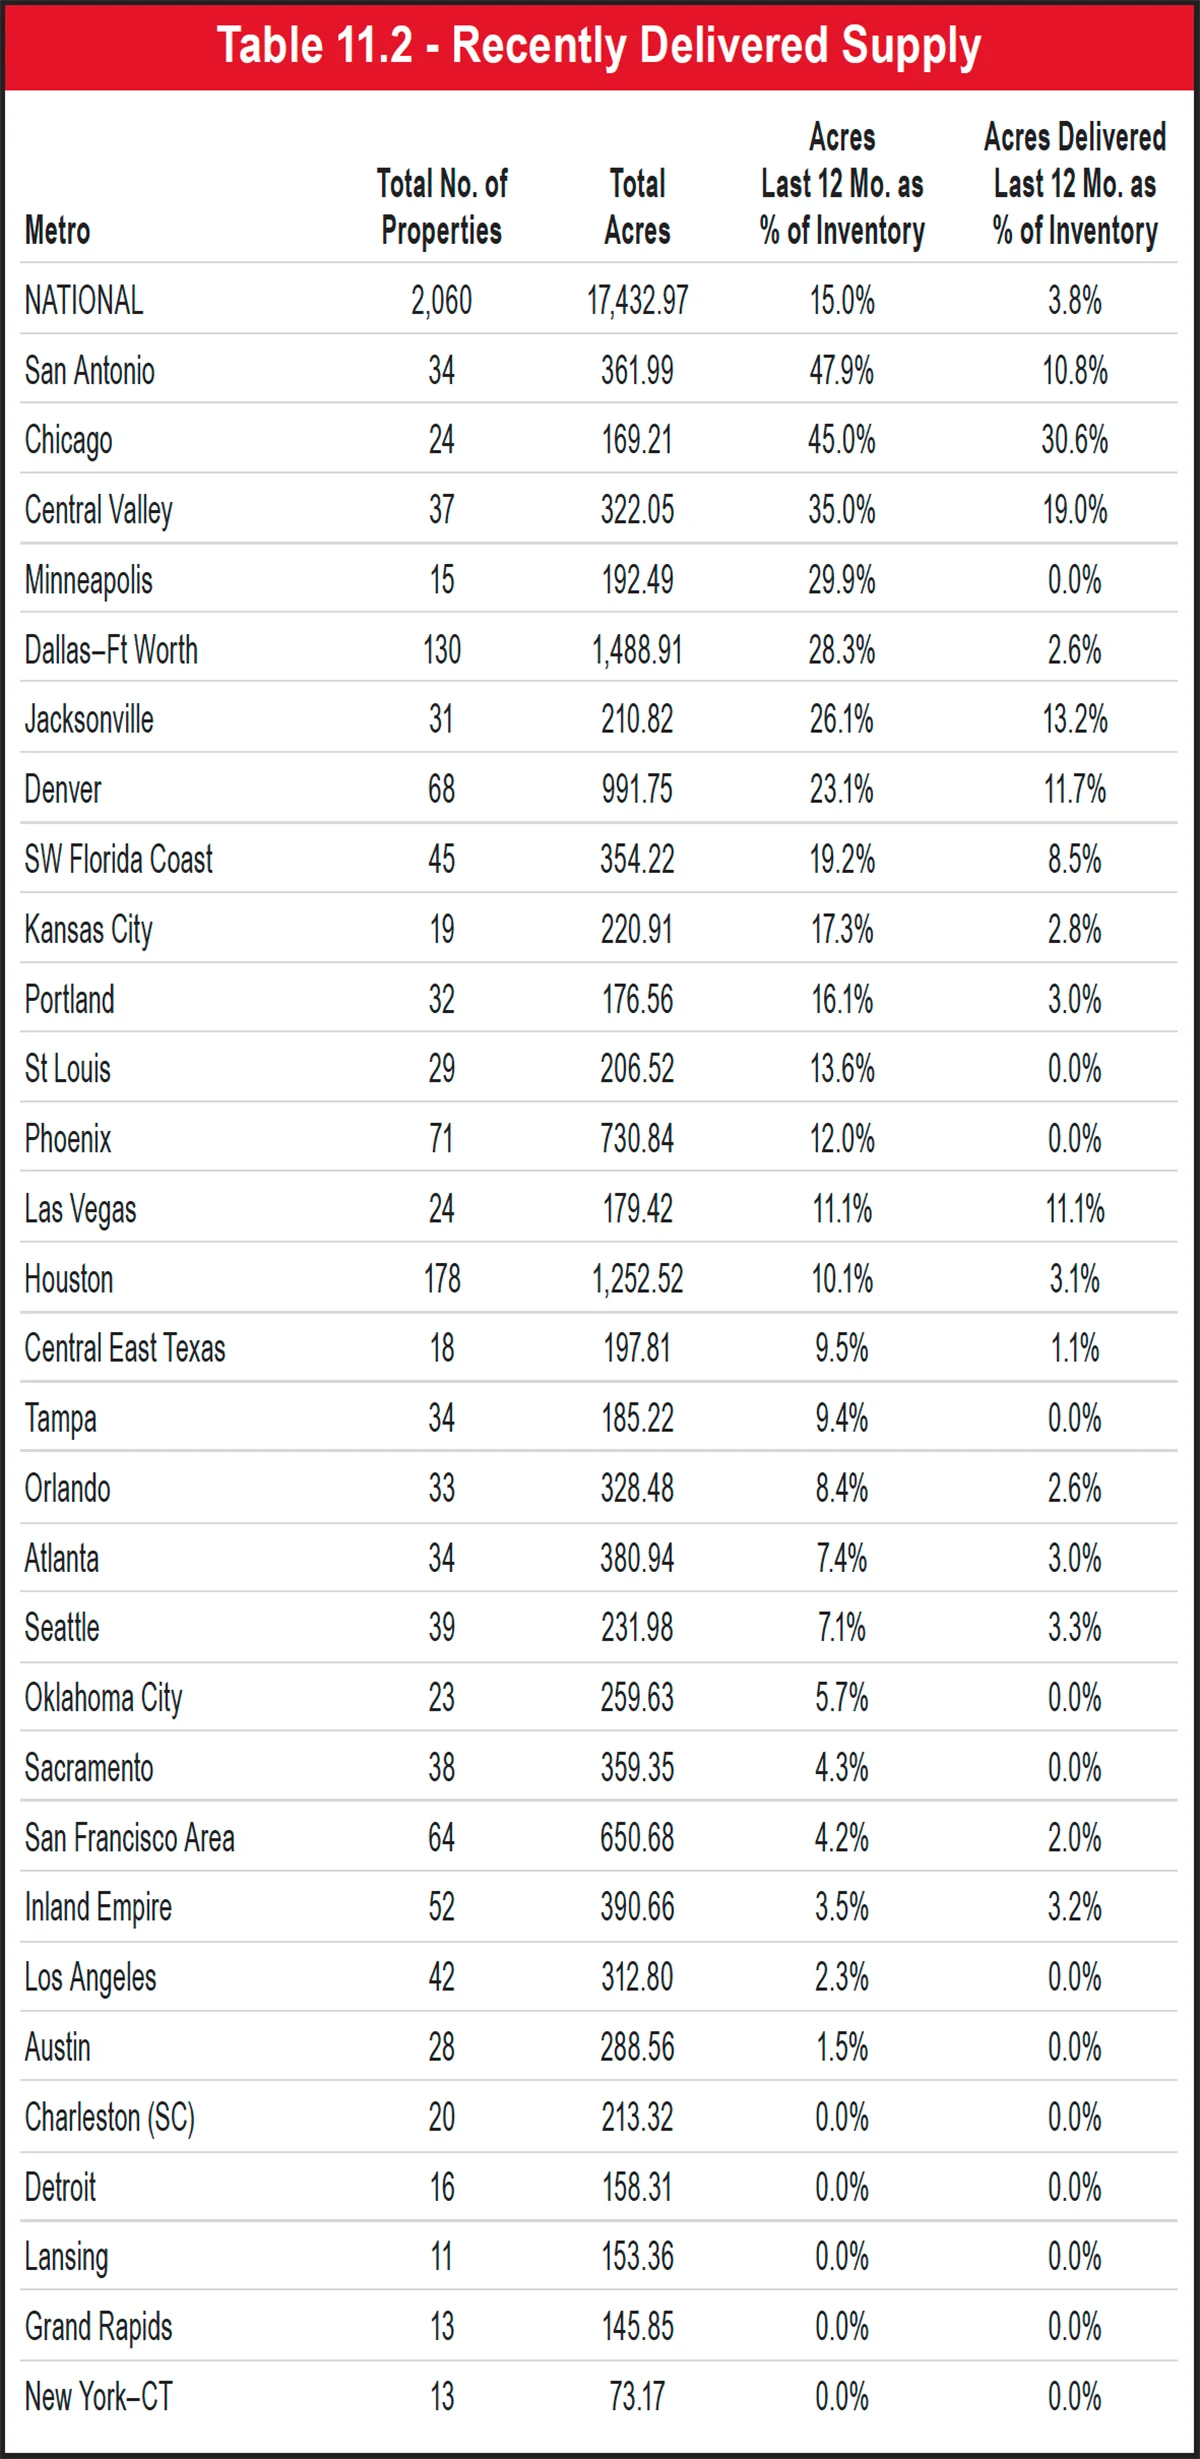
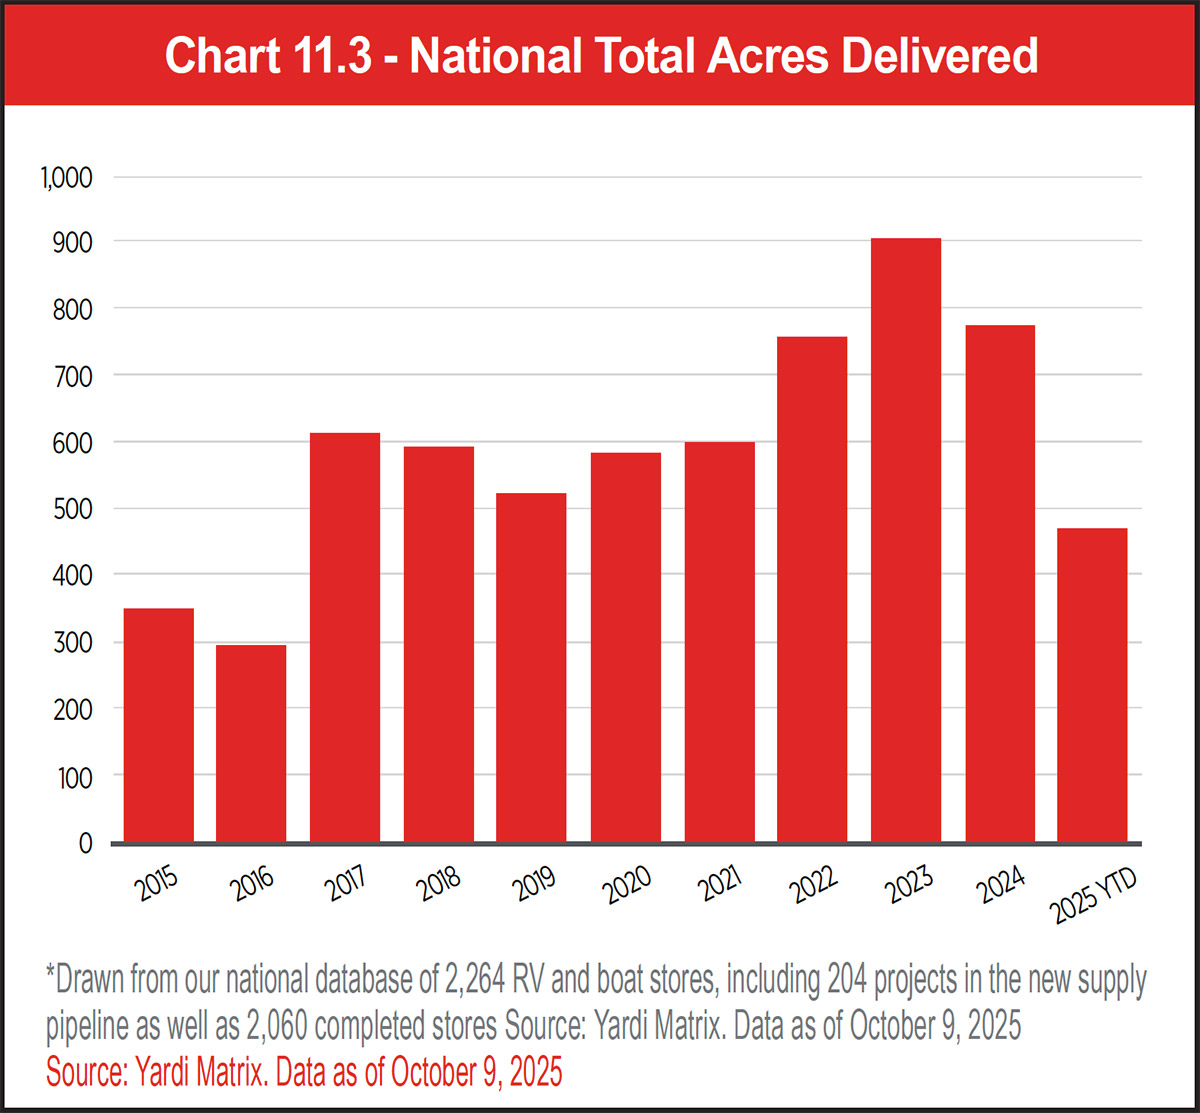
Portland currently has the most supply under construction as a percent of inventory, with two projects expected to add 31.4 acres of parking inventory, equal to 14.9 percent of existing supply. Despite seeing the highest increase in inventory over the past three years and the lowest rent growth as of September, San Antonio also has two projects being built, which could put more pressure on rent growth. In terms of number of facilities, two smaller Florida markets, the Southwest Florida Coast (six stores under construction), and Jacksonville (five stores) could face challenges from new stores in lease-up. On the other hand, half of the top 30 markets currently have no new RV and boat storage supply being built.
See Table 11.3 and Chart 11.4.
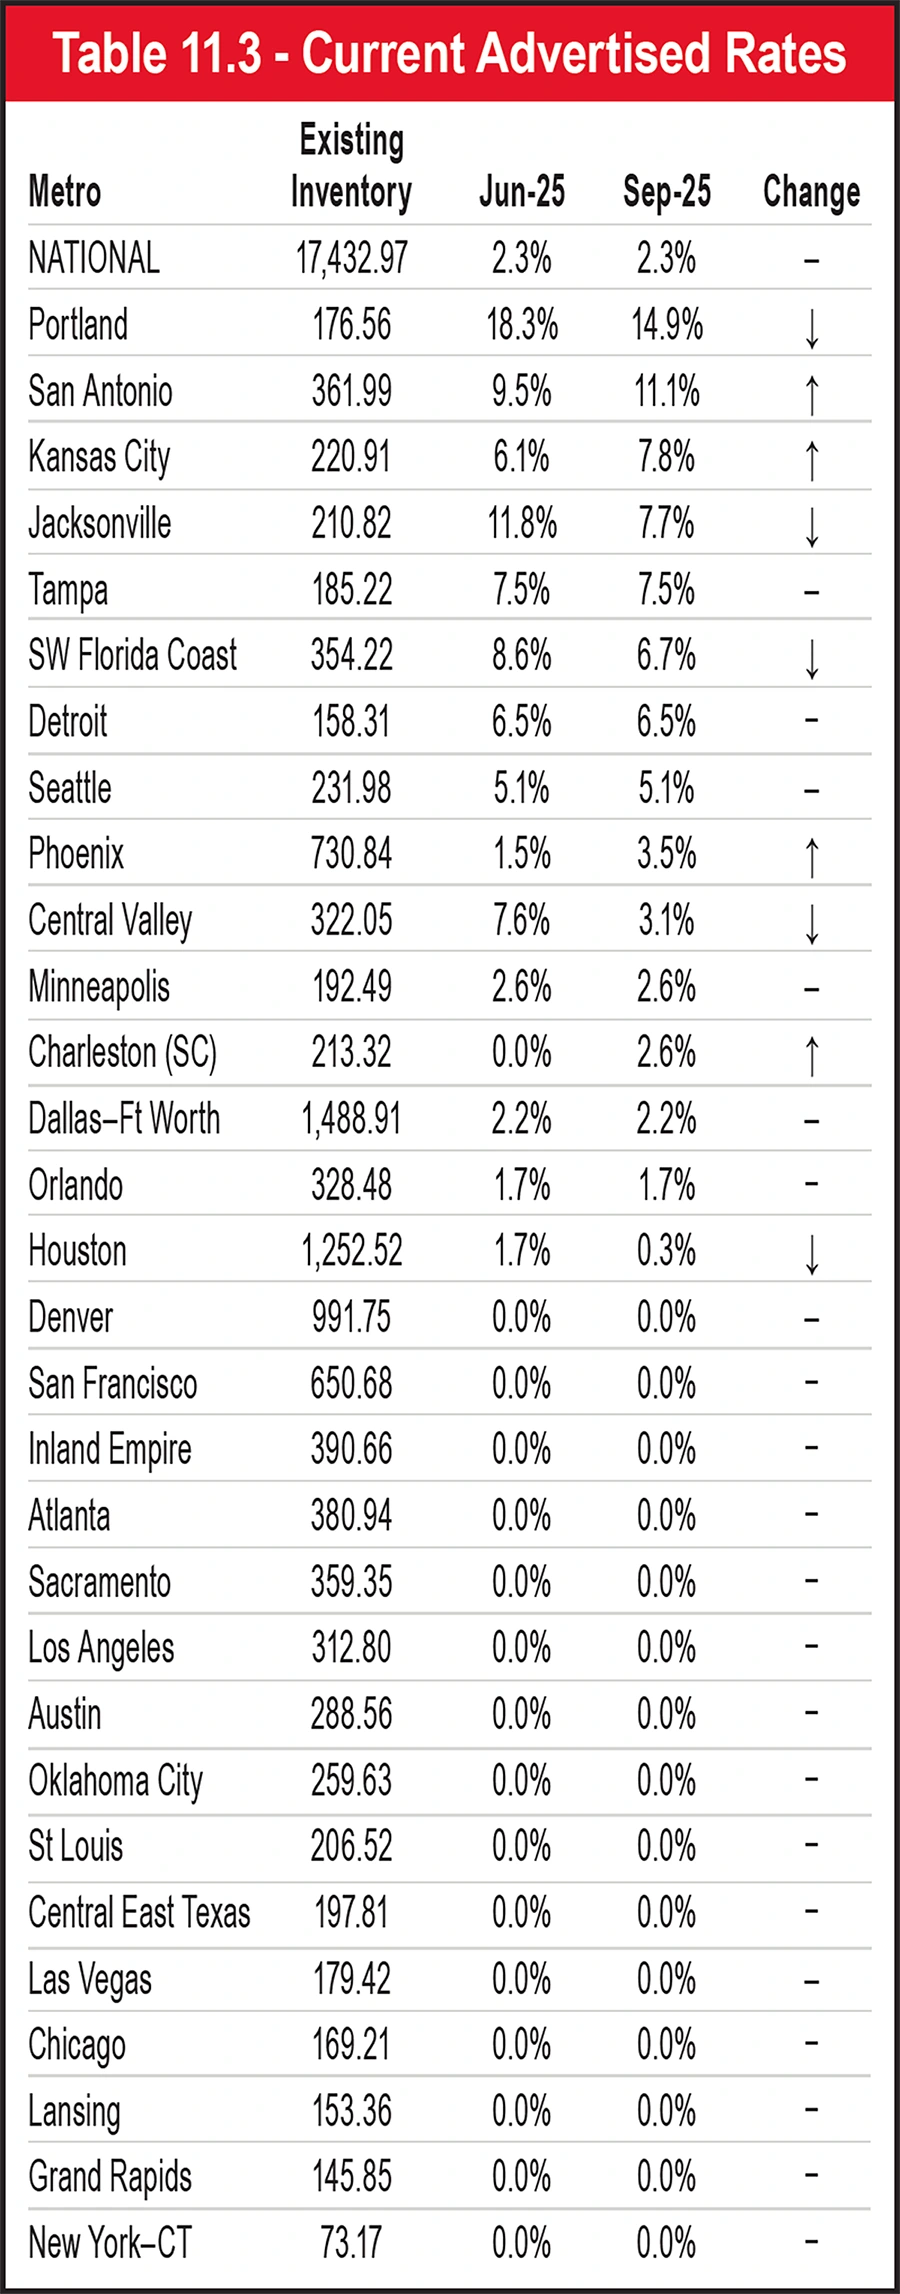
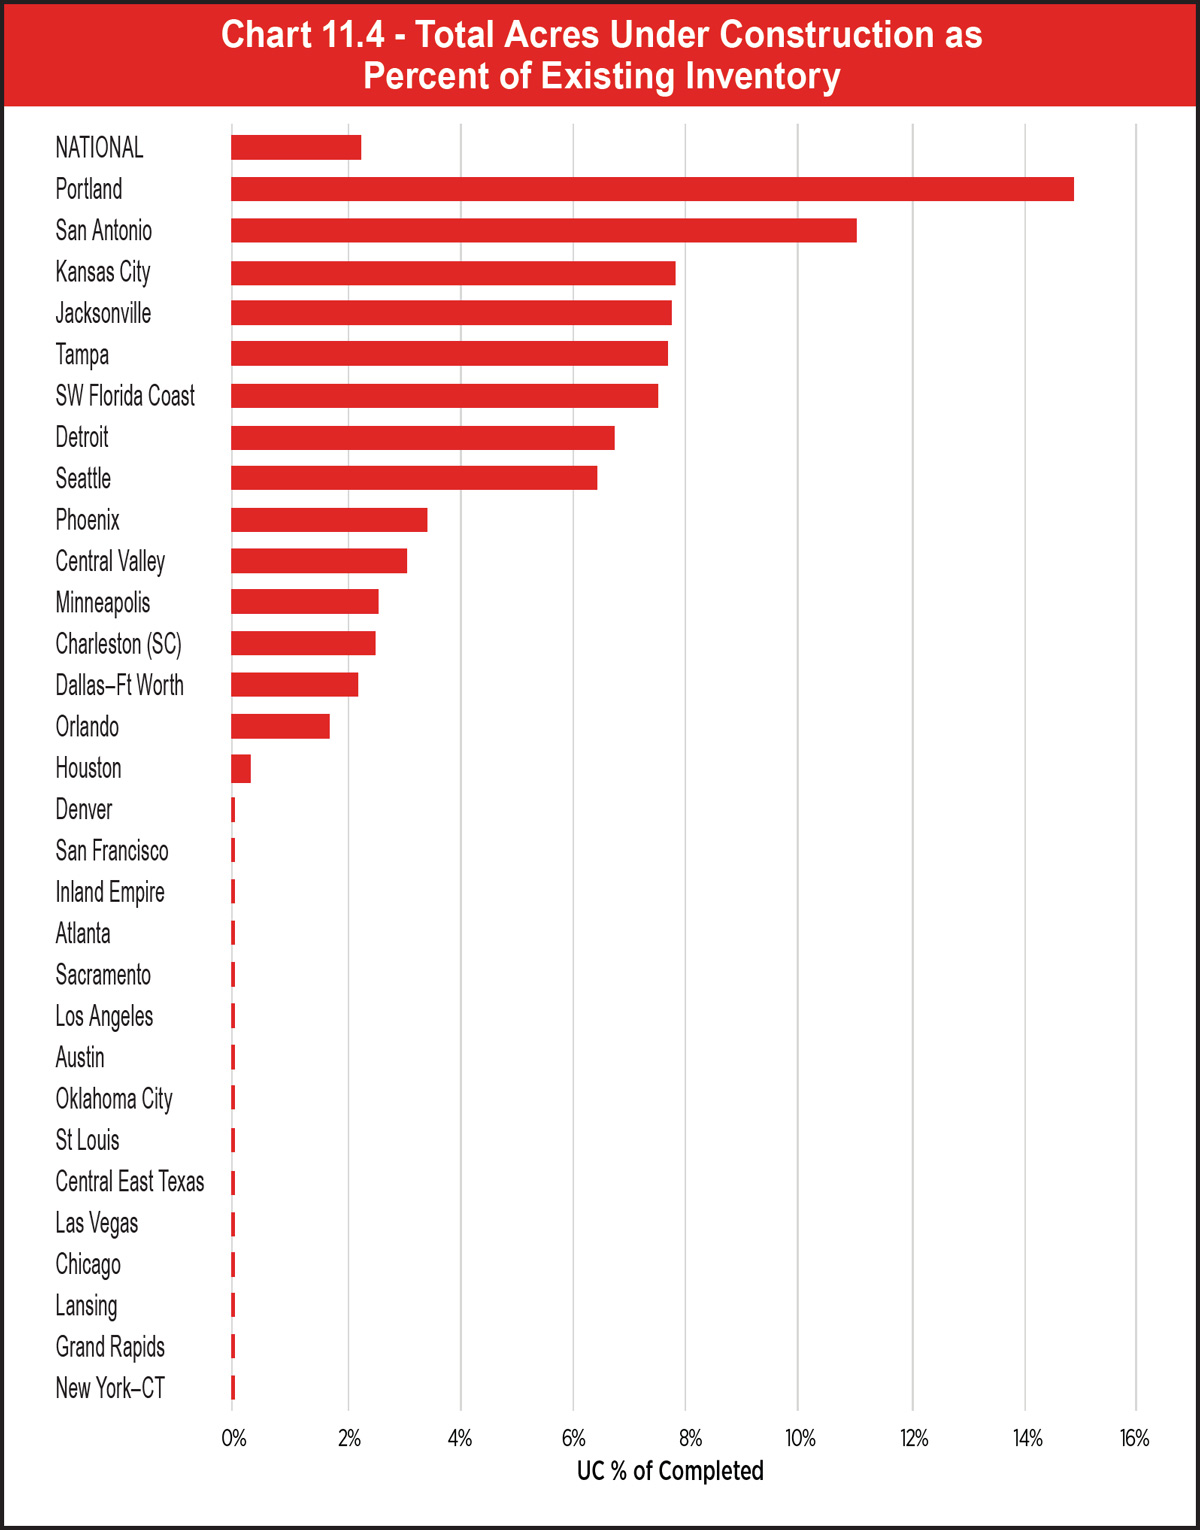
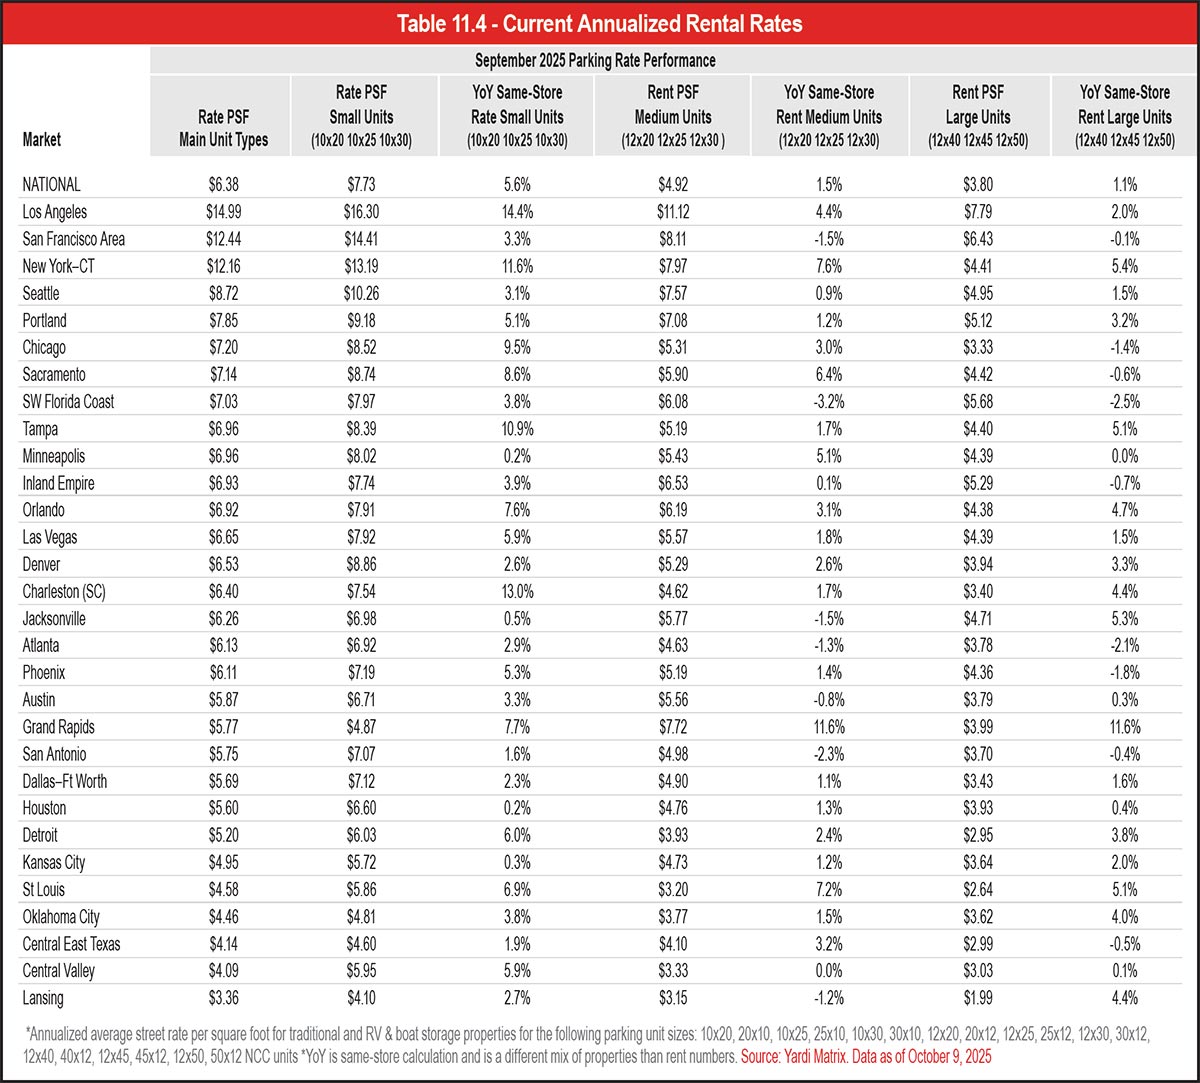


apitalization rate (or cap rate) is a metric used in commercial real estate transactions to calculate the potential rate of return on an investment. It provides a good starting point when considering whether to purchase a property. However, it is only one component, since due diligence also requires studying the class type, supply and demand, and economic indicators such as inflation, unemployment rate, and gross domestic product (GDP).
In 2025, commercial real estate transactions saw a decrease (or more accurately, a market correction) of all class assets. It was only a matter of time, after the low cost of borrowing during the COVID-19 pandemic exponentially increased the price of real estate across the country.
In addition to the current higher interest rates, expense escalation has also resulted in a direct hit on net operating incomes (NOI). Since capitalization rates depend on an asset’s income, even modest declines in NOI can materially affect valuation.
But calculating NOI accurately requires a lot of attention to detail and categorizing expenses adequately. Failing to do so has often resulted in overestimating a return on investments.
This formula may seem simple on its face, yet it requires a thorough understanding of all the elements that drive income and expenses, including rental revenue, vacancy rates, operating costs, and reasonable expense escalation.
Self-storage NOI is also highly sensitive to variable costs, such as fluctuations in utilities and labor costs, as well as repairs in geographical locations that are prone to natural disasters. By the same token, property management agreements often include charging a percentage of gross revenue. These typically range between 5 percent and 7 percent, depending on the size of the property and the services provided.
The other side of calculating NOI accurately is classifying capital expenses (CapEx) as recurring operational expenses (OpEx). Only routine maintenance should be included in the projected NOI; inflations in operational expenses should also be taken into account, such as increases in insurance and property taxes, which have typically ranged between 2 percent and 3 percent, with its peak at 9 percent in Q4 of 2024 and early 2025.
See Chart 12.1.
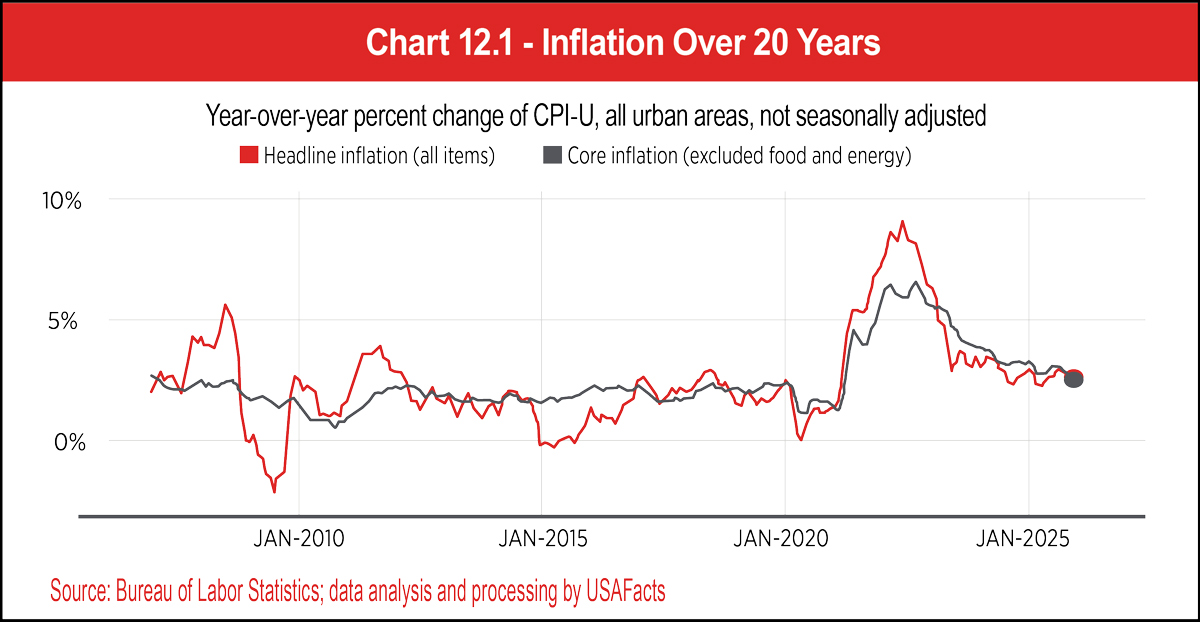
The ideal cap rate should be between 5 percent and 10 percent. The higher the cap rate, the higher the risk. Anything lower from this range poses an even lower risk, but it will likely take longer to see a return on the investment.
See Chart 12.2.
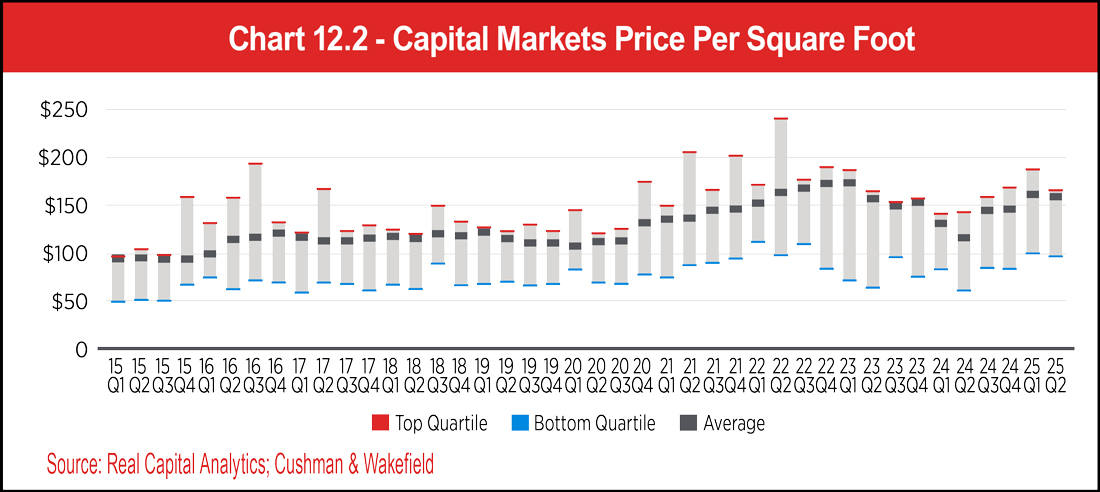
Throughout the first half of the year, there was an inverted yield curve (the difference between a two-year treasury and a 30-year treasury). The weakening in job numbers likely served as a significant contributor, as fears of a recession increased.
See Chart 12.3.
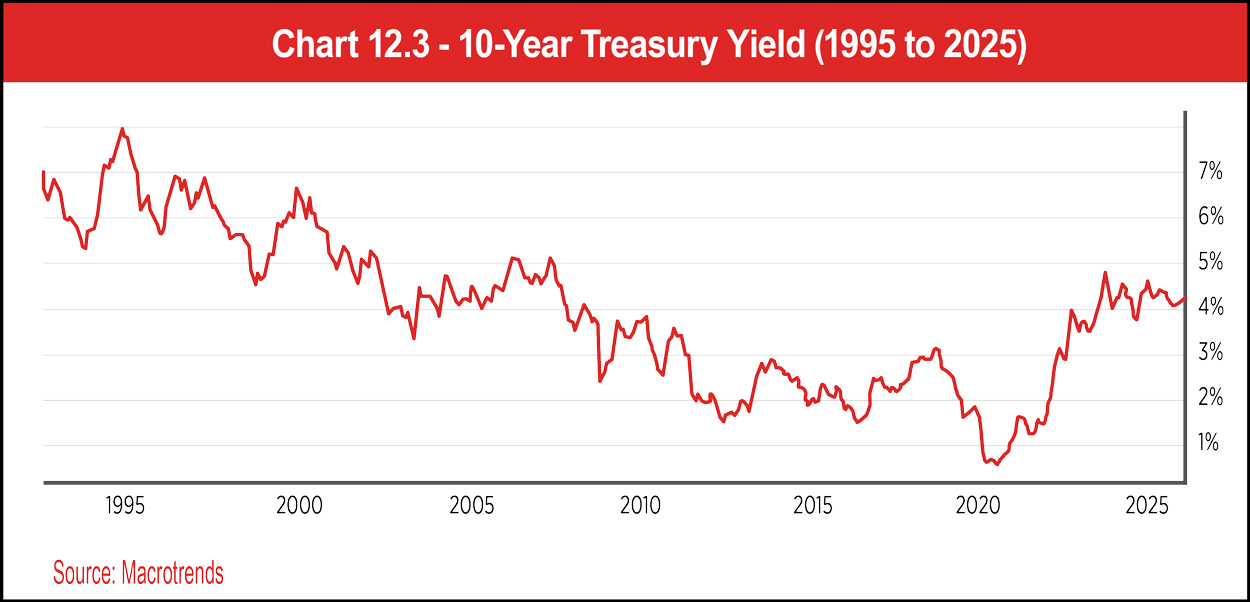
While this slight reduction did little to aid residential property transactions, when looking at the commercial mortgage-backed securities (CMBS) market, lending activity remained robust for commercial real estate.
See Charts 12.4a, 12.4b, 12.5a, and 12.5b.
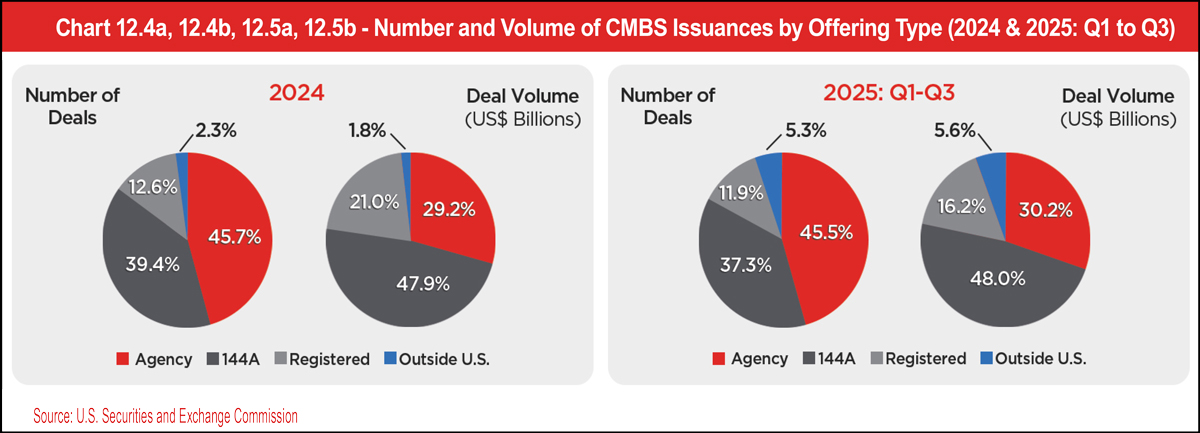
See Chart 12.6.
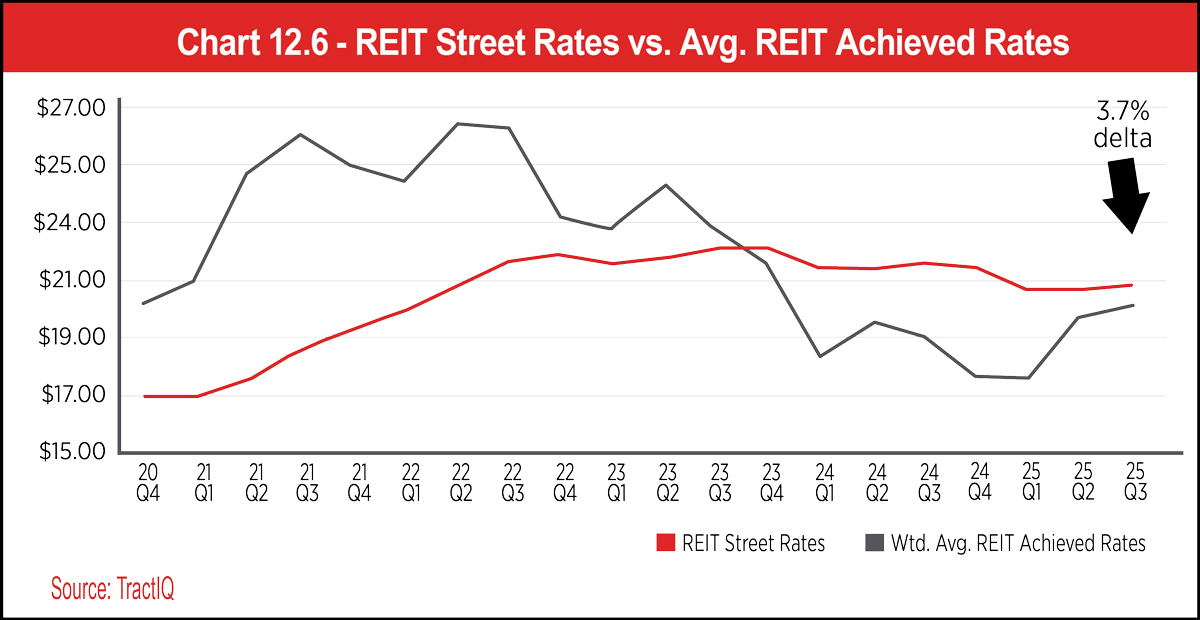
See Table 12.1.
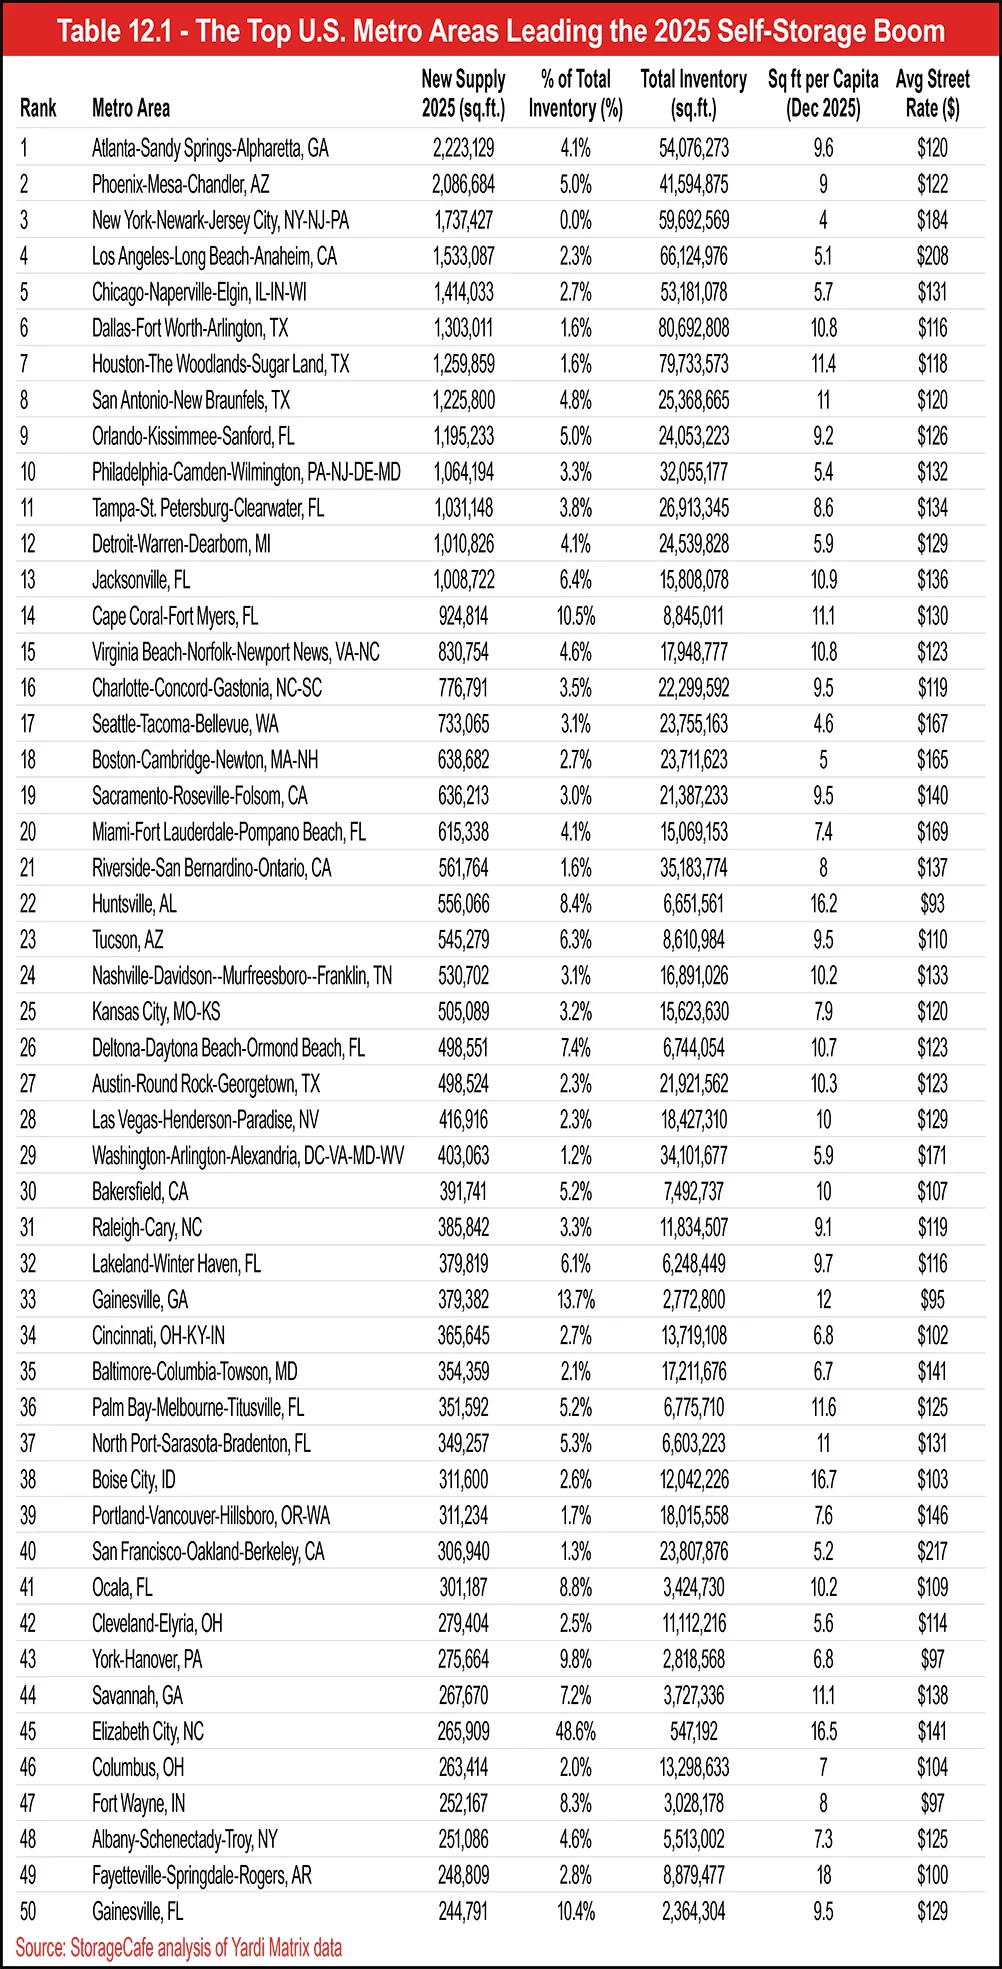
Lower rates should also not be the main reason for borrowing money for a new project. The investment should make sense regardless of the cost of financing.
The sector also saw an increase in demand as a result of the work from home era sparked by the pandemic. And just as with all other factors from that unusual time period, the demand stabilized as return-to-office mandates proliferated.
Boat and RV storage facilities often have slightly lower capitalization rates than standard self-storage due to high barriers to entry, including zoning, code conformance, municipal licensing requirements, environmental impact studies, and storm water management permits. This type of storage also requires additional operational licenses, such as handling hazardous materials (fuel, oil, wastewater) and environmental compliance.
Finally, there are infrastructure requirements, including adequate road access and turning radius, utilities capacity, fire suppression systems, spill containment systems, lighting restrictions, noise ordinance compliance, and landscaping requirements. These factors collectively increase developmental complexity and operational oversight.
See Chart 12.7.
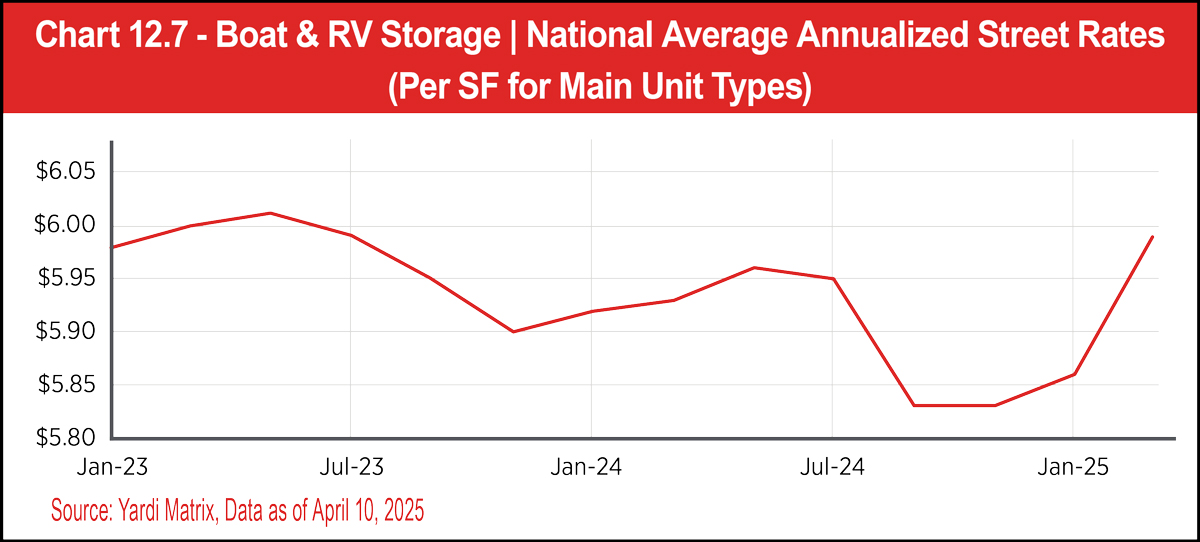
See Table 11.1 in Section 11. Click here
While there was a slight market correction in 2024, the sector remains strong. Nonetheless, most of the new supply has been concentrated in only a handful of locations (Chicago, San Antonio, Dallas, Houston, and Phoenix).
See Table 11.2 in Section 11. Click here
Sales for these recreational vehicles are expected to continue a steady upward trajectory, building on the momentum sustained since 2024 and expected to remain strong into 2032.
See Chart 12.8.
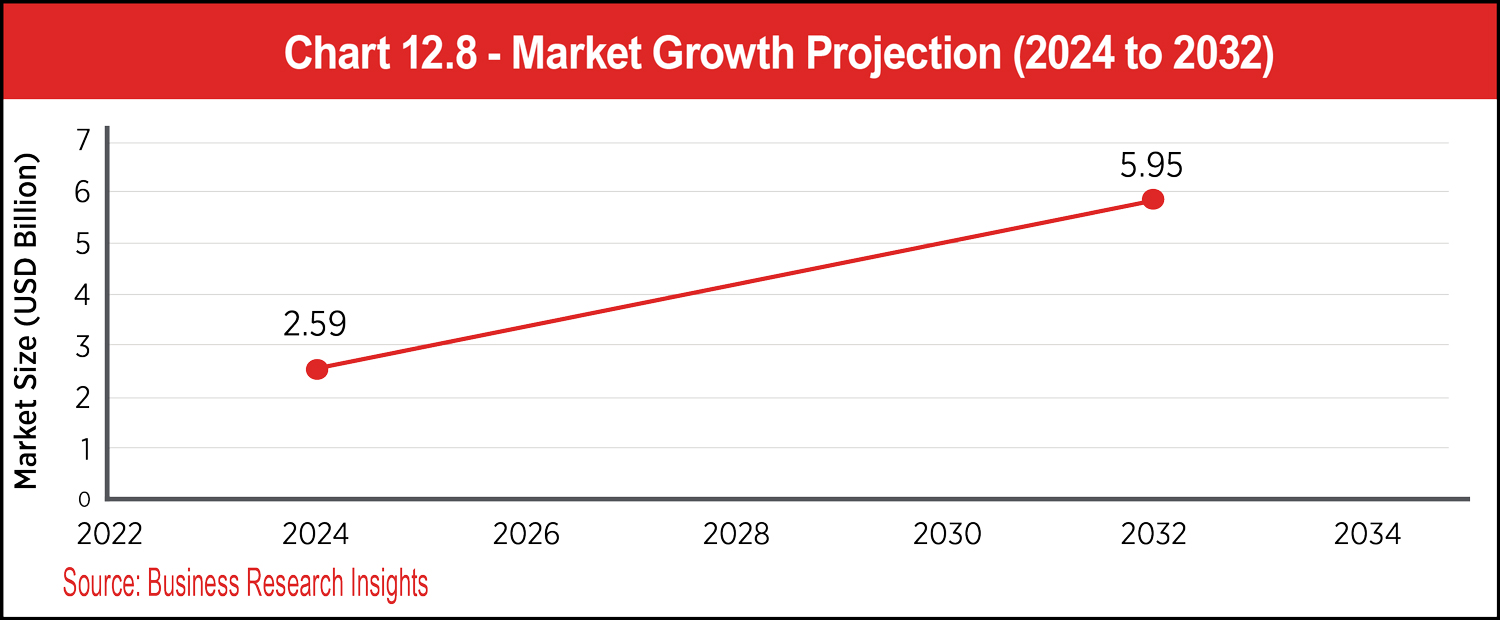
In addition, solar panels will continue to provide a competitive advantage in geographical locations with eco-conscious demographics that are often willing to pay higher rental rates for sustainable practices. All these factors will directly impact a facility’s net operating income and, ultimately, capitalization rate.
See Chart 12.9.
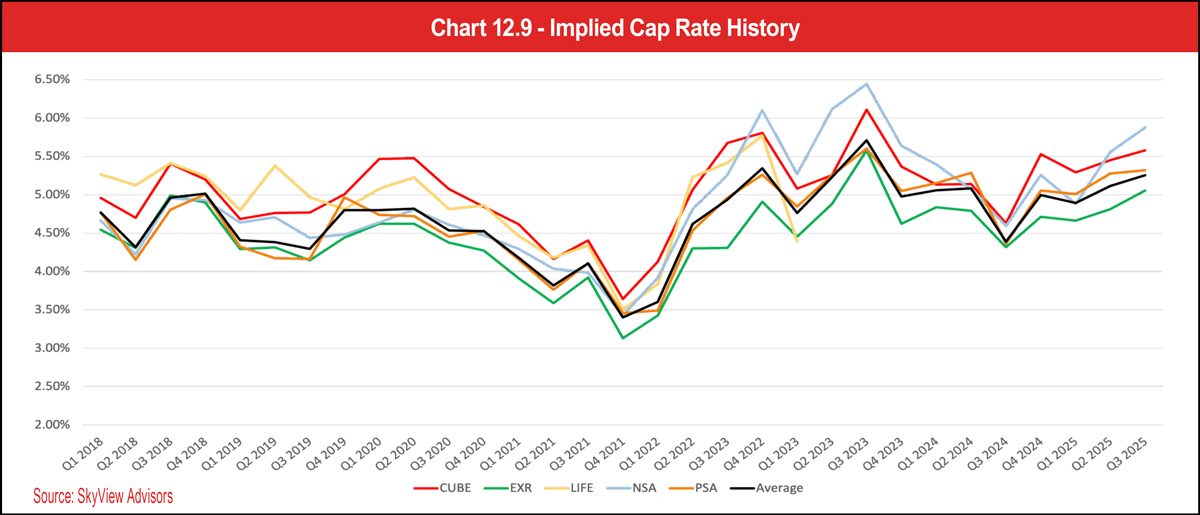


n this section, TractIQ provides data for the top 100 MSAs found in Tables 13.1a and 13.1b. Although self-storage demand is typically locally driven (nearly 68 percent of tenants live within 19 minutes of their self-storage unit per the SSA’s 2025 Self Storage Demand Study), marketing platforms and social media have gradually increased the size of trade areas over time. Data from the top 100 MSAs can be useful in uncovering trends within your local trade area. In addition to demographics, pricing, and supply, Tables 13.1a and 13.1b include a cost of occupancy analysis, which measures rents as a ratio of average household income. The lower the cost of occupancy, the more affordable self-storage is for the MSA’s customer base, which may suggest room to improve rents for operators and owners.
See Tables 13.1a and 13.1b.
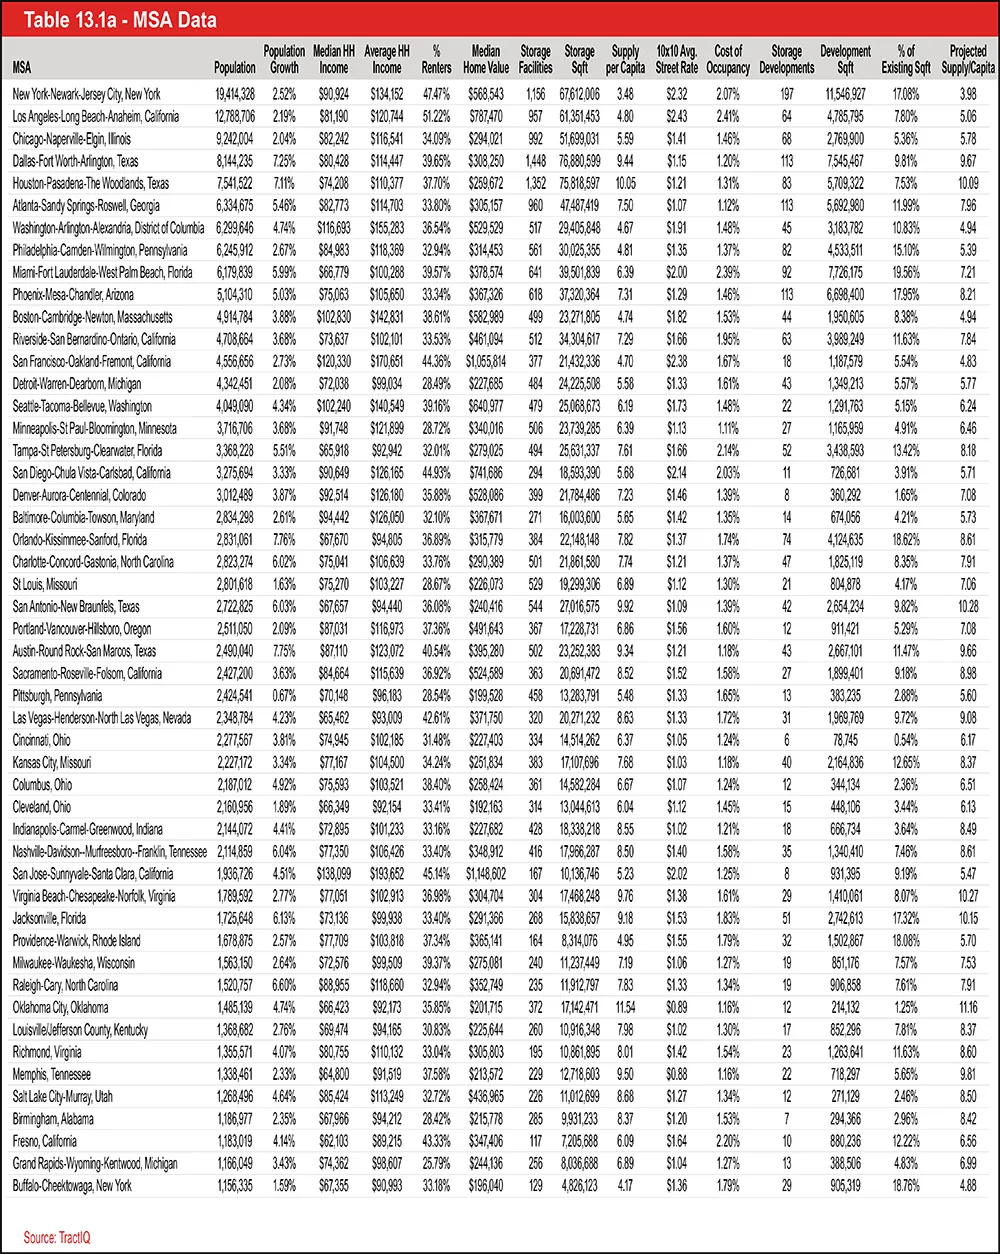
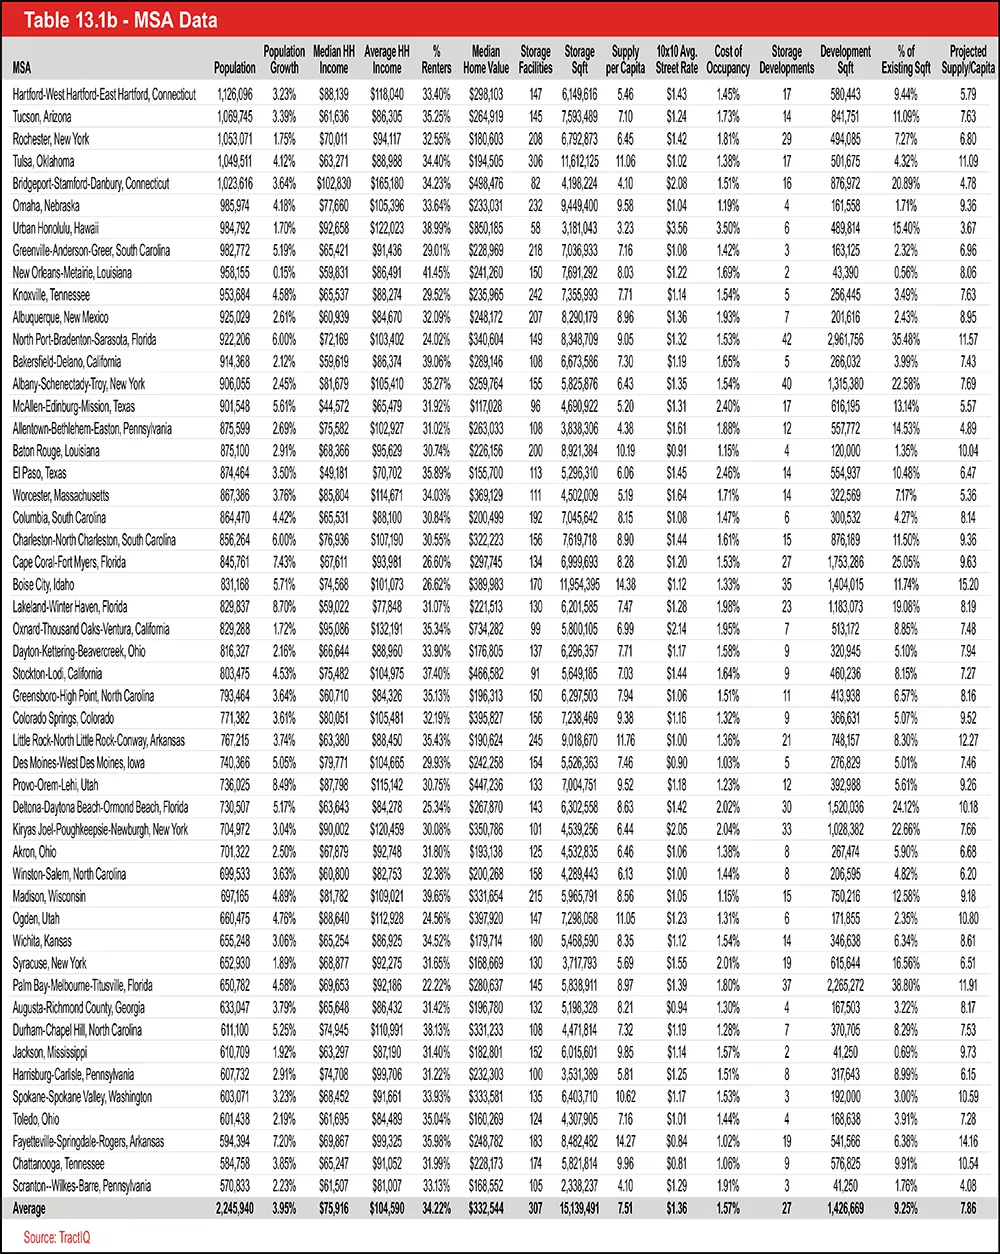
- State of the Self-Storage Investment Market
- State of the Self-Storage Transactions Market
- State of the Self-Storage Lending Market
- State of the Self-Storage Operations Market
- State of the Self-Storage Construction/Development Market
- State of Self-Storage Data
By late 2022, it was apparent that balance would take one or maybe even a few years to reestablish. Now, in 2025, signs of stabilization are emerging. Volumes remain muted, but sentiment has improved as interest rates level off and rental rates and occupancies begin to trend upward. Rather than submitting a few offers like prior years, we have submitted dozens in 2025. The broader sense is that we’re experiencing the bottom, and while recovery won’t be immediate, the floor appears to be settling.
Much of the long-term optimism rests on three assumptions: Interest rates will eventually fall, housing activity will rebound, and operating performance will follow suit—much like the years after 2010. An important factor this time, like the post-GFC recovery, is the development slowdown. From 2009 to 2011, completions fell nearly 40 percent year over year, while vacancy declined about 15 percent annually in both 2012 and 2013. With new supply throttled by financing and construction cost hurdles, the sector is expected to experience several years of below-average deliveries. That supply constraint, paired with improving demand-side fundamentals, lays the groundwork for a strong stretch of performance as we head toward the next development cycle.
If current trends hold, 2026 is expected to mark the start of a new upcycle, following several years of necessary correction. The path forward looks increasingly clear—and increasingly familiar.” –Armand Aghadjanians, Store Here
The publicly traded REITs all indicate same-store occupancy between 85 percent and 94 percent, depending on the operator, demonstrating strong demand. However, private owners are still experiencing more softness. Storable, the largest software provider for private owners, recently reported national average occupancy of 76 percent across its 14,000-plus accounts.
So, how has this impacted transactions and overall volume recently? CoStar reports that through the first half of 2025, there were 769 self-storage properties sold nationwide, versus 877 sold in H1 2024. However, total volume has increased by 22 percent, with $1.8 billion in sale volume in 2025 compared to $1.4 billion in 2024. While stabilizing rents and improving demand contribute to the uptick in volume, there is also an aspect of capitulation on the sale side that has led to numerous transactions in the last six months.
The expectation moving forward is that the Fed will continue their rate cutting cycle, which should spur further investment activity over time. Despite a two-year decline in transactional activity, indicators suggest a rebound in the coming years, and those well capitalized will be in a strong position to take advantage of new opportunities.” –Austin McLeod, Hunter Reynolds, and Campbell Watkins, Matthews Real Estate Investment Services
“Self-storage remains a favored asset class in 2025, continuing to attract investor interest despite elevated interest rates and macroeconomic volatility. Liquid capital is readily available and eager for the right opportunity, with buyers prioritizing markets with strong population density, undersupply, and durable rental demand.
Caution is high around oversupplied markets, where recently elevated development pipelines have slowed lease-up velocity and placed downward pressure on rental rates. Investors are showing a clear preference towards modern product at scale and locations within supply constrained secondary growth markets.
Transaction activity reflects this measured yet resilient demand. Nearly $50 billion in self-storage sales occurred from 2020 to 2022, driven by pandemic-era tailwinds and aggressive capital deployment. That momentum slowed to $3.6 billion in 2023, before rebounding to approximately $6.7 billion in 2024. In Q1 2025, transaction volume reached $855 million, representing a 37 percent year-over-year increase. Total square footage sold also grew 22 percent, surpassing 12 million square feet—a promising signal for the transaction market.
With improving macroeconomic clarity and the prospect of interest rate relief, the outlook for transaction activity is increasingly encouraging. Additionally, only 2.9 percent of total self-storage inventory is currently under construction. This supply-side breather is expected to support operational performance, boost occupancy, and escalate rents. While a return to the frenzy of early-decade highs is not expected, the stage is set for a fundamentals-driven resurgence in transaction activity heading into 2026.” –Kirk Martin, Lindsey Self Storage Group
The mathematical reality is stark for property owners facing refinancing. Assets that secured 4 percent financing several years ago now confront 7 percent rates at maturity. This 300-basis-point increase typically reduces debt service coverage ratios from 1.25 times to 1.10 times, forcing lenders to reduce loan-to-value ratios and creating substantial cash-in refinancing requirements. Market participants report cash shortfalls of $200,000 or more becoming commonplace, leaving owners with limited options: inject additional capital, dispose of assets at discounted valuations, or surrender properties to lenders. This distress is generating acquisition opportunities, with properties trading at or near existing loan balances.
In today’s market, lenders are focused more than ever on fundamentals. Key areas of scrutiny include historical cash flow, debt service coverage ratio (DSCR), borrower liquidity, and sponsor experience. The effects of post-COVID rent stagnation have made underwriting more conservative, and lenders are pressing borrowers to clearly articulate their business plan and local market dynamics. Any weak link—unsubstantiated proformas, poor comps, or vague exit strategies—can derail a loan.
Following a historic approximately 75 percent decline in commercial loan volume in 2023, transaction activity began to recover in 2025 as interest rates softened and bid-ask spreads narrowed. This presents a prime opportunity for well-prepared, capitalized buyers. Loan terms have tightened: Current LTVs range from 65 to 75 percent for development, 60 to 70 percent for acquisitions, and 50 to 65 percent for refinances. Interest rates are generally 6.75 to 8.50 percent for development and 5.65 to 7.50 percent for stabilized assets. With fewer lenders chasing deals, success today hinges on meticulous underwriting, compelling borrower narratives, and a willingness to shop aggressively for the best debt.” –Cody Baker, Baker Capital Partners
“Over the past 18 to 24 months, the self-storage lending environment has tightened considerably in response to rising interest rates. At the same time, we’ve seen a surge of institutional equity entering the sector, with many groups shifting over from other asset classes. The majority of transactions taking place today are smaller, mom-and-pop-owned properties where owners are either exiting the industry or represent second-generation families no longer actively involved. These assets tend to trade at more realistic pricing that still supports today’s debt terms. In contrast, many larger deals struggle to pencil, as current valuations are often misaligned with their cash flow profiles.
Lenders continue to favor self-storage, especially when compared to sectors like office or retail, but they have become significantly more selective. Whereas a year ago deals could lean more heavily on projected performance and higher leverage, today the focus has shifted squarely to in-place cash flow, strong debt service coverage, and experienced sponsors with liquidity and a clear execution plan. On stabilized assets, lenders are more focused than ever on actual performance over proforma underwriting. This shift has contributed to increased activity in other segments of the market.
We’re seeing strong momentum in retail-to-storage conversions, facility expansions, and new Class-A development. There is also growing interest in specialized formats like luxury storage, RV parking, and small-bay hybrid facilities. Local banks for the most part remain the most competitive on pricing though often with lower leverage while REITs and private lenders are actively stepping in to offer higher leverage options. Some groups are funding 90 to 95 percent of the required equity in exchange for GP participation, enabling sponsors to bring less capital to the table.
Our third-party management pipeline reflects this demand, with lead volume running nearly three times higher than the prior year. Our pipeline is split between 60 percent new development properties and 40 percent existing facilities. For developers, disciplined lease-up strategies and operational execution remain paramount. For existing owners, the focus is on proven ways to increase revenue and manage expenses in an environment where controllable and uncontrollable costs are under pressure. Florida and Texas represent the largest portion of our pipeline at 30 percent, whereas the remainder is spread across states such as California, Arizona, Illinois, Michigan, New Jersey, Georgia, and South Carolina. Across both groups, the common need is clear: a management partner who aligns with their goals, provides transparency to real operating data, and will execute the business plan.
Revenue management is central to how we execute. While we actively manage 200-plus locations nationally, our strategy is site specific and driven by pricing tiers, dynamic rates and promotions, and unit-level rent optimization. Currently, 63 percent of our tenants select the standard web rate, 16 percent choose the preferred web rate (15 percent increase above standard), and 21 percent opt for the premium web rate (30 percent increase above standard). Most of the properties we develop feature a drive-thru lane, which serves as a competitive advantage and justifies our rent premiums, along with the other conveniences and amenities.
Existing customer rate increases (ECRIs) provide the second layer of revenue growth. However, this strategy is not rigid, as we adjust by property based on occupancy, prevailing market rates, seasonality, customer length of stay, and several other factors. Experience across market cycles, and the data to understand how aggressive or measured to be, is critical to getting it right.
Ultimately, these revenue strategies flow back into our underwriting, where we leverage our own portfolio data and experience to create clear and realistic projections. The ability to combine underwriting discipline with proven operational execution is what gives the owners we manage for confidence. As the industry rebounds, experienced management companies will remain the differentiator between simply enduring the cycle and outperforming it in 2026.” –Justin Funcell, Devon Self Storage
- Massive wave of supply growth, buoyed by record-high rental activity and dirt-cheap financing costs in the wake of COVID.
- Many markets got overbuilt, leading to a supply-demand imbalance that created downward pressure on rental rates, and combined with interest rate hikes, stunted many new projects.
- New supply began to slow as product got absorbed into its respective markets.
As of the time of this writing in late summer 2025, there are early signs of improving fundamentals in many markets—a promising sign of what’s hopefully a turning point in the broader cycle. That said, high-level construction metrics (e.g., groundbreaks, completions) are typically lagging indicators of the driving forces behind cycles and will likely show a continued slowdown in 2026 until more momentum gathers for the next growth cycle.
High-quality opportunities are still out there for developers to take advantage of. Many are evaluating now whether the risk/reward tradeoff justifies them being among the “first movers” before the next growth cycle hits. But that growth cycle won’t arrive in force until either construction costs soften, interest rates fall further, rental rates climb, or some combination of the three.” –MJ Morris, Arco Murray
The fear around sharing information is often misplaced. Sharing development sites, confirming ownership details, and submitting updates doesn’t weaken your position. It helps ensure someone doesn’t build next to your new project and makes it more likely that, when you’re ready to transact, your facility can move. The more we contribute, the more it helps us both as individuals and as an industry.
AI and automation are accelerating how markets are analyzed, deals are sourced, and operations are managed. But none of that works without a foundation of clean, reliable data. We’re committed to not only providing the best possible data we can, but also making it easier than ever before for you to take advantage and participate.
Our call to action is simple: help make the industry stronger. If you notice outdated ownership records, new projects breaking ground, or facilities changing hands, take a moment to share it. In self-storage, the best insights come from collaboration, and together, we can build the most accurate data network in commercial real estate.” –Noah Starr and Taylor Bills, TractIQ
It’s no secret that the self-storage industry has experienced challenges since 2022. Sentiment improved in 2025, with data suggesting a recovery is beginning to take place. Underwriting and valuations appear to be more fundamentally driven by realistic assumptions. Opportunities still abound within the market. Creative and prepared market participants stand the most to benefit as a recovery continues to take full effect.




- Finding The Right Site
- Site Layout & Unit Mix
- Construction Financing
- Facility Automations
- Doorway & Hallway Systems
- Climate Control Options
- Security For New Builds
- Insuring Your Investment



nother year in review for self-storage financing highlights challenges and opportunities alike for the year ahead. Interest rates in 2025 were more favorable than 2024, with room for improvement throughout 2026. Many attractive financing options exist for self-storage borrowers despite key economic benchmarks like unemployment and inflation, alongside geopolitical risks in the Middle East and elsewhere acting as notable drivers of volatility. While today’s interest rates are higher than the immediate post-pandemic era, that was largely an anomaly. Currently, short-term debt options (three to seven years) provide arguably the best balance of attractive rates and future flexibility. Additionally, a host of products are available across the lending spectrum ranging in structural terms and duration to meet borrower’s needs. For context on interest rate movement, an overview of the Federal Reserve’s Federal Funds Target Rate follows.
The Fed’s target rate is the overnight rate at which banks lend reserves to one another on an overnight basis; broader borrowing rates move in response to changes in this benchmark. After the Great Financial Crisis (GFC), the Fed held the rate near zero until a modest hike in late 2015, followed by a gradual hike cycle that peaked in 2018. Rates were cut three times in 2019, then slashed back to a near-zero level in March 2020 at the onset of COVID.
Beginning in 2022, the Fed launched its fastest tightening cycle since the 1980s to combat inflation, hiking rates 525 basis points between 2022 and 2023. After peaking in mid-5 percent territory post-pandemic, rates were trimmed three times in 2024 and again at the meeting in September 2025. While there are challenges associated with both prongs of the Fed’s dual mandate of low inflation and full employment, they signaled two more quarter point cuts by year end. This is a positive sign for borrowers that points toward more attractive borrowing costs on the horizon.
Key lending benchmarks such as SOFR and the Wall Street Journal Prime Rate move closely in lockstep with the fed funds rate and are primarily used to price floating-rate loans. Treasury yields and others, which fluctuate constantly, are the more standard indices of choice for fixed-rate debt.
For simplicity’s sake, treasury rates offer perhaps the best snapshot of current conditions; these rates have retreated considerably recently. At the time of this writing, the three-, five-, and 10-year Treasuries stand at 3.57 percent, 3.69 percent, and 4.15 percent, respectively, down significantly from recent high April 2024 levels of 4.85 percent, 4.70 percent, and 4.60 percent. The yield curve “un-inverted” in August 2024, marking the first time in more than two years that long-term borrowing rates exceeded short-term rates.
As storage borrowers weigh their options in 2026, it is helpful to understand the suite of loan products available in the market as well as best practices to ensure smooth executions. Both new and seasoned borrowers should find the following takeaways helpful as they look to transact in the new year.
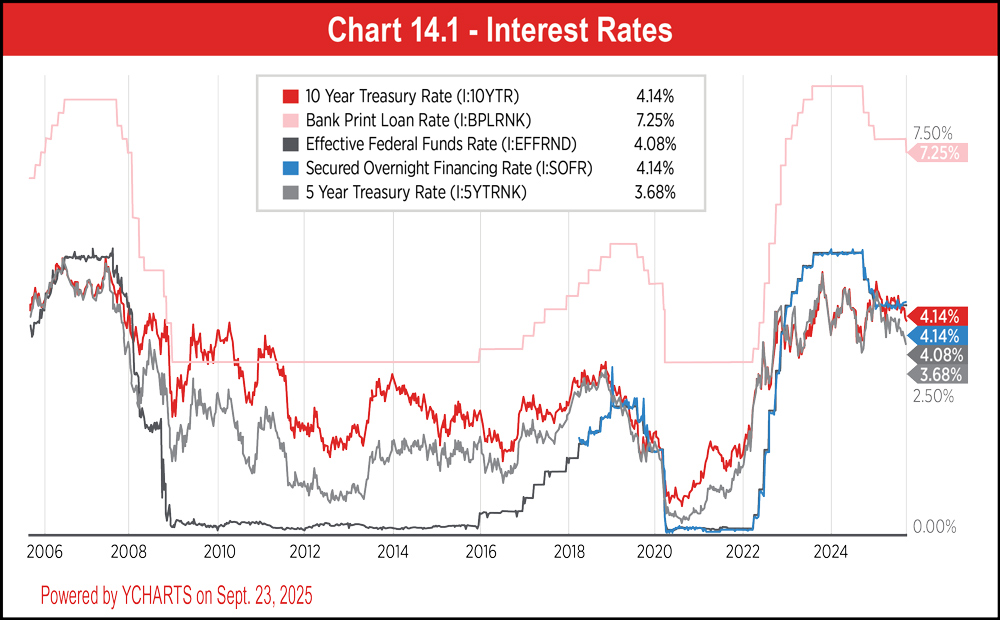
From a sponsorship standpoint, the full list is more exhaustive than what is listed in this section. However, focusing on the core items that make up a sponsorship package is most sensible. A sponsor should plan to compile a Schedule of Real Estate Owned, a Personal Financial Statement, three years personal tax returns, and a bio detailing experience with an emphasis on self-storage (if applicable). Furthermore, borrowers should be giving thought to the organizational chart or how the borrowing entity will be structured and funded.
Turning to property-level diligence, the following encompasses a number of “must-haves” that will assist a lender in reviewing a prospective deal:
- Operating financials for three years,
- Trailing 12-month financials,
- Occupancy reports,
- Management summary report,
- Current real Estate tax bill, and
- Forward budget (two years).
The clear exception to that list is construction loan requests where historical financials are not available; operating projections for five years are critical in those cases. It is best to have the management company of choice prepare projections, as that is the best lens through which to gauge financing viability.
A host of third-party reports and costs come along with any deal, though they are difficult to pinpoint ahead of time. There are pros and cons to different loans from a cost standpoint, but borrowers should be aware of and budget for items like legal, title, appraisals, surveys, origination fees associated with a new loan, as well as any prepayment penalties in a refinance situation.
The value of sponsor equity is calculated by subtracting the value of higher priority positions from the asset’s market value. This is more straightforward for stabilized assets than for non-stabilized or development deals. Total equity in an asset is important to a lender, and there is a balance between debt and equity which varies across the lifecycle of an asset. A borrower with little or no equity in a property may have different interests than one with ample equity, especially in a lender’s eyes. Different loan products affect how the capital stack materializes. To understand what loan product is ideal, the logical next step is to review loan sizing parameters.
- LTV = Loan amount divided by appraised value
- DSCR = Net operating income (NOI) divided by annual debt service
- DY = NOI divided by loan amount
Lenders consider these in tandem to determine how much debt a property can support. Each offers a different lens on credit risk and repayment capacity, but they are interconnected in a balanced equation between borrower demand and lendable terms.
LTV links the loan amount to the collateral’s appraised market value. It serves as the first line of defense, ensuring that even in the event of default or failure to repay, there is sufficient value to protect lender principal. While the exact threshold depends on the deal, lenders are commonly extending credit between 55 percent and 75 percent LTV.
DSCR connects loan sizing back to cash flow and this metric grows (holding debt service constant) as cash flow (NOI) grows. A minimum DSCR, often 1.15x (x indicates how many times a property’s NOI covers its annual debt payments) to 1.30x, ensures there is a cushion between available NOI and loan payments. This is a check and balance on leverage by measuring a property’s ability to generate recurring income, not just its appraised value.
Debt Yield adds a third, increasingly important dimension. This expresses the lender’s return on cost if the lender were to foreclose on day one. For example, a 10 percent debt yield on a $10 million loan means the NOI is $1 million. Framed another way, if a lender requires a certain debt yield, you can divide cash flow by that DY percentage to arrive at feasible loan dollars. Unlike DSCR, debt yield is independent of interest rates or amortization schedules, marking a purer measure of risk unimpacted by amortizations or interest rates.
These metrics act as interwoven guardrails. Debt yield places a floor under credit quality by preventing overly aggressive leverage, DSCR ensures cash flow can service debt comfortably, and LTV caps exposure relative to market value. In practice, whichever test produces the lowest loan proceeds sets maximum financing. Today, proceeds are commonly constrained by DSCR or even Debt Yield hurdles before LTV hurdles, given the rate environment. For example, an asset with a $10 million valuation may not be eligible for a $7.5 million loan (75 percent LTV) if the in-place cash flow yields below certain DSCR thresholds.
The interplay is dynamic: In high cap rate markets, the LTV test may constrain proceeds, while in lower yield, core markets, the debt yield or DSCR test often dominates. Lenders evaluate all three, not in isolation but as a group, to align credit risk with both asset performance and market conditions.
Today, oversupply in some markets, rent volatility, and tighter credit have made construction financing harder to secure for new development. Rising interest rates have amplified scrutiny, with most loans structured as lower leverage, floating-rate debt. This trend persisted in 2025 and is likely to continue in 2026 and beyond.
Banks remain the primary capital source for development projects, supplemented by SBA programs and some debt fund lenders. Life companies may selectively engage in development financing, but CMBS (discussed below) is not a construction product and is only applicable on cash-flowing assets. Because projects generate no cash flow during construction and require time to stabilize after receiving Certificate of Occupancy, lenders focus on sponsors with proven track records, strong balance sheets, and depository relationships.
Historically, conventional lenders could advance up to 75 percent loan to cost, but the persistence of higher interest rates has constrained leverage as lenders struggle to make deals pencil. Floating-rate structures tied to Treasuries, SOFR, or Prime are now most common, with pricing from roughly high-6 percent to well above Prime, depending on the loan product and risk profile.
Construction loans typically require full recourse and a completion guarantee, though limited recourse may be possible for highly qualified sponsors at lower leverage. Borrowers should negotiate for an interest-only period and interest carry reserves to cover lease-up, as underestimating stabilization timing is among the costliest financing mistakes.
Lenders also impose debt service coverage tests, stress testing both interest-only and amortizing debt post-completion. Careful feasibility, budgeting, and analysis of rents, competition, and absorption are essential before breaking ground. Many of the loan products discussed within this section are applicable for construction, but those are often different structures than what is available for stabilized storage assets within that lending category.
Because bridge loans target non-stabilized assets, the underwriting is generally forward-looking. In contrast to permanent lenders who are focused on in-place DSCR, bridge lenders work carefully to understand the proposed exit DSCR metric to inform their lending. Bridge underwriting has moved away from trended rent projections in light of recent rental rate volatility. Put another way, lenders are not buying into double-digit rent growth to support a transaction. Instead, they will apply a stabilized vacancy to in-place rents or moderate rent growth over the loan term.
Many bridge loans require reserves for interest shortfalls, future funding components, or cross-collateralization with other assets for added credit enhancement. A bridge loan is not an appropriate long-term debt solution; however, it can be a flexible interim financing option. Even if interest rates continue to fall in the coming year, there is no doubt bridge loans will remain an important source of capital for the storage industry.
LifeCo loans were historically in play for larger loans ($10 million or more) on a selective basis, but the appetite for storage has increased as a need arose to fill allocations in lieu of other struggling property sectors. While there are exceptions to every rule, the following is a list of typical LifeCo deal characteristics:
- Loan Type – Permanent, fixed-rate mortgages
- Terms – Five to 25 years, often with amortization up to 30 years. Limited interest-only periods available.
- Size – Generally, $10 million and larger, though select lenders will go smaller
- Leverage – 50 percent to 65 percent LTV; higher leverage uncommon
- DSCR – Minimum 1.40x or better
- Pricing – Competitive spreads over Treasuries or Swaps, currently 150 to 225 bps
- Recourse – Non-recourse with standard carveouts typical
- Prepayment – Yield maintenance or defeasance, some may offer step-down
LifeCo lenders stress cash flow and cap rates, in addition to mandating higher going in DSCRs. It is no surprise these loans are frequently constrained at lower leverage than their counterparts. That said, they currently offer the most competitive interest rates in the market, starting at just over 5 percent. They also offer a myriad of flexible structures across interest rate, prepayment, amortization, earn-outs, recourse, and even the willingness to lend on construction or bridge for the right opportunity. These products are cost-effective to close, and borrowers can often take advantage of forward rate lock provisions with a signed application.
Life Company loans are a fantastic source of capital if the deal meets their credit criteria. While these loans are typically reserved for highly experienced, well-capitalized sponsors on the best of the best storage assets, borrowers don’t have to shy away from exploring the product. Especially in light of the tremendous track record of self-storage against other property types, insurance lenders continue to exhibit an increased appetite for self-storage loans.
Adding a spread (risk premium) to a benchmark such as the U.S. Treasury is how CMBS rates are calculated. For instance, a 185-basis-point spread on the 10-year Treasury at 4.15 percent would result in a 6.0 percent all-in rate. There is a slight spread advantage for the 10-year product, however the 10-year index is higher than the five-year treasury index which equalizes rates to some extent. Spreads range roughly 150 to 250 basis points across the five- and 10-year products, with the option to “buy down” rates for a fee (roughly 14 bps reduction per 1 percent fee on a 10-year term, or 24 bps on a five-year term). Leverage, once available as high as 75 percent, is now constrained by debt service coverage ratios as elevated rates limit loan proceeds.
The restrictive prepayment structures of yield maintenance or defeasance are noted disadvantages of the CMBS product. Defeasance requires replacing loan collateral with securities to cover debt service, a potentially costly and time-consuming process that specialized firms help effectuate. That said, these penalties are less onerous in a rising-rate environment, making today’s conditions favorable for refinancing vintage CMBS debt.
Borrowers should also account for higher closing costs and rigid loan documents. Standard securitization requires uniform terms and third-party servicing, making post-closing modifications difficult. Still, some lenders offer competitive small-balance programs with capped closing costs for loans up to $10 million. Furthermore, despite the fast closing associated with CMBS, it is noteworthy that CMBS does not feature a rate lock option, thus borrowers are subject to market rate movement from application to closing.
Although lenders prefer primary markets, they will compete in secondary locations as well. Pricing is influenced by both market and property-level factors. The non-recourse nature, interest-only flexibility, and cash-out potential keep CMBS top of mind for borrowers. As rates stabilize or decline, CMBS will continue to be a fantastic option in the market for self-storage borrowers.
Bank interest rates vary widely based on loan size, leverage, risk profile, and existing borrower relationship or lack thereof. Banks can present extremely compelling quotes for transactions that fit their credit box. Loans may be tied to Treasuries, SOFR, Prime, or others, rendering bank lenders among the most variable in pricing structures. Banks and credit unions can offer fixed or floating rates, with the ability to lock rate at application for some fixed rate executions. At the time of this writing, current pricing ranges from high-5 percent to well over 8 percent.
Bank terms start around two years and span 10-plus years, often accompanied by tighter amortization schedules of 20 or 25 years. Despite historically being able to offer as high as 80 percent leverage, today it is rare for banks to comfortably exceed 75 percent given DSCR constraints. Personal guarantees are fairly standard, though stronger sponsors or low-leverage deals may qualify for limited or non-recourse. Closing costs are more favorable than CMBS or SBA, and prepayment structures also vary and are often negotiable.
Credit unions continue to play an important role for self-storage in this elevated interest rate environment. While banks prioritize long-term relationships, credit unions often take a more transactional approach, lending outside their footprint and typically without deposits. Certain credit unions offer more compelling rates than bank competitors, in part due to their tax status, allowing them to pass savings on to customers.
The SBA usually caps exposure at $5 million per borrower based on total guaranteed dollars. The 7(a) program typically maxes out at this level, while the 504 program, structured as a bank first mortgage (50 percent) and a CDC/SBA second mortgage (up to 40 percent), can support larger transactions, given the bank piece has upward mobility.
SBA loans are priced over the Wall Street Journal Prime rate. When Prime hovered around 3 percent in the pandemic era, these offerings were highly competitive. However, when Prime peaked at 8.5 percent in 2023, floating-rate borrowers felt pressure as they watched their all-in rate move up as much as 5 percent from the time of origination. As of Sept. 18, 2025, the Prime rate has trended down to its current level of 7.25 percent, which has improved the prospects of SBA financing noticeably from the peak. SBA pricing on the 7(a) program, and the bank portion of a 504 loan, are typically quoted between 0 percent to 2 percent over Prime.
504 loans feature a fixed-rate debenture (currently 6.0 percent for 25 years), which, in tandem with a fixed- or floating-rate bank piece, creates a blended all-in rate between the bank and SBA tranches that is lower than a 7(a) rate. 504 loans provide longer-term rate stability but carry steeper prepayment penalties and longer closing timelines.
7(a) loans are generally floating-rate products tied to Prime, with 20- to 25-year amortization and a 5 percent-3 percent-1 percent prepayment schedule, which is a more favorable prepayment structure than the 504. They are also more flexible, allowing proceeds to cover working capital, interest shortfalls, or business expenses in addition to real estate. One notable challenge of the 7(a) program is the additional collateral requirement in an undercollateralized loan scenario. In other words, lenders may take a lien on ancillary business or personal assets in addition to the subject. Furthermore, 7(a) typically includes higher guarantee fees per dollar loaned compared to the 504 program.
Key differences include:
- Structure – 504 uses a two-loan structure; 7(a) is a single loan.
- Proceeds – 504 often supports larger deals; 7(a) caps at $5 million (with exceptions).
- Use of funds – 504 limited to real estate; 7(a) allows broader uses such as working capital.
- Rates – 504 program at least partially fixed; 7(a) usually floating (with some fixed options).
- Prepayment – 7(a) is generally more borrower friendly.
Both programs involve heavier transaction costs and documentation than conventional loans, including a longer closing time frame than conventional closings. Still, SBA loans remain an especially valuable option for capital-constrained or first-time storage investors in 2026 looking for outsized leverage.
However, many projects financed over the past five years relied on projections that failed to materialize. Rising interest rates, construction delays, higher costs, and softer rental rates have left some borrowers struggling to meet loan payments or covenant requirements. Even stabilized assets have faced income declines, which is making debt service coverage more challenging.
Subordinate debt refers to financing that sits behind the first lien mortgage in repayment priority. By extending leverage beyond the first mortgage cutoff, subordinate lenders can push total proceeds to 85 percent LTV or even higher. Because they assume greater risk, they demand higher returns. In fact, current rates generally range from 10 percent to 20 percent. These loans are often structured with features such as multi-year or full-term interest-only payments aligned to projected cash flow.
The two most common forms of subordinate debt are broadly characterized as follows:
- B-Notes – Junior mortgages secured by the property.
- Mezzanine loans – Secured by an ownership interest in the borrowing entity rather than the property itself.
When cash flow declines to the point where debt service cannot be met, or values have fallen enough to wipe out equity entirely, fresh capital may be required. Sponsors with ample liquidity may inject new equity, while others may seek joint venture partners. JV equity is typically reserved for transactions with clear upside, such as redevelopment, recapitalization, or repositioning, that can generate enhanced cash flow and value over time. In an ideal world, an asset will not require subordinate debt. That said, it is helpful to understand the options as outlined above in the event it becomes necessary.
Though brokers charge for their services, they streamline the loan process and free borrowers to focus on growth strategies, such as acquisitions or expansions, ultimately adding more value than the time and effort saved.
On the other side of the coin, debt markets are liquid and hungry for self-storage products to lend on. A significant amount of debt will mature in 2026, and a home exists for most deals at an appropriate level. Storage fundamentals, despite some recent choppiness, remain extremely sound, especially compared to other assets.
There remains room for improvement in both the underlying interest rate indices and credit spreads to bring on more favorable financing in the coming year. Even modest declines in borrowing costs will have a positive ripple effect on transaction markets. Self-storage borrowers can look at 2026 as a year that should continue to foster growth in a truly remarkable industry.

elf-storage has always been a simple business built on a simple equation. Revenue minus expenses equals net operating income (NOI), and that NOI divided by a capitalization rate (cap rate) determines value. This straightforward formula has anchored the valuation of self-storage for decades and continues to guide the industry today. While the math hasn’t changed, the context around it has evolved dramatically over the past several years. The story of valuation in 2026 is one of both return and refinement, with a return to historical norms after the pandemic-era highs and refinement of how investors analyze markets, risk, and operations within an increasingly mature asset class.
Between 2020 and 2022, the self-storage industry experienced an unprecedented boom. Fueled by the COVID-19 pandemic’s effects on migration, consumer behavior, and liquidity, valuations reached all-time highs. Historically, there was always a clear distinction between major, secondary, and tertiary markets, often reflected in cap rate spreads of 75 to 150 basis points between each tier. During the pandemic, those distinctions all but disappeared. A Class-A facility in suburban Denver might trade at a 4.75 percent cap rate, whereas a property in a tertiary market hundreds of miles away would trade at a 5.5 percent cap rate. Capital was abundant, debt was cheap, and investors were chasing yield wherever they could find it.
At the same time, fundamentals were extraordinary. Occupancies surged above 95 percent nationally, rental rates grew at double-digit percentages, and owners were implementing multiple rate increases per year. Revenue growth was so robust that operators were achieving levels of cash flow previously thought unattainable. But in hindsight, those pandemic-era valuations were unsustainable. Cap rates compressed to historic lows, and many properties traded well above replacement cost. It was, in every sense, a perfect storm of performance, capital availability, and optimism.
Today, in 2026, the industry has largely stabilized and re-established rational spreads between asset types and market tiers. As shown in Table 15.1, Class-A institutional-quality assets in major markets are typically trading in the 5.0 percent to 5.75 percent cap rate range. Secondary markets see roughly a 75- to 100-basis-point premium, and tertiary markets are another 100 to 150 basis points higher. This represents a return to historical equilibrium, where pricing appropriately reflects risk, liquidity, and asset quality. The market’s renewed stratification is a positive sign, suggesting that investors are once again evaluating deals based on fundamentals, not fear of missing out.
See Table 15.1.
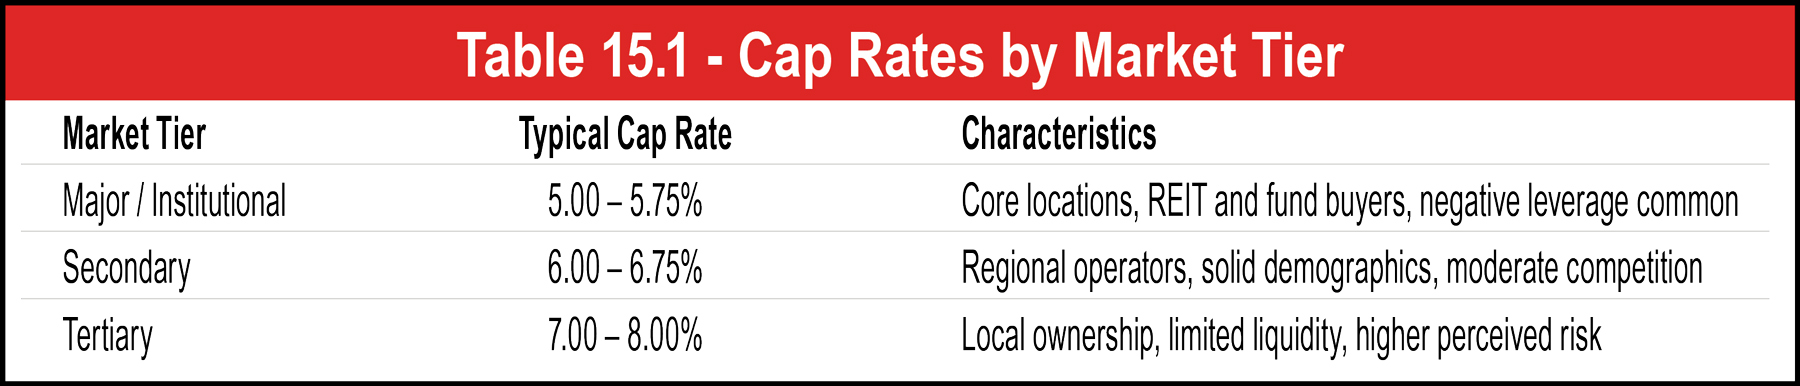
See Chart 15.1.
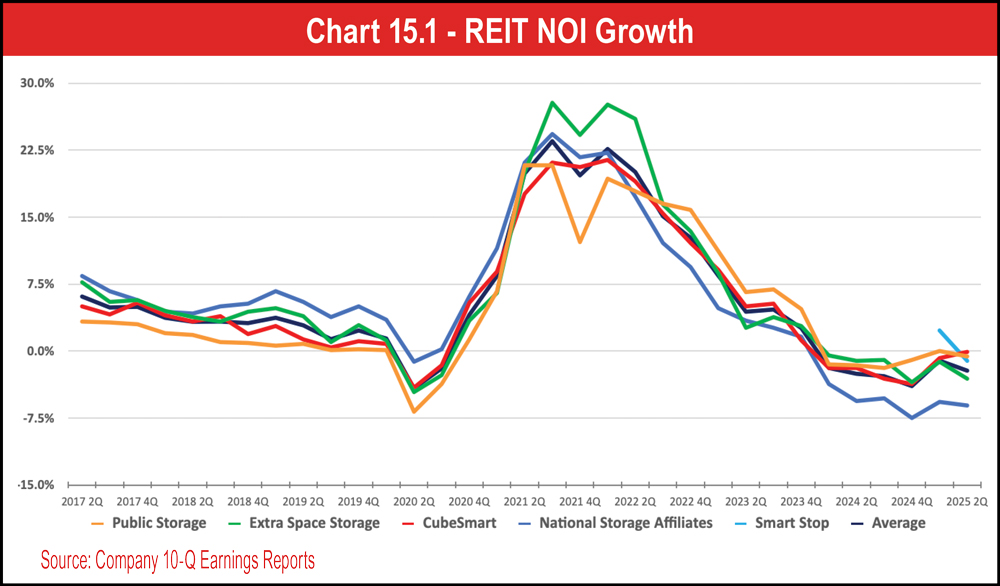
Of course, the ever-present risk to any valuation remains new development. Self-storage’s greatest strength—its simplicity—also makes it vulnerable to overbuilding. From 2016 to 2020, the industry saw expansive new supply nationwide, and while the pandemic temporarily slowed construction, developers have since returned, particularly in growth markets across the Sun Belt and Mountain West. New supply temporarily pressures occupancy and rents, often causing a 5 percent to 10 percent occupancy decline in existing properties as new facilities compete aggressively for tenants. For this reason, development risk must be accounted for in every valuation. A market with 10 square feet of storage per capita and multiple projects under construction may justify a 50 to 100 basis point higher cap rate than a market with similar fundamentals that does not have new projects in the pipeline.
See Table 15.2.
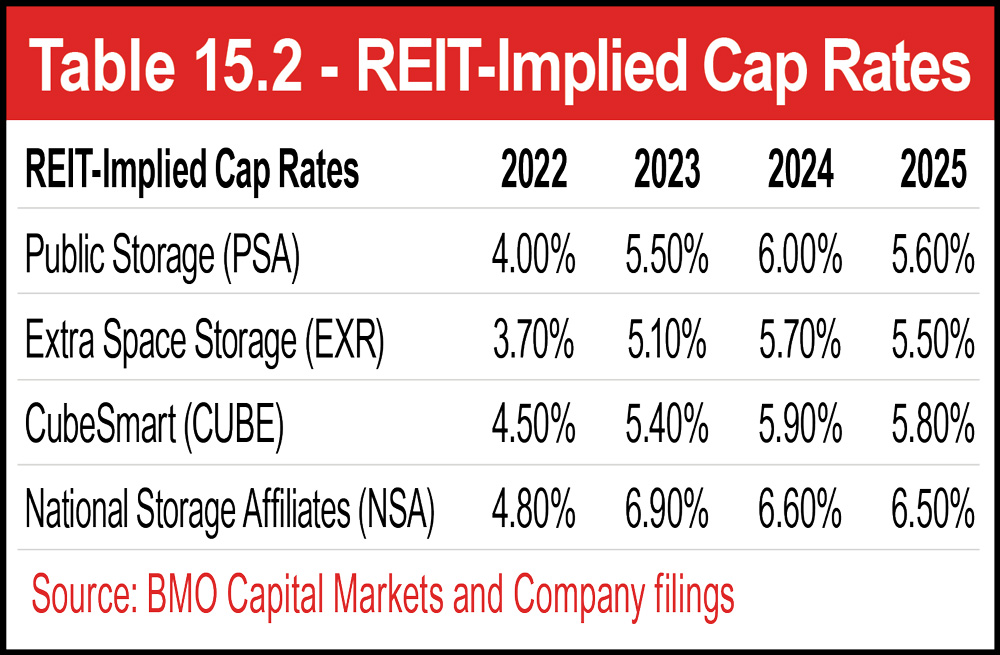
Theoretically, this method should produce a value similar to that derived from the income approach, assuming that rents, expenses, and cap rates accurately reflect equilibrium conditions. However, that is not always the case. In certain markets today, especially those that saw extraordinary rent growth during the pandemic, the value implied by income capitalization can significantly exceed the actual cost to rebuild. When valuations are more than 15 percent above replacement cost, it signals a red flag that often precedes a new wave of development.
When the income-derived value of a facility meaningfully exceeds replacement cost, the situation provides an incentive for developers to build additional units that could cause the market rental rates to decrease from existing levels. In the modern market, the replacement cost method serves as both a valuation check and a market risk indicator, an early warning system for potential oversupply. For investors, the replacement cost benchmark helps frame long-term pricing discipline. When acquisition prices consistently exceed replacement cost by a wide margin, it often suggests that market rents are inflated, demand is peaking, or new supply will soon enter the pipeline. For developers and lenders, it defines the ceiling of rational construction economics. Lenders, in particular, are increasingly sensitive to replacement costs, using them as an upper limit for loan-to-value ratios.
In 2026, replacement cost awareness plays a vital role in underwriting. Sophisticated buyers and financiers alike are incorporating construction-cost analyses, supply data, and inflation-adjusted building benchmarks into their due diligence. The impact of rising construction materials, labor shortages, and interest rates means that rebuild costs have grown meaningfully since 2020, by some estimates up 30 percent to 40 percent in certain markets, although they have come back down recently. These realities make replacement cost not just an academic exercise but a real constraint on how far valuations can stretch before new development becomes economically viable again.
Ultimately, while the income approach will always be the cornerstone of self-storage valuation, the replacement cost method serves as its reality check. It reminds investors, lenders, and owners alike that every property exists within a physical and economic boundary—the cost to build it again. In a sector where new supply can shift balance quickly, understanding replacement cost isn’t just good appraisal practice; it’s good investment strategy.
This evolution has raised the bar for all owners. In today’s environment, operational excellence directly translates to valuation. Properties that leverage technology such as revenue management systems, dynamic pricing, call centers, remote access, and online leasing achieve stronger NOI and tighter cap rates. Ancillary income sources such as tenant insurance, administrative fees, and retail sales further enhance yield and investor appeal. In essence, the valuation of self-storage in 2026 is not only about location but also about management depth and sophistication.

-
NATIONALNational Portable Storage Association
Contact: Mark DePasquale, CEO
3312 Broadway, Suite 105
Kansas City, MO 63114
(816) 960-6552
mark@npsa.org
www.npsa.org -
Self Storage Association
Contact: Tim Dietz, CEO
1001 N. Fairfax Street, Suite 505
Alexandria, VA 22314
(888) 735-3784
tdietz@selfstorage.org
www.selfstorage.org
-
STATEAlabama Self Storage Association
Contact: Mary Ellen Brown or Nikki Skrmetti
PO Box 282
Hixson, TN 37343
(423) 443-8249
info@alabamassa.org
www.alabamassa.org -
Arizona Self-Storage Association
Contact: Amy Amideo, Exec. Director
PO Box 44031
Phoenix, AZ 85064
(602) 374-7184
azsa@azselfstorage.org
www.azselfstorage.org -
Arkansas Self Storage Association
Contact: Shelly Harris
PO Box 250768
Little Rock, AR 72225
(501) 607-4775
sharris@arssa.org
www.arssa.org -
California Self Storage Association
Contact: Ross Hutchings, Exec. Director
5325 Elkhorn Boulevard, #283
Sacramento, CA 95842
(888) 277-2207
ross@californiaselfstorage.org
www.californiaselfstorage.org -
Colorado Self Storage Association
Contact: Sherry Harris, Administrator
9457 S. University Boulevard, Suite 810
Highlands Ranch, CO 80126
(303) 350-0070
admin@coloradossa.com
www.coloradossa.com -
Dakotas Self Storage Association
Contact: Erin Lightfoot
1001 N. Fairfax Street, Suite 505
Alexandria, VA 22314
(703) 575-8000, ext. 100
DakotasSSAExecDir@selfstorage.org
www.DakotasSSA.org -
Florida Self Storage Association
Contact: Leslie Fuqua
1001 N. Fairfax Street, Suite 505
Alexandria, VA 22314
(863) 884-7204
FSSAExecDir@selfstorage.org
www.floridassa.org -
Georgia Self Storage Association
Contact: Samantha Kilgore, Exec. Director
PO Box 1128
LaGrange, GA 30241
(678) 764-2006
info@gassa.org
www.gassa.org -
Idaho Self Storage Association
Contact: Erin Lightfoot
1001 N. Fairfax Street, Suite 505
Alexandria, VA 22314
(703) 575-8000, ext. 100
IDSSAExecDir@selfstorage.org
www.ssaidaho.org -
Illinois Self Storage Association
Contact: Leslie Fuqua
1001 N. Fairfax Street, Suite 505
Alexandria, VA 22314
(703) 575-8000, ext. 100
ILSSAExecDir@selfstorage.org
www.ilselfstorage.org -
Indiana Self Storage Association
Contact: Darren Ing
1001 N. Fairfax Street, Suite 505
Alexandria, VA 22314
(703) 575-8000, ext. 100
INSSAExecDir@selfstorage.org
www.ssaindiana.org -
Iowa Self Storage Association
Contact: Erin Lightfoot
1001 N. Fairfax Street, Suite 505
Alexandria, VA 22314
(703) 575-8000, ext. 100
iassaexecdir@selfstorage.org
www.iowassa.org -
Kansas Self Storage Owners Association
Contact: Brian Goldman, Exec. Director
PO Box 7624
Overland Park, KS 66207
(785) 380-8886
kansasstorage@gmail.com
www.kssoa.org -
Kentucky Self Storage Organization
Contact: Darren Ing
1001 N. Fairfax Street, Suite 505
Alexandria, VA 22314
(703) 575-8000, ext. 100
KYSSAExecDir@selfstorage.org
www.kyssa.org -
Louisiana Self Storage Association
Contact: Melissa Huff, Director
13434 Plank Road
Baker, LA 70714
(423) 443-8249
info@ssala.org
www.ssala.org -
Maine Self Storage Association
Contact: Rich Trott, President
c/o Swift Storage
35 Farwell Drive
Rockland, ME 04841
(207) 596-6401
mainestorage@gmail.com
www.mainessa.com -
Maryland Self Storage Association
Contact: Julie LaRose
1001 N. Fairfax Street, Suite 505
Alexandria, VA 22314
(703) 575-8000, ext. 100
MDSSAExecDir@selfstorage.org
www.ssamaryland.org -
Self-Storage Association of Michigan
Contact: Darren Ing
1001 N. Fairfax Street, Suite 505
Alexandria, VA 22314
(888) 308-7726
SSAMExecDir@selfstorage.org
www.selfstoragemichigan.org -
Minnesota Self Storage Association
Contact: Erin Lightfoot
1001 N. Fairfax Street, Suite 505
Alexandria, VA 22314
(703) 575-8000, ext. 100
MNSSAExecDir@selfstorage.org
www.minnesotassa.org -
Mississippi Self Storage Owners Association
Contact: Heather McCombs, Exec. Director
PO Box 352
Biloxi, MS 39533
(228) 365-8965
msssoa@gmail.com
www.msssoa.org -
Missouri Self Storage Owners Association
Contact: Shelly Harris, Exec. Director
PO Box 105920
Jefferson City, MO 65110
(573) 480-0454
sharris@mssoa.org
www.mssoa.org -
Montana Self Storage Association
Contact: Erin Lightfoot
1001 N. Fairfax Street, Suite 505
Alexandria, VA 22314
(703) 575-8000, ext. 100
MTSSAExecDir@selfstorage.org
www.montanassa.org -
Nebraska Self Storage Association
Contact: Bill Lange, President
PO Box 173
Kearney, NE 68848
(308) 338-9947
www.nebraskaselfstorageownersassociation.com -
Nevada Self Storage Association
Contact: Erin Lightfoot
1001 N. Fairfax Street, Suite 505
Alexandria, VA 22314
(703) 575-8000, ext. 100
NVSSAExecDir@selfstorage.org
www.nvssa.org -
New Jersey Self Storage Association
Contact: Julie LaRose
1001 N. Fairfax Street, Suite 505
Alexandria, VA 22314
(703) 575-8000, ext. 100
NJSSAExecDir@selfstorage.org
www.njssa.org -
New Mexico Self Storage Association
Contact: Erin Lightfoot
1001 N. Fairfax Street, Suite 505
Alexandria, VA 22314
(703) 575-8000, ext. 100
NMSSAExecDir@selfstorage.org
www.newmexicossa.org -
New York Self Storage Association
Contact: Peter Ferraro, CEO
121 State Street
Albany, NY 12207
(518) 431-1106
admin@nyselfstorage.org
www.nyselfstorage.org -
North Carolina Self Storage Association
Contact: Sally Novak
1001 N. Fairfax Street, Suite 505
Alexandria, VA 22314
(703) 575-8000, ext. 100
NCSSAExecDir@selfstorage.org
www.NCSSAonline.org -
Northeast Self Storage Association
(Serving the states of Connecticut, Massachusetts, New Hampshire, and Rhode Island)
Contact: Courtney Kahler, Exec. Director
17047 Goldcrest Loop
Clermont, FL 34714
(617) 600-4481
NeSSA@NeSSA.org
www.NeSSA.org -
Ohio Self Storage Association
Contact: Sally Novak
1001 N. Fairfax Street, Suite 505
Alexandria, VA 22314
(703) 575-8000, ext. 100
OHSSAExecDir@selfstorage.org
www.ohiossa.org -
Oklahoma Self Storage Association
PO Box 471819
Tulsa, OK 74147
(918) 633-1572
oklahomassa@gmail.com
www.okssa.org -
Oregon Self Storage Association
Contact: Erin Lightfoot
1001 N. Fairfax Street, Suite 505
Alexandria, VA 22314
(703) 575-8000, ext. 133
eking@selfstorage.org
www.orssa.org -
Pennsylvania Self Storage Association
Contact: Julie LaRose
1001 N. Fairfax Street, Suite 505
Alexandria, VA 22314
(703) 575-8000, ext. 100
passaexecdir@selfstorage.org
www.paselfstorage.org -
Self Storage Association of South Carolina
Contact: Mary Kate Mackie, Exec. Director
PO Box 12042
Columbia, SC 29211
(803) 814-4000
info@SCSelfStorage.org
www.SCSelfStorage.org -
Tennessee Self Storage Association
Contact: Melissa Huff, Director
PO Box 91
Hixson, TN 37343
(423) 443-8249
info@tnssa.net
www.tnssa.net -
Texas Self Storage Association
Contact: Kristy Spurr, Exec. Director
595 Round Rock West Drive, Suite 503
Round Rock, TX 78681
(512) 374-9089
info@txssa.org
www.txssa.org -
Utah Self Storage Association
Contact: Erin Lightfoot
1001 N. Fairfax Street, Suite 505
Alexandria, VA 22314
(703) 575-8000, ext. 100
UTSSAExecDir@selfstorage.org
www.ssautah.org -
Vermont Self Storage Association
Contact: Julie LaRose
1001 N. Fairfax Street, Suite 505
Alexandria, VA 22314
(703) 575-8000, ext. 100
VTSSAExecDir@selfstorage.org
www.ssavt.org -
Virginia Self Storage Association
Contact: Sally Novak
1001 N. Fairfax Street, Suite 505
Alexandria, VA 22314
(703) 575-8000, ext. 114
VASSAExecDir@selfstorage.org
www.virginiassa.org -
Washington Self Storage Association
Contact: Diane Bevins
1402 Lake Tapps Parkway SE, Suite F-104-133
Auburn, WA 98092
(206) 653-7259
info@wa-ssa.org
www.wa-ssa.org -
Wisconsin Self Storage Association
Contact: Barbara Scheibe, Exec. Director
21620 Belgren Road
Waukesha, WI 53186
(262) 786-3960
info@wiselfstorage.org
www.wiselfstorage.org
-
INTERNATIONALFederation of European Self Storage Associations (FEDESSA)
Contact: Rennie Schafer
Bluepoint
80 BD. A. Reyers
1030 Brussels, Belgium
+32 472 943324
info@fedessa.org
www.fedessa.org -
Self Storage Association of Australasia
Contact: Sandra Evans
Unit 4 – 2 Enterprise Drive
Bundoora, Victoria 3083
Australia
+61 3 9466 9699
admin@selfstorage.com.au
www.selfstorage.com.au -
Belgian Self Storage Association
Contact: Carlo Swaab
Breedveld 29
1702 Groot-Bijgaarden, Belgium
+32 2 229 56 42
info@shurgard.be -
Canadian Self Storage Association
Contact: Sue Margeson, Exec. Director
PO Box 43
Rosseau, ON, P0C 1J0, Canada
(888) 898-8538
info@cssa.ca
www.cssa.ca -
Danish Self Storage Association
c/o City Self Storage
Bryghuspladsen 8, Indg. C, 3. Sal
1473 Kbh K, Denmark
+45 30 36 00 43
alag@pelicanselfstorage.dk
www.selfstoragedenmark.dk -
France Self Storage Association
Contact: Loic Vaillant
+33 1 70 37 29 64
contact@ci-selfstockage.fr
ci-selfstockage.fr -
Germany Self Storage Association
Contact: Christian Lohmann
NordkanalstraBe 52
20097 Hamburg, Germany
040 21091765
info@selfstorage-verband.de
www.selfstorage-verband.de -
Ireland Self Storage Association
Contact: Brian Hefferon
c/o Elephant Storage Ltd. Nesta
Deansgrange Business Park
Deansgrange
Co. Dublin, A94 A4AG
353 (01) 219 0200
www.selfstorageassociation.ie -
Italy Self Storage Association
Contact: Cesare Carcano
info@aisi-selfstorage.it
www.aisi-selfstorage.it -
Japan Self Storage Association
Contact: Tatsuya Saji
Japan 101-0051 Tokyo 2-11-4-301 Jinbocho Kanda Chiyoda-ku
81-3-5211-8933
rsaji@trwinds.com -
The Netherlands’ Self Storage Association
Van Lennepweg 10
2111 HV Aerdenhout
The Netherlands
0031 6 54 27 47 92
info@shurgard.nl
www.nssa.nl -
Norwegian Self Storage Association
Contact: Per Hague
Havnegaten 2 – 4306 Sandnes
0580 Oslo
992 518 944
www.nssa.no -
Spain Self Storage Association
Contact: Carles Viladecans
Street Calvet 5, 2º 2ª
08021 Barcelona, Spain
34 937 076 549
info@aess.es
www.aess.es -
Self Storage Association Sweden
Contact: Paola Barraza
Box 2-178 21 Ekero, Sweden
46 851970073
paola.barraza@ssasweden.com
www.ssasweden.com -
Swiss Self Storage Association
Contact: Christian Schmutz
Hardstrasse 14
CH-4052 Basel
Switzerland
0041 61 312 44 88
info@3sa.ch
www.3sa.ch -
Self Storage Association of the United Kingdom
Contact: Rennie Schafer
The Gullet
Nantwich, Chesire
CW5 5SZ, UK
+44 1270 623150
admin@ssauk.com
www.ssauk.com
-
Other Sources
-
BRB Publications, Inc.
-
Bureau of Labor Statistics
-
Claritas
-
ESRI
-
Integra Realty Resources
-
International Code Adoptions State and Jurisdiction Information
-
International Code Council (ICC)
-
MapInfo
-
National Conference of States on Building Codes and Standards (NCSBCS)
-
The National Fire Protection Association (NFPA)
-
PublicData.com
-
U.S. Census Bureau
-
U.S. Chamber of Commerce
• Fully integrated solutions with in-house baȷa Engineers for faster, easier projects
• Pre-Fabricated Framing Systems with Bolted Connections – No field welding
• Snow Loads from 20psf to 100psf – Wind Speed rated to 170MPH
the Switch
- 260+ stores, Canada’s largest and best known self storage operator with 25+ years of experience.
- A platform that produces results, a team focused on delivering value and a company that gives back to Canadians.
- Leading through technology, training and team development, our culture is focused on delivering the very best to our customers and giving you back TIME!




