

elf-storage is a fast-paced, seasonal business where customers typically sign monthly leases, which can be a double-edged sword. Self-storage operators often increase customer rental rates as the demand for storage grows within a market. This responsiveness helps operators capture revenue quickly in times of strong demand. On the flip side, as demand weakens or prices increase too much, customers can leave at a moment’s notice.
Due to the monthly nature of the self-storage business, rental rates vary widely at the facility level, let alone within a submarket. Tracking rental rate trends can provide valuable insights when it comes to self-storage supply and demand. Before diving into the insights these rental rates can provide, let’s define some key terms that are foundational to understanding self-storage pricing dynamics:
- Web Rates – The rates advertised online, often discounted to attract price-sensitive shoppers. These typically include short-term promotional pricing.
- Street Rates – The street rate for a particular unit is the rate that a customer would be charged if they were to walk in off the “street” and rent a unit in person at the facility. Given that customers are less likely to price-shop in this scenario, the street rate is typically higher than the web rate.
- In-place or Achieved Rates – The actual rates paid by existing tenants, which can exceed both web and street rates due to regular existing customer rent increases (ECRIs) after the initial promotional period.
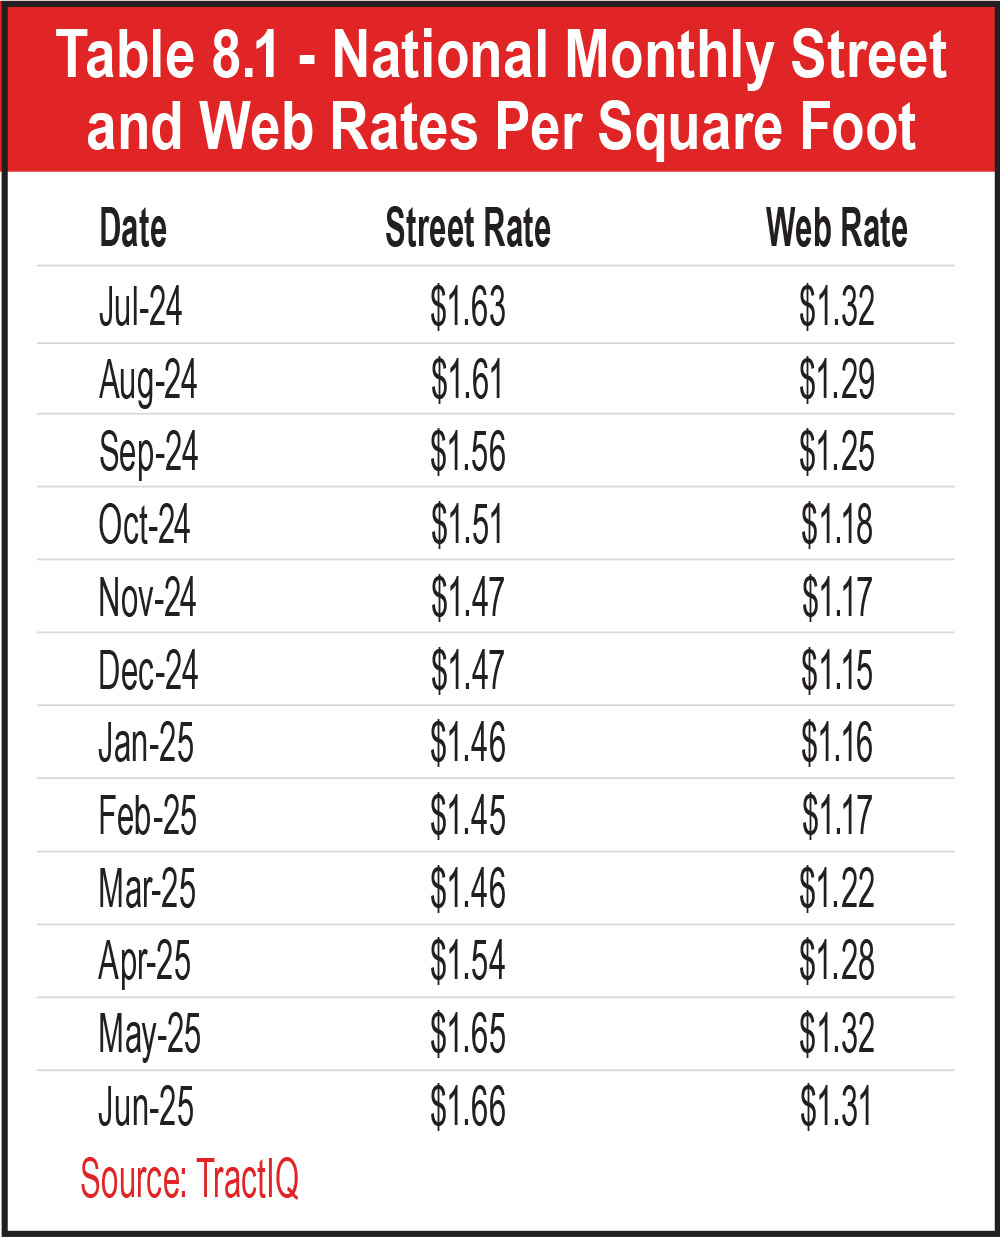
See Table 8.1.
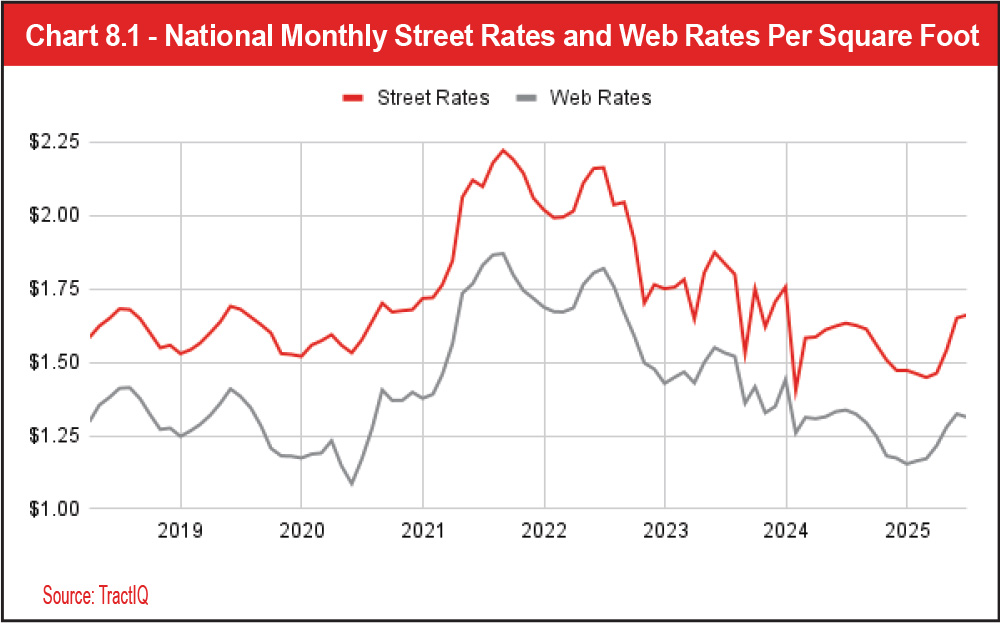
See Chart 8.1.
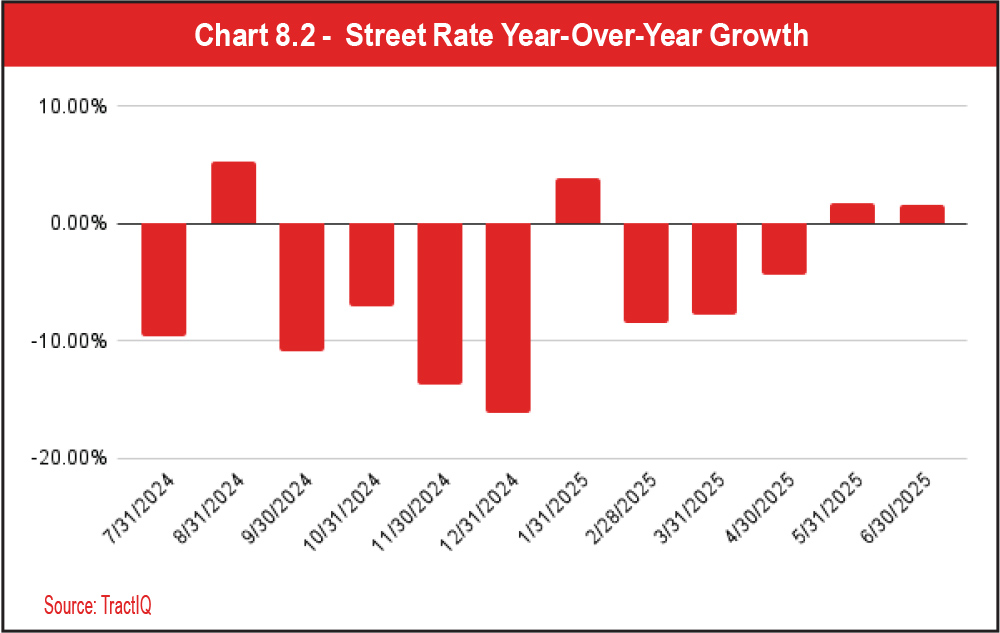
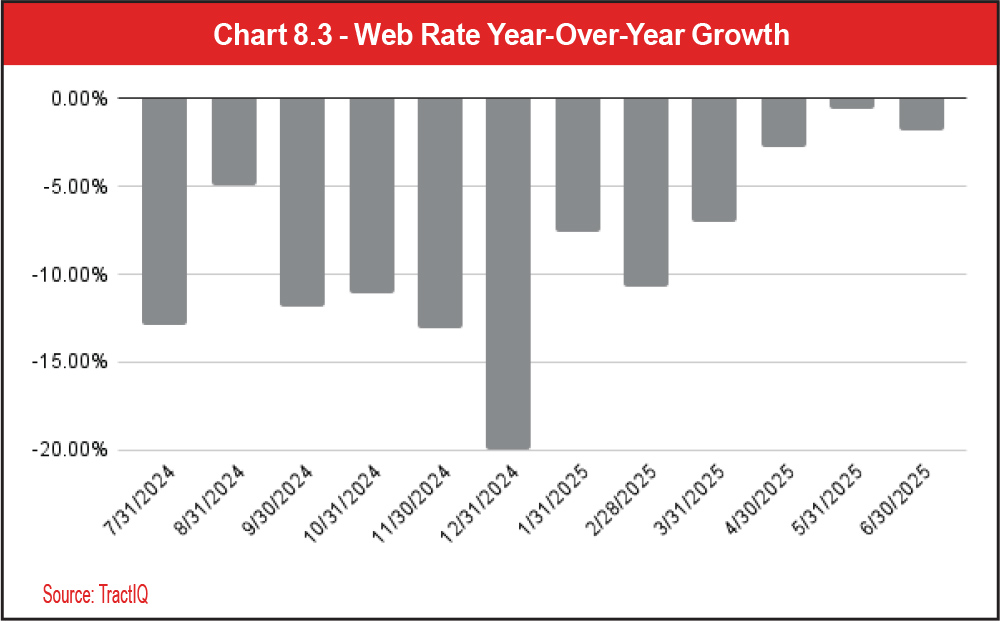
Year-over-year growth in Chart 8.2 has been positive for street rates four out of the last 12 months. From 2023 to 2024, street rate growth was positive only one month out of the 12-month period. From 2022 to 2023, there weren’t any months with positive year-over-year street rate growth. This suggests pricing power is improving and the magnitude at which rates are declining is leveling out. Even though street rates are seeing some improvement, you will notice from Chart 8.3 that web rates are still declining year over year across the board. Web rates have not had a positive year-over-year growth month since December 2023. However, like street rates, the magnitude at which web rates are declining is leveling out. This data suggests that operators are still heavily discounting rates to attract customers. It appears web rates and street rates are finding their footing in a market environment that still lacks demand.
See Charts 8.2 and 8.3.
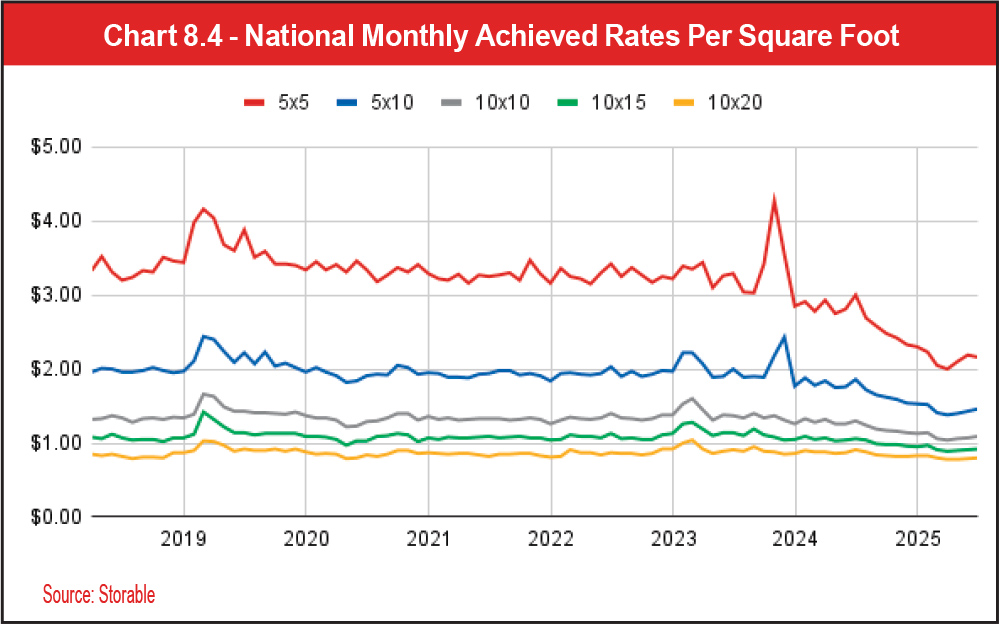
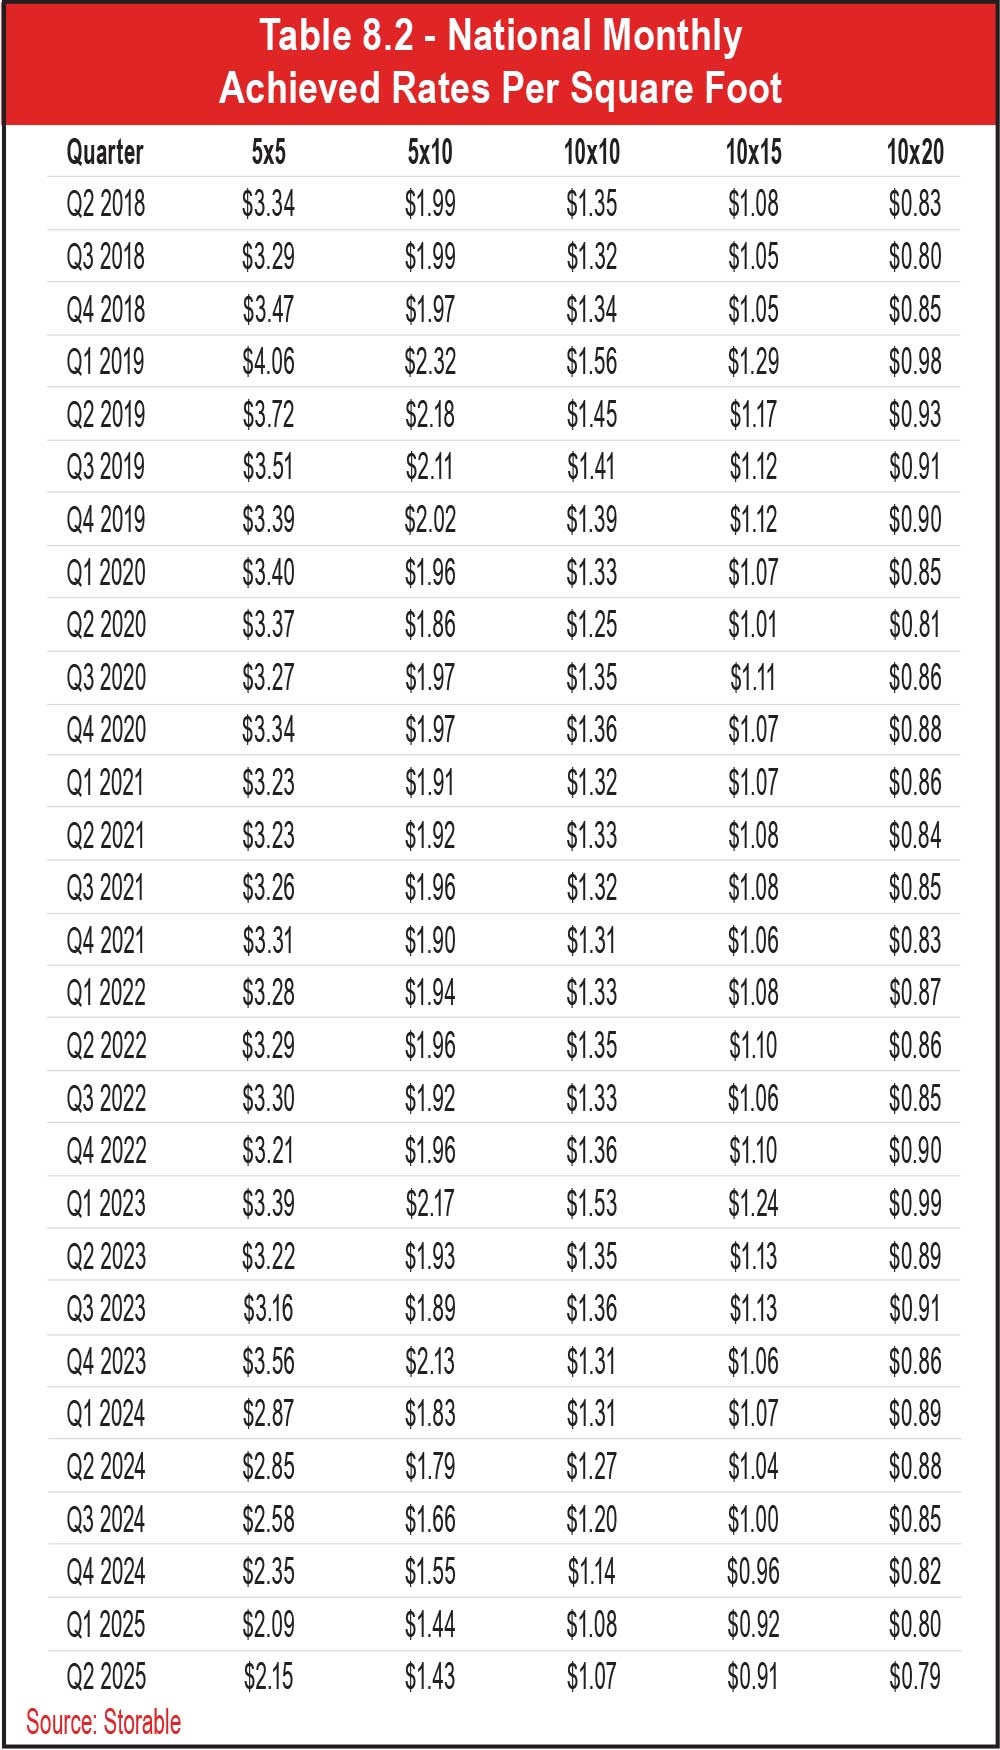
See Chart 8.4 and Table 8.2.
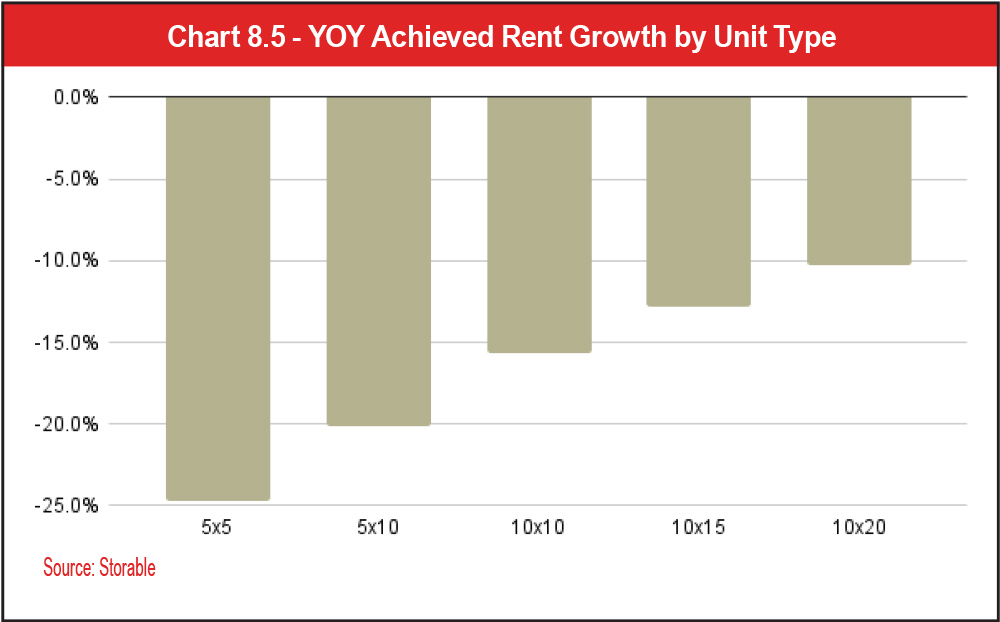
See Chart 8.5
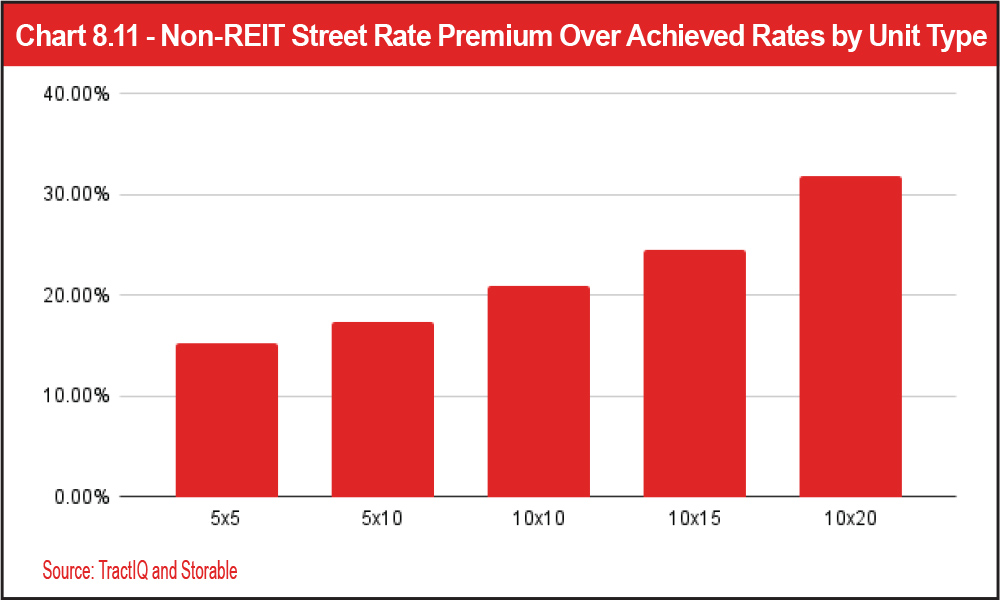
You can see the relationship between street rates and achieved rates in Charts 8.6, 8.7, 8.8, 8.9, 8.10, and 8.11. Please note that this data represents non-REIT managed facilities. You will notice that the street rates for some unit sizes are better predictors of achieved rates than other unit sizes. For example, for 5-by-5 units, street rates have historically been below achieved rates. However, in Q2 2024 5-by-5 street rates went above achieved rates; the difference increased to 15.3 percent by Q2 2025. It appears that street rates and achieved rates have been relatively in line with one another for the 5-by-10 and 10-by-10 units since 2018. For larger unit sizes (10-by-15 and 10-by-20), street rates have historically remained above achieved rates. It is also interesting to note that street rates are above achieved rates for all unit sizes currently, when that hasn’t been the case historically for 5-by-5 and 5-by-10 units. This highlights the stark decrease in achieved rates across the board over the last year.
See Charts 8.6, 8.7, 8.8, 8.9, 8.10, and 8.11.
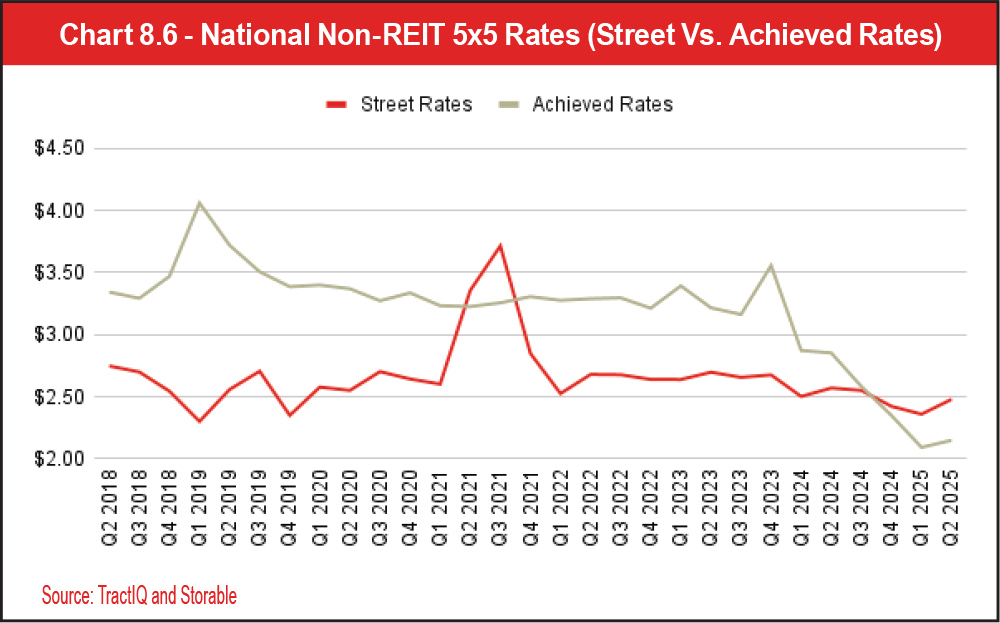
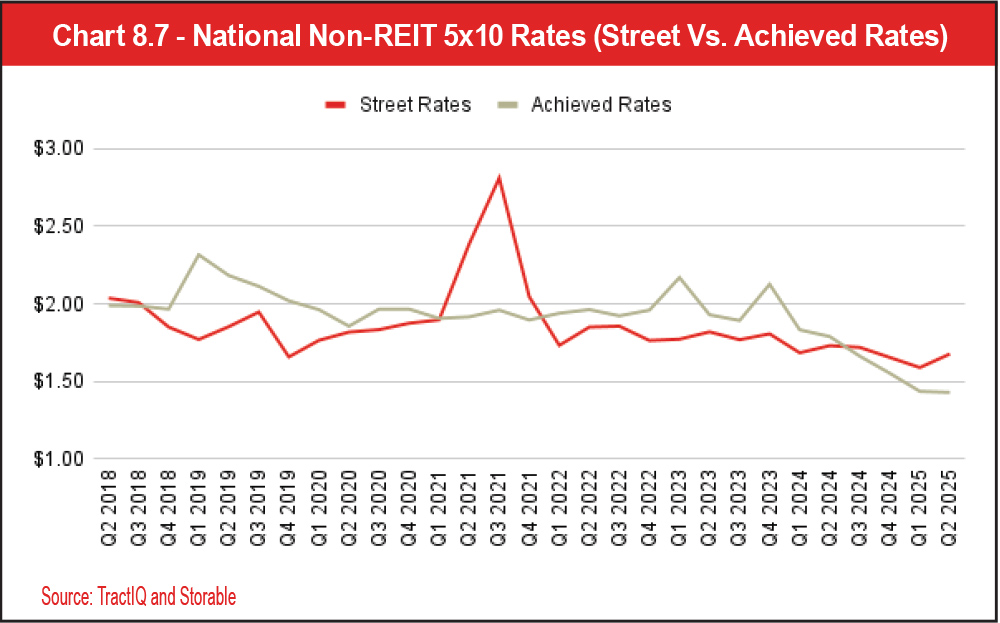
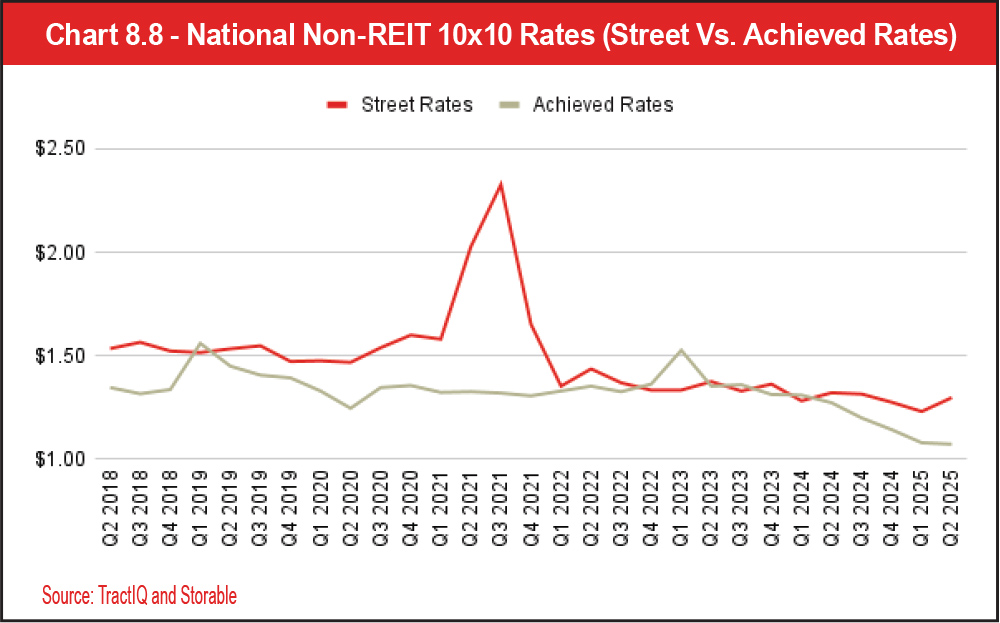
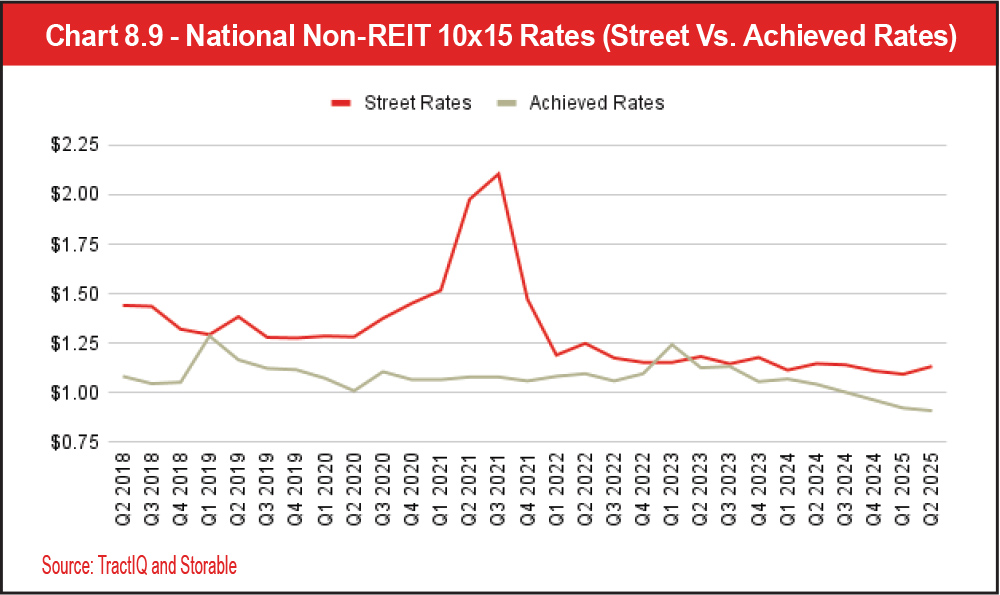
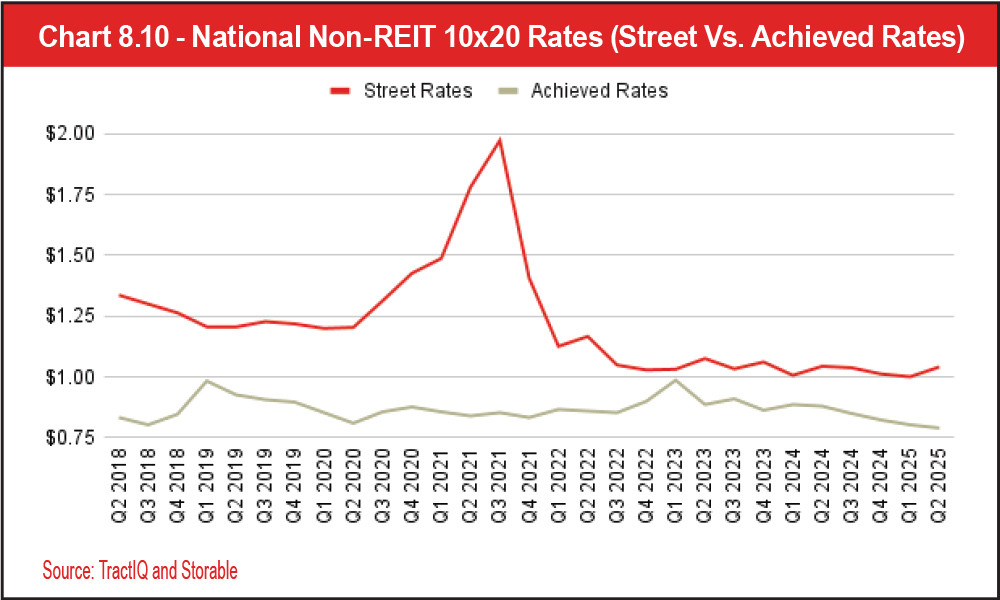
Another interesting observation from the charts is the delayed spike in achieved rates after an increase in street rates. As you can see from the data, street rates for all unit sizes started increasing in 2020, culminating at a peak in Q3 2021. Roughly 18 months later, a small increase in achieved rates can be observed in each of the charts. This may suggest to operators that it takes approximately 18 months for street rate changes to affect achieved rates. Understanding the relationship between street rates and achieved rates can provide valuable insights to storage professionals when analyzing deals, performing market analysis, or looking at advertised rates of competitors.
See Tables 8.3 and 8.4.
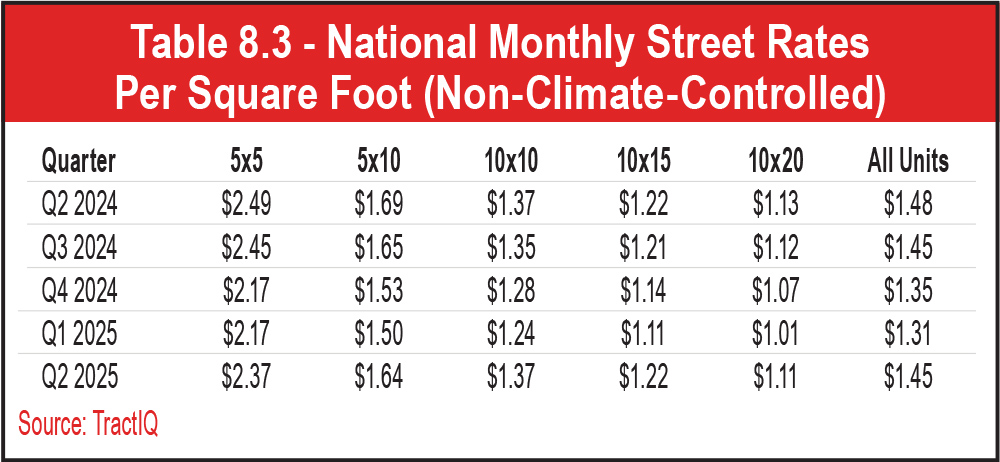
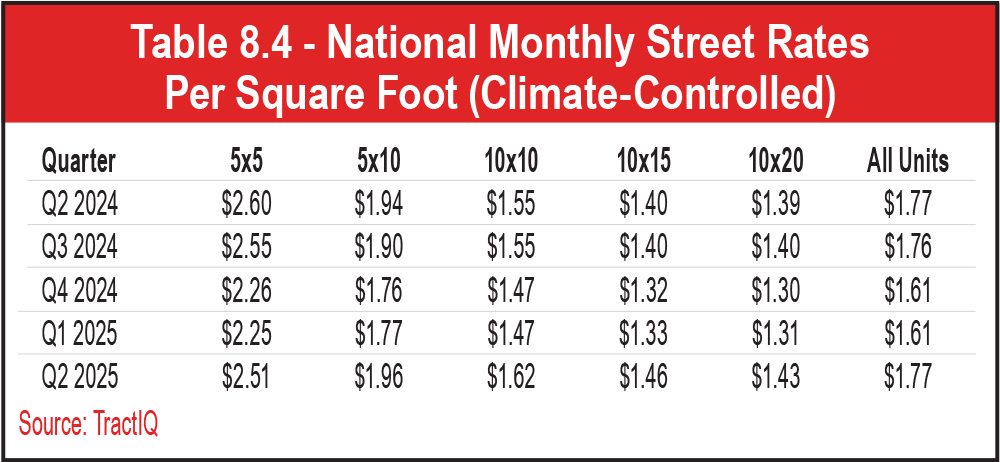
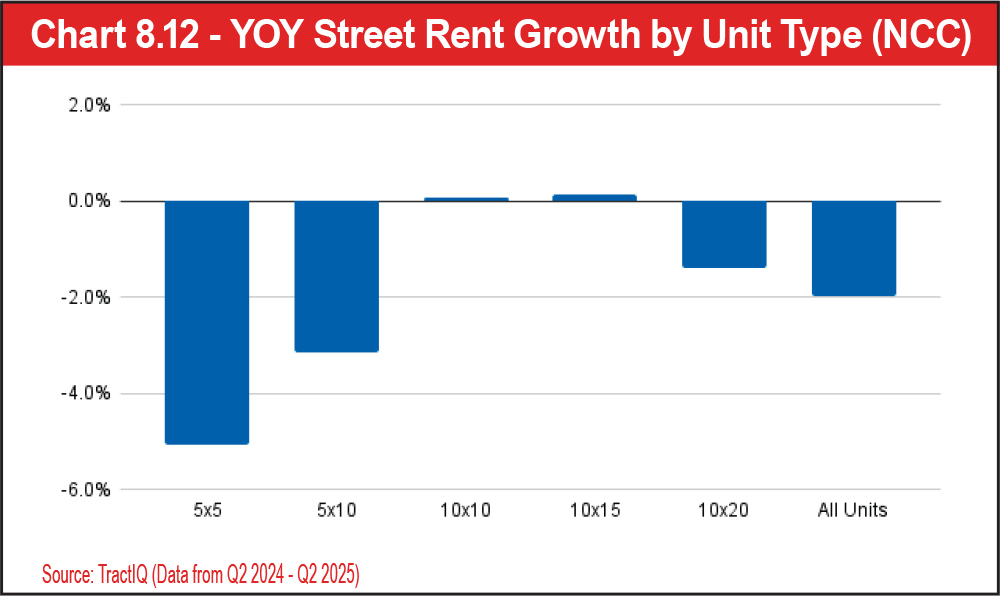
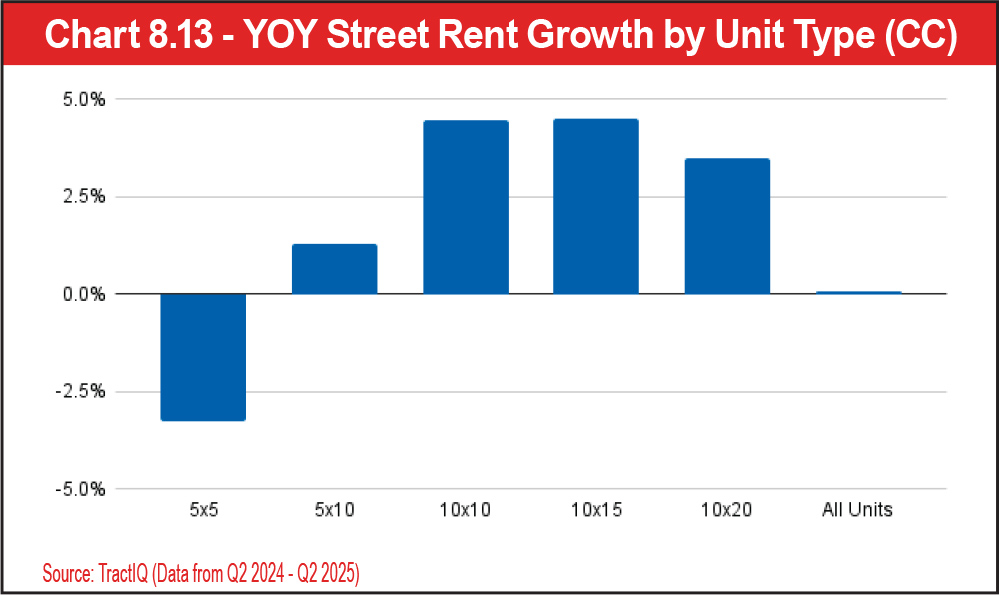
1. The year-over-year growth performance across all storage unit sizes is a mixed bag, with non-climate-controlled units experiencing a negative 1.97 percent year-over-year (YOY) growth overall and climate-controlled units experiencing a 0.07 percent YOY growth overall. This variability shouldn’t come as a surprise given the state of the self-storage industry over the last few years. The positive 0.07 percent YOY growth for climate-controlled units is actually the first positive growth recorded since Q2 2022. Non-climate-controlled units have also experienced weakness since Q2 2022. The only quarter since then where non-climate-controlled units experienced positive YOY growth was Q4 2023 (positive 1.32 percent YOY). Although non-climate-controlled units still experienced negative YOY growth in the latest quarter, the decline is modest and leveling out when compared to recent history. Overall, this could be a positive sign for the industry, suggesting pricing power may be strengthening for climate-controlled and non-climate-controlled units. Only time will tell if this slowdown in declining rental rates is a blip on the radar or an early sign of demand returning to the industry.
2. Climate-controlled units out-performed non-climate-controlled units over the last year. The popularity of climate-controlled storage has steadily grown over time. Customers more and more desire somewhere to store their precious belongings where they are safe from extreme temperatures. According to the SSA’s 2025 Self Storage Demand Study, more than 30 percent of renters are willing to pay extra for a unit that is air conditioned and where the humidity is controlled. On average, over the last 25 quarters, climate-controlled units have outperformed non-climate-controlled units from a year-over-year growth perspective 19 out of the 25 quarters.
3. Smaller units have suffered the most over the last year. The reason for this is difficult to pinpoint, but it may be due to oversupply. During the COVID-19 pandemic, a hot housing market led to record self-storage demand. However, supply chain issues as well as inflation raised construction costs and interest rates. Many of the new self-storage developments over the last two to three years have favored a unit mix with smaller unit sizes. This is because smaller units command a higher rent per square foot, which helps justify higher cost per square foot construction numbers as well as higher interest rates. Once the industry works through the COVID-era storage supply, we may see smaller unit pricing strengthen.
See Charts 8.12 and 8.13.
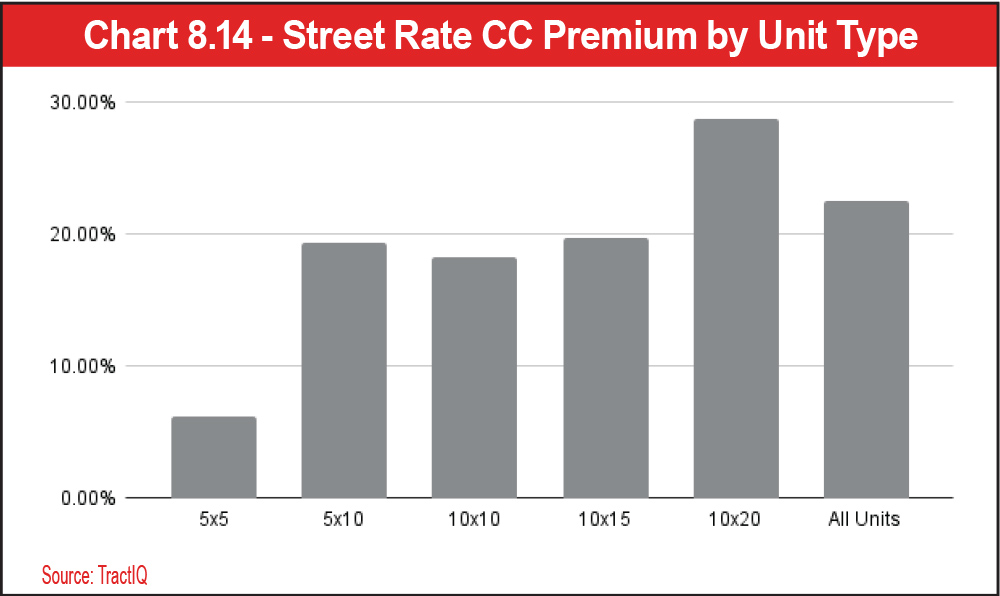
See Chart 8.14.
Items that benefit the most from climate-controlled protection tend to be large items such as furniture, appliances, and mattresses. It would be very challenging, or impossible, to fit a full-sized couch in a 5-by-5 unit. If a customer has multiple large items that need climate protection, the customer is left with no choice but to upgrade to a larger unit. In short, customers may see little value difference from a 5-by-5 that is climate controlled and a 5-by-5 that is not because what they are storing doesn’t need climate protection. Customers with larger, climate-sensitive items are willing to pay more to protect those items because they are more valuable, and customers don’t want to risk renting a unit with no climate protection.
Another reason larger units command a higher climate-controlled premium could be due to availability. According to TractIQ, only approximately 34 percent of 10-by-20 units are climate controlled. Compare this to the 5-by-5 unit size, where roughly half of units are climate controlled. A lower supply of large climate-controlled units creates higher demand, rates, and premiums.
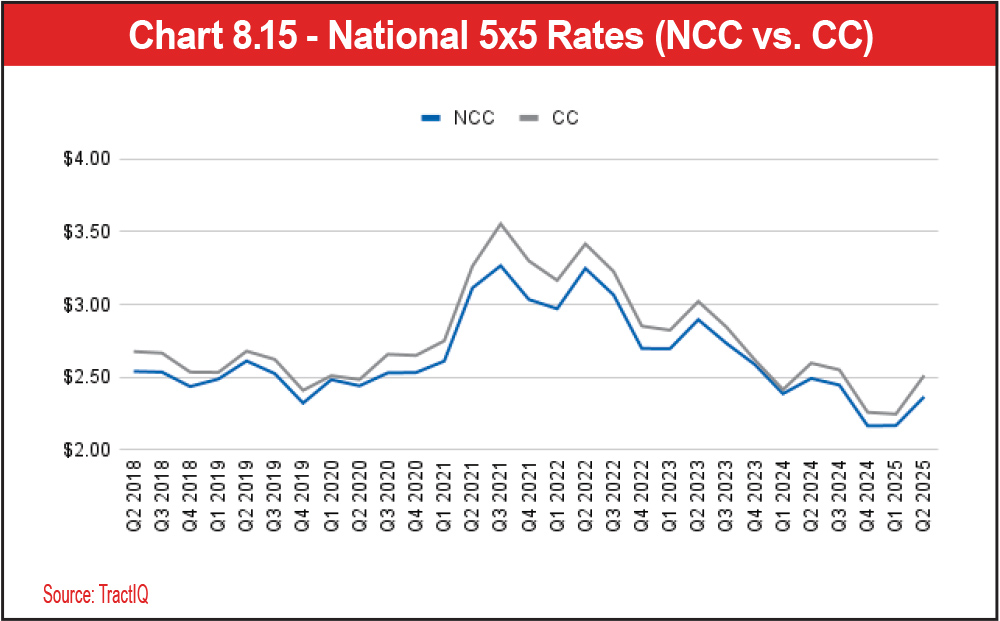
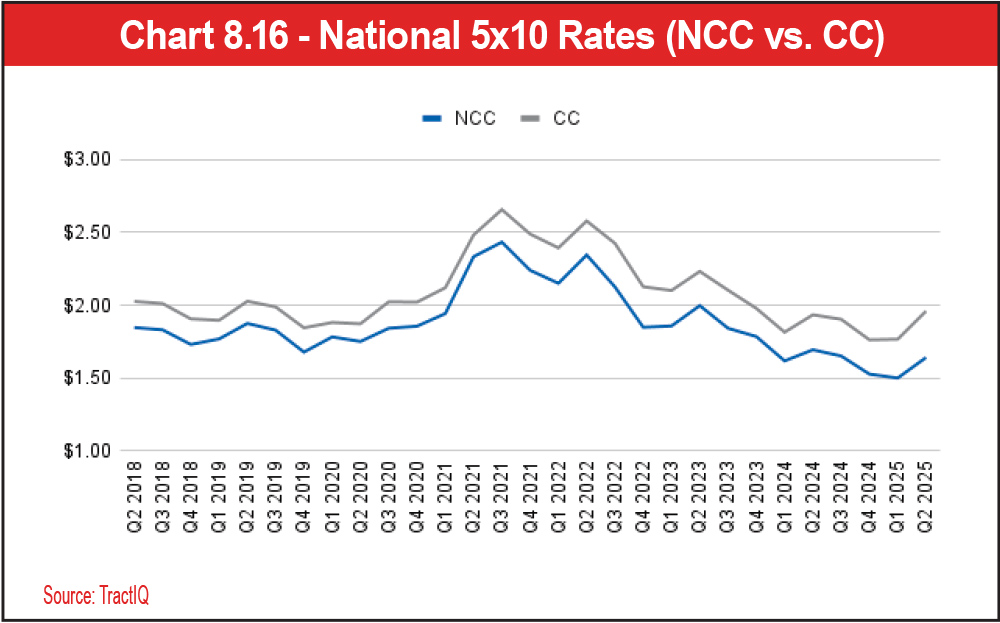
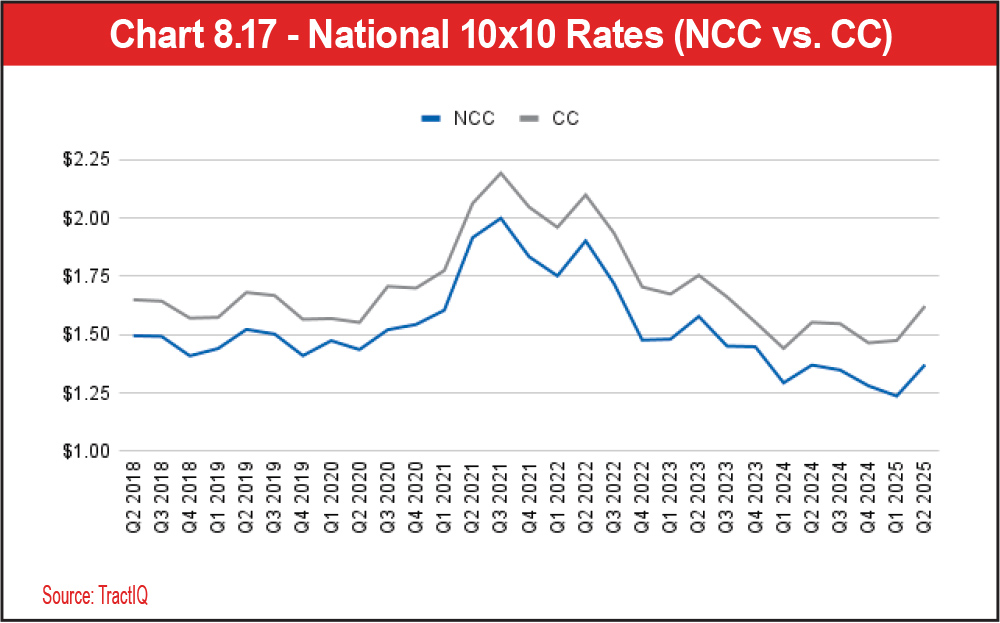
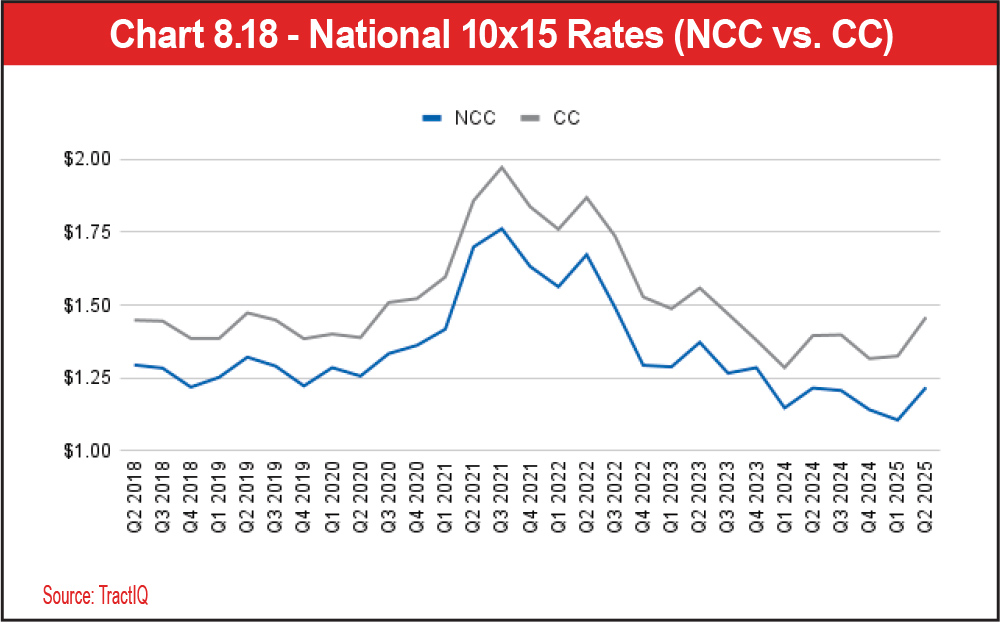
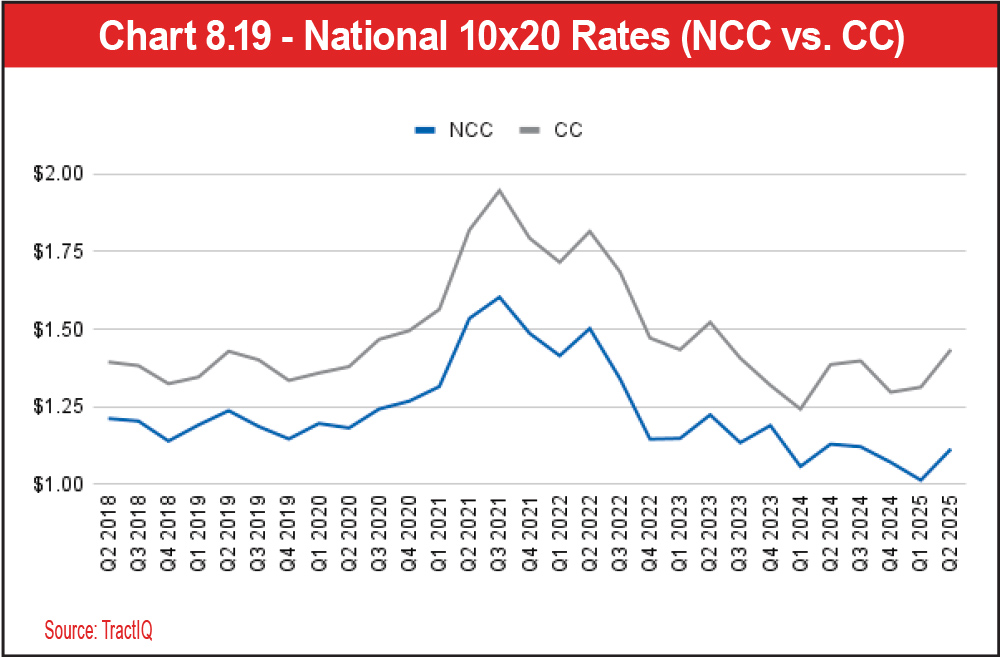
In addition, Charts 8.15, 8.16, 8.17, 8.18, and 8.19 show that rental rates for both climate-controlled and non-climate-controlled units are lower than, or very close to, 2018 rental rate levels. The elevated rental rates in 2021 to 2022 were due to high demand from the COVID-19 pandemic. Since then, rates have steadily decreased from lack of demand and increased supply. From Q4 2024 to Q2 2025, rental rates for all unit sizes and climate types have increased. Is this a return to regular seasonality? Or is this truly an early sign of returning demand to the industry? It will be interesting to see in 2026 and beyond if rental rates continue to decline, flatten, or increase.
See Charts 8.15, 8.16, 8.17, and 8.18.
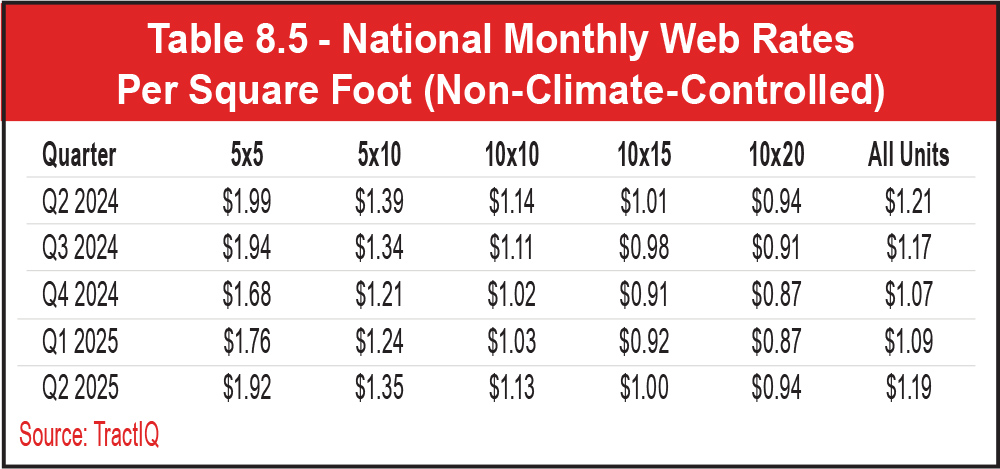
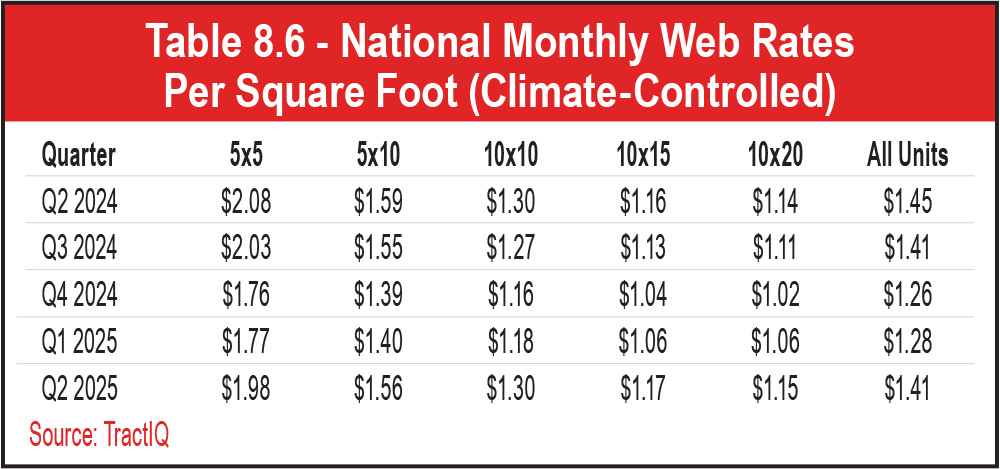
See Tables 8.5 and 8.6.
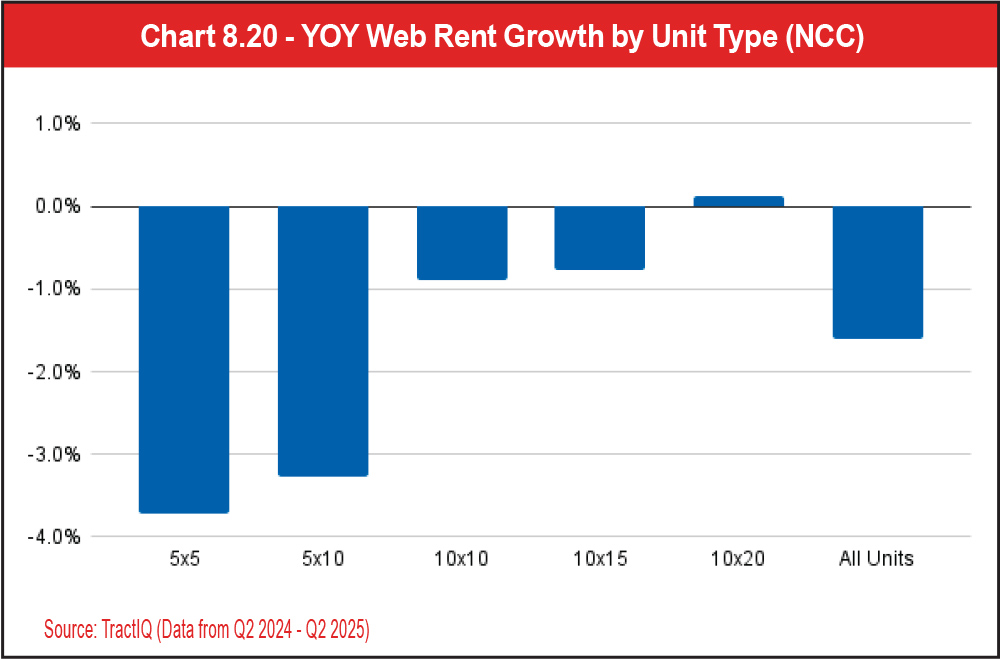
See Charts 8.20 and 8.21.
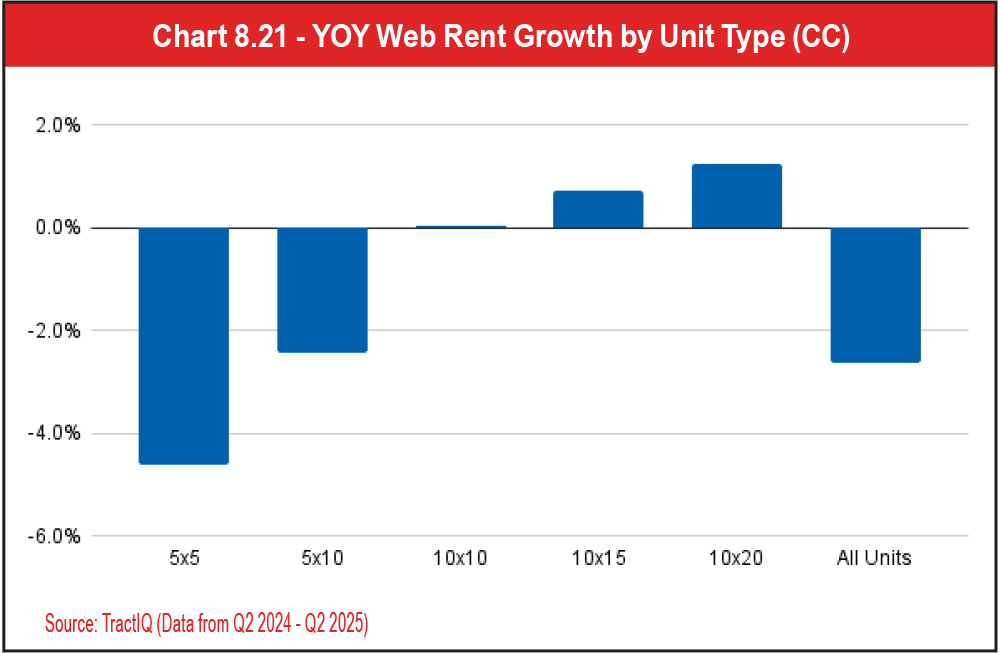
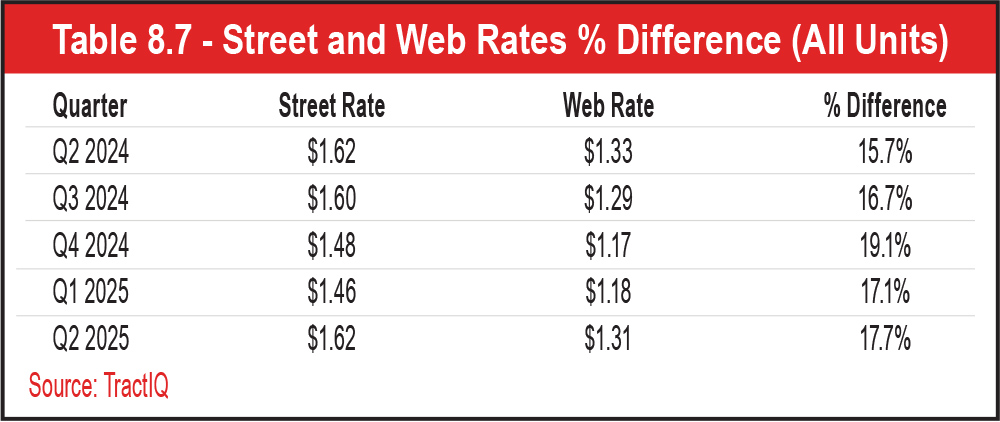
See Table 8.7 and Chart 8.22.
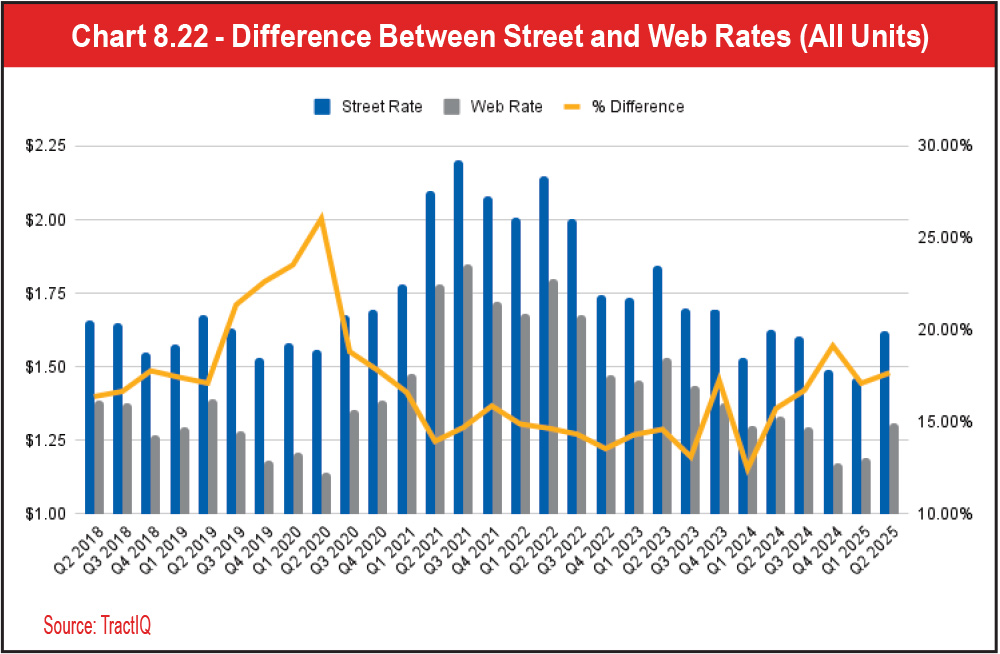
See Chart 8.22.
Things changed in late 2020 when demand for self-storage significantly increased due to the COVID-19 pandemic. During this time, people relocated from populous city centers to suburban areas. Interest rates were also extremely low (3.0 percent by September 2021 according to the National Association of Realtors), making it more affordable to change residences. According to the SSA’s 2025 Self Storage Demand Study, moving is a major demand driver for self-storage. Thirty percent of renters from the study who have short-term rental needs indicated they use storage because they are moving. As a result of lower interest rates and migration from city centers during COVID, demand for self-storage skyrocketed.
Evidence of this can be seen in Chart 8.22. You can see discounting started to decrease in late 2020 (yellow line). Because demand was high, operators gained more pricing power and did not have to discount web rates as much to attract customers. Operators seized the opportunity in 2021 by raising street rates approximately 35 percent and reducing discounting to below 15 percent at the peak.
Since 2022, the self-storage industry has been negatively impacted by oversupply, increasing interest rates, and falling home sales. Because the market was so “hot” from 2020 to 2022, developers were justified in building more self-storage due to high demand. According to the U.S. Census Bureau, self-storage construction spending of $6.9 billion in 2023 marked a 24 percent increase over 2022. Oversupply creates more competition between operators and shifts pricing power to the customer. The difference between street rates and web rates has been elevated since 2023, reaching nearly 20 percent in Q4 2024. As of Q2 2025, discounting is still elevated at 17.7 percent, up slightly from Q1 2025 (17.1 percent). Although street rates and web rates increased from Q1 2025 to Q2 2025, these rates are still at 2018 to 2019 levels. The discounting trend is a good indicator of demand and the state of the industry. It will be interesting to see if discounting stays elevated or starts to decrease in 2026 and beyond.
See Tables 8.8, 8.9, and 8.10.
See Chart 8.23.
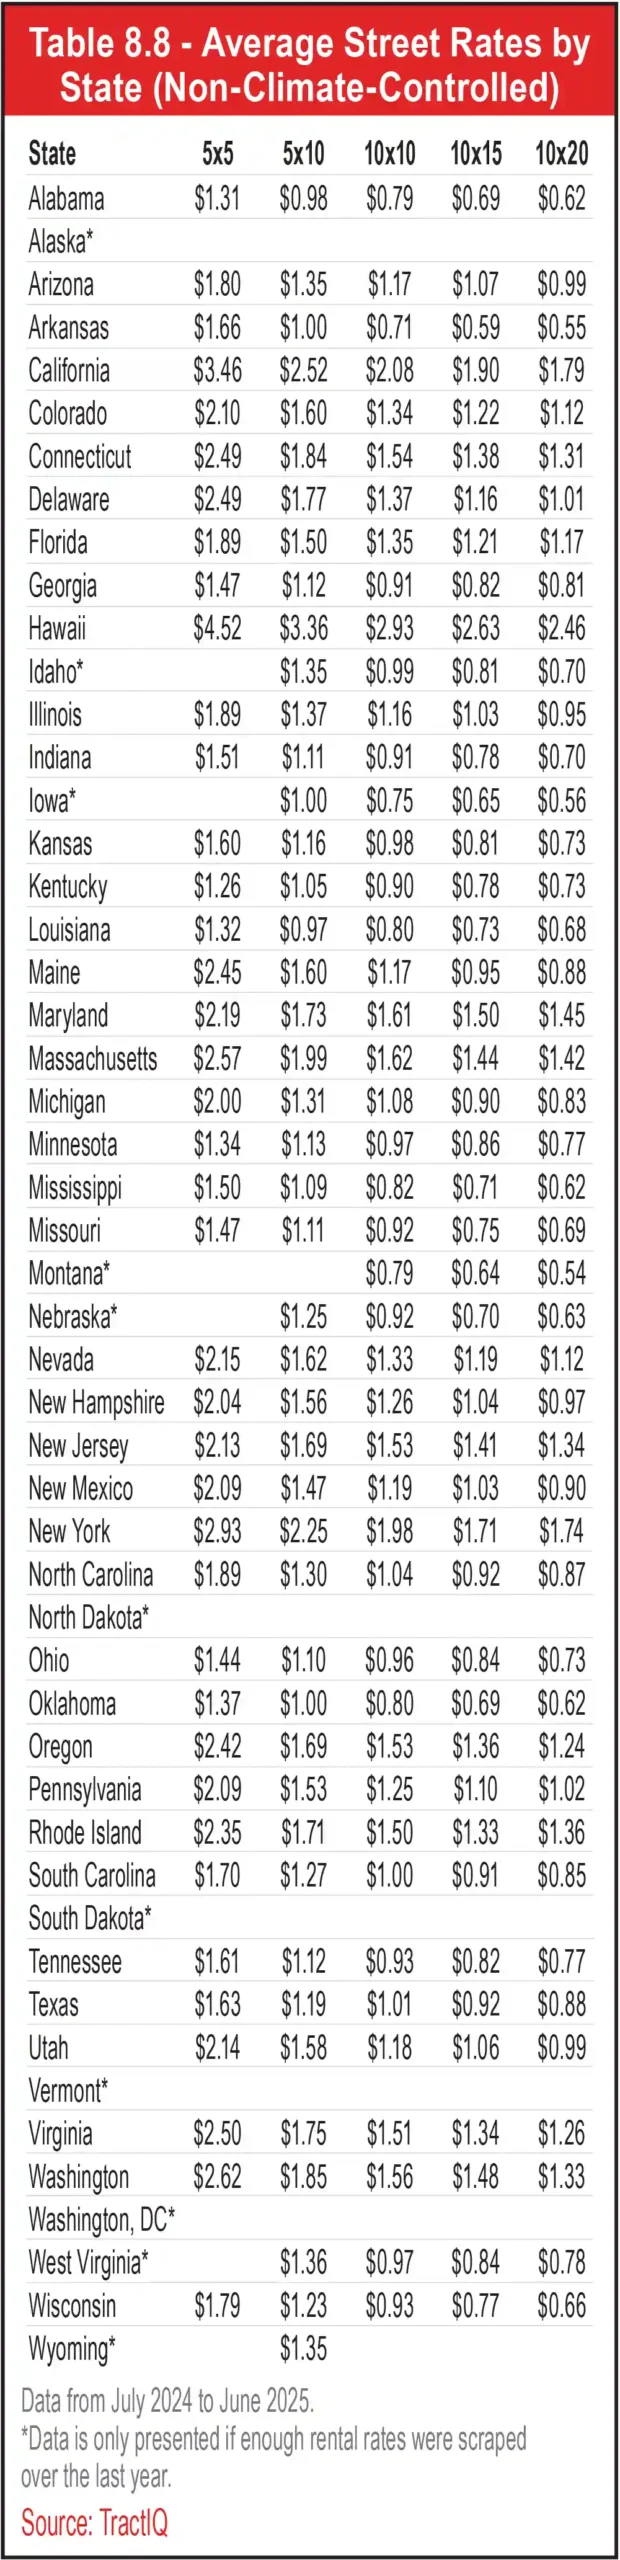
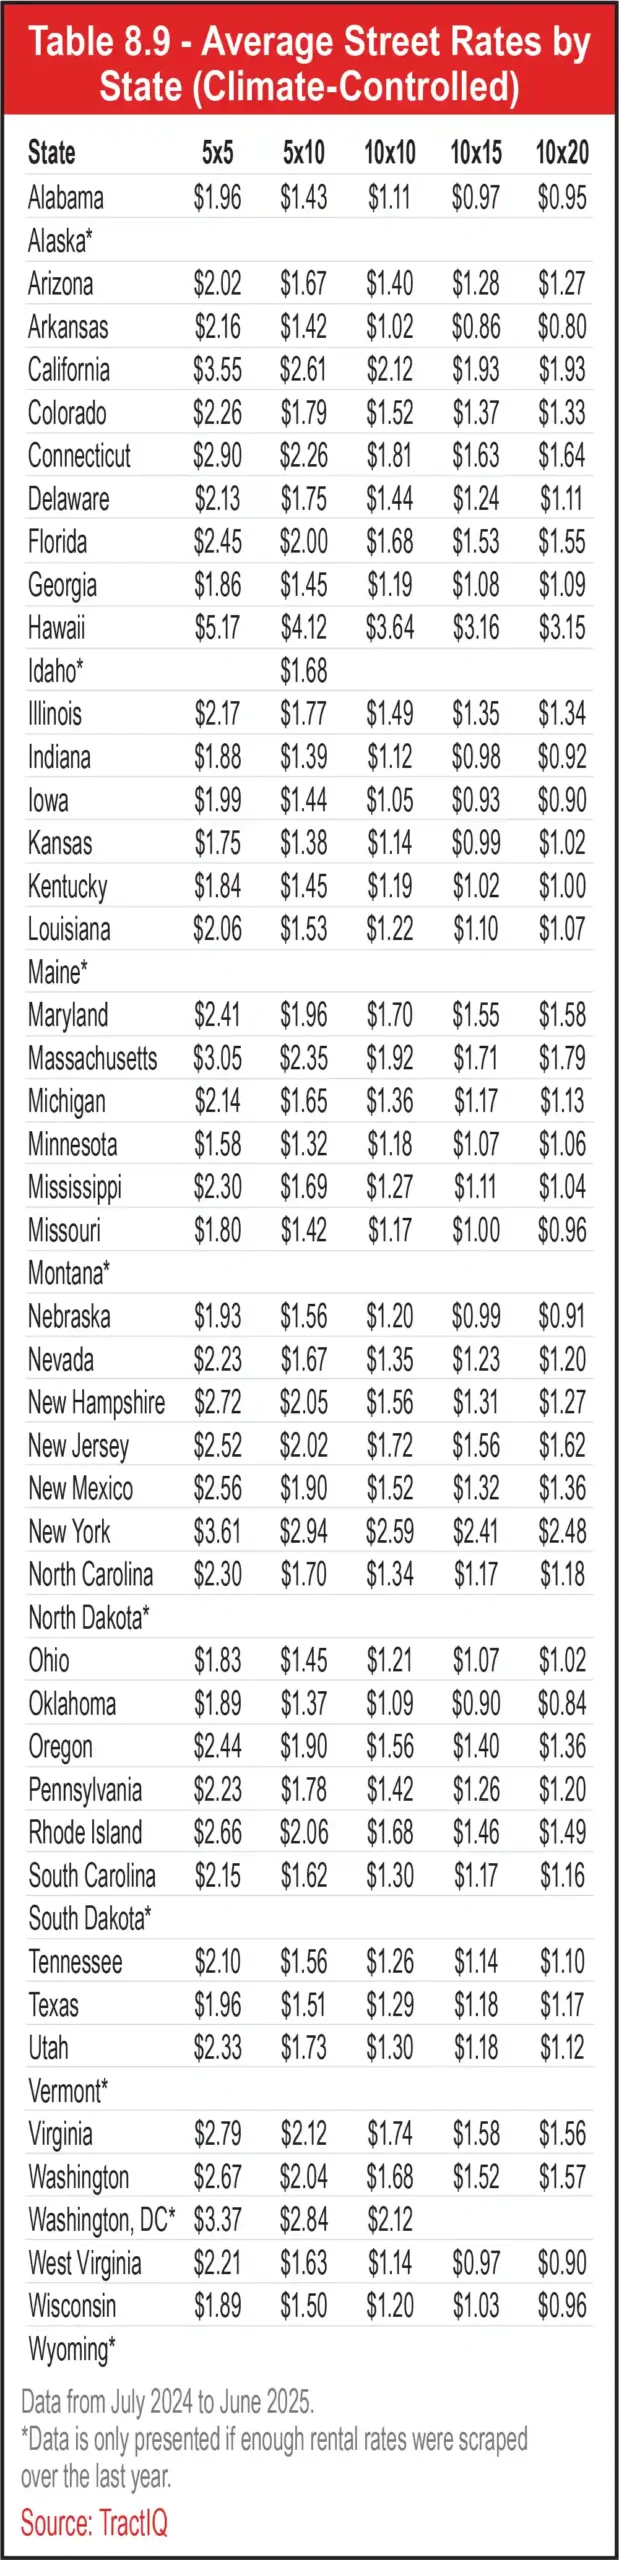

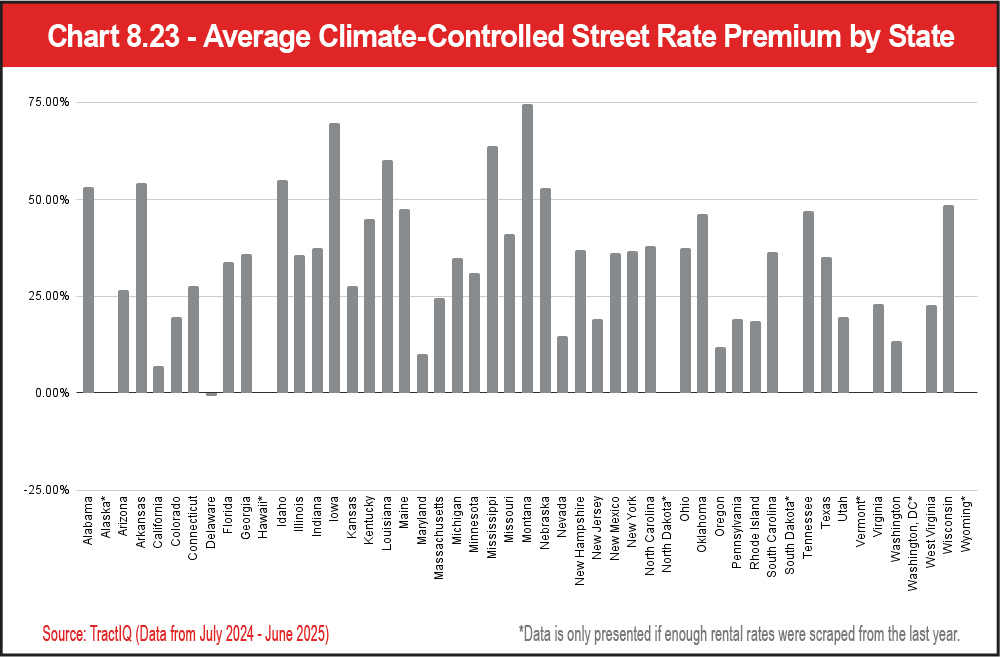
It is no surprise that high humidity states or states with extreme temperatures top the charts for the highest climate-controlled premium. These states include Alabama, Arkansas, Idaho, Iowa, Louisiana, Mississippi, Montana, and Nebraska. States that have the lowest climate-controlled premium include California, Delaware, Maryland, Nevada, and Oregon, likely due to lower temperature and/or humidity extremes. Interestingly, Delaware (-0.81 percent) is the only state where non-climate-controlled units are commanding higher prices than climate-controlled units, on average over the last year.
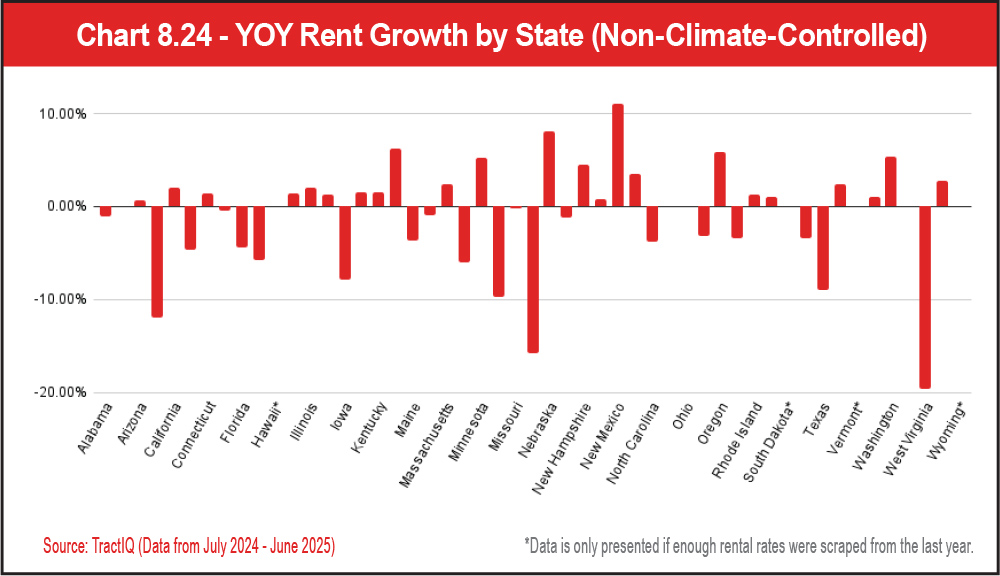
As discussed earlier in this section, street rate year-over-year growth has been a mixed bag across unit sizes and climate types. As you can see in Table 8.11 and Chart 8.24, states also were a mixed bag of YOY rental rate growth for non-climate-controlled units. However, the following states experienced the most positive non-climate-controlled rental rate growth year over year:
- New Mexico (up 11.1 percent)
- Nebraska (up 8.1 percent)
- Louisiana (up 6.2 percent)
- Oregon (up 5.9 percent)
See Table 8.11 and Chart 8.24.

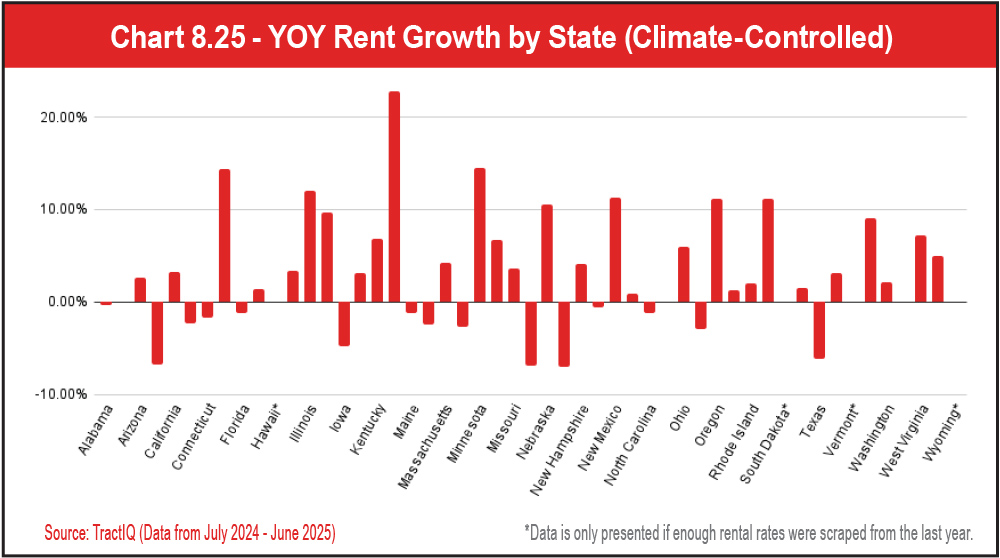
- Louisiana (up 22.8 percent)
- Minnesota (up 14.4 percent)
- Delaware (up 14.3 percent)
- Illinois (up 12.0 percent)
A few states that top the charts for the biggest year-over-year decline in climate street rates include Nevada (down 7.0 percent), Montana (down 6.9 percent), and Arkansas (down 6.7 percent). You will also notice in Table 8.11 that the state with the highest average non-climate-controlled street rate per square foot was California at $2.30. The state with the lowest average non-climate-controlled street rate per square foot was Iowa at $0.72. In Table 8.12, the state with the highest average climate-controlled street rate per square foot was New York at $2.84. The state with the lowest average climate-controlled street rate per square foot was Arkansas at $1.13.
See Table 8.12 and Chart 8.25.

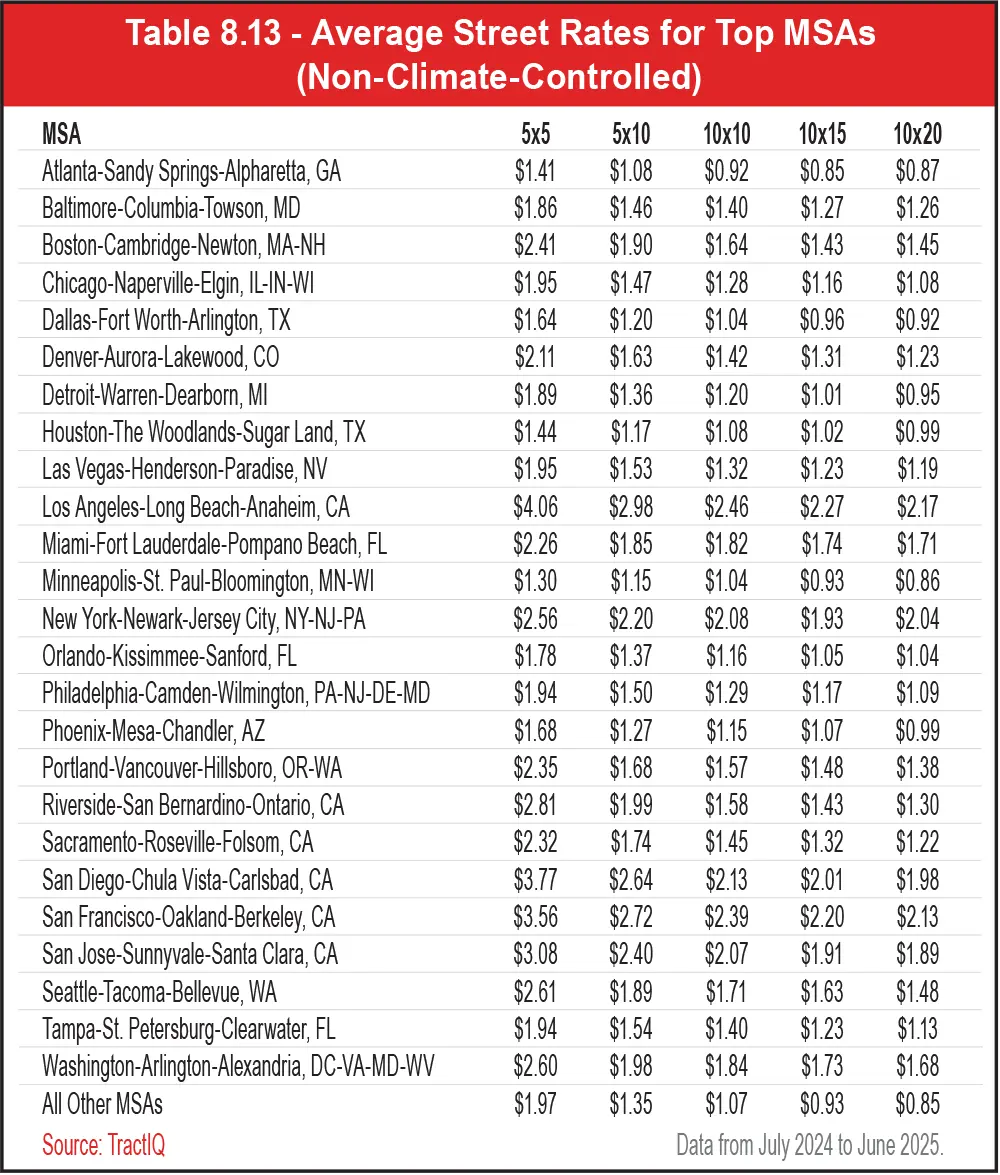
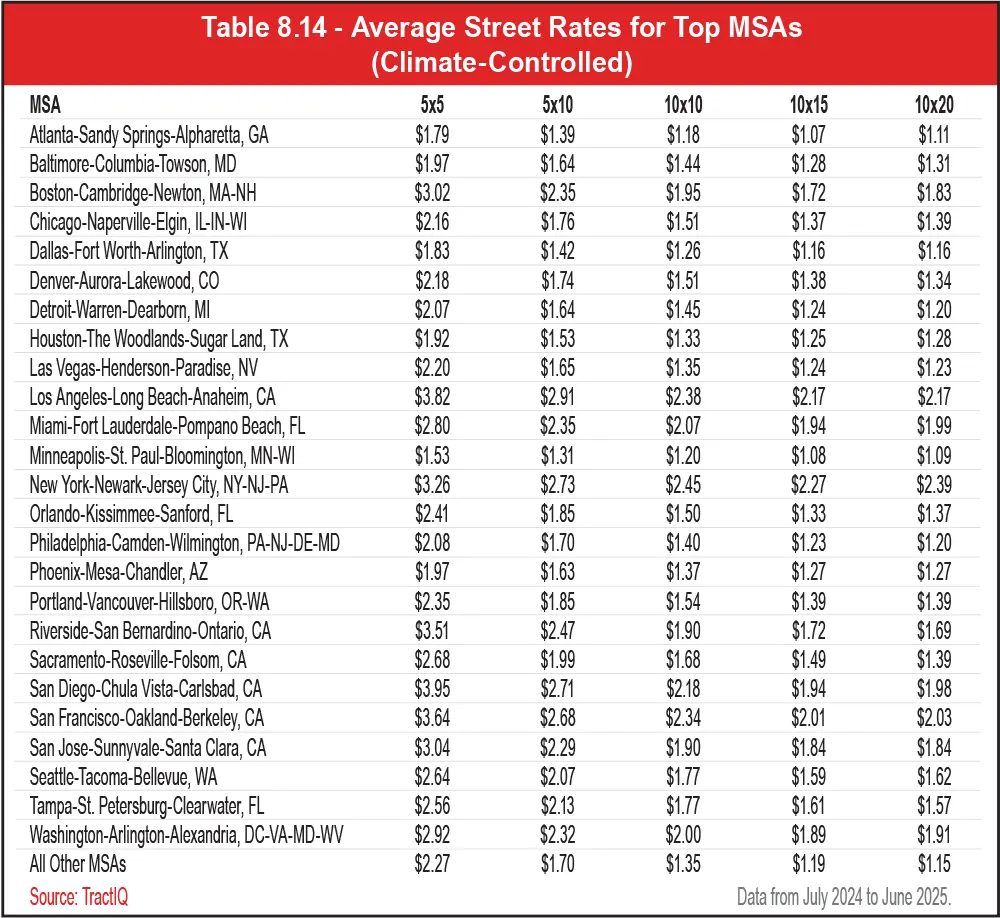
Tables 8.13 and 8.14 show average street rates for non-climate-controlled and climate-controlled units by MSA over the last year. We have included data on the top 25 MSAs and then an additional “All Other MSAs” category. Table 8.15 and Chart 8.26 show the climate-controlled street rate premium for each MSA. As mentioned previously, this data represents how much more operators and owners are able to charge customers on move-in (street rates) for a climate-controlled unit versus a non-climate-controlled unit.
See Tables 8.13, 8.14, and 8.15.
See Chart 8.26.
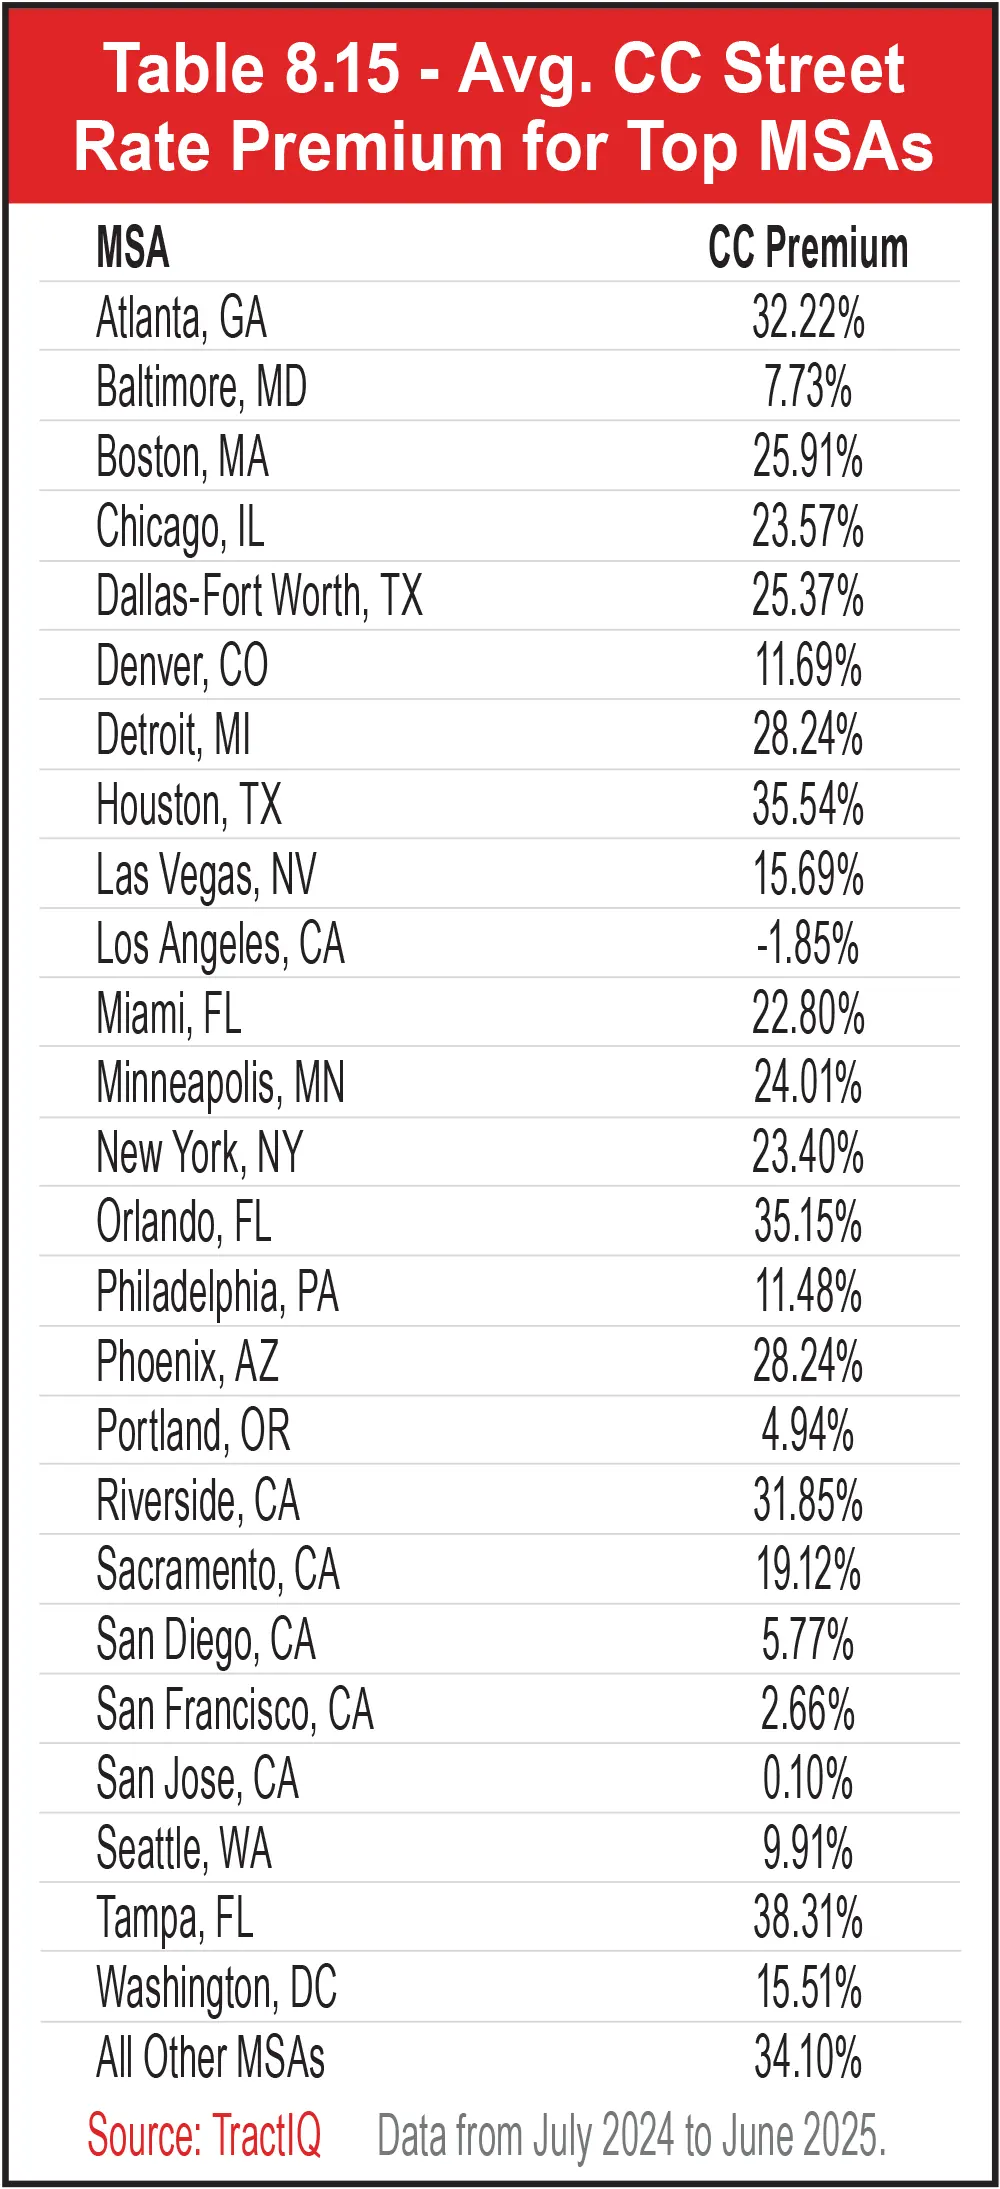
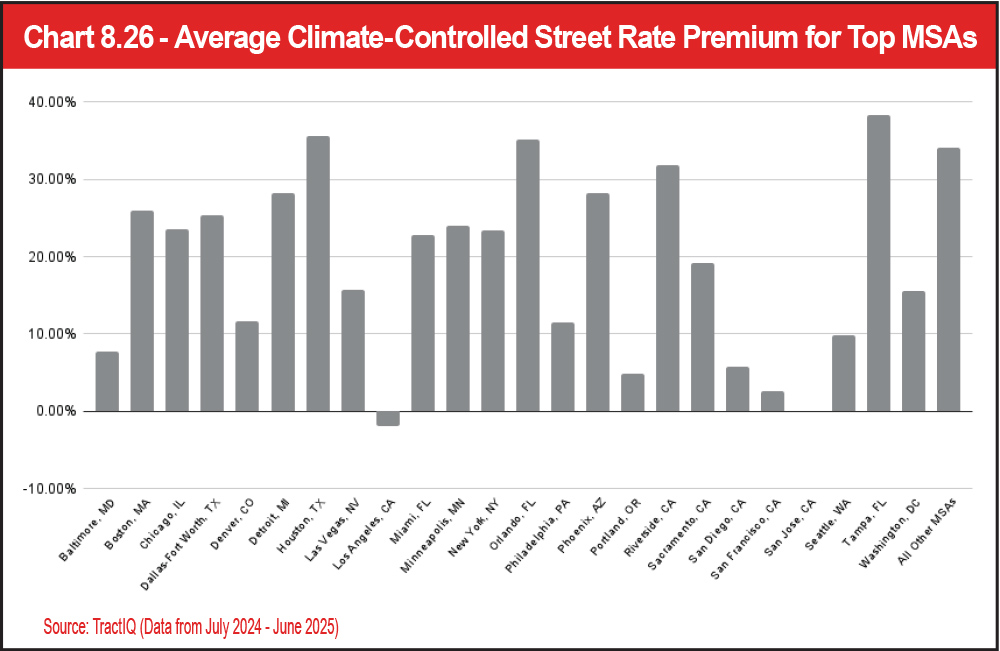
- Los Angeles, Calif. (down 1.8 percent)
- San Jose, Calif. (up 0.1 percent)
- San Francisco, Calif. (up 2.6 percent)
- Portland, Ore. (up 4.9 percent)
- San Diego, Calif. (up 5.7 percent)
It’s no surprise that most of these MSAs are in California, where there is a lack of extreme temperature or humidity. Also unsurprisingly, the MSAs with the highest climate-controlled street rate premiums are locations with high humidity:
- Tampa, Fla. (38.3 percent)
- Houston, Texas (35.5 percent)
- Orlando, Fla. (35.1 percent)
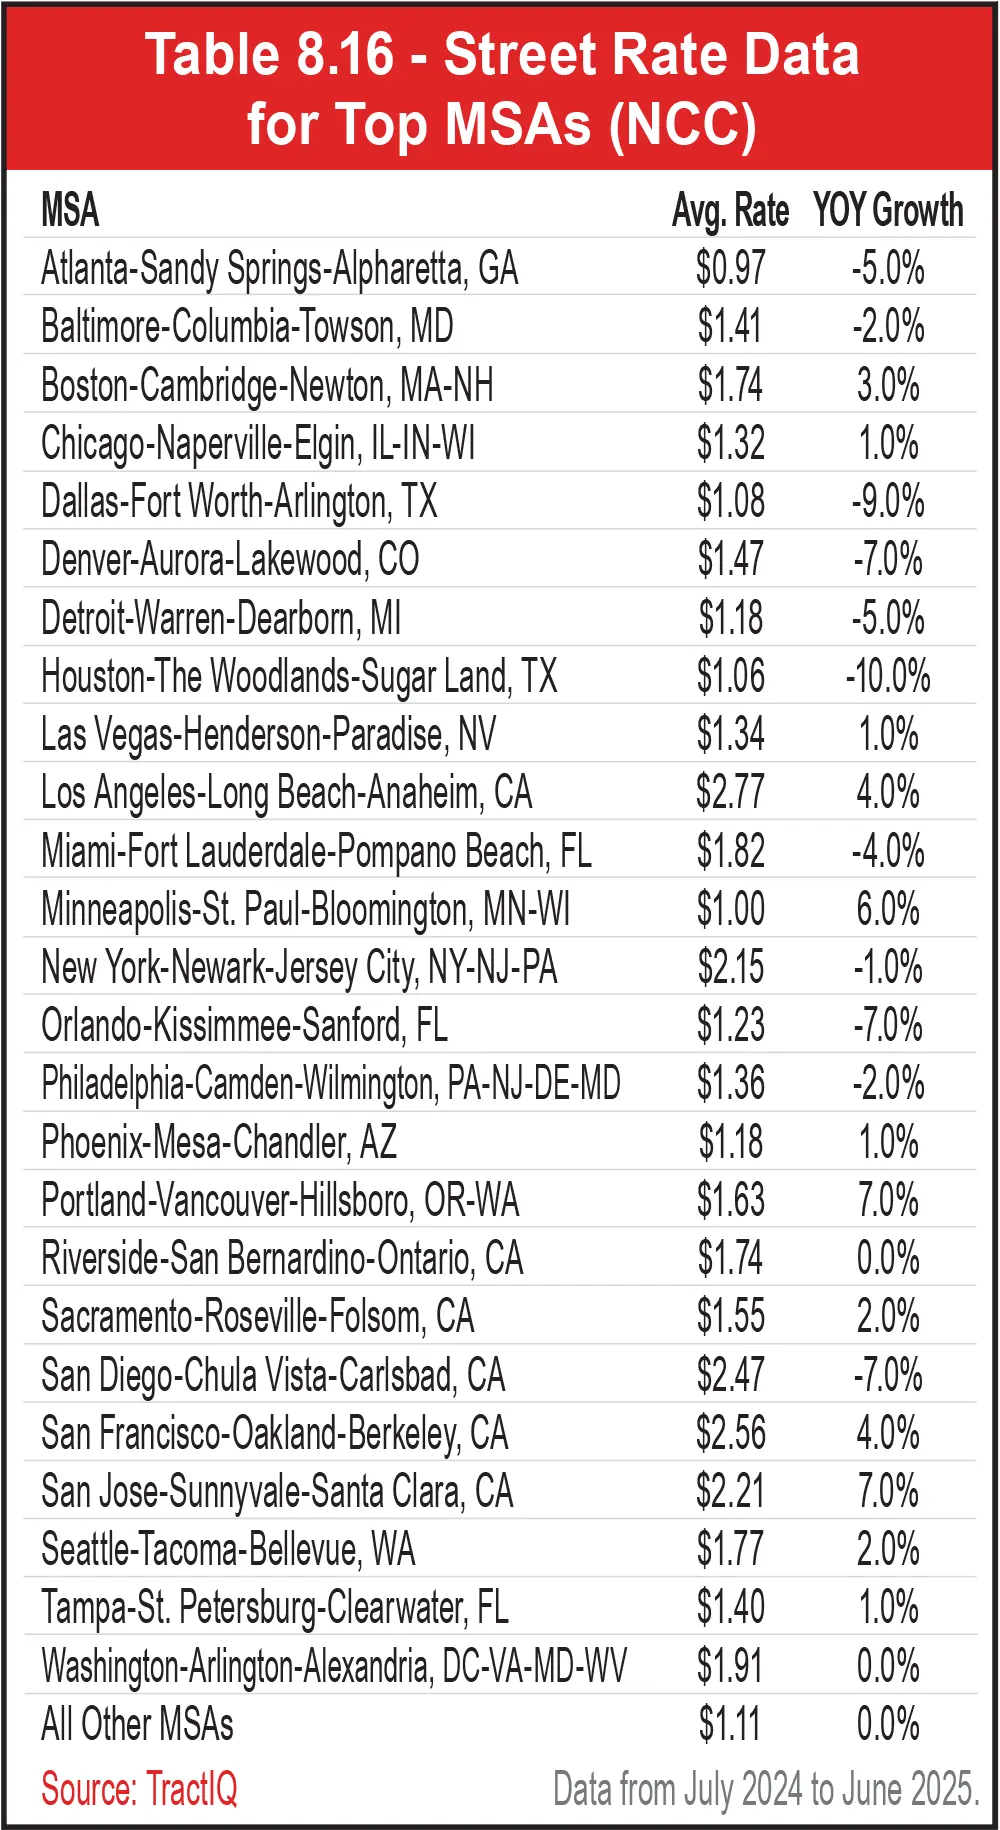
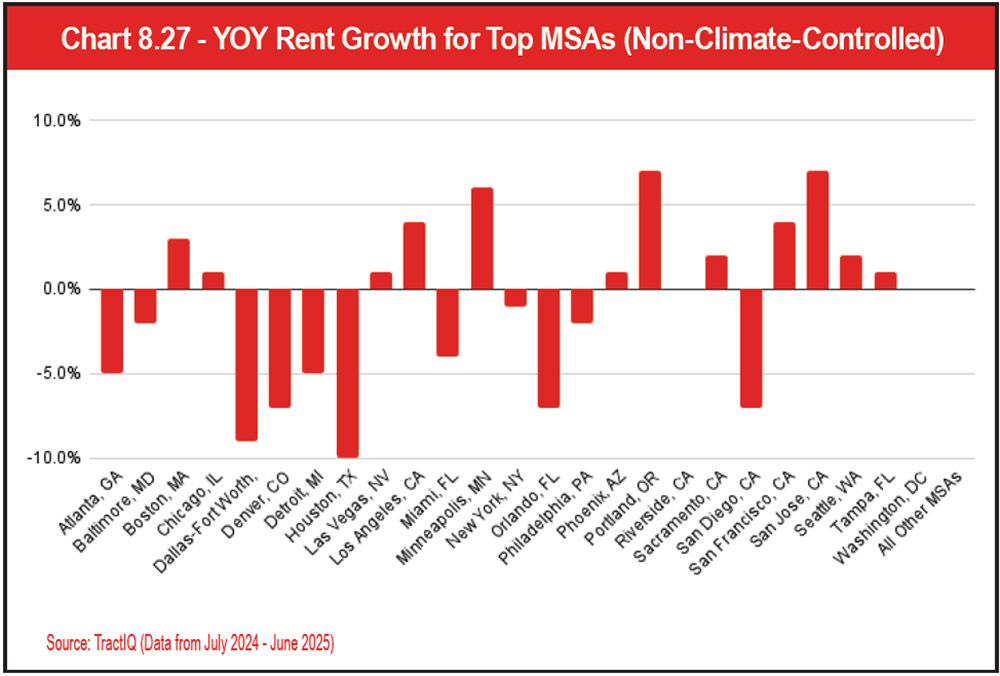
Roughly half of the top MSAs experienced year-over-year non-climate-controlled rental rate growth, with the following MSAs leading the pack:
- Portland, Ore. (up 7 percent)
- San Jose, Calif. (up 7 percent)
- Minneapolis, Minn. (up 6 percent)
- Los Angeles, Calif. (up 4 percent)
- San Francisco, Calif. (up 4 percent)
See Table 8.16 and Chart 8.27.
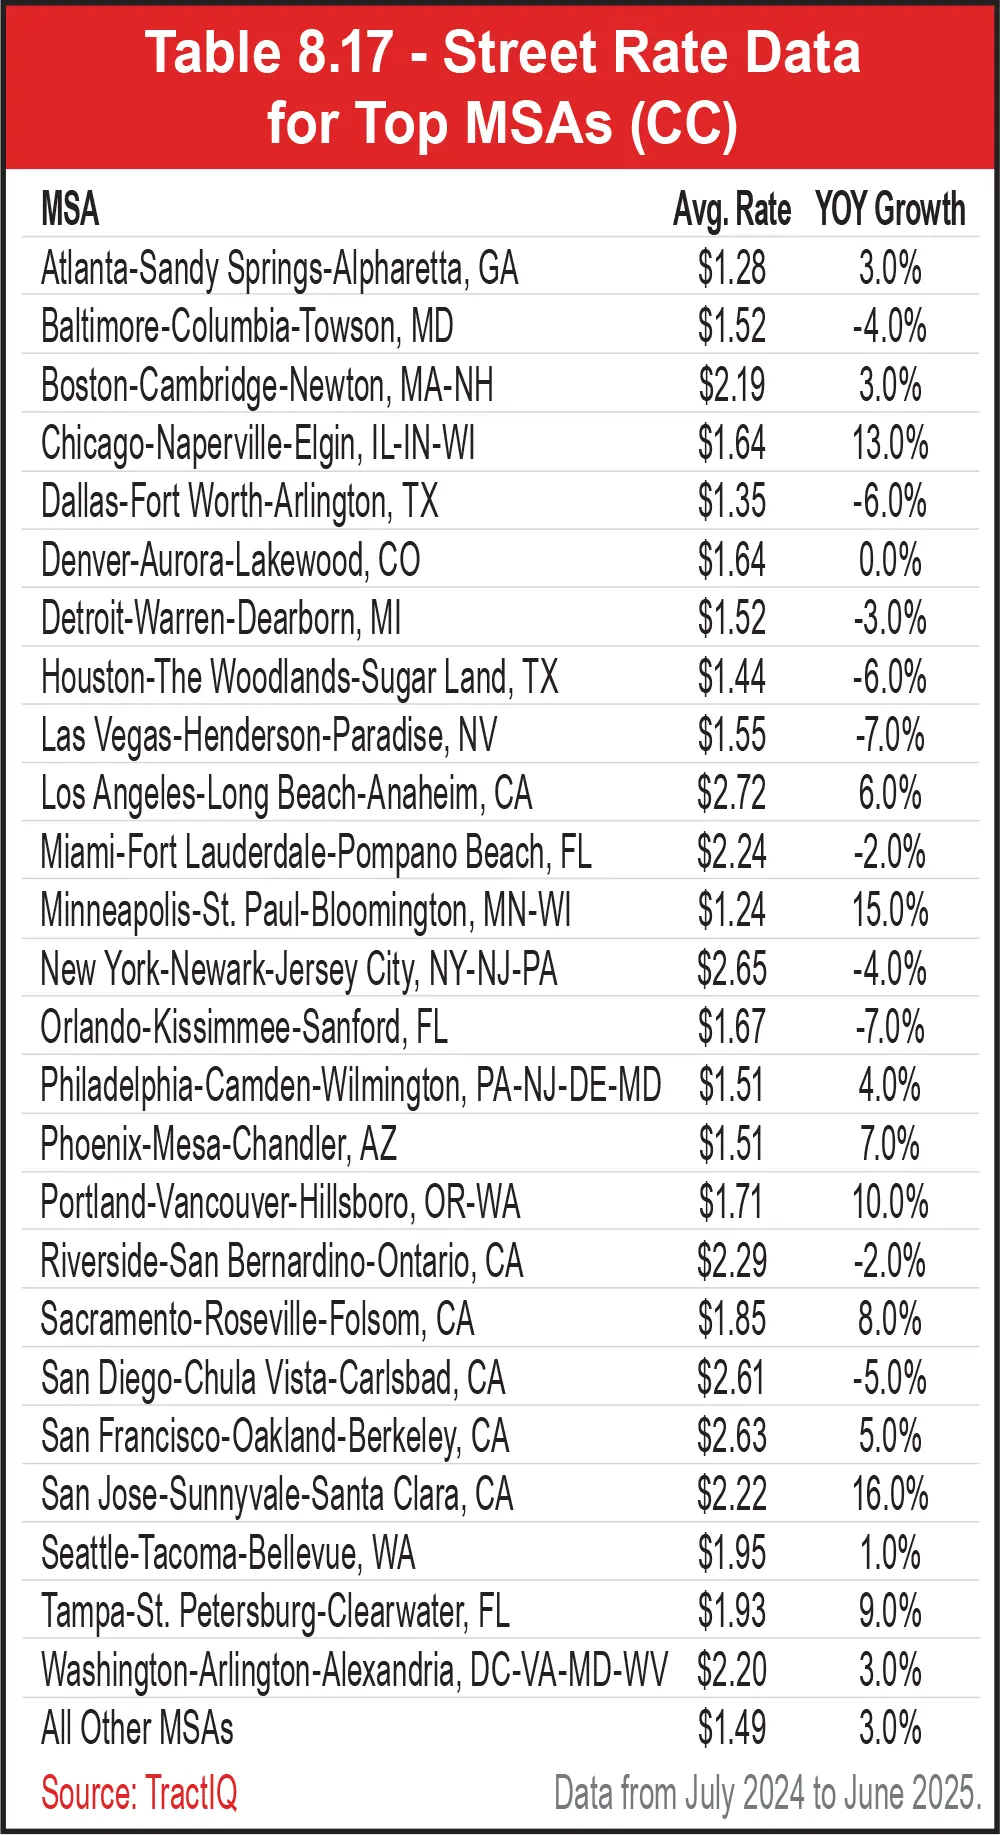
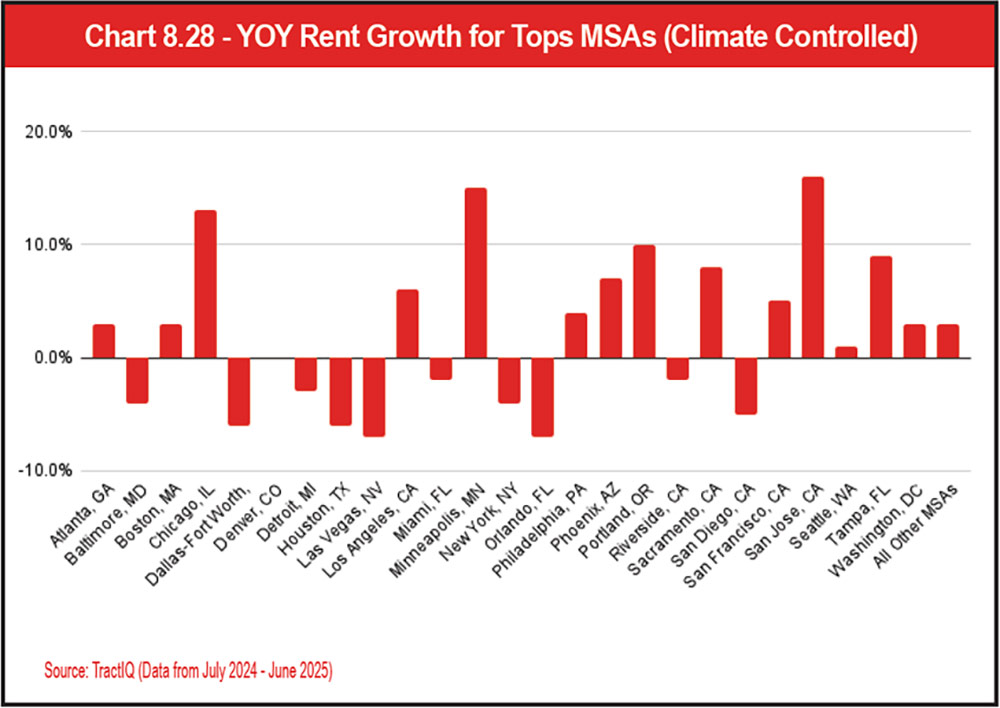
- San Jose, Calif. (up 16 percent)
- Minneapolis-St, Paul, Minn. (up 15 percent)
- Chicago, Ill. (up 13 percent)
- Portland, Ore. (up 10 percent)
- Tampa, Fla. (up 9 percent)
Las Vegas, Nev. (down 7 percent); Orlando, Fla. (down 7 percent); Houston, Texas (down 6 percent); and Dallas-Ft. Worth, Texas (down 6 percent) were the MSAs that experienced the greatest decline in climate-controlled rental rates year over year. In conjunction with decreasing rates, these states all have higher supply to work through, measured by development-to-existing-inventory percent (Nevada at 8.3 percent, Florida at 19.2 percent, and Texas at 7.9 percent).
See Table 8.17 and Chart 8.28.