


or the Q4 2025 update, the Yardi Matrix Self-Storage Supply Forecast has been increased by approximately 4.5 percent for 2025 and 2026. The remaining years’ forecast remains unchanged.
See Table 3.1.
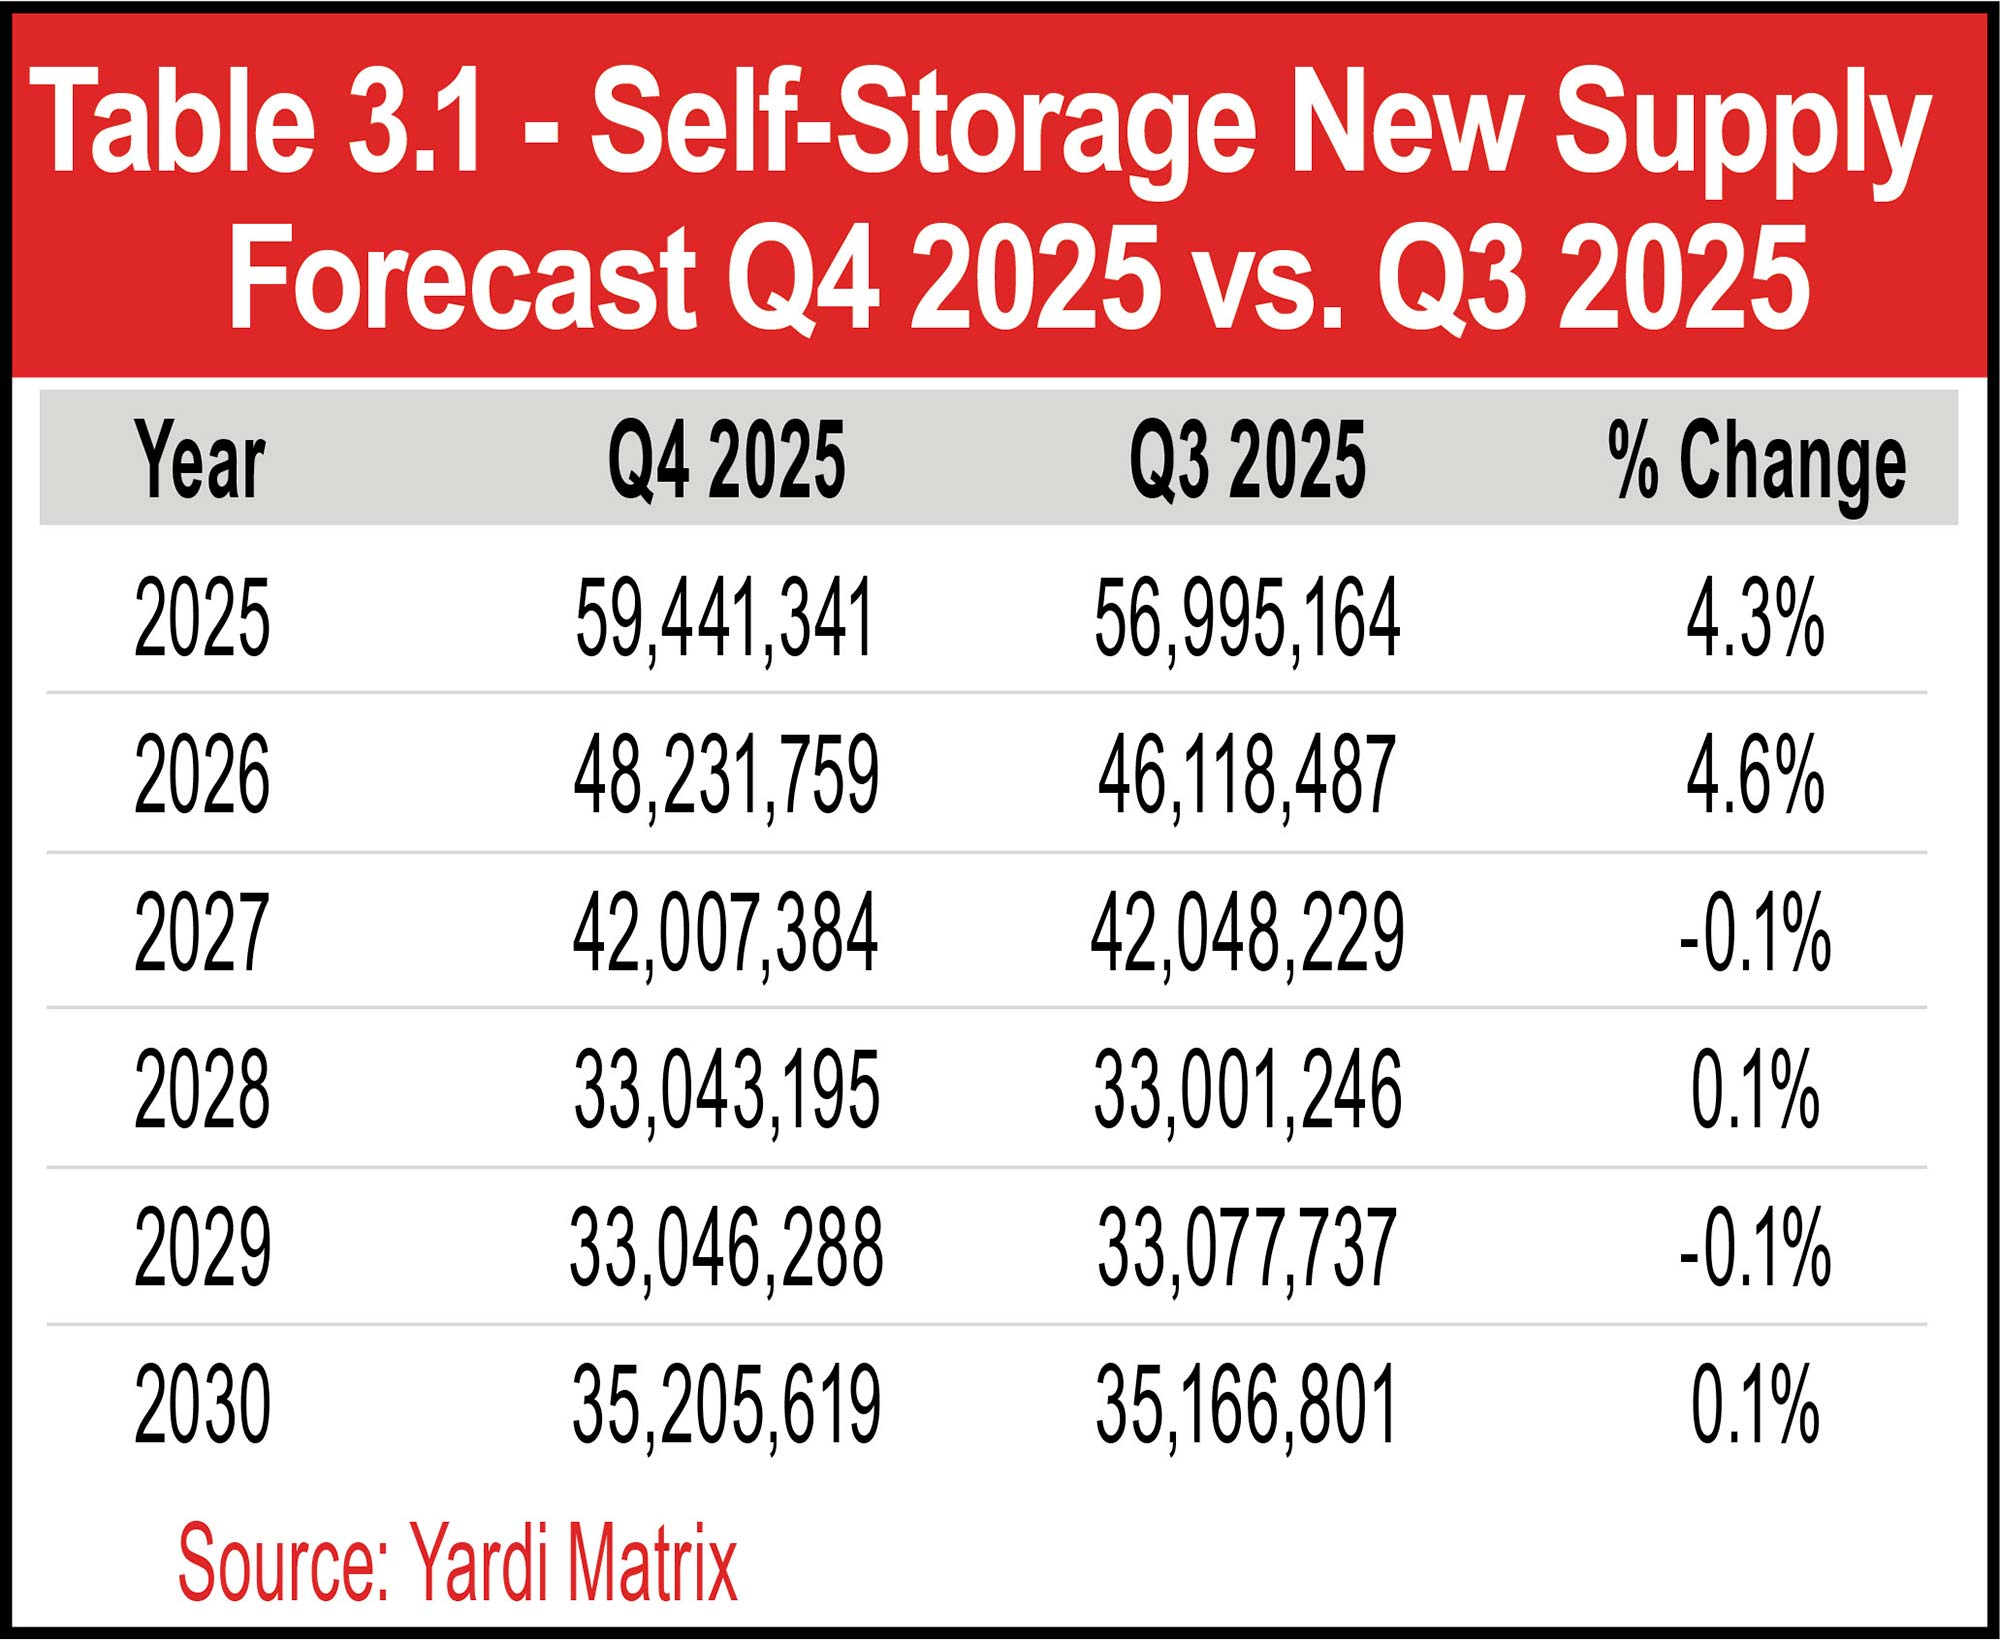
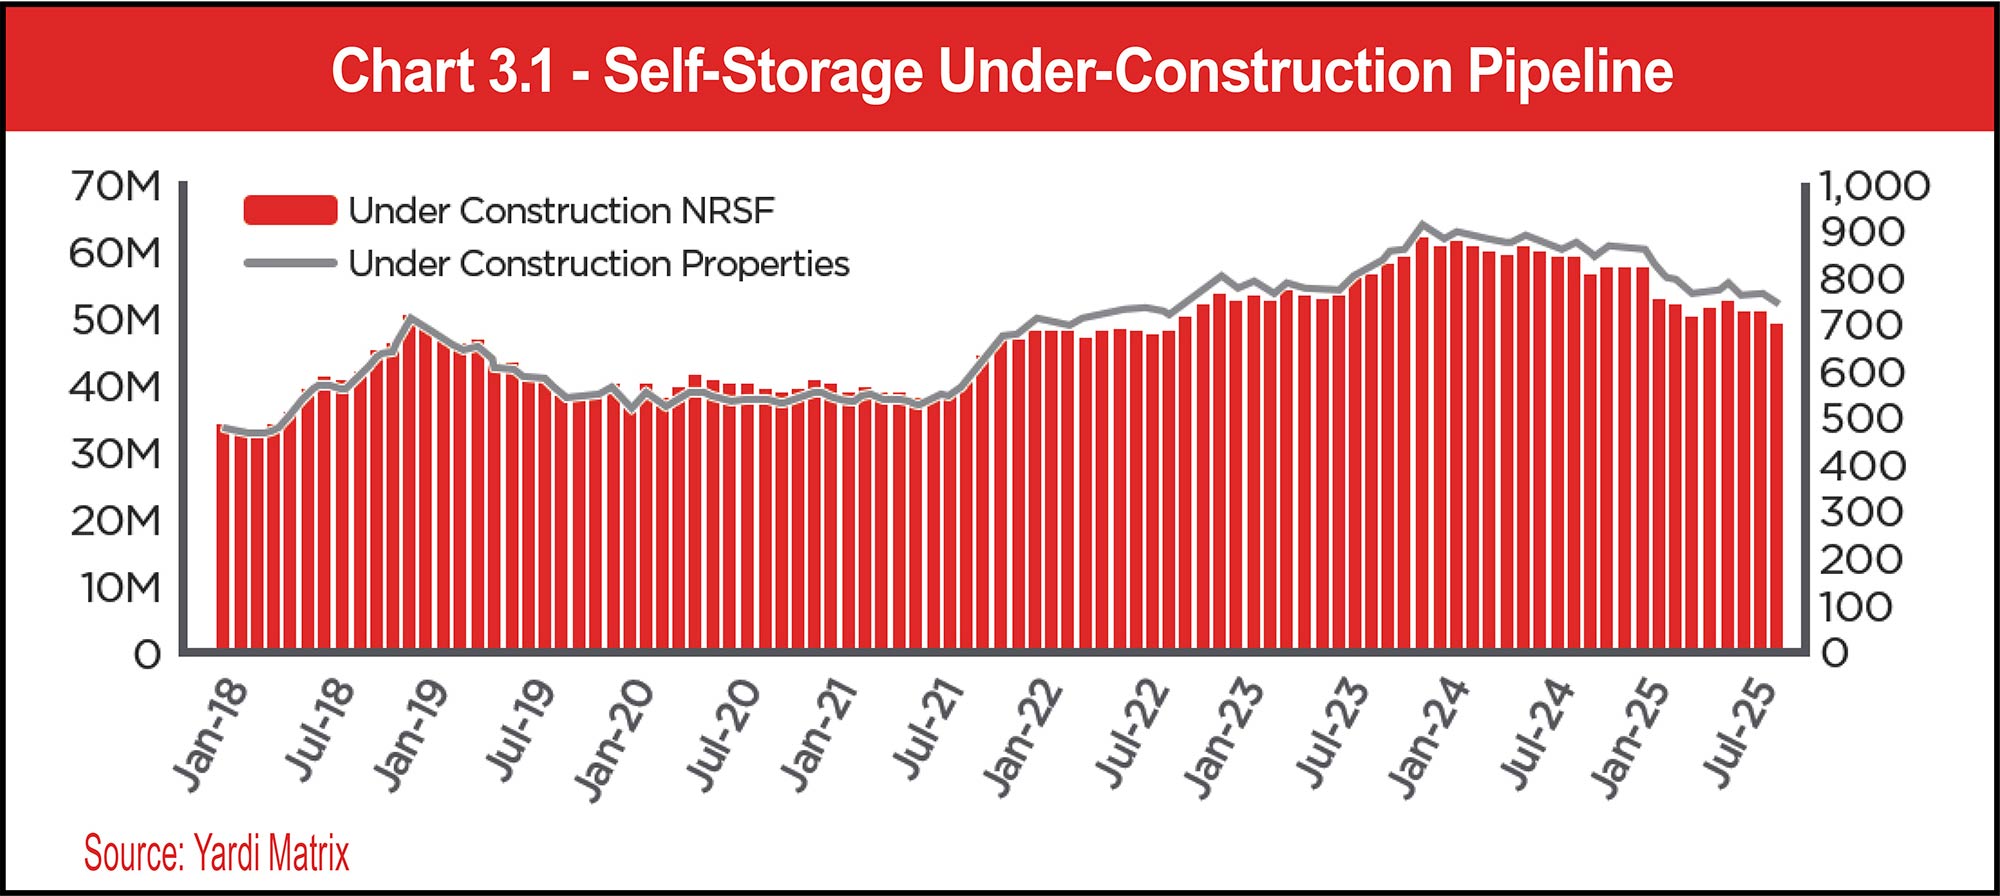
The overall shape of the forecast remains unchanged and continues to show a decline in new self-storage supply through 2027 and beyond. Construction starts have declined markedly from the 2023 peak, with 2025 year-to-date construction starts lagging behind 2024’s pace. This will continue to drive declines in the under-construction pipeline, which has to date declined 21 percent from the peak.
In September, national advertised rates tracked by Yardi Matrix increased on a year-over-year basis for the first time in three years. A return to sustained advertised rate growth would certainly help new development prospects. However, the relatively large amounts of new supply delivered in 2023 and 2024 will continue to limit rental rate growth over the near term. Should the combination of advertised rental rate growth and easing monetary policy drive a pickup in Q4 2025 construction starts, subsequent forecasts will be revised higher.
See Chart 3.1.
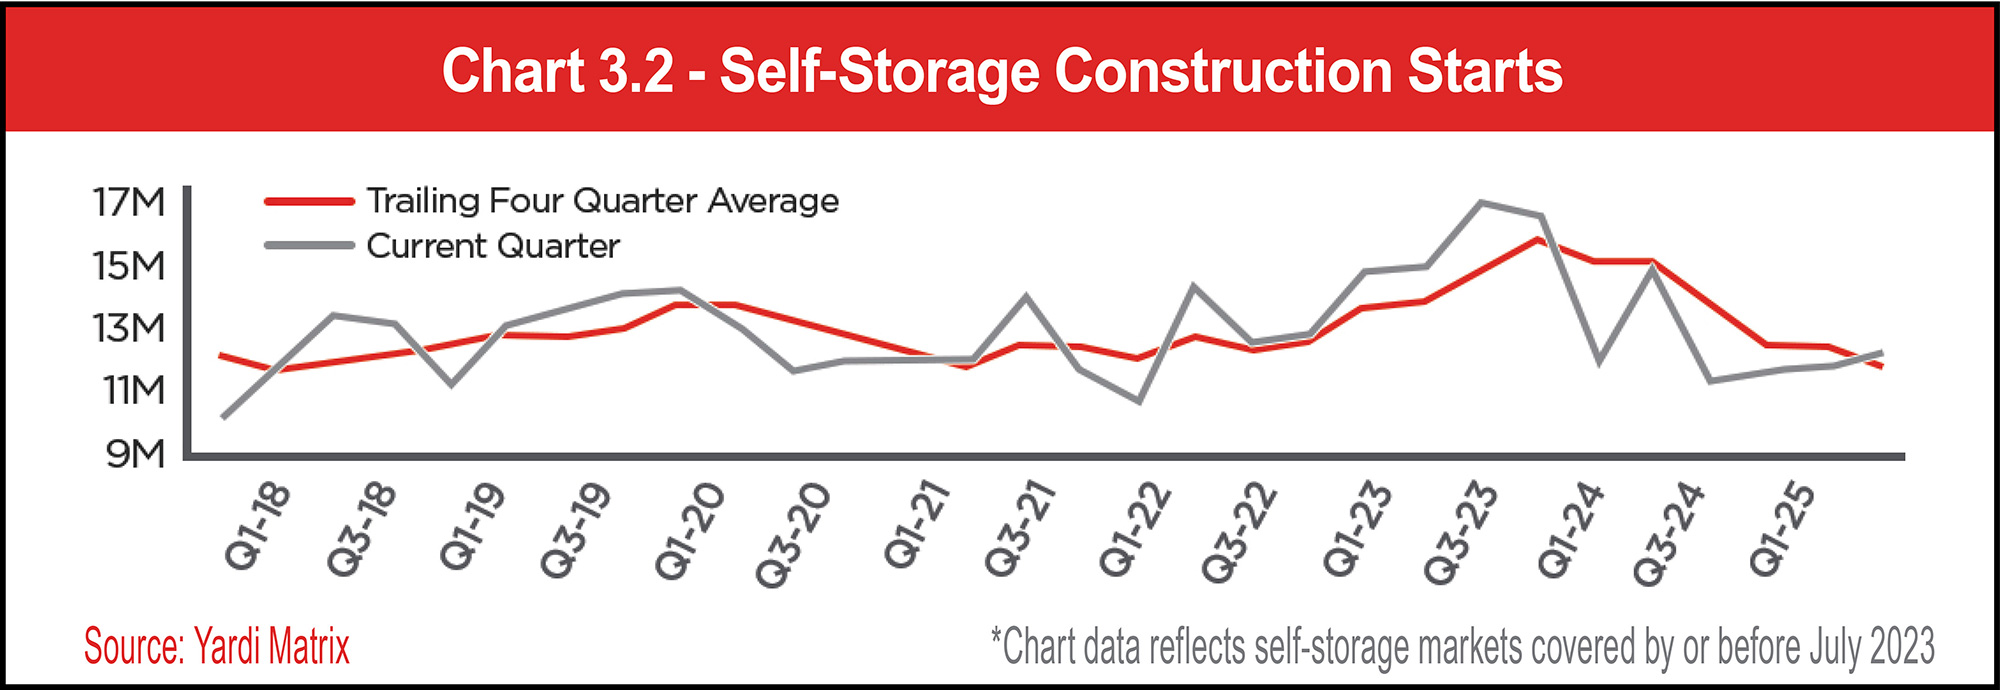
Through the end of September 2025, the Matrix research team had identified 31.54 million NRSF in new-construction starts, 7.8 percent below the level recorded over the same period in 2024. For all markets tracked by Matrix, 2024 construction starts totaled 52.21 million NRSF, declining 19.6 percent from 2023’s 64.96 million NRSF.
See Chart 3.2.
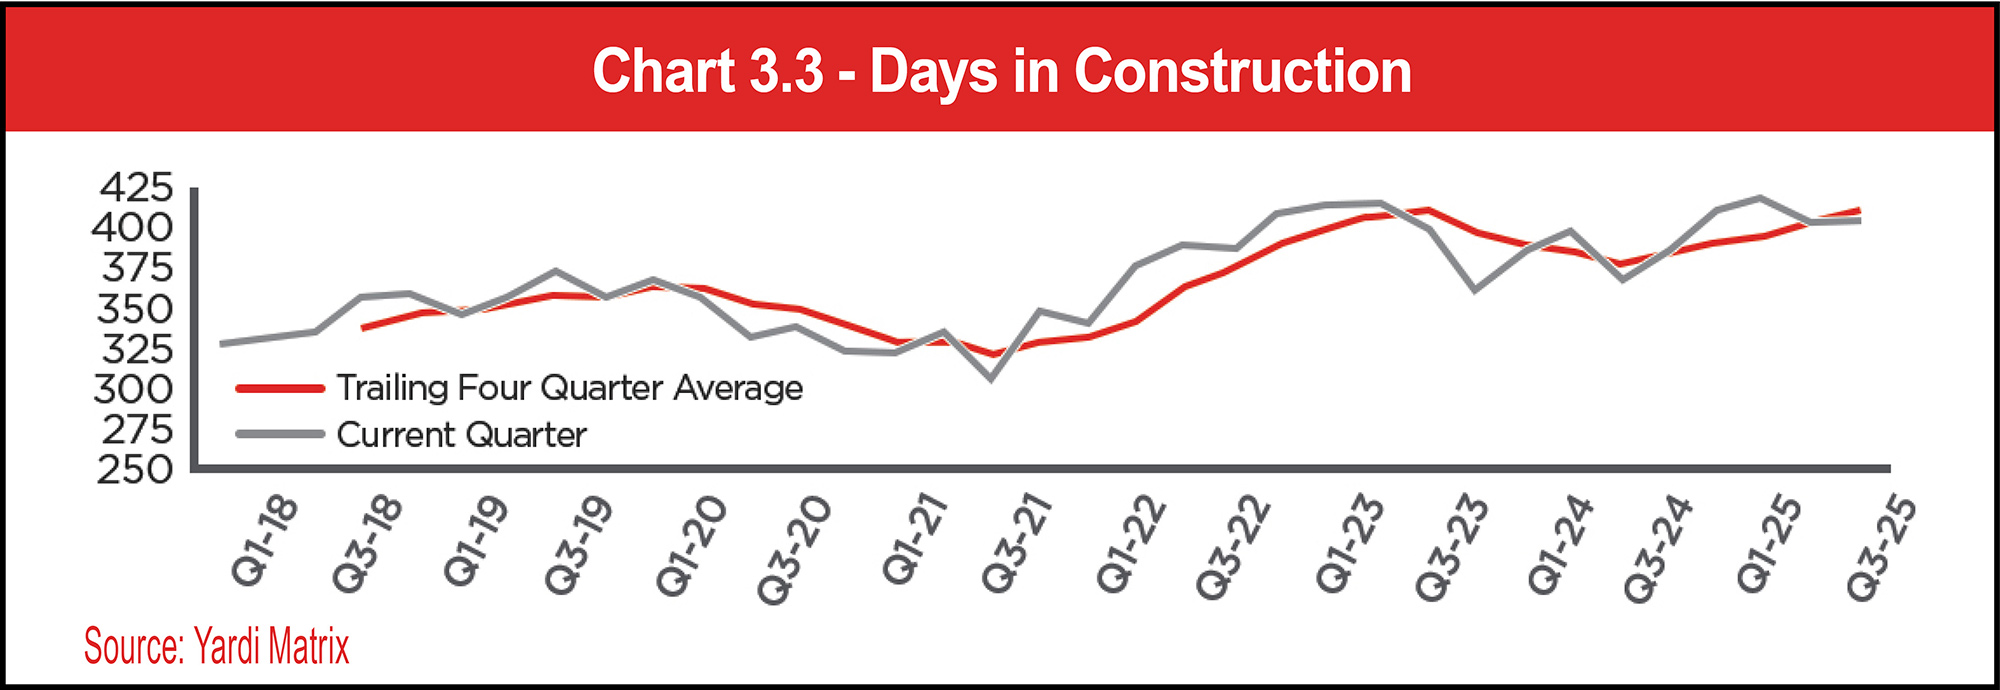
See Chart 3.3.
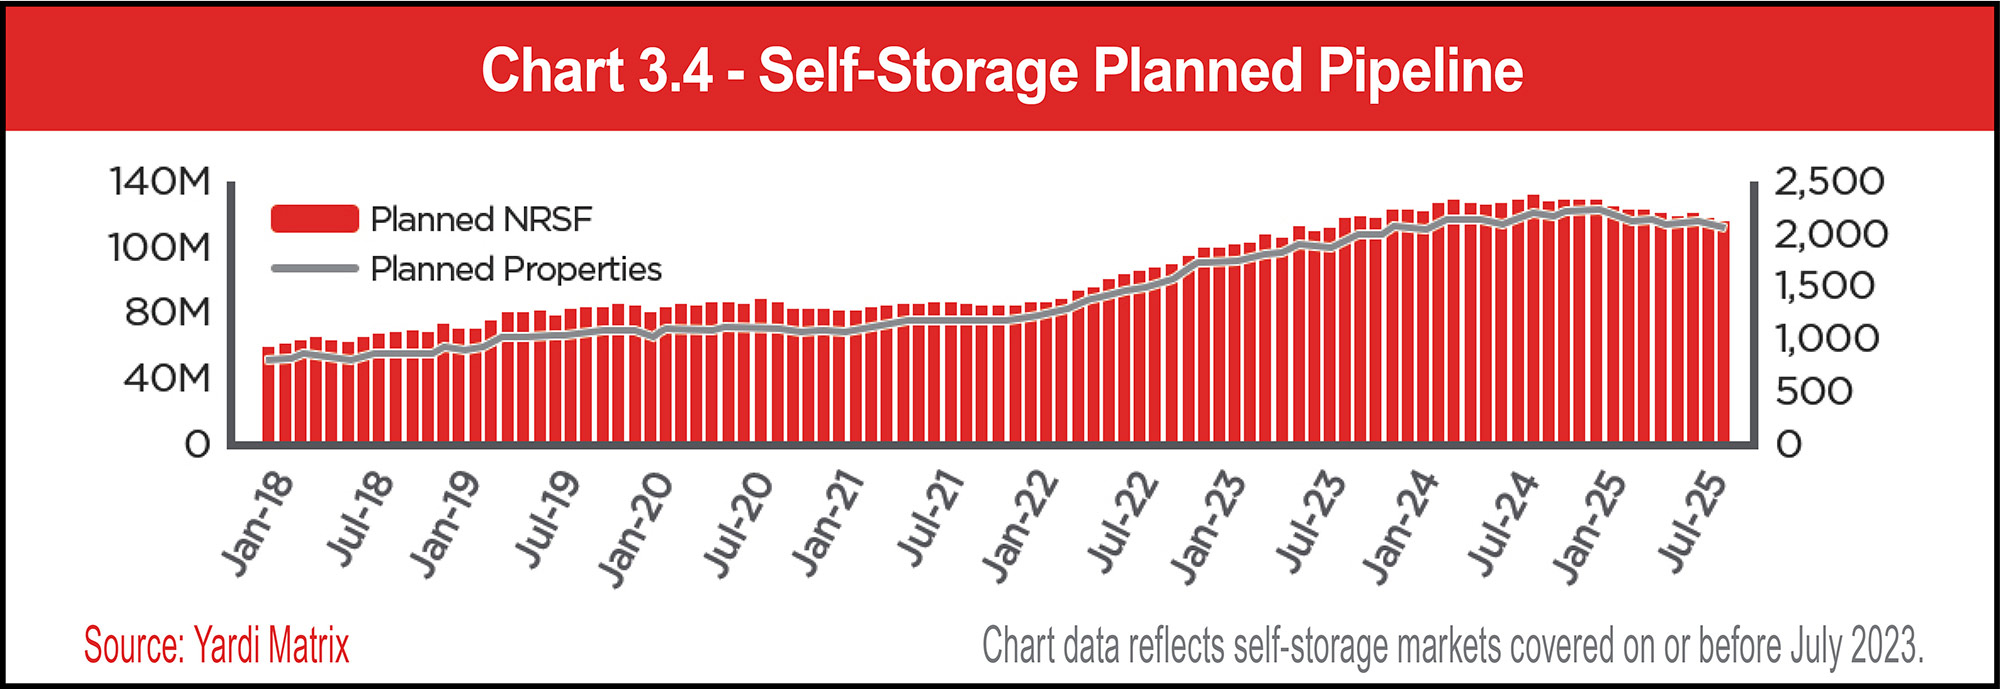
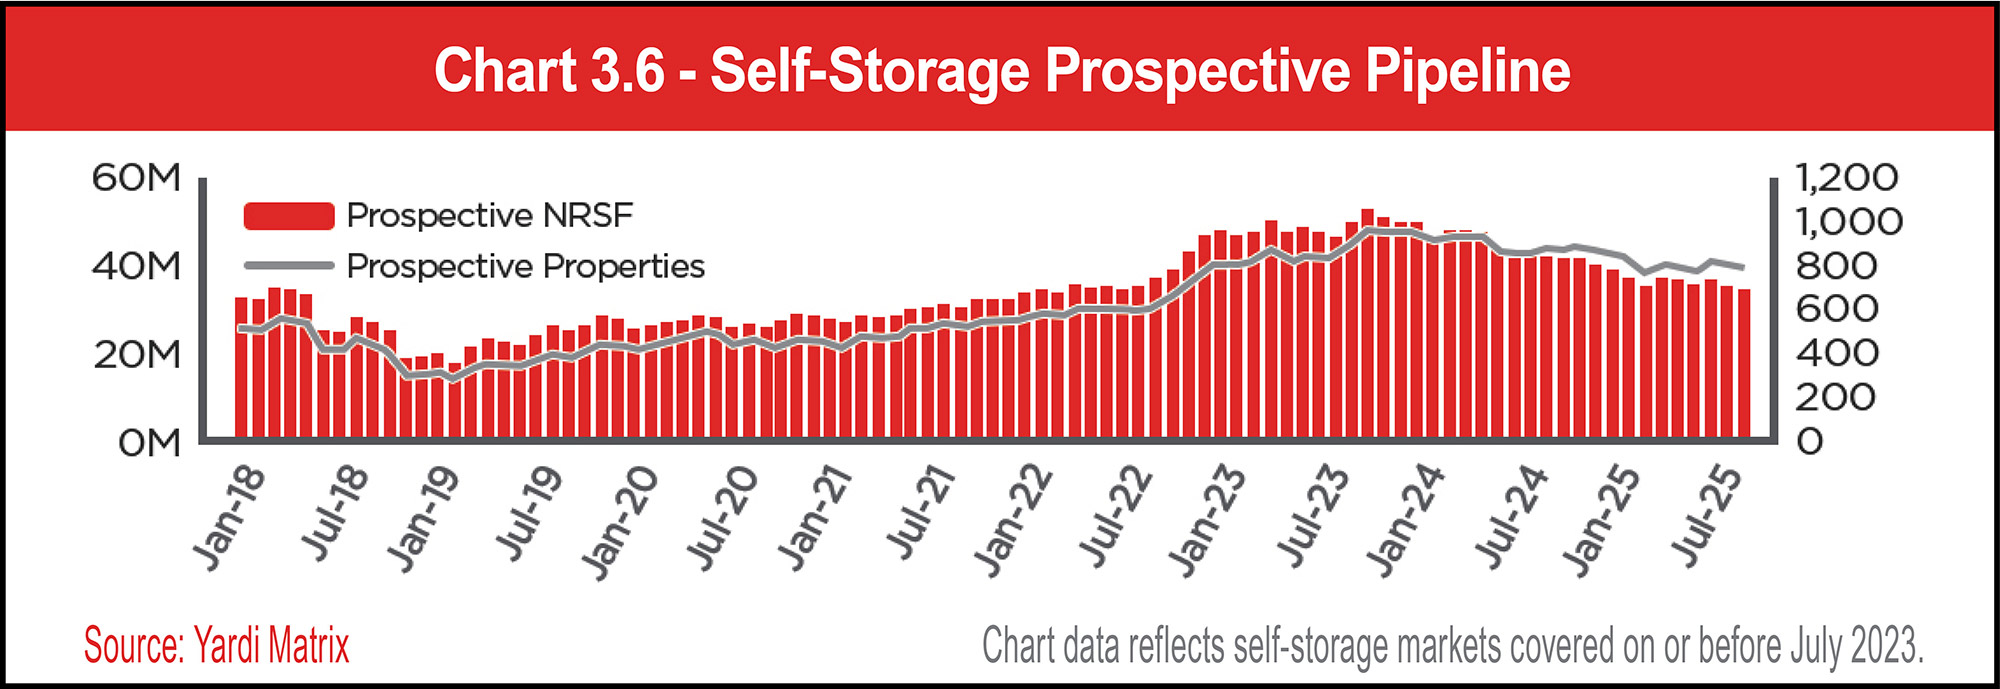
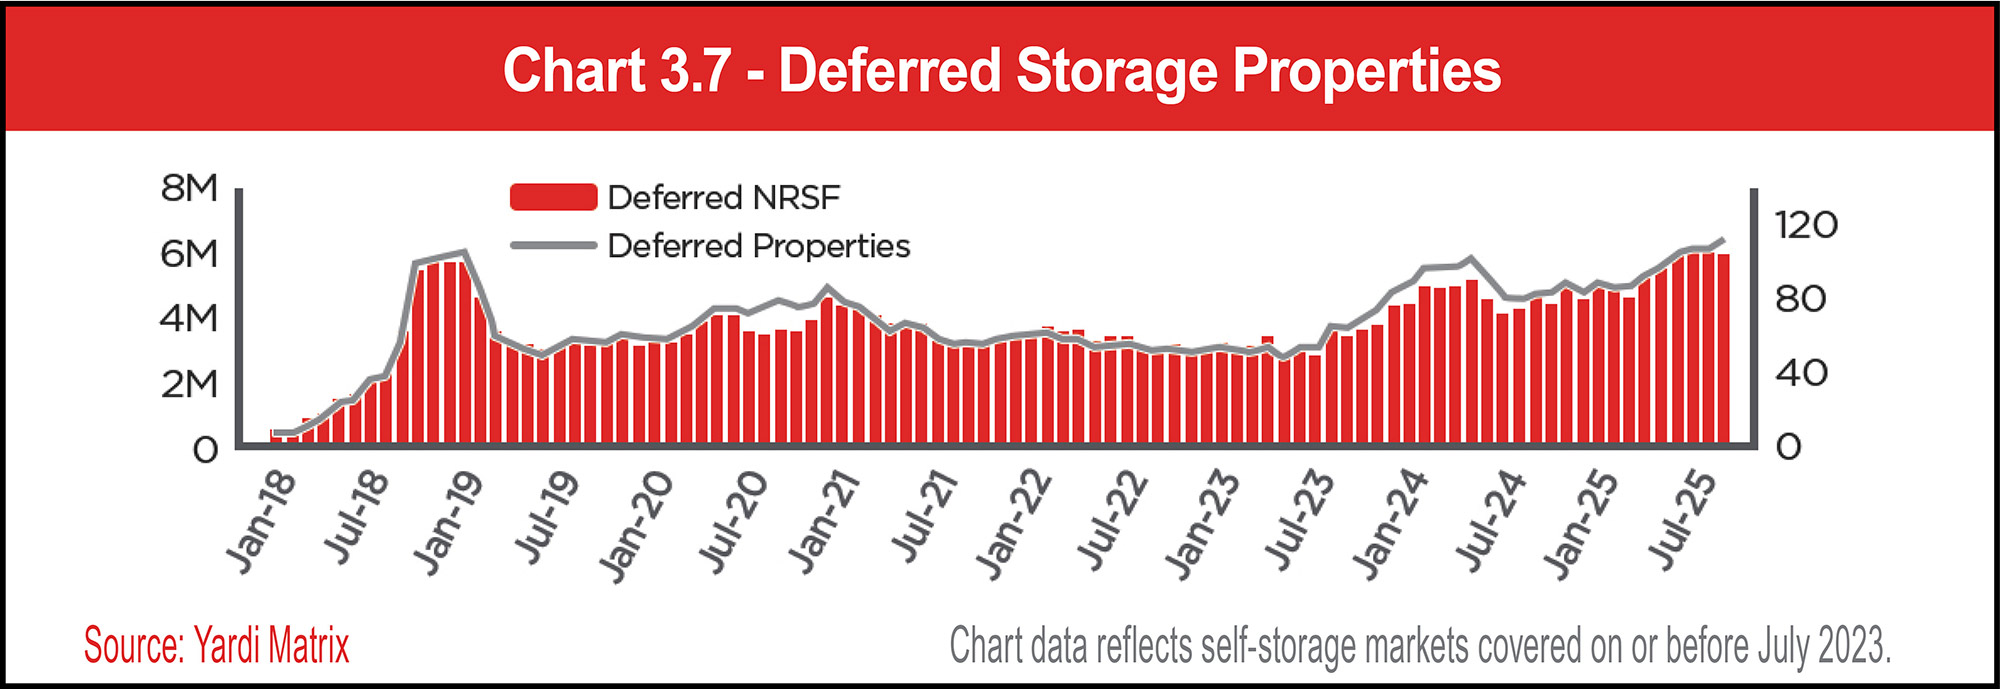
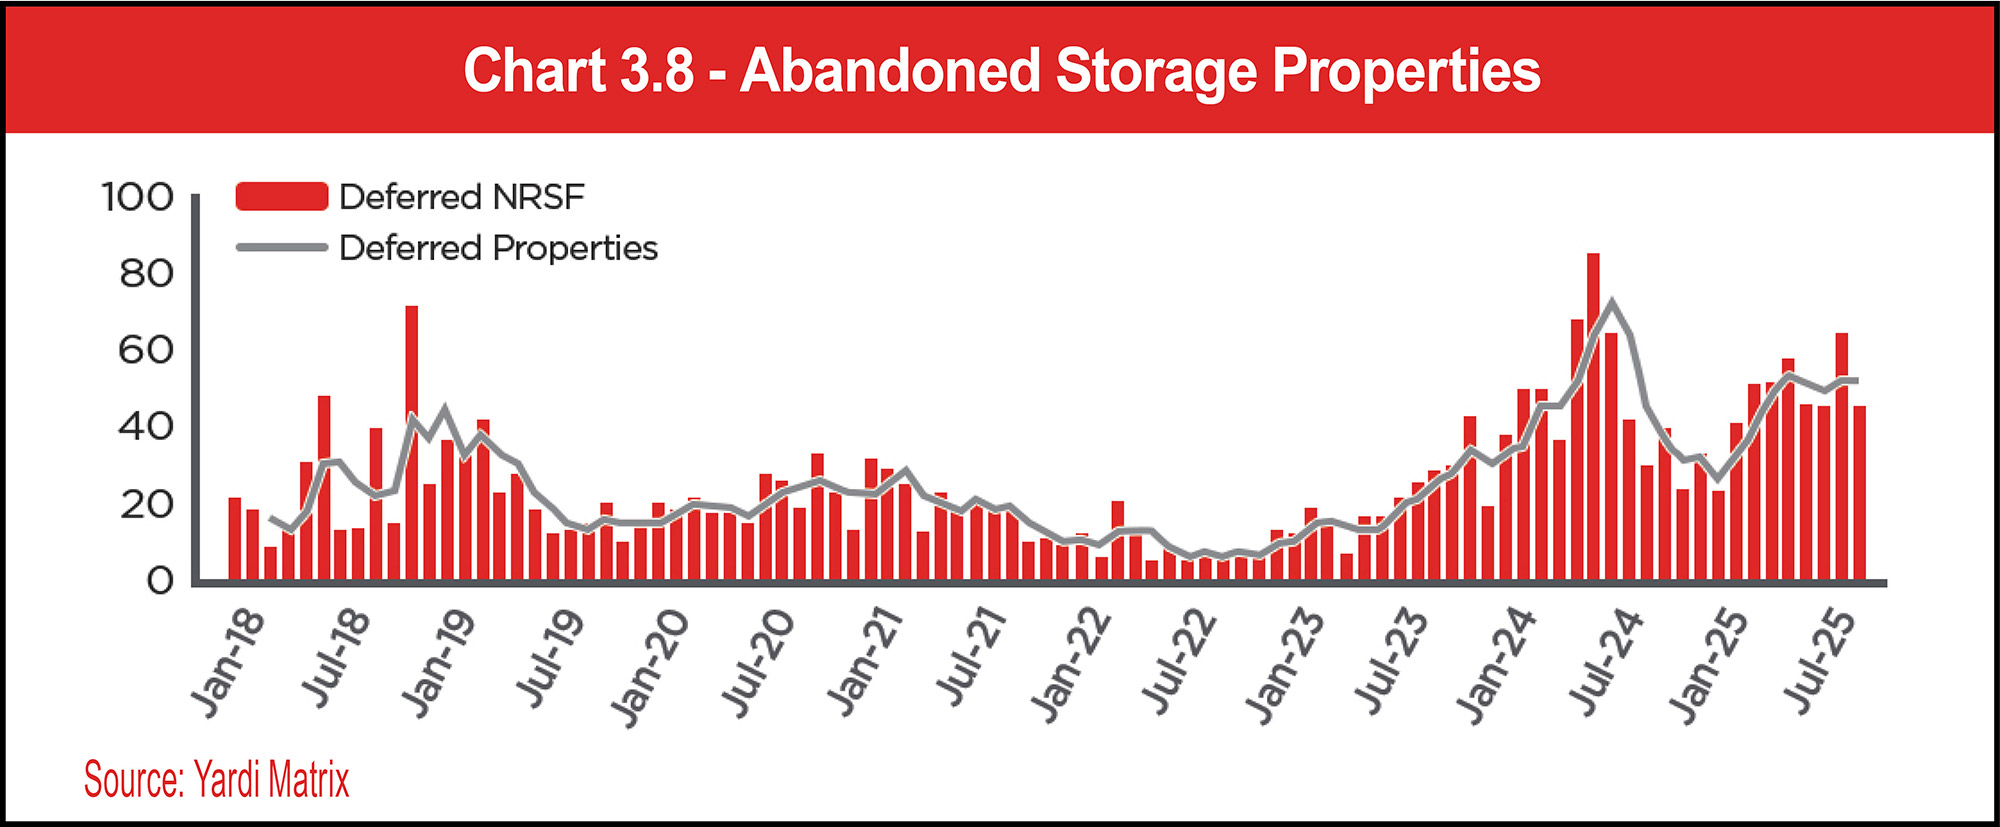
Weak operating results have translated into a noticeable decline in longer-term development interest. On a year-over-year basis, the planned pipeline has declined by 10 percent, while the prospective pipeline has declined by 18.8 percent and the deferred pipeline has grown by 33.3 percent. The monthly number of projects categorized as abandoned is currently averaging 52. In mid-2022, the average stood at seven projects per month.
Since the great financial crisis, the self-storage industry has experienced significant growth, and it is now a mature asset class. Absent new demand drivers, national self-storage supply growth in excess of 2.0 percent of stock likely exceeds long-term demand growth and leads to localized flat or negative rate growth. The Q4 forecast update therefore continues to model a decline in longer-term new self-storage supply to roughly 1.5 percent of stock in the later years of the forecast.
On the other hand, if September’s positive advertised rental rate growth turns into a durable trend that combines with easier monetary policy to drive a rebound in construction starts, our thesis for longer-term self-storage new supply will need to be revisited.
On a quarterly basis, the planned pipeline declined by 2.3 percent, while on a year-over-year basis it declined by 10.3 percent. The planned pipeline peaked in September 2024 at 131.65 million NRSF.
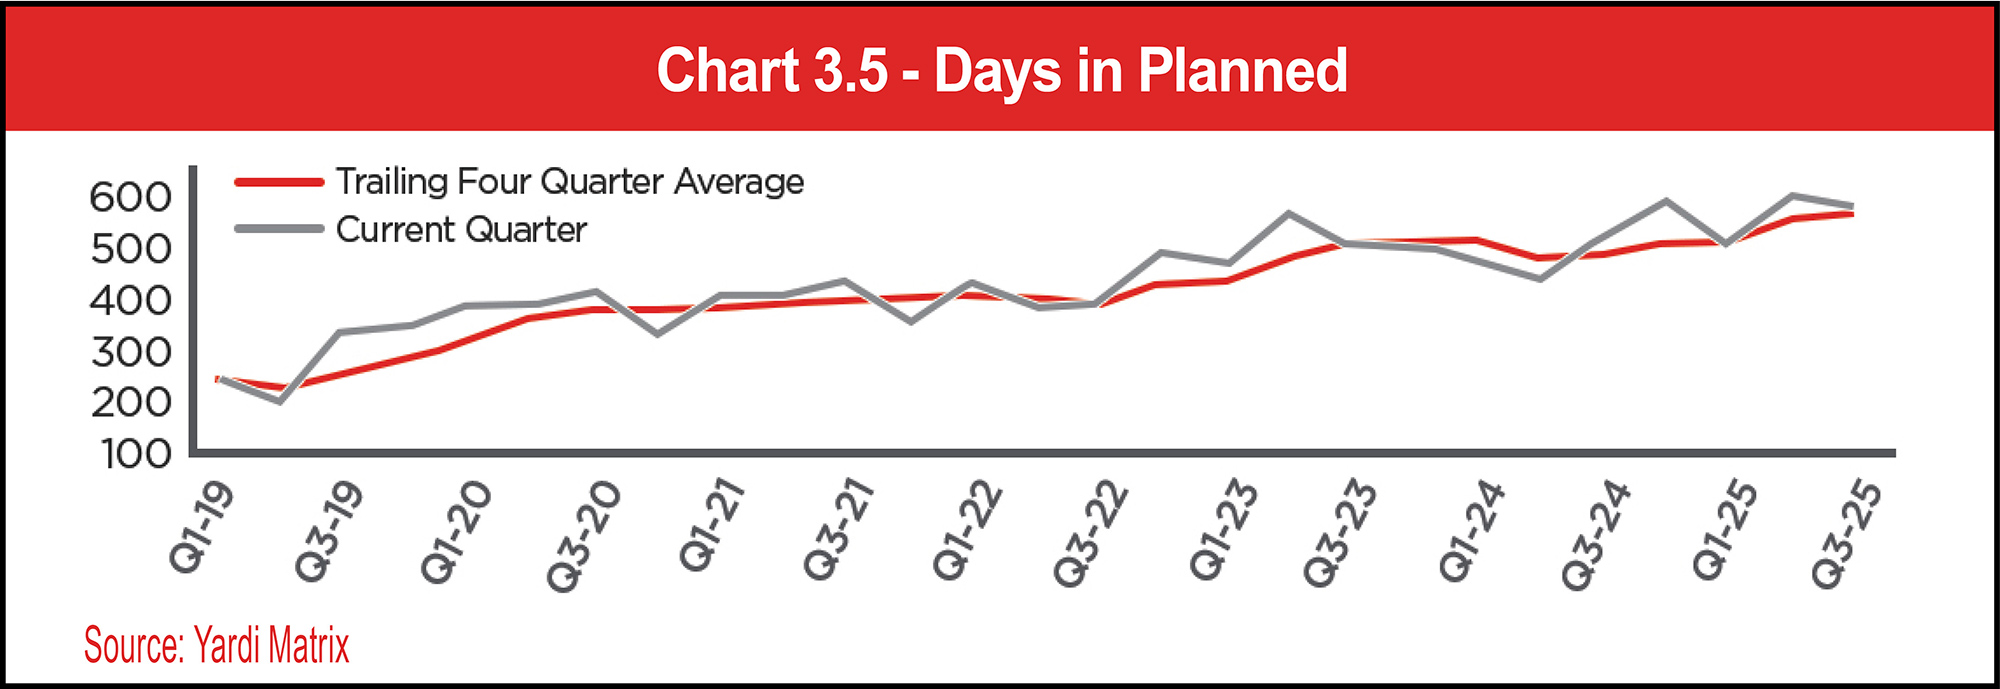
The current planned pipeline is approximately 2.4 times as large as the under-construction pipeline. Prior to 2024, the ratio held below 2.0. The planned pipeline has decreased at a slower rate than the under-construction pipeline over the past 18 months, as projects spend an increasing amount of time in planned status.
See Chart 3.4.
Days in planned, however, has been trending upwards over the past 18 months, with the trailing four-quarter average now sitting at 571 days (19 months). The increase in days planned observed in 2022 was most likely driven by labor and material scarcity as the development cycle ramped up. The current increase in days in planned is most likely driven by the weaker operating environment forcing projects to delay breaking ground.
See Chart 3.5.
The prospective pipeline peaked in October 2023 at 52.72 million NRSF and has since declined by 35.6 percent. The continued contraction in the prospective pipeline indicates that longer-term self-storage development interest has not yet bottomed.
See Chart 3.6.
The deferred pipeline bottomed in July 2023 at 2.77 million NRSF and has since increased by 121 percent. The continued large size of the deferred pipeline is another indication that long-term self-storage development interest remains weak.
See Chart 3.7.
See Chart 3.8.
However, the shape of the forecast has not changed. Matrix development pipeline data continues to show an overall deceleration in both near-term and long-term development interest. This was expected in previous forecasts; therefore, the remaining years are unchanged.
New supply delivered in recent years has put downward pressure on rates and occupancy, which has suppressed new-development interest. The forecast assumes construction starts and the under-construction pipeline continue to decline, driving decreases in new supply for 2026 and 2027.
Longer-term development interest also remains weak. Both the planned and prospective pipelines are contracting, while the number of deferred and abandoned projects remains well above cycle lows. As a result, the Q4 forecast update continues to assume new supply for the later years will decline on an annual basis to roughly 1.5 percent of existing stock.
September’s positive year-over-year growth in advertised rental rates reduces forecast certainty. A return to sustained rate growth could potentially drive increased new development interest. Should this prove to be the case, subsequent forecast updates will be revised higher.
As always, Yardi Matrix is extremely focused on accurately maintaining our development pipeline data and identifying any changes in self-storage development activity.