


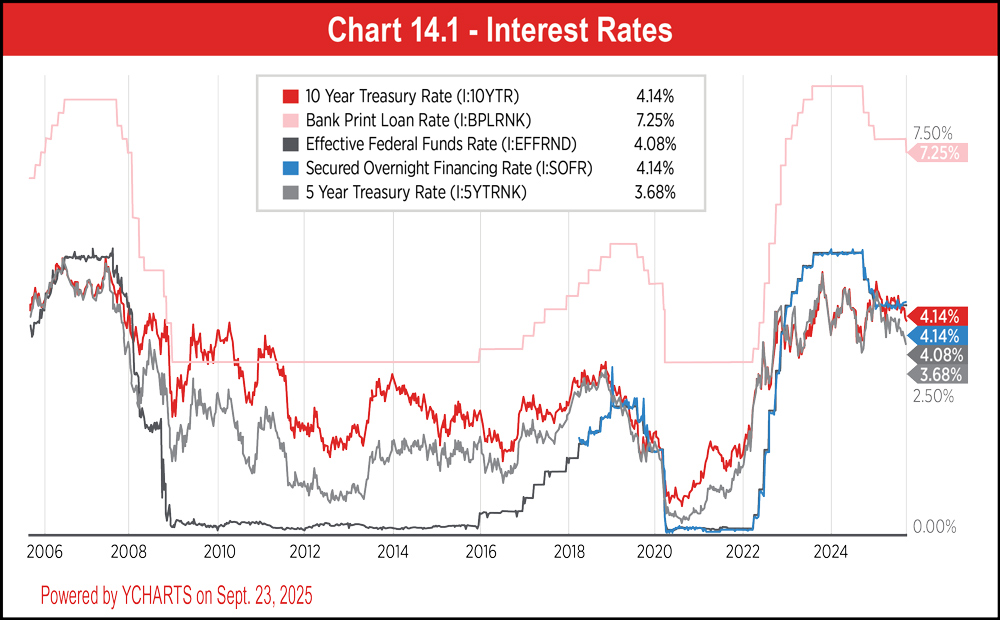
nother year in review for self-storage financing highlights challenges and opportunities alike for the year ahead. Interest rates in 2025 were more favorable than 2024, with room for improvement throughout 2026. Many attractive financing options exist for self-storage borrowers despite key economic benchmarks like unemployment and inflation, alongside geopolitical risks in the Middle East and elsewhere acting as notable drivers of volatility. While today’s interest rates are higher than the immediate post-pandemic era, that was largely an anomaly. Currently, short-term debt options (three to seven years) provide arguably the best balance of attractive rates and future flexibility. Additionally, a host of products are available across the lending spectrum ranging in structural terms and duration to meet borrower’s needs. For context on interest rate movement, an overview of the Federal Reserve’s Federal Funds Target Rate follows.
The Fed’s target rate is the overnight rate at which banks lend reserves to one another on an overnight basis; broader borrowing rates move in response to changes in this benchmark. After the Great Financial Crisis (GFC), the Fed held the rate near zero until a modest hike in late 2015, followed by a gradual hike cycle that peaked in 2018. Rates were cut three times in 2019, then slashed back to a near-zero level in March 2020 at the onset of COVID.
Beginning in 2022, the Fed launched its fastest tightening cycle since the 1980s to combat inflation, hiking rates 525 basis points between 2022 and 2023. After peaking in mid-5 percent territory post-pandemic, rates were trimmed three times in 2024 and again at the meeting in September 2025. While there are challenges associated with both prongs of the Fed’s dual mandate of low inflation and full employment, they signaled two more quarter point cuts by year end. This is a positive sign for borrowers that points toward more attractive borrowing costs on the horizon.
Key lending benchmarks such as SOFR and the Wall Street Journal Prime Rate move closely in lockstep with the fed funds rate and are primarily used to price floating-rate loans. Treasury yields and others, which fluctuate constantly, are the more standard indices of choice for fixed-rate debt.
For simplicity’s sake, treasury rates offer perhaps the best snapshot of current conditions; these rates have retreated considerably recently. At the time of this writing, the three-, five-, and 10-year Treasuries stand at 3.57 percent, 3.69 percent, and 4.15 percent, respectively, down significantly from recent high April 2024 levels of 4.85 percent, 4.70 percent, and 4.60 percent. The yield curve “un-inverted” in August 2024, marking the first time in more than two years that long-term borrowing rates exceeded short-term rates.
As storage borrowers weigh their options in 2026, it is helpful to understand the suite of loan products available in the market as well as best practices to ensure smooth executions. Both new and seasoned borrowers should find the following takeaways helpful as they look to transact in the new year.
From a sponsorship standpoint, the full list is more exhaustive than what is listed in this section. However, focusing on the core items that make up a sponsorship package is most sensible. A sponsor should plan to compile a Schedule of Real Estate Owned, a Personal Financial Statement, three years personal tax returns, and a bio detailing experience with an emphasis on self-storage (if applicable). Furthermore, borrowers should be giving thought to the organizational chart or how the borrowing entity will be structured and funded.
Turning to property-level diligence, the following encompasses a number of “must-haves” that will assist a lender in reviewing a prospective deal:
- Operating financials for three years,
- Trailing 12-month financials,
- Occupancy reports,
- Management summary report,
- Current real Estate tax bill, and
- Forward budget (two years).
The clear exception to that list is construction loan requests where historical financials are not available; operating projections for five years are critical in those cases. It is best to have the management company of choice prepare projections, as that is the best lens through which to gauge financing viability.
A host of third-party reports and costs come along with any deal, though they are difficult to pinpoint ahead of time. There are pros and cons to different loans from a cost standpoint, but borrowers should be aware of and budget for items like legal, title, appraisals, surveys, origination fees associated with a new loan, as well as any prepayment penalties in a refinance situation.




The value of sponsor equity is calculated by subtracting the value of higher priority positions from the asset’s market value. This is more straightforward for stabilized assets than for non-stabilized or development deals. Total equity in an asset is important to a lender, and there is a balance between debt and equity which varies across the lifecycle of an asset. A borrower with little or no equity in a property may have different interests than one with ample equity, especially in a lender’s eyes. Different loan products affect how the capital stack materializes. To understand what loan product is ideal, the logical next step is to review loan sizing parameters.
- LTV = Loan amount divided by appraised value
- DSCR = Net operating income (NOI) divided by annual debt service
- DY = NOI divided by loan amount
Lenders consider these in tandem to determine how much debt a property can support. Each offers a different lens on credit risk and repayment capacity, but they are interconnected in a balanced equation between borrower demand and lendable terms.
LTV links the loan amount to the collateral’s appraised market value. It serves as the first line of defense, ensuring that even in the event of default or failure to repay, there is sufficient value to protect lender principal. While the exact threshold depends on the deal, lenders are commonly extending credit between 55 percent and 75 percent LTV.
DSCR connects loan sizing back to cash flow and this metric grows (holding debt service constant) as cash flow (NOI) grows. A minimum DSCR, often 1.15x (x indicates how many times a property’s NOI covers its annual debt payments) to 1.30x, ensures there is a cushion between available NOI and loan payments. This is a check and balance on leverage by measuring a property’s ability to generate recurring income, not just its appraised value.
Debt Yield adds a third, increasingly important dimension. This expresses the lender’s return on cost if the lender were to foreclose on day one. For example, a 10 percent debt yield on a $10 million loan means the NOI is $1 million. Framed another way, if a lender requires a certain debt yield, you can divide cash flow by that DY percentage to arrive at feasible loan dollars. Unlike DSCR, debt yield is independent of interest rates or amortization schedules, marking a purer measure of risk unimpacted by amortizations or interest rates.
These metrics act as interwoven guardrails. Debt yield places a floor under credit quality by preventing overly aggressive leverage, DSCR ensures cash flow can service debt comfortably, and LTV caps exposure relative to market value. In practice, whichever test produces the lowest loan proceeds sets maximum financing. Today, proceeds are commonly constrained by DSCR or even Debt Yield hurdles before LTV hurdles, given the rate environment. For example, an asset with a $10 million valuation may not be eligible for a $7.5 million loan (75 percent LTV) if the in-place cash flow yields below certain DSCR thresholds.
The interplay is dynamic: In high cap rate markets, the LTV test may constrain proceeds, while in lower yield, core markets, the debt yield or DSCR test often dominates. Lenders evaluate all three, not in isolation but as a group, to align credit risk with both asset performance and market conditions.
Today, oversupply in some markets, rent volatility, and tighter credit have made construction financing harder to secure for new development. Rising interest rates have amplified scrutiny, with most loans structured as lower leverage, floating-rate debt. This trend persisted in 2025 and is likely to continue in 2026 and beyond.
Banks remain the primary capital source for development projects, supplemented by SBA programs and some debt fund lenders. Life companies may selectively engage in development financing, but CMBS (discussed below) is not a construction product and is only applicable on cash-flowing assets. Because projects generate no cash flow during construction and require time to stabilize after receiving Certificate of Occupancy, lenders focus on sponsors with proven track records, strong balance sheets, and depository relationships.
Historically, conventional lenders could advance up to 75 percent loan to cost, but the persistence of higher interest rates has constrained leverage as lenders struggle to make deals pencil. Floating-rate structures tied to Treasuries, SOFR, or Prime are now most common, with pricing from roughly high-6 percent to well above Prime, depending on the loan product and risk profile.
Construction loans typically require full recourse and a completion guarantee, though limited recourse may be possible for highly qualified sponsors at lower leverage. Borrowers should negotiate for an interest-only period and interest carry reserves to cover lease-up, as underestimating stabilization timing is among the costliest financing mistakes.
Lenders also impose debt service coverage tests, stress testing both interest-only and amortizing debt post-completion. Careful feasibility, budgeting, and analysis of rents, competition, and absorption are essential before breaking ground. Many of the loan products discussed within this section are applicable for construction, but those are often different structures than what is available for stabilized storage assets within that lending category.
Because bridge loans target non-stabilized assets, the underwriting is generally forward-looking. In contrast to permanent lenders who are focused on in-place DSCR, bridge lenders work carefully to understand the proposed exit DSCR metric to inform their lending. Bridge underwriting has moved away from trended rent projections in light of recent rental rate volatility. Put another way, lenders are not buying into double-digit rent growth to support a transaction. Instead, they will apply a stabilized vacancy to in-place rents or moderate rent growth over the loan term.
Many bridge loans require reserves for interest shortfalls, future funding components, or cross-collateralization with other assets for added credit enhancement. A bridge loan is not an appropriate long-term debt solution; however, it can be a flexible interim financing option. Even if interest rates continue to fall in the coming year, there is no doubt bridge loans will remain an important source of capital for the storage industry.
LifeCo loans were historically in play for larger loans ($10 million or more) on a selective basis, but the appetite for storage has increased as a need arose to fill allocations in lieu of other struggling property sectors. While there are exceptions to every rule, the following is a list of typical LifeCo deal characteristics:
- Loan Type – Permanent, fixed-rate mortgages
- Terms – Five to 25 years, often with amortization up to 30 years. Limited interest-only periods available.
- Size – Generally, $10 million and larger, though select lenders will go smaller
- Leverage – 50 percent to 65 percent LTV; higher leverage uncommon
- DSCR – Minimum 1.40x or better
- Pricing – Competitive spreads over Treasuries or Swaps, currently 150 to 225 bps
- Recourse – Non-recourse with standard carveouts typical
- Prepayment – Yield maintenance or defeasance, some may offer step-down
LifeCo lenders stress cash flow and cap rates, in addition to mandating higher going in DSCRs. It is no surprise these loans are frequently constrained at lower leverage than their counterparts. That said, they currently offer the most competitive interest rates in the market, starting at just over 5 percent. They also offer a myriad of flexible structures across interest rate, prepayment, amortization, earn-outs, recourse, and even the willingness to lend on construction or bridge for the right opportunity. These products are cost-effective to close, and borrowers can often take advantage of forward rate lock provisions with a signed application.
Life Company loans are a fantastic source of capital if the deal meets their credit criteria. While these loans are typically reserved for highly experienced, well-capitalized sponsors on the best of the best storage assets, borrowers don’t have to shy away from exploring the product. Especially in light of the tremendous track record of self-storage against other property types, insurance lenders continue to exhibit an increased appetite for self-storage loans.
Adding a spread (risk premium) to a benchmark such as the U.S. Treasury is how CMBS rates are calculated. For instance, a 185-basis-point spread on the 10-year Treasury at 4.15 percent would result in a 6.0 percent all-in rate. There is a slight spread advantage for the 10-year product, however the 10-year index is higher than the five-year treasury index which equalizes rates to some extent. Spreads range roughly 150 to 250 basis points across the five- and 10-year products, with the option to “buy down” rates for a fee (roughly 14 bps reduction per 1 percent fee on a 10-year term, or 24 bps on a five-year term). Leverage, once available as high as 75 percent, is now constrained by debt service coverage ratios as elevated rates limit loan proceeds.
The restrictive prepayment structures of yield maintenance or defeasance are noted disadvantages of the CMBS product. Defeasance requires replacing loan collateral with securities to cover debt service, a potentially costly and time-consuming process that specialized firms help effectuate. That said, these penalties are less onerous in a rising-rate environment, making today’s conditions favorable for refinancing vintage CMBS debt.
Borrowers should also account for higher closing costs and rigid loan documents. Standard securitization requires uniform terms and third-party servicing, making post-closing modifications difficult. Still, some lenders offer competitive small-balance programs with capped closing costs for loans up to $10 million. Furthermore, despite the fast closing associated with CMBS, it is noteworthy that CMBS does not feature a rate lock option, thus borrowers are subject to market rate movement from application to closing.
Although lenders prefer primary markets, they will compete in secondary locations as well. Pricing is influenced by both market and property-level factors. The non-recourse nature, interest-only flexibility, and cash-out potential keep CMBS top of mind for borrowers. As rates stabilize or decline, CMBS will continue to be a fantastic option in the market for self-storage borrowers.
Bank interest rates vary widely based on loan size, leverage, risk profile, and existing borrower relationship or lack thereof. Banks can present extremely compelling quotes for transactions that fit their credit box. Loans may be tied to Treasuries, SOFR, Prime, or others, rendering bank lenders among the most variable in pricing structures. Banks and credit unions can offer fixed or floating rates, with the ability to lock rate at application for some fixed rate executions. At the time of this writing, current pricing ranges from high-5 percent to well over 8 percent.
Bank terms start around two years and span 10-plus years, often accompanied by tighter amortization schedules of 20 or 25 years. Despite historically being able to offer as high as 80 percent leverage, today it is rare for banks to comfortably exceed 75 percent given DSCR constraints. Personal guarantees are fairly standard, though stronger sponsors or low-leverage deals may qualify for limited or non-recourse. Closing costs are more favorable than CMBS or SBA, and prepayment structures also vary and are often negotiable.
Credit unions continue to play an important role for self-storage in this elevated interest rate environment. While banks prioritize long-term relationships, credit unions often take a more transactional approach, lending outside their footprint and typically without deposits. Certain credit unions offer more compelling rates than bank competitors, in part due to their tax status, allowing them to pass savings on to customers.
The SBA usually caps exposure at $5 million per borrower based on total guaranteed dollars. The 7(a) program typically maxes out at this level, while the 504 program, structured as a bank first mortgage (50 percent) and a CDC/SBA second mortgage (up to 40 percent), can support larger transactions, given the bank piece has upward mobility.
SBA loans are priced over the Wall Street Journal Prime rate. When Prime hovered around 3 percent in the pandemic era, these offerings were highly competitive. However, when Prime peaked at 8.5 percent in 2023, floating-rate borrowers felt pressure as they watched their all-in rate move up as much as 5 percent from the time of origination. As of Sept. 18, 2025, the Prime rate has trended down to its current level of 7.25 percent, which has improved the prospects of SBA financing noticeably from the peak. SBA pricing on the 7(a) program, and the bank portion of a 504 loan, are typically quoted between 0 percent to 2 percent over Prime.
504 loans feature a fixed-rate debenture (currently 6.0 percent for 25 years), which, in tandem with a fixed- or floating-rate bank piece, creates a blended all-in rate between the bank and SBA tranches that is lower than a 7(a) rate. 504 loans provide longer-term rate stability but carry steeper prepayment penalties and longer closing timelines.
7(a) loans are generally floating-rate products tied to Prime, with 20- to 25-year amortization and a 5 percent-3 percent-1 percent prepayment schedule, which is a more favorable prepayment structure than the 504. They are also more flexible, allowing proceeds to cover working capital, interest shortfalls, or business expenses in addition to real estate. One notable challenge of the 7(a) program is the additional collateral requirement in an undercollateralized loan scenario. In other words, lenders may take a lien on ancillary business or personal assets in addition to the subject. Furthermore, 7(a) typically includes higher guarantee fees per dollar loaned compared to the 504 program.
Key differences include:
- Structure – 504 uses a two-loan structure; 7(a) is a single loan.
- Proceeds – 504 often supports larger deals; 7(a) caps at $5 million (with exceptions).
- Use of funds – 504 limited to real estate; 7(a) allows broader uses such as working capital.
- Rates – 504 program at least partially fixed; 7(a) usually floating (with some fixed options).
- Prepayment – 7(a) is generally more borrower friendly.
Both programs involve heavier transaction costs and documentation than conventional loans, including a longer closing time frame than conventional closings. Still, SBA loans remain an especially valuable option for capital-constrained or first-time storage investors in 2026 looking for outsized leverage.
However, many projects financed over the past five years relied on projections that failed to materialize. Rising interest rates, construction delays, higher costs, and softer rental rates have left some borrowers struggling to meet loan payments or covenant requirements. Even stabilized assets have faced income declines, which is making debt service coverage more challenging.
Subordinate debt refers to financing that sits behind the first lien mortgage in repayment priority. By extending leverage beyond the first mortgage cutoff, subordinate lenders can push total proceeds to 85 percent LTV or even higher. Because they assume greater risk, they demand higher returns. In fact, current rates generally range from 10 percent to 20 percent. These loans are often structured with features such as multi-year or full-term interest-only payments aligned to projected cash flow.
The two most common forms of subordinate debt are broadly characterized as follows:
- B-Notes – Junior mortgages secured by the property.
- Mezzanine loans – Secured by an ownership interest in the borrowing entity rather than the property itself.
When cash flow declines to the point where debt service cannot be met, or values have fallen enough to wipe out equity entirely, fresh capital may be required. Sponsors with ample liquidity may inject new equity, while others may seek joint venture partners. JV equity is typically reserved for transactions with clear upside, such as redevelopment, recapitalization, or repositioning, that can generate enhanced cash flow and value over time. In an ideal world, an asset will not require subordinate debt. That said, it is helpful to understand the options as outlined above in the event it becomes necessary.
Though brokers charge for their services, they streamline the loan process and free borrowers to focus on growth strategies, such as acquisitions or expansions, ultimately adding more value than the time and effort saved.
On the other side of the coin, debt markets are liquid and hungry for self-storage products to lend on. A significant amount of debt will mature in 2026, and a home exists for most deals at an appropriate level. Storage fundamentals, despite some recent choppiness, remain extremely sound, especially compared to other assets.
There remains room for improvement in both the underlying interest rate indices and credit spreads to bring on more favorable financing in the coming year. Even modest declines in borrowing costs will have a positive ripple effect on transaction markets. Self-storage borrowers can look at 2026 as a year that should continue to foster growth in a truly remarkable industry.