


aking a closer look at industry ownership, only data from TractIQ and MSM’s 2025 Top Operator’s list were used for this section.
In analyzing ownership data among the top 100 operators, we look at four groups:
- Real estate investment trusts,
- Other Top Operators with portfolios of both properties owned and managed,
- Other Top Operators whose portfolios only include properties they own, and
- Other Top Operators whose portfolios only include properties they manage.
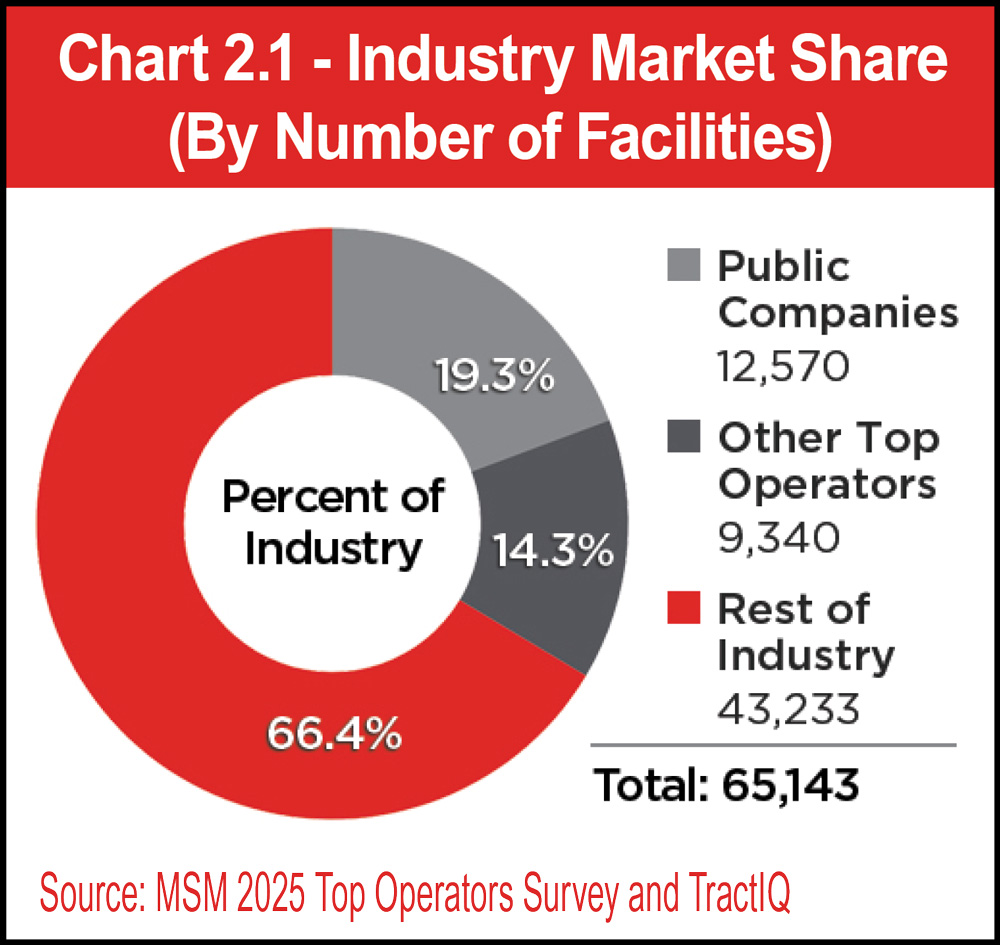
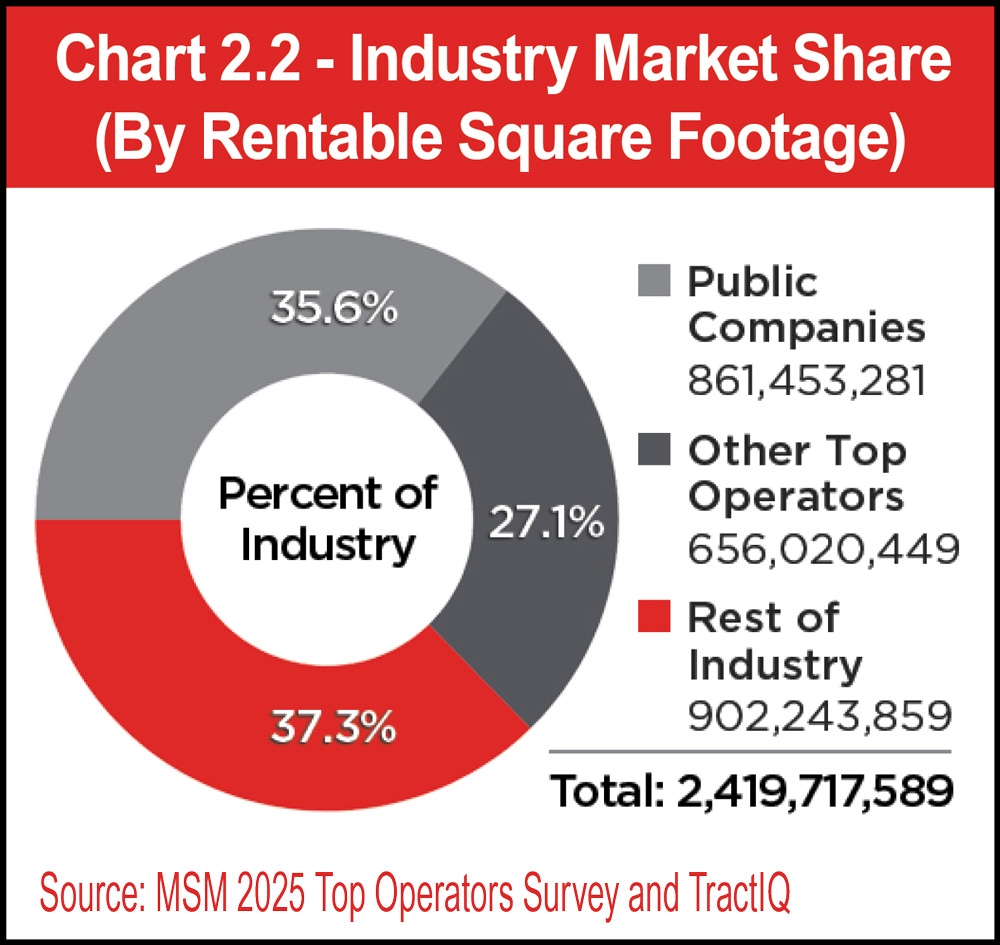
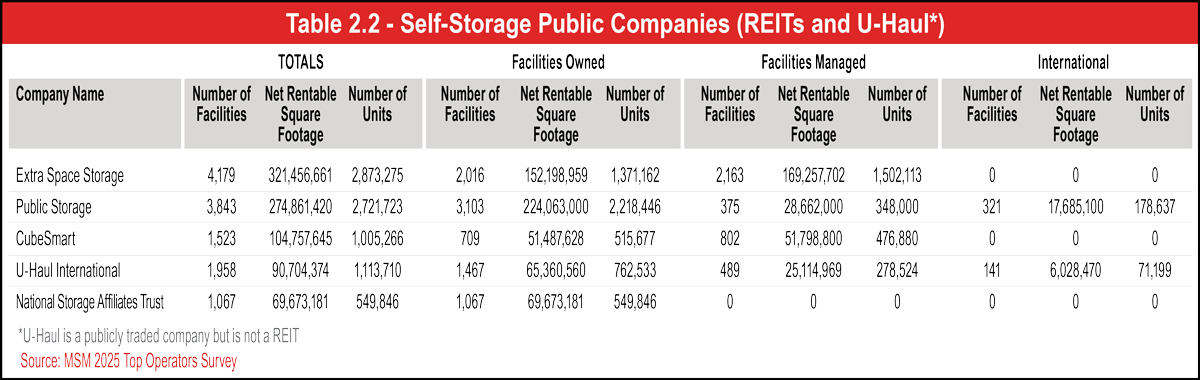
The five largest self-storage operators (REITs and U-Haul, a publicly traded company) comprise 19.3 percent of facilities and 35.6 percent of rentable square footage. Their portfolios include properties they own and manage, except for National Storage Affiliates (NSA), whose portfolio does not include any third-party managed facilities as of 2025.
See Charts 2.1 and 2.2.
Other Top Operators whose portfolios only include properties they own comprise 40 companies on the 2025 list of top 100 operators. Thirty-eight operators both own and manage self-storage facilities. Finally, 17 companies on the Top Operators list only provide third-party management; they do not own any facilities.
Adding up the five REITs, 38 top operators with both owned and managed facilities, 40 with owned facilities only, and 17 with exclusively managed facilities brings us to 100 operators on the list.
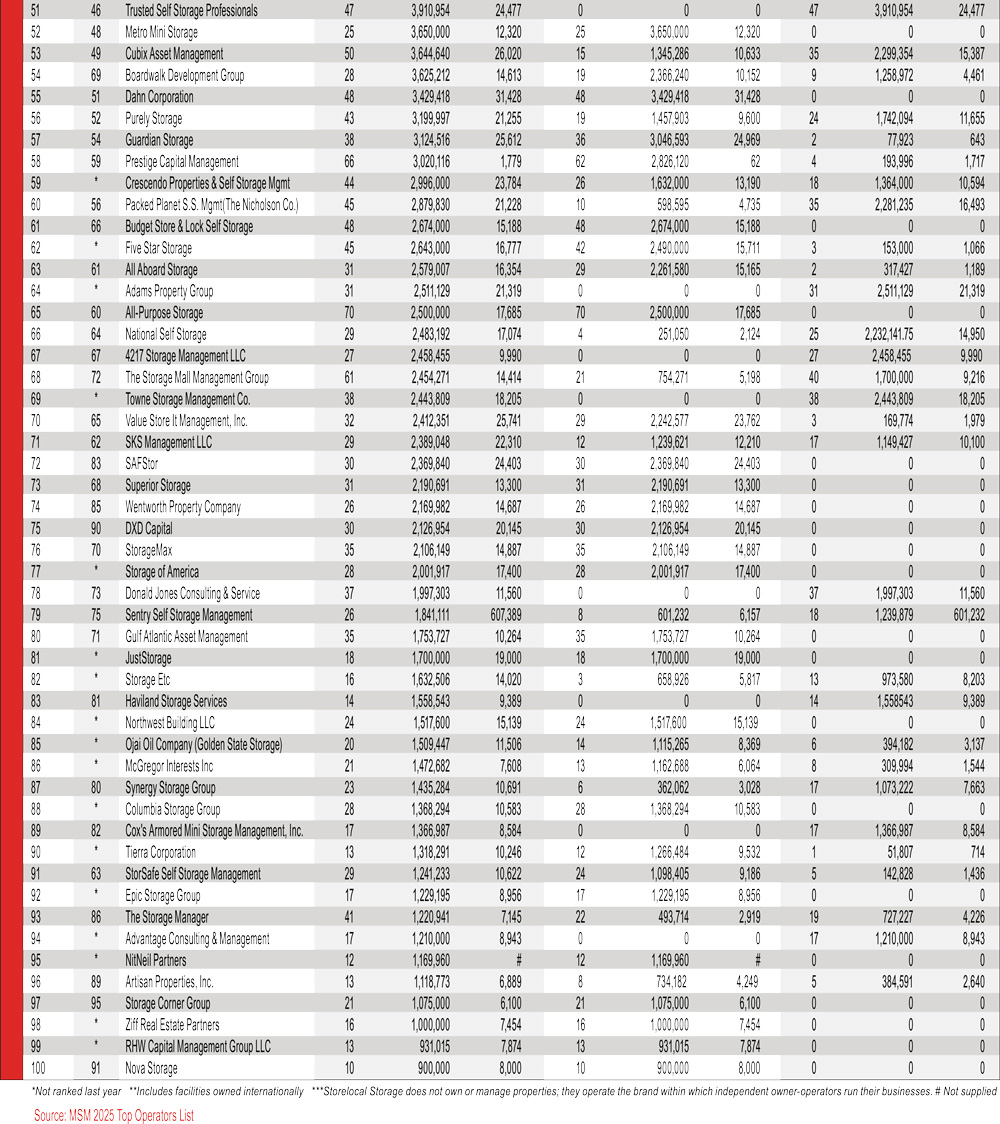
In 2025, 27 operators were considered “new” to the Top Operators list; they didn’t rank on the 2024 list, but some had been ranked in previous years, and consolidation has (and will continue) to make way for new entrants, such as StoragePRO’s (No. 26) acquisition of Storage Investment Management, Inc. (SIMI) in January. Of those 27, 14 own properties exclusively and do not offer third-party management. Conversely, four of 2025’s new entrants provide third-party management but do not own any facilities.
See Table 2.1.
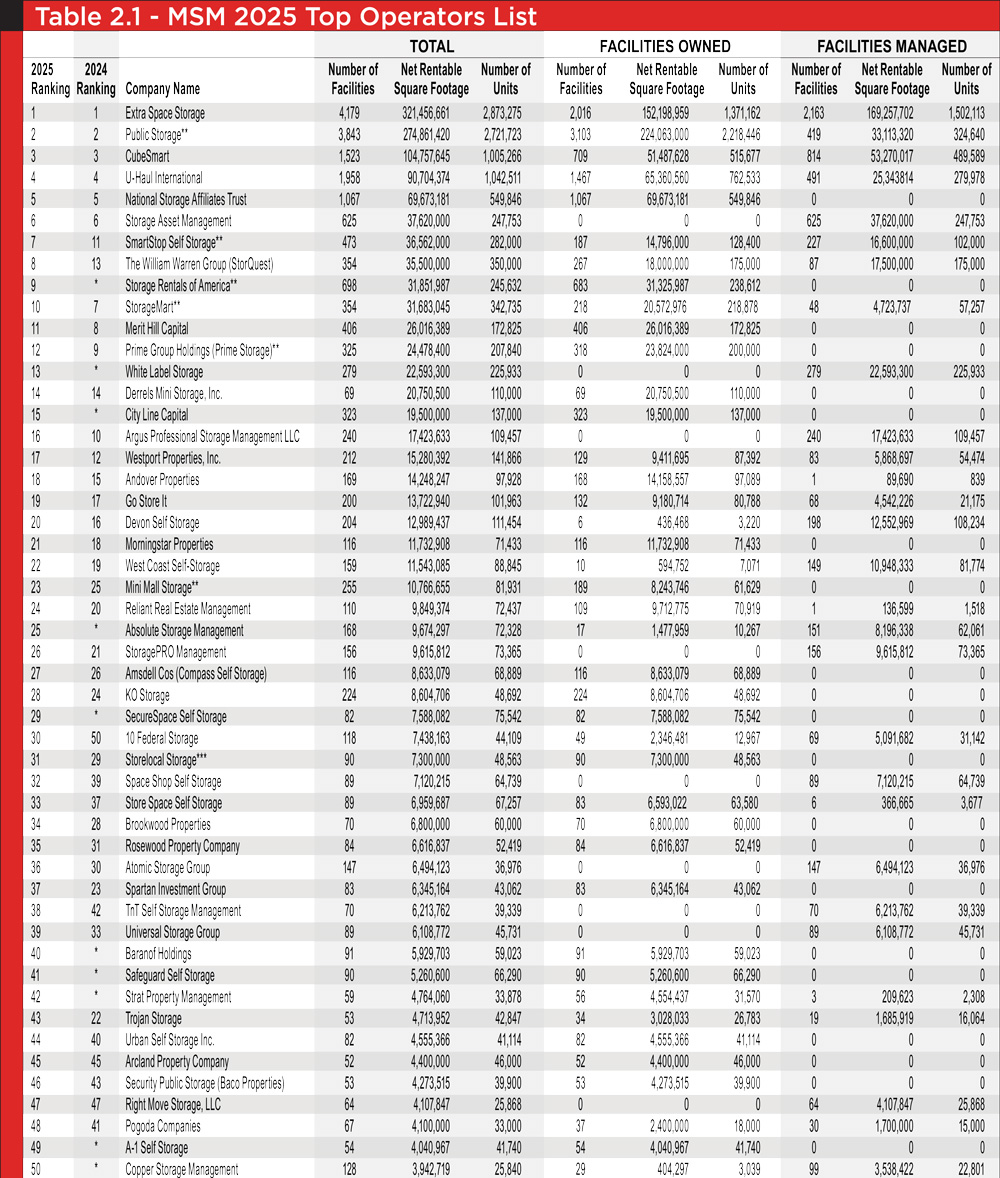
Like 2024, Public Storage, the second-largest operator, grew its portfolio by another approximately 11 million NRSF. Although about half of that amount (approximately 5 million NRSF) was added to the management side of its portfolio, Extra Space Storage still manages five times as much net rentable square feet in the United States than Public Storage.
Once again claiming third place is CubeSmart, which manages almost 2 million more NRSF than it owns. And with approximately 53.2 million NRSF of storage managed, roughly 20 million more than Public Storage, CubeSmart has the second-largest third-party managed portfolio in the self-storage industry.
Rounding out the REITs are U-Haul International (No. 4) and National Storage Affiliates Trust (No. 5). Their ranks remain unchanged from 2024, even though they each added about 1 million NRSF to their portfolios since the 2024 Top Operators Survey was completed.
Of special note: Next year’s REIT data will include SmartStop Self Storage, which became a REIT in the second quarter of 2025.
See Table 2.2.
Ranking No. 8 is The William Warren Group, which operates facilities under the StorQuest brand; it ranked 13th last year. In nineth is Storage Rentals of America (SROA), an operator that wasn’t listed in the 2024 list but has been ranked in previous years. It owns and operates nearly 32 million NRSF from 683 facilities across the United States, 12 in England, and three in Scotland. Other high-ranking newcomers to the 2025 list include White Label Storage at No. 13, City Line Capital at No. 15, and Absolute Storage Management at No. 25.
Finally, due to the addition of SROA and upward movement from The William Warren Group and SmartStop, as well as a slight decline in portfolio size, StorageMart has dropped from seventh to tenth.
As seen in Chart 2.1, market share of “Other Top Operators” ranked No. 6 to 100 is 14.3 percent of the industry’s total number of facilities. By rentable square footage, shown in Chart 2.2, their share is much more substantial at 27.1 percent.
However, the Rest of Industry’s lead over REITs and Other Top Operators is negligible when calculated by rentable square footage. Chart 2.2 shows that Rest of Industry holds 37.3 percent of the market share by rentable square footage, which is only 1.7 percent more than the REITs but 10.2 percent more than Other Top Operators.




See Table 2.3.
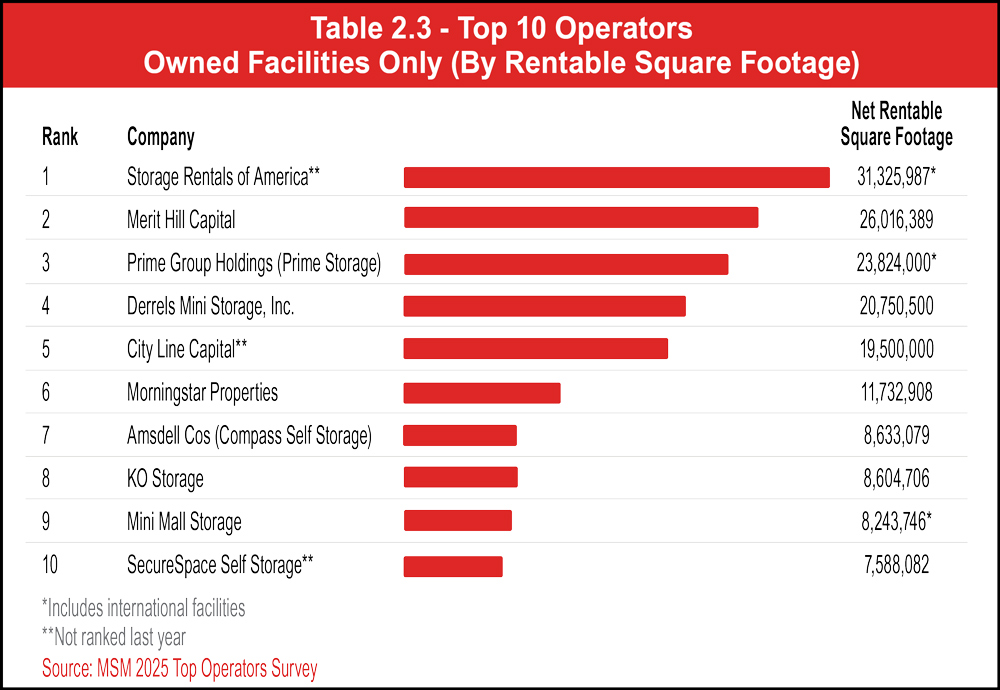
Remaining in the No. 4 position is Derrels Mini Storage with nearly 21 million rentable square feet. Another newcomer to the list, City Line Capital, with 19.5 million rentable square feet, has landed ahead of Morningstar Properties, which is now No. 6. Morningstar Properties dropped one rank last year as well; it had ranked No. 4 in the 2024 Self-Storage Almanac. KO Storage also moved down a spot to make room for Amsdell Companies (Compass Self Storage); both companies have slightly more than 8.6 million rentable square feet, but Amsdell reported having almost 30,000 more square feet in its portfolio. Ranked 7th last year, Mini Mall Storage, which has both American and Canadian facilities, is now No. 9. SecureSpace Self Storage, one more not ranked in 2024, has taken the No. 10 slot with more than 7.5 million rentable square feet.
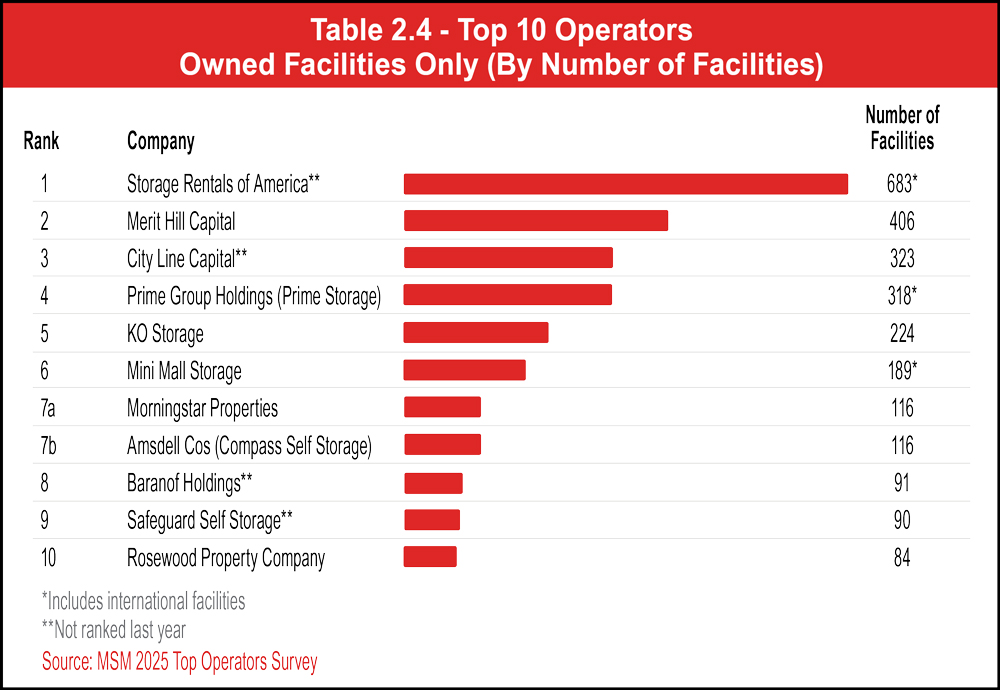
The ranks are somewhat different when sorted by total number of facilities, as seen in Table 2.4 and Chart 2.4. While the No. 1 and No. 2 companies are the same (Storage Rentals of America with 683 facilities and Merit Hill with 406), City Line Capital comes in third for having five more facilities than Prime Group Holdings. KO Storage, ranked 8th by rentable square footage, moves up to No. 5 by number of facilities. In the No. 6 position is Mini Mall Storage with 189 facilities; this is an increase of three ranks when compared to its rentable square footage ranking. With 116 facilities each, Morningstar Properties and Amsdell Companies are tied for No. 7, so they have been listed as 7a and 7b. Coming in eighth and nineth are two newcomers to the 2025 Top Operators list: Baranof Holdings and Safeguard Self Storage. They have 91 and 90 facilities, respectively. Rosewood Property Company takes No. 10 with 84 facilities. It should be noted that Storelocal Storage, which ranked 31st on the 2025 Top Operators list, has been omitted from this list, despite reporting a portfolio of 90 properties, because it operates the brand within which independent owner-operator run their businesses; it does not own those properties.
See Table 2.4.
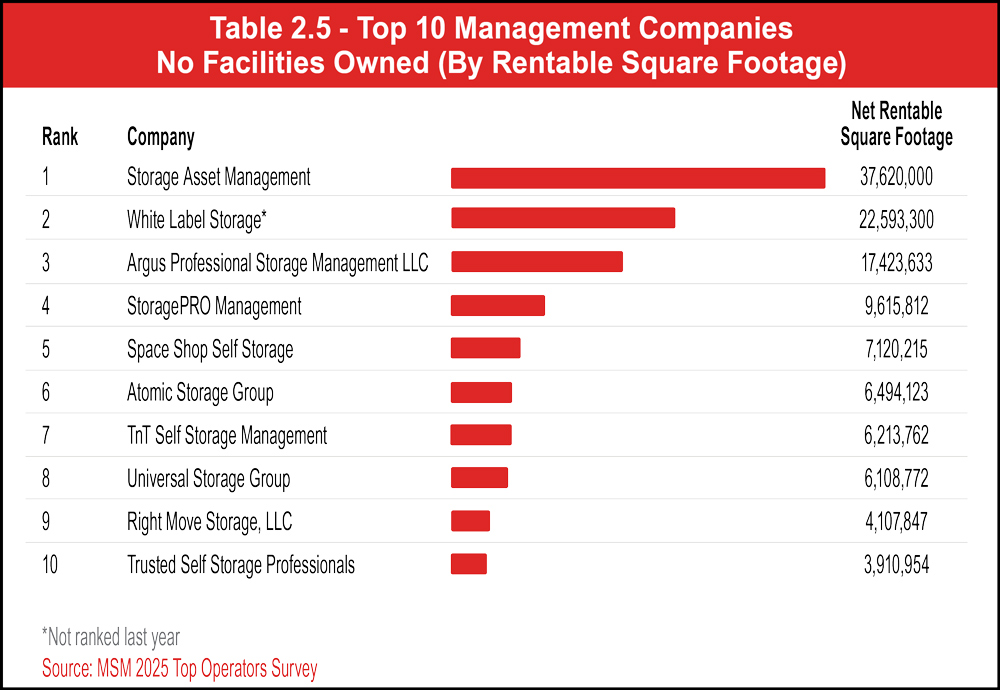
See Table 2.5.
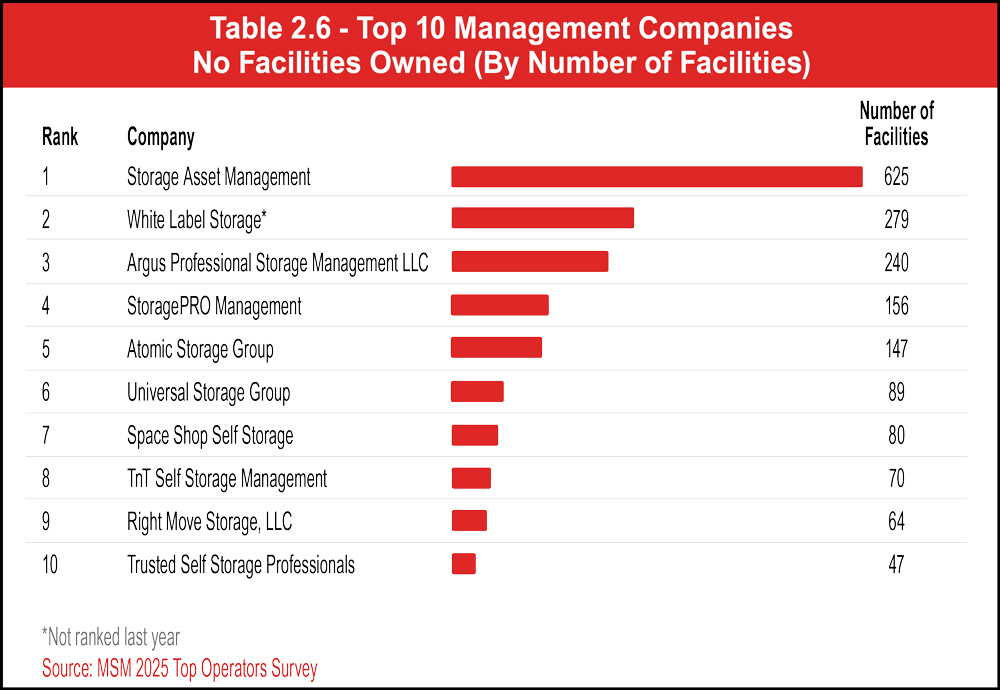
See Table 2.6.
Although new development has somewhat slowed compared to years past, growth of the REITs’ extensive portfolios has not. With more management contracts under their belts, smaller facilities being developed, and corporate consolidation of top operators, the shifting ownership landscape is deserving of attention. It will be interesting to see what 2026 brings!