


he U.S. economy is vast and diversified, with a gross domestic product (GDP) of over $30.6 trillion. Governments, businesses, and investors closely watch the economy’s performance to guide their decisions, relying on indicators such as the cost of capital, building costs, supply chain conditions, and the state of the labor market. Consumers are also influenced in their financial decisions by factors such as housing costs, inflation, and interest rates.
Voters named the economy as their top issue in the 2024 presidential election, setting high expectations for the new administration. President Trump was elected on a platform that included a host of measures designed to improve affordability and promote economic growth. Taking office in January 2025, the Trump administration inherited a high-performing economy featuring resilient consumer demand, strong corporate profitability, and a solid labor market.
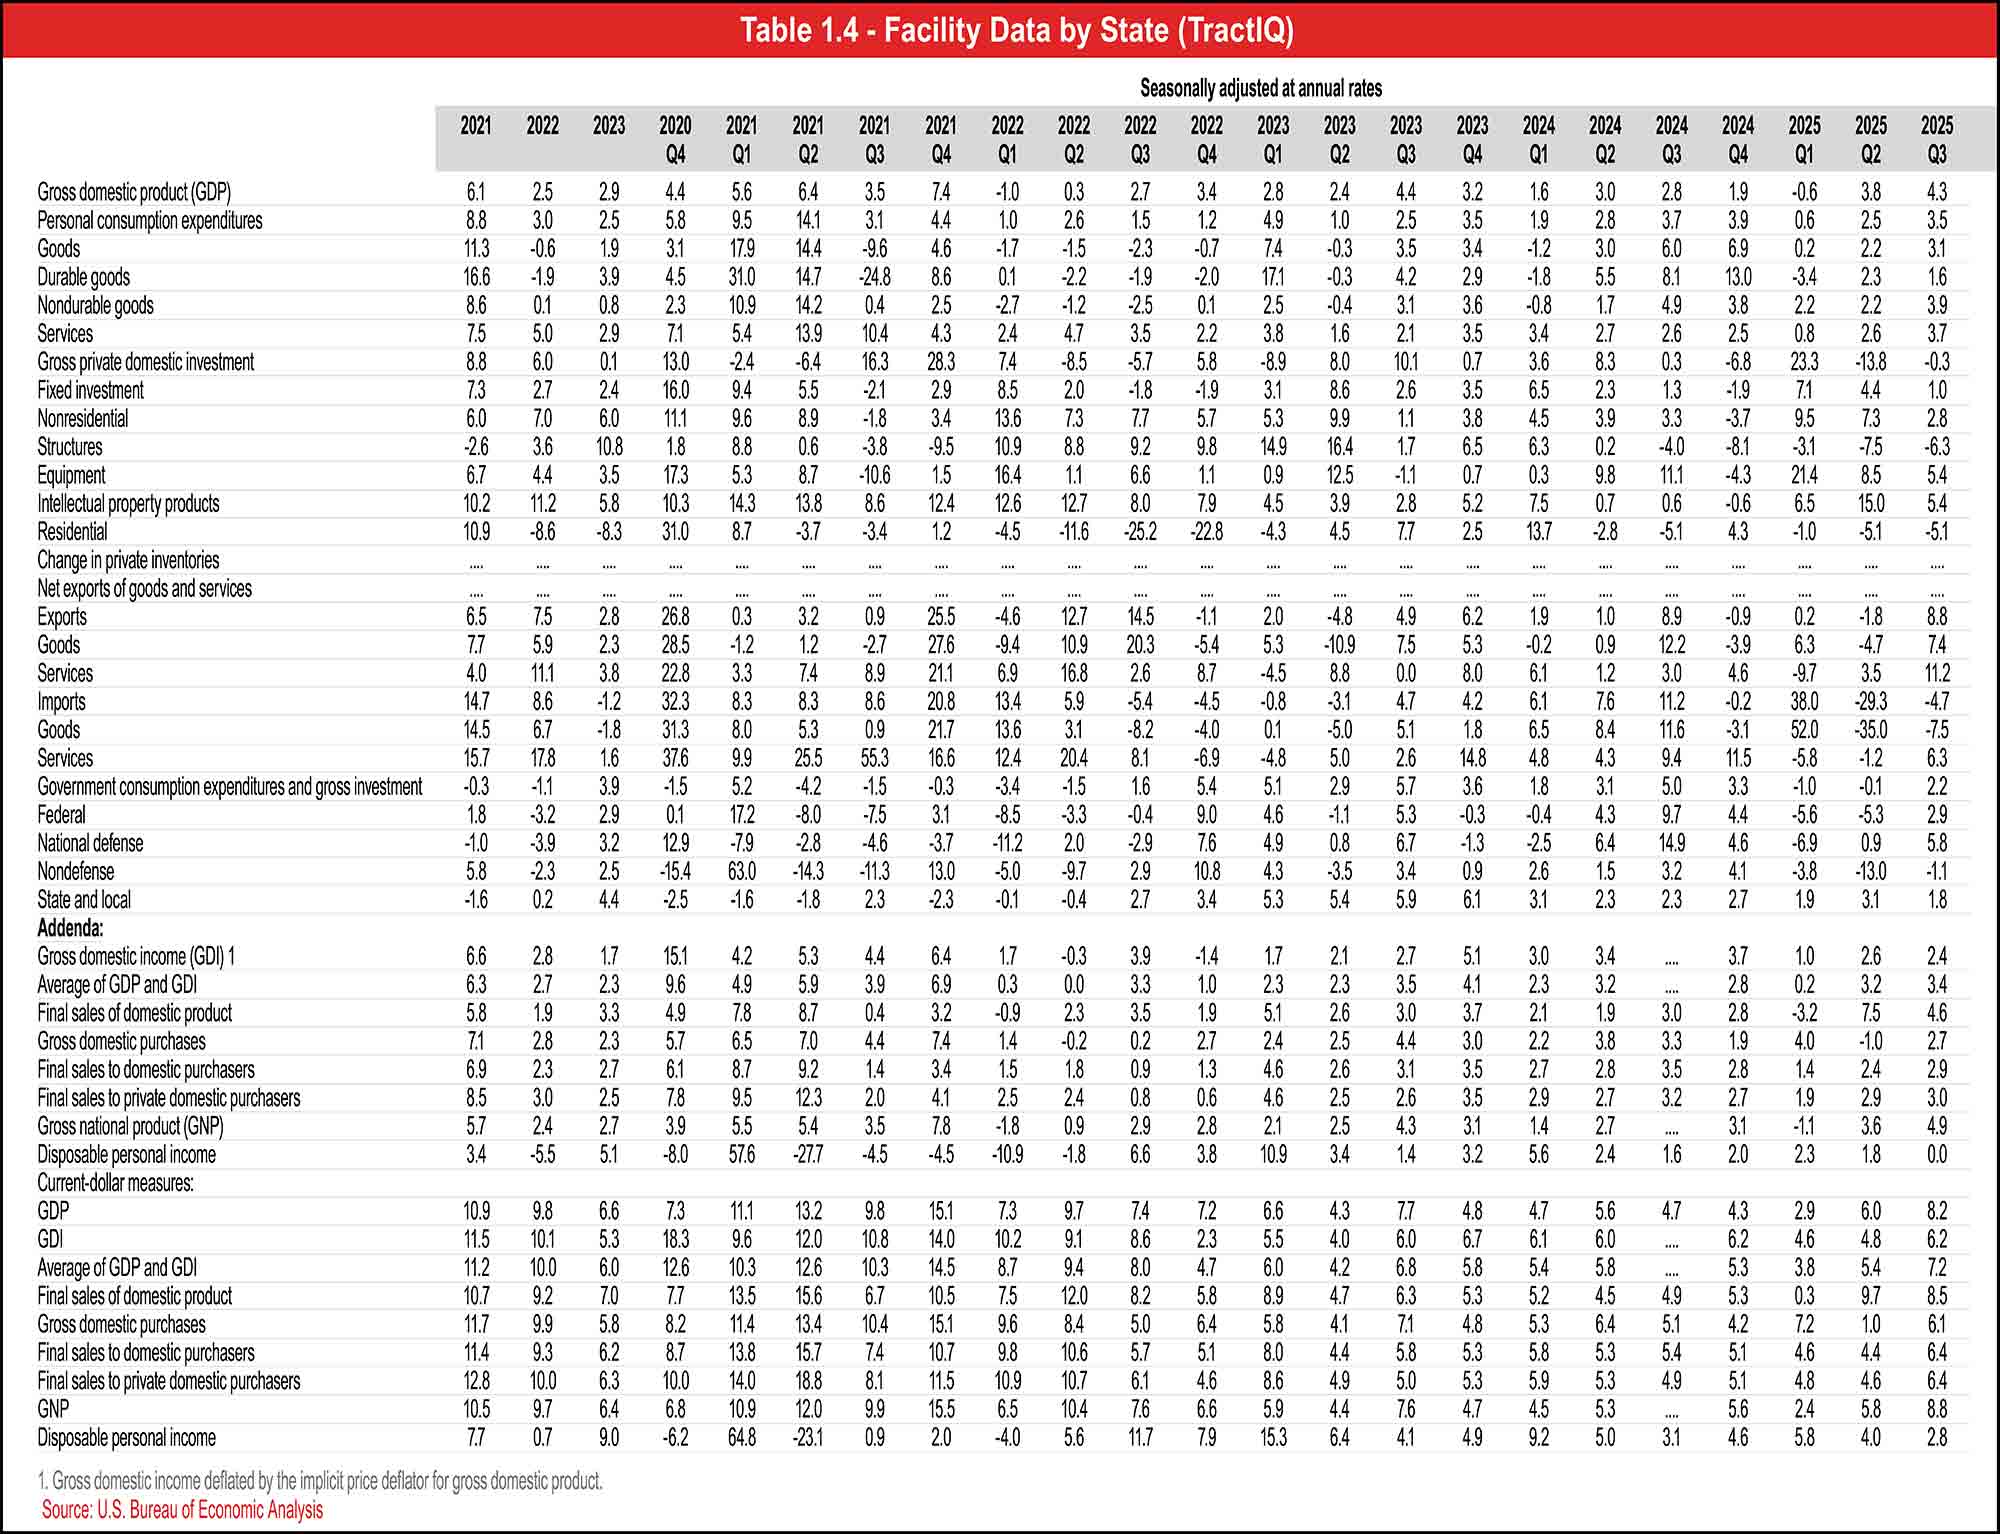
After contracting in the first quarter, the economy showed remarkable resilience in 2025. GDP grew at an annualized rate of 3.8 percent in the second quarter and 4.3 percent in the third quarter, the latter marking the fastest pace in two years. This robust expansion, propelled by a jump in consumer spending and a surge of investment related to artificial intelligence (AI), came despite headwinds including a slowing labor market, persistent inflation, and trade policy turbulence.
Those headwinds have contributed to negative public perceptions of the economy, which have persisted despite strong growth. According to a December 2025 Gallup poll, 47 percent of adults describe current economic conditions as “poor,” the highest reading since September 2024. More than two-thirds (68 percent) say that economic conditions are getting worse, compared to 29 percent who say they’re getting better.
Inflation, boosted by tariff-related cost increases, remained a continued point of stress in 2025. While inflation is dramatically down from its peak of more than 9 percent in 2022, slowing wage gains and a softening job market are placing pressure on the American consumer. The core personal consumption expenditures (PCE), which excludes food and energy prices, showed an annual rate of 2.8 percent, above the Federal Reserve’s 2 percent long-term target.
The federal government experienced its longest shutdown in history, lasting 43 days from October 1 to November 12, as Congress failed to pass appropriations bills for the 2026 fiscal year. The impasse led to an estimated 1.4 million federal employees being furloughed or working without pay, disrupting government services. It also halted the collection of economic data by federal agencies, delaying the release of various reports and likely distorting the results. This has undermined confidence in key indicators such as GDP growth and inflation.
The economy started the year on shaky footing, with real GDP contracting by an annualized rate of 0.6 percent in the first quarter of 2025. This decline was driven by companies ramping up imports in anticipation of new tariffs; imports are subtracted from the calculation of GDP. Growth rebounded strongly in the following two quarters. Third-quarter growth of 4.3 percent far exceeded analyst forecasts of 3.2 percent.
See Table 4.1.
U.S. equities rebounded strongly from tariff-related volatility early in the year. Stock markets reached record highs during the fourth quarter, with the benchmark S&P Index registering a year-to-date gain of around 16 percent as of Dec. 12, 2025. Earnings growth for the S&P 500 is estimated at 8.3 percent year over year for the fourth quarter, according to FactSet.
Tariff policy featured prominently in 2025’s economic news, with President Trump announcing sweeping import duties on April 2. These included a 10 percent baseline tariff on nearly all countries, with additional “reciprocal” tariffs on roughly 90 countries ranging as high as 50 percent. The most aggressive tariffs were largely withdrawn after the news triggered severe volatility in global markets, including the U.S. Treasury market.
With many trade disputes still unfolding, the U.S. approached the end of 2025 with an overall average effective tariff rate of 16.8 percent, the highest level since 1935, according to the Yale Budget Lab. The Lab estimates that if the 2025 tariffs remain in place, they would raise more than $2.7 trillion in revenue over 10 years, although that sum would be partially offset by declines in tax revenue stemming from lower economic growth. Tariff disputes notably affected trade with China, the European Union, Canada, and Mexico during the year.
One of the stated goals of the tariff package was to revitalize U.S. manufacturing, but roughly 67,000 fewer Americans were employed in manufacturing in November than in April, per data from the Bureau of Labor Statistics. Total manufacturing construction spending also declined over the course of the year. Despite this, manufacturers are making ambitious capital spending commitments. One analysis found that companies announced a total of $1.2 trillion in planned investments in U.S. production during the first eight months of 2025.
In July, the legislation known as the “One Big Beautiful Bill” was signed into law, with provisions that included permanently extending many of the tax cuts and reforms from the Tax Cuts and Jobs Act of 2017. One of the largest tax cuts in American history, the bill is projected to reduce federal tax revenue by $5 trillion from 2025 through 2034, according to the Tax Foundation.
The impact of severe weather was relatively muted in 2025, as no hurricanes made landfall in the continental U.S. for the first time since 2015. However, Southern California experienced a series of wildfires in January that killed at least 30 people and caused tens of billions of dollars in property damage.
The construction industry is a major contributor to the overall economy, accounting for 4.5 percent of GDP and employing over 8 million people. Construction spending during August 2025 was estimated at a seasonally adjusted annual rate of $2.17 trillion. During the first eight months of the year, construction spending totaled $1.43 trillion, down 1.8 percent from the same period in 2024, according to the Census Bureau.
Business investment has been strong this year, with real nonresidential investment surging by 9.5 percent in the first quarter as companies scrambled to prepare for tariff shocks. That figure stayed high at 7.3 percent in the second quarter, then fell to 2.8 percent in the third quarter. Investments in digital transformation and AI contributed to overall business investment, but investment in structures has declined consistently since the start of 2024.
Consumer spending was resilient throughout most of the year, although pressure on household budgets is making many consumers more price sensitive. Total credit and debit card spending per household was up 1.3 percent year over year in November 2025, according to Bank of America data. Consumer demand kept the auto industry healthy despite challenges, including tariff headwinds. New-vehicle sales were expected to total 16.3 million for 2025, rising 1.8 percent year over year, according to Kelley Blue Book estimates.
Despite steady spending, consumer confidence weakened for a fifth consecutive month in December, according to The Conference Board. Consumer spending in 2025 tended to shift away from pricey, discretionary activities, and consumers registered greater caution about their plans for buying big-ticket items for the following six months. Views on current business conditions turned mildly pessimistic for the first time since September 2024.
See Table 4.2
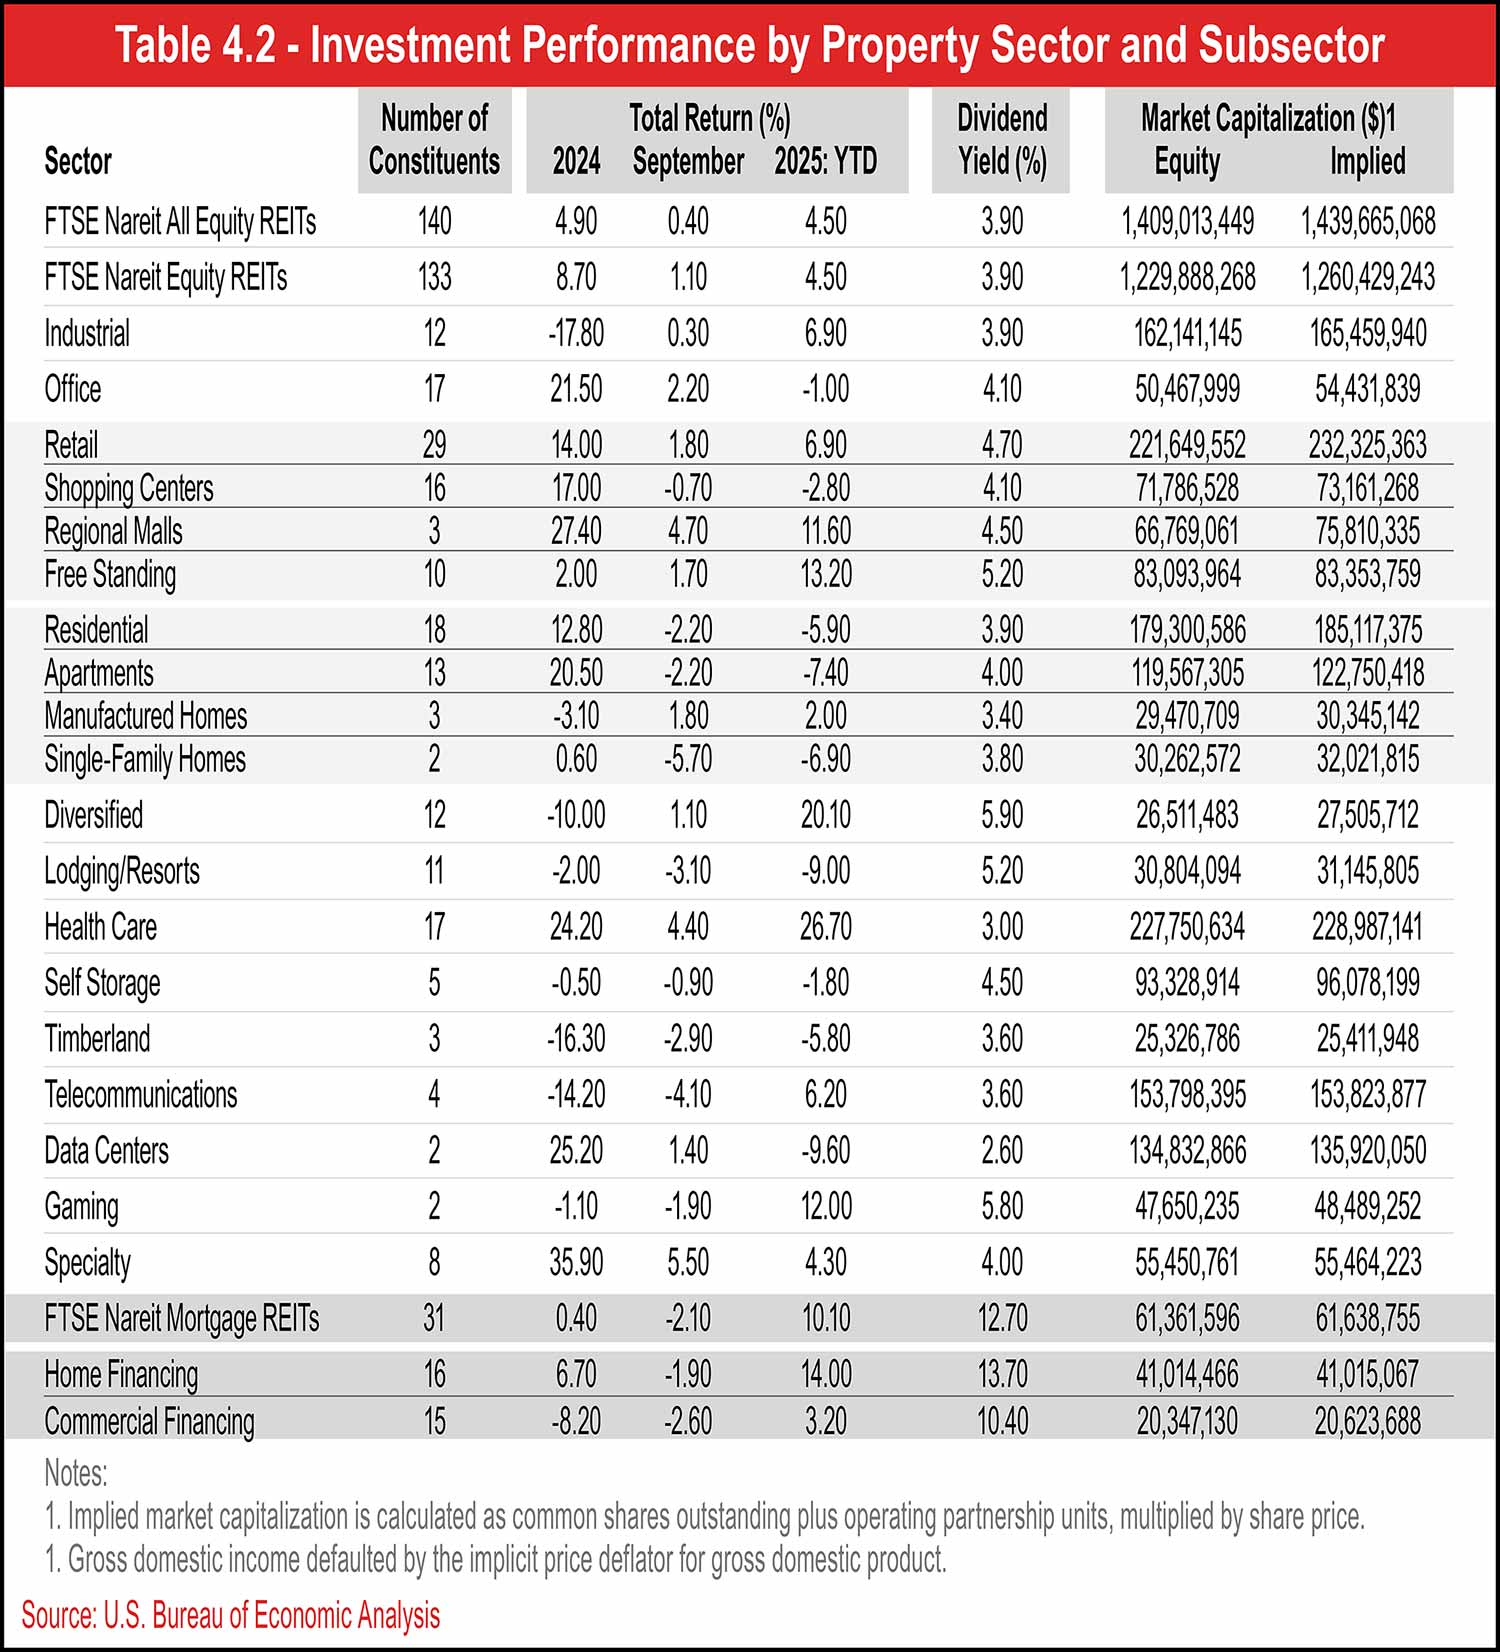
As of the third quarter, U.S. public equity REITs registered 5.2 percent growth in year-over-year net operating income (NOI) and 2.8 growth in same-storage NOI. More than 60 percent of REITs saw positive growth in year-over-year NOI, while more than 50 percent had gains in same-store NOI. Nareit also pointed out that REITs have maintained well-structured balance sheets with low leverage.
Self-storage REIT performance was weaker, with the ongoing downtown in the U.S. housing market weighing on revenue. Nareit reported that NOI for self-storage REITs rose 3.9 percent year over year in the third quarter, while same-store NOI declined 1.4 percent. Year-to-date returns for self-storage REITs were down 8.1 percent as of Dec. 1, 2025.
Self-storage demand suffered in 2025 as a result of the largely “frozen” housing market. People’s need for short-term storage when they move is a key driver of self-storage demand, but the U.S. home turnover rate has hovered near 30-year lows for two years as a result of higher mortgage rates, reducing this demand.
Another factor is that the percentage of consumers using self-storage as temporary storage while moving is declining. A UBS Evidence Lab survey found that people using self-storage for this purpose was 35 percent in the third quarter of 2025, below the long-term average of 37 percent and down from the peak of 41 percent in the third quarter of 2020.
The housing market will likely need to recover to reignite self-storage demand. Despite this, some tailwinds have appeared. Long-term apartment renters who can’t afford to buy a home are helping to support storage demand when they undergo life events such as marriage and relocation for work. The UBS survey also found that an increasing share of people are using self-storage as temporary storage while remodeling.
See Chart 4.1.
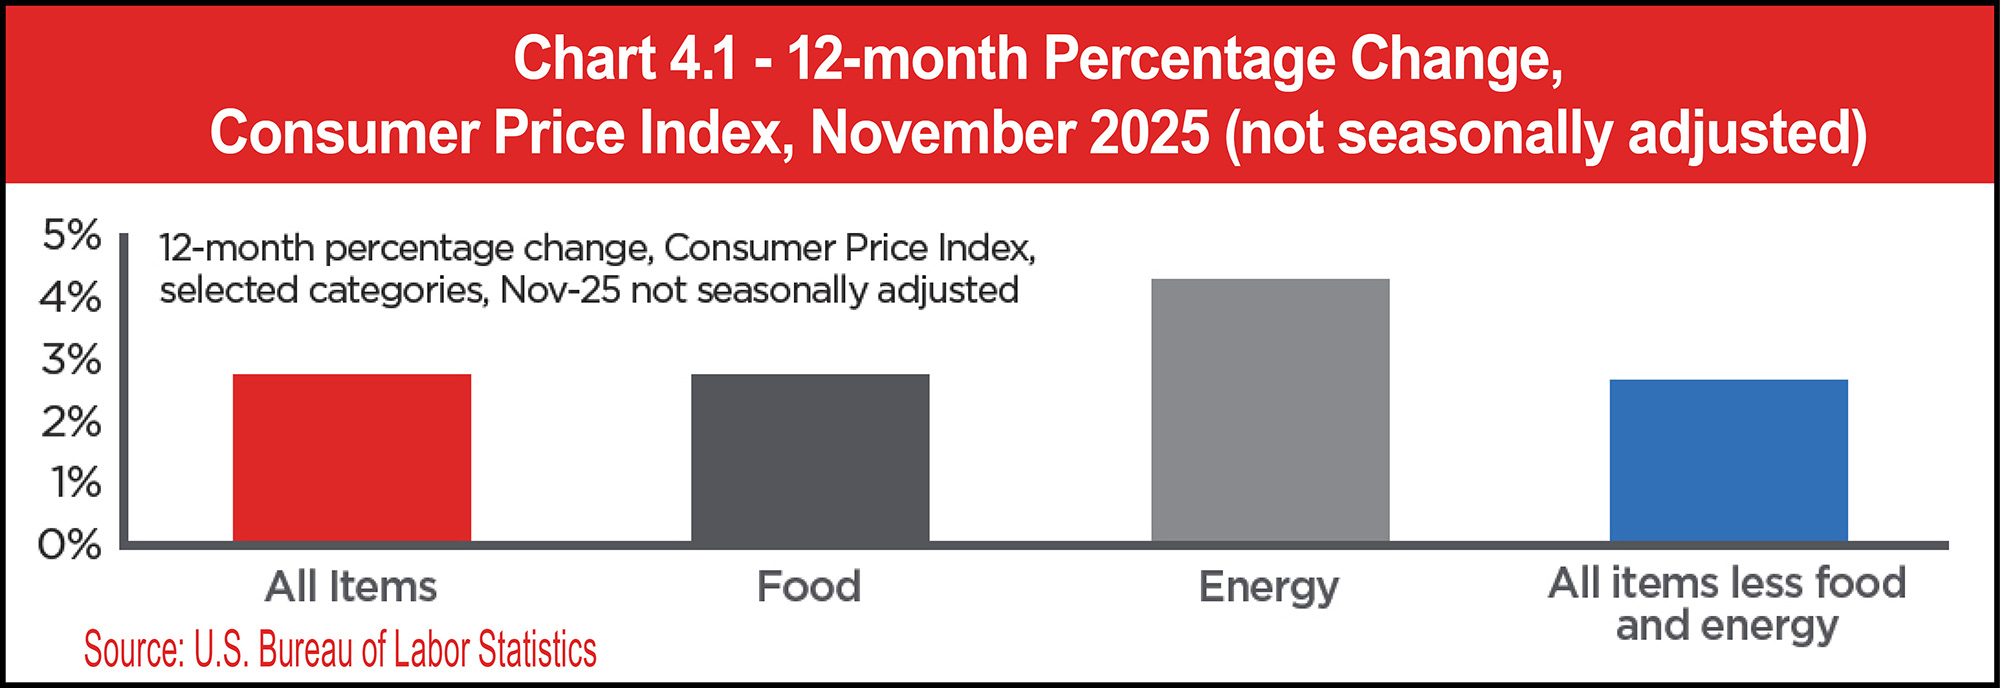
The consumer inflation rate peaked at 9.1 percent in 2022 and has since fallen substantially, though overall prices are still about 25 percent higher than they were in 2020. The ongoing and cumulative increase in prices has placed significant strain on household budgets, even if wage gains have generally kept up with inflation by some measures.
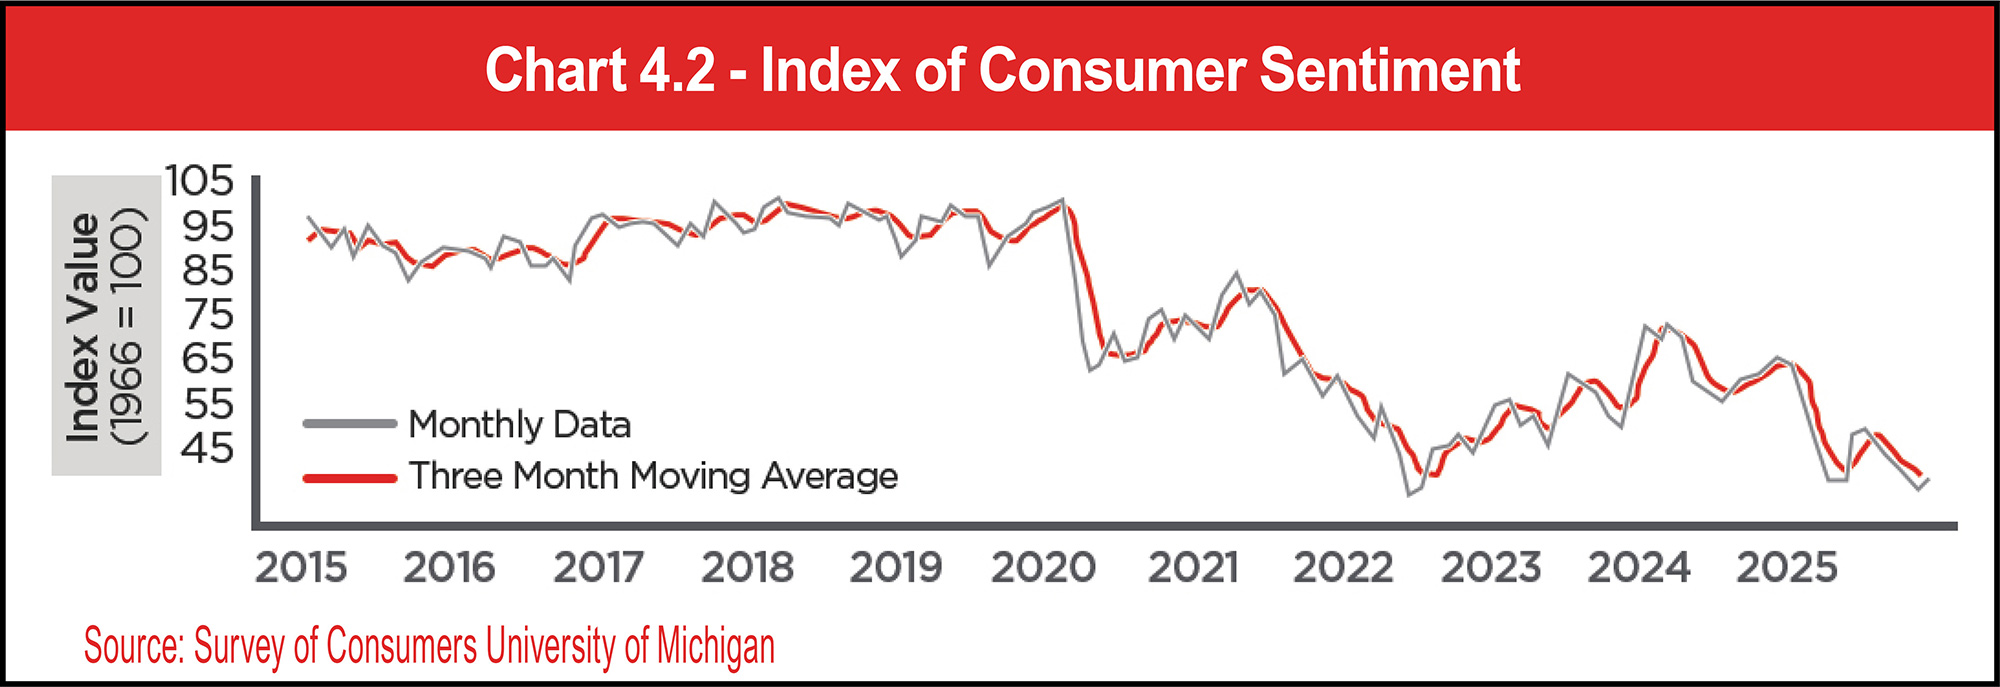
The University of Michigan consumer sentiment index for the U.S. inched up to 52.9 in December 2025, a reading that was down 28.5 percent year-over-year. Lower-income consumers experienced gains, but sentiment for higher-income consumers remained basically unchanged. Buying conditions for durable goods declined for five straight months. Expectations for personal finances and business conditions improved in December, as did labor market expectations, but 63 percent of consumers still expect a continued increase in unemployment next year.
See Chart 4.2.
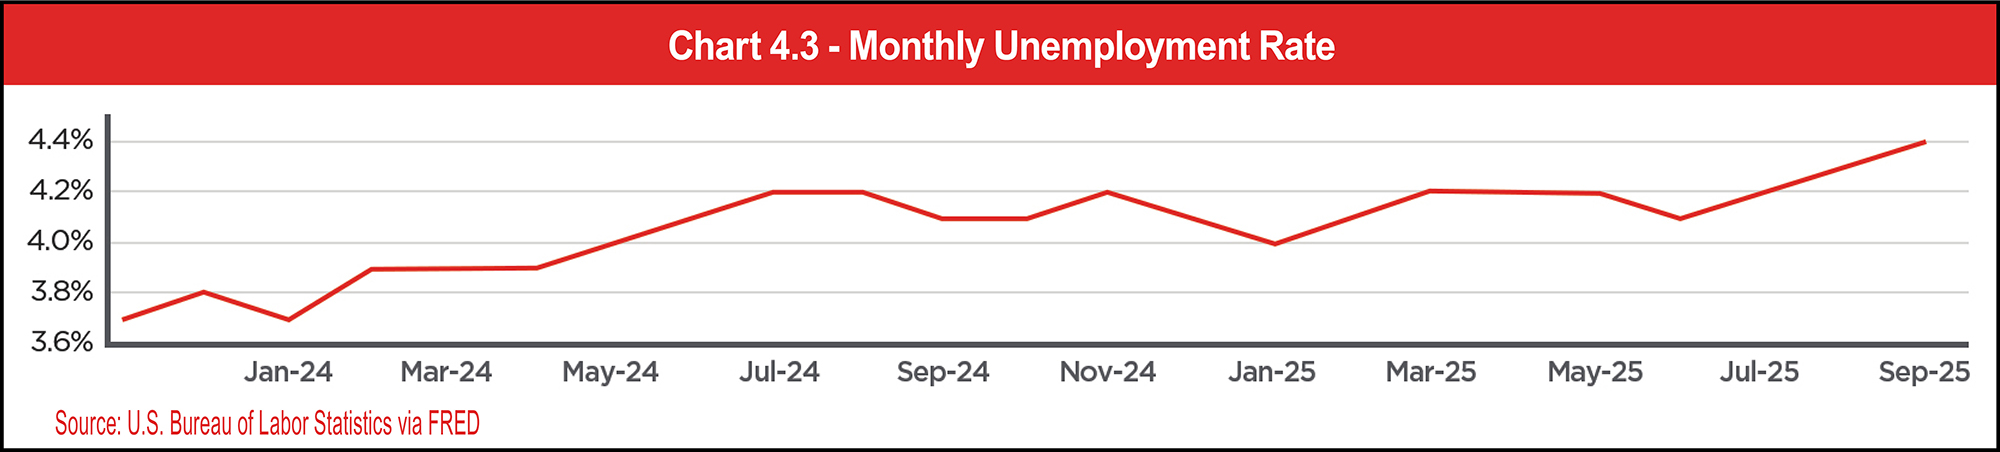
The economy added just under half a million jobs in January through November 2025, a steep drop from the 1.6 million jobs created in the same period of 2024. The total number of unemployed Americans rose more than 700,000 to 7.8 million, and the unemployment rate rose to 4.6 percent at the end of November 2025—the highest rate since 2021 but lower than the long-term average of 5.67 percent.
See Table 4.3 and Chart 4.3.

Immigration policy had a notable impact on the labor force this year. An analysis of Bureau of Labor Statistics data found a decline of 1.1 million foreign-born workers since January 2025, apparently due to immigration restrictions and a ramped-up deportation campaign.
See Chart 4.4.
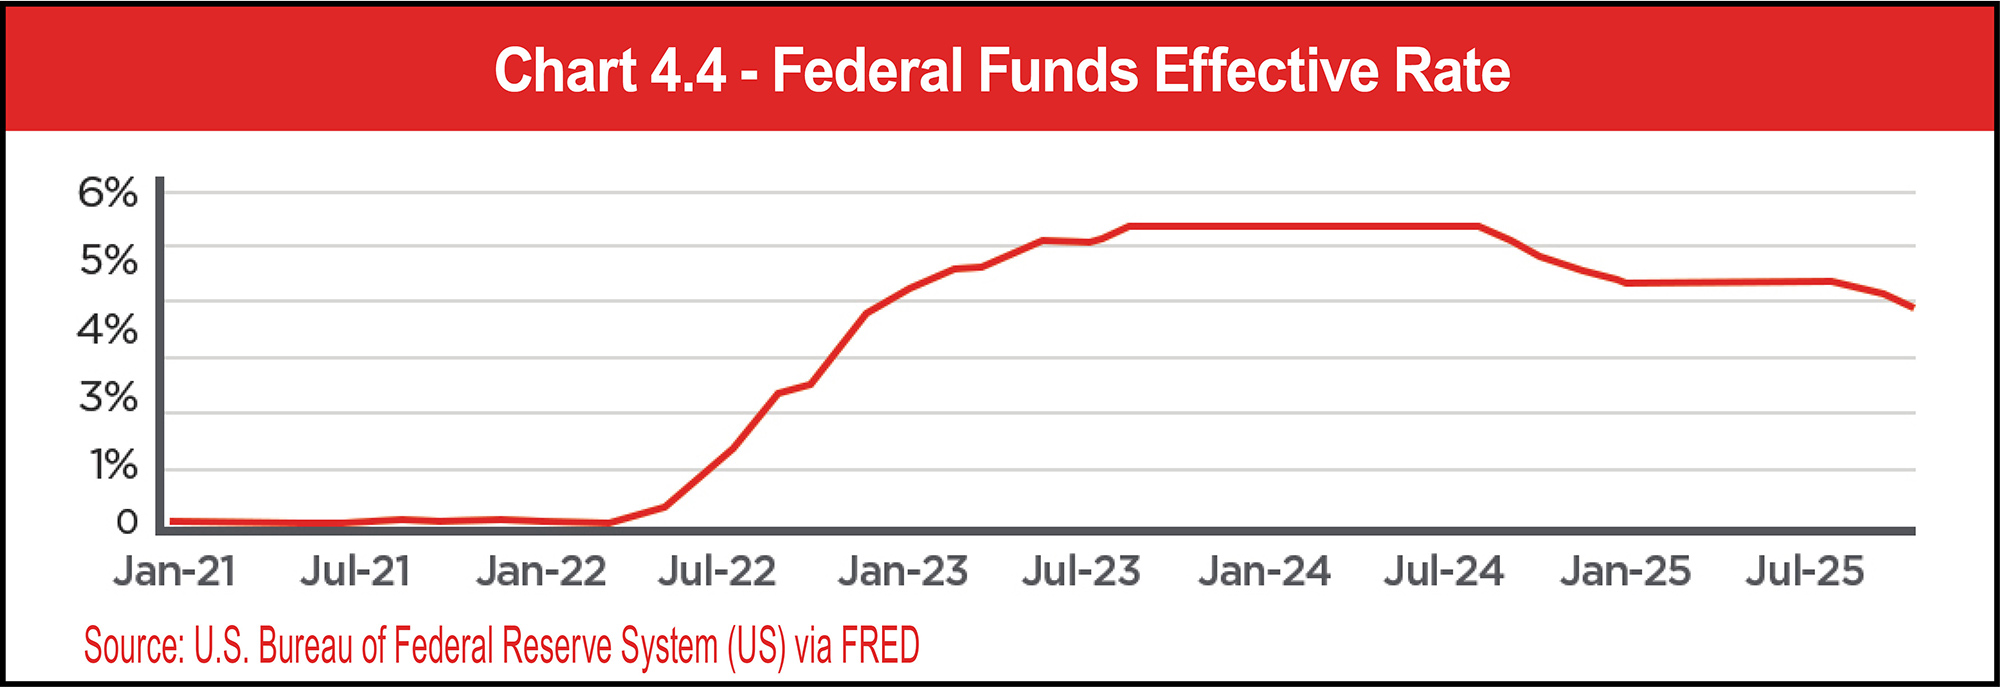
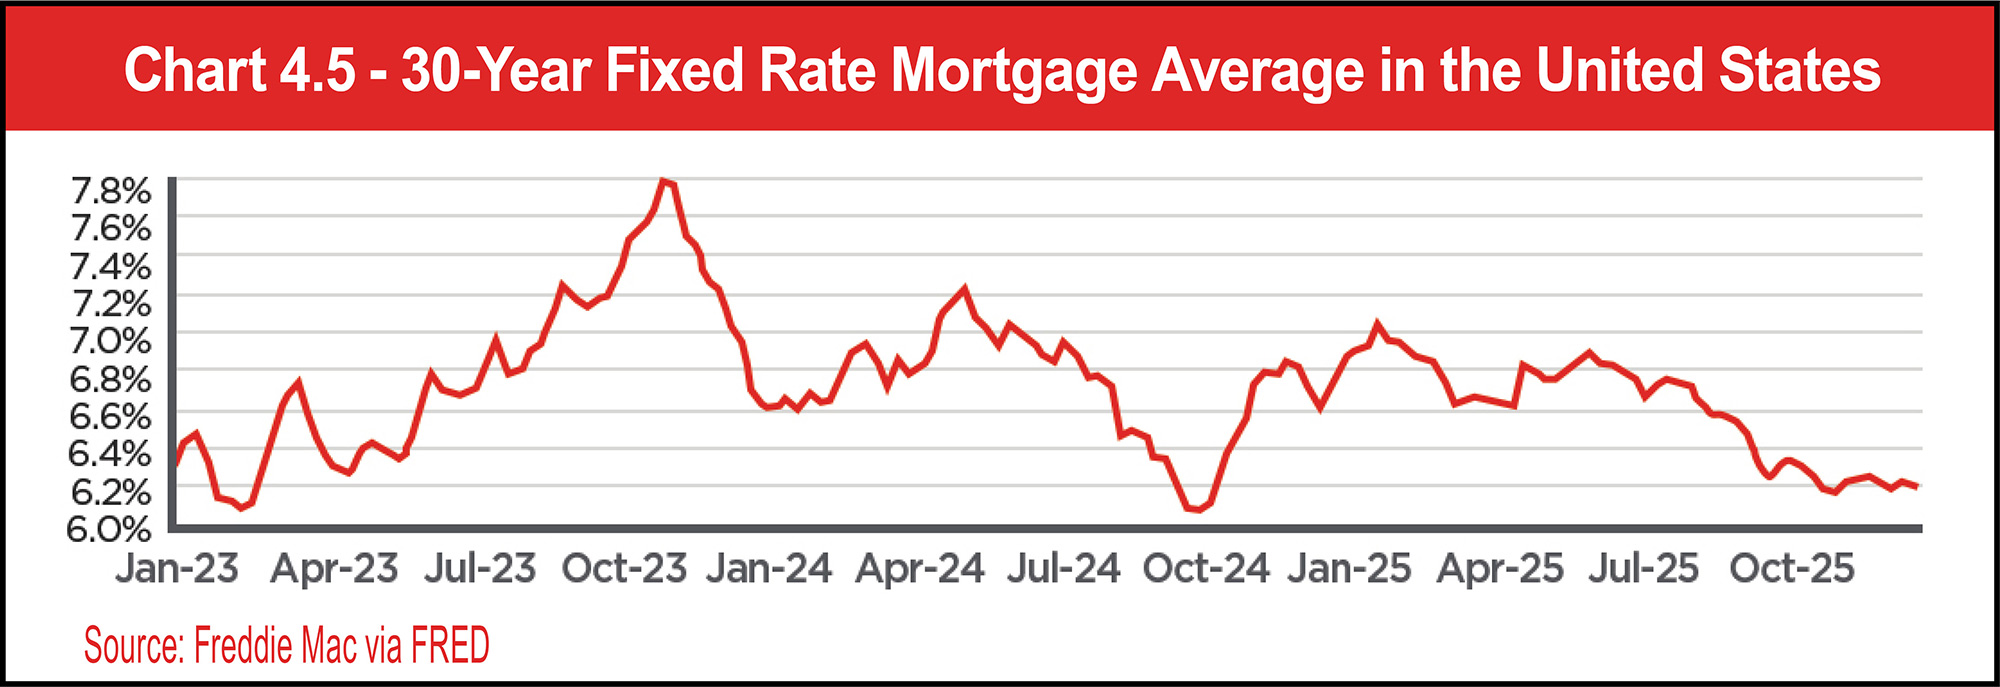
Following that period of volatility, mortgage rates have hovered in the 6 percent to 7 percent range for most of 2024 and 2025. Rates lingered in the 6.6 percent to 7 percent range in the first half of 2025 but declined steadily in the second half of the year as the Fed eased rates. The 30-year fixed rate mortgage average stands at 6.18 percent as of December 24.
See Chart 4.5.
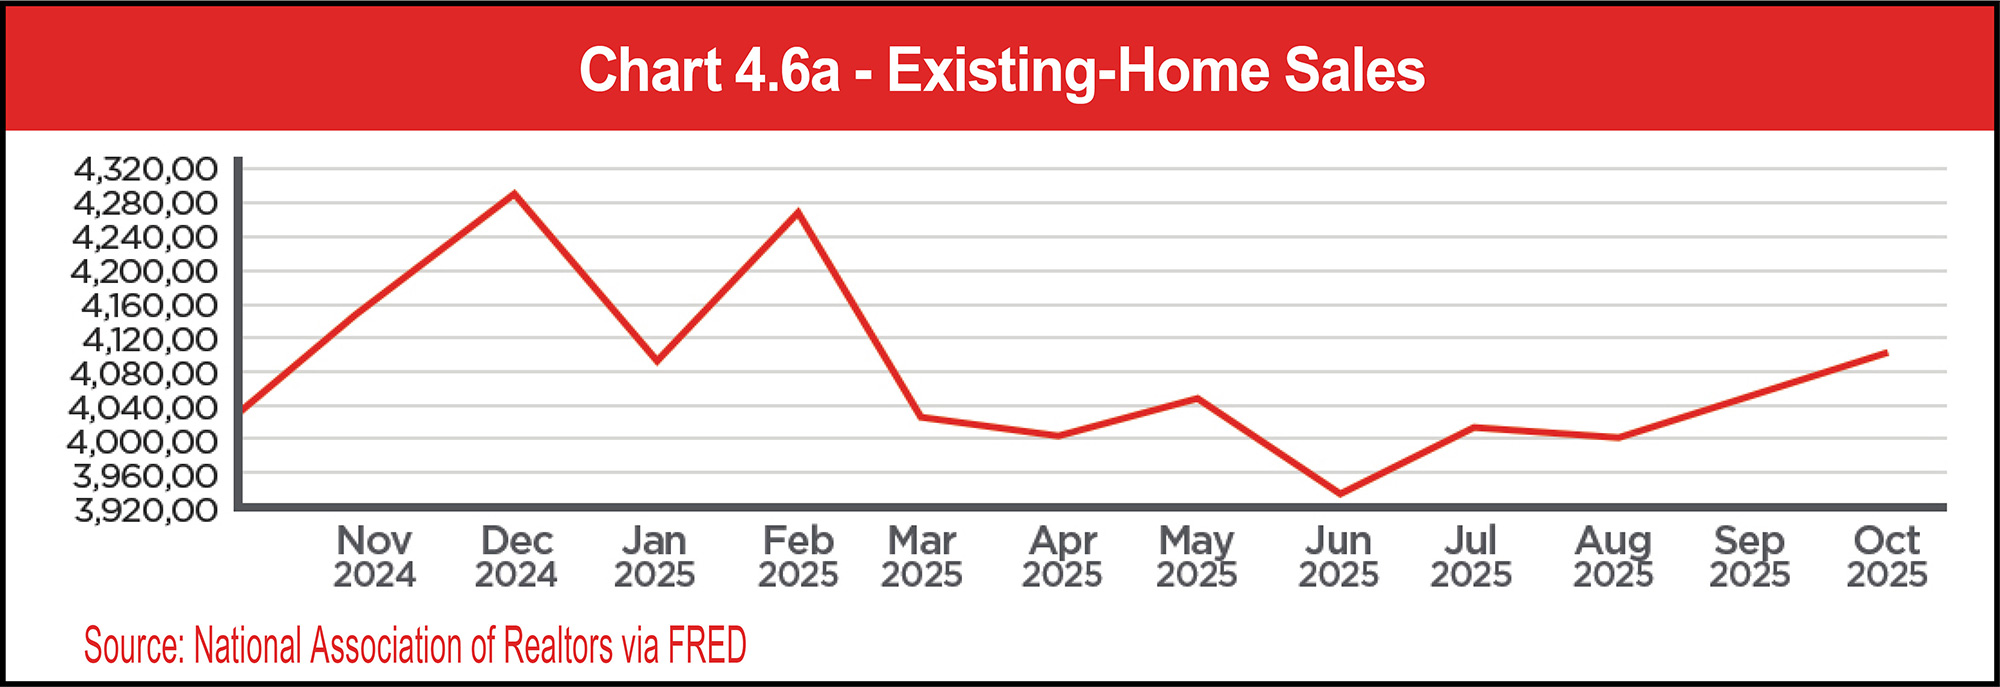
Existing-home sales reached a seasonally adjusted 4.13 million in November 2025, up 0.5 percent from the previous month but down 1.0 percent year over year, according to the National Association of REALTORS® (NAR). Sales increased for the third consecutive month due to lower mortgage rates in the autumn. NAR noted that wage growth was outpacing the rise in home prices, which improves housing affordability.
See Chart 4.6a.
The median price of existing homes for all housing types in November was $409,200, up 1.2 percent from October 2024, when the median price was $404,400, according to NAR. The Northeast, the Midwest, and the South all saw year-over-year price increases, with the largest jump seen in the Midwest at 5.8 percent. Prices eased in the West by 0.9 percent.
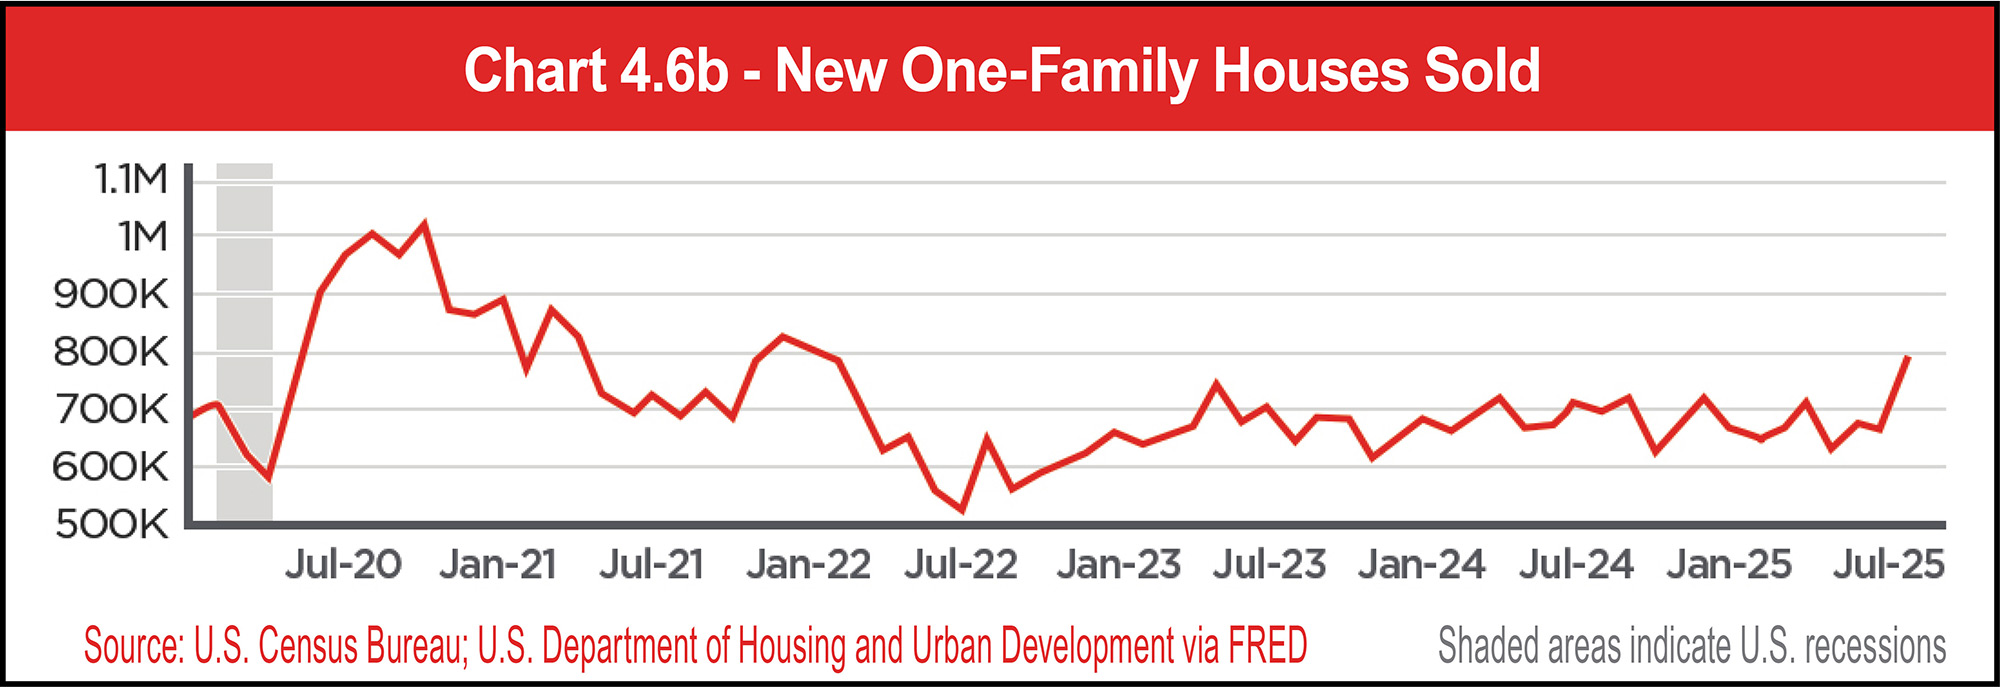
The seasonally adjusted annual rate of new one-family houses sold was 800,000 in August 2025, rising from 664,000 in July 2025 and 693,000 in August 2024. The median sale price for new houses sold in the U.S. was $413,500 in August 2025, up from $395,100 in July 2025 and $405,800 in August 2024, according to data from the Census Bureau and the U.S. Department of Housing and Urban Development.
See Chart 4.6b.
See Chart 4.7.
See Table 4.4.
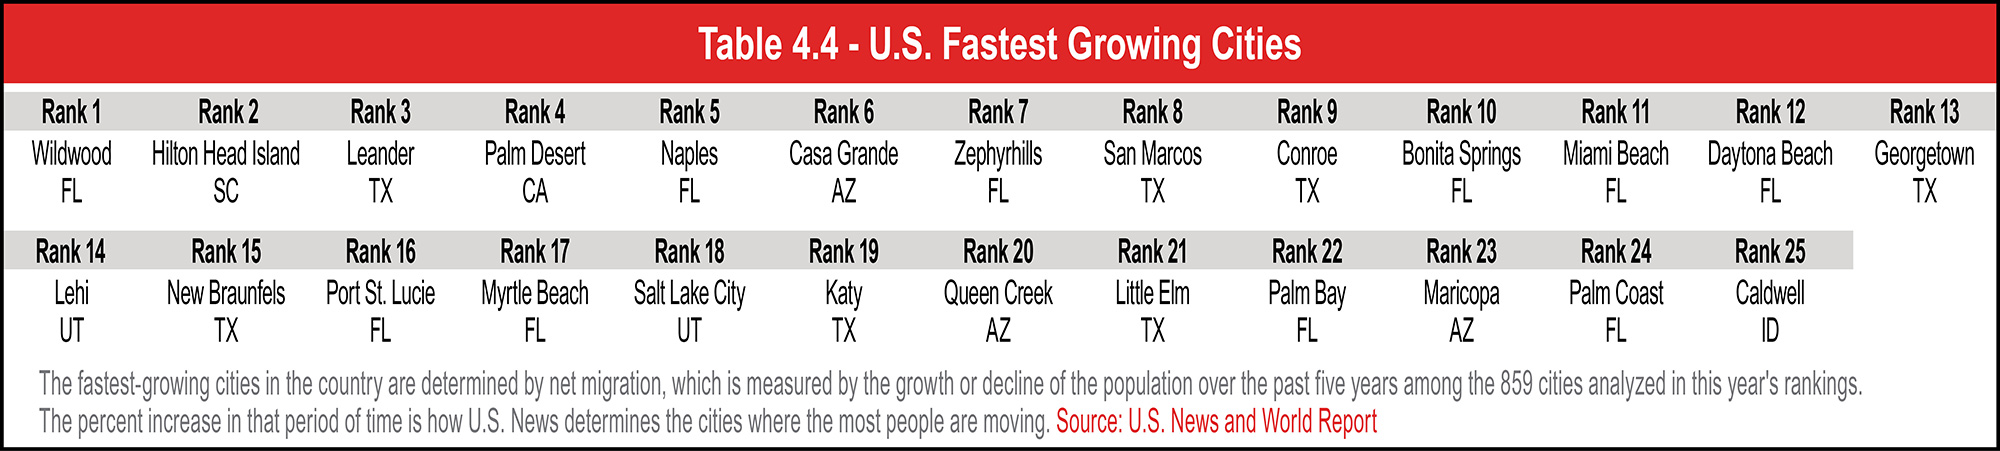
Over the long term, Americans are moving less. A report by North American Van Lines found that the number of individuals that moved in 2025 dropped 3 percent compared to 2024. Tennessee, North Carolina, and South Carolina have consistently ranked among the top inbound states since 2020, while California was the top outbound state for the second consecutive year.
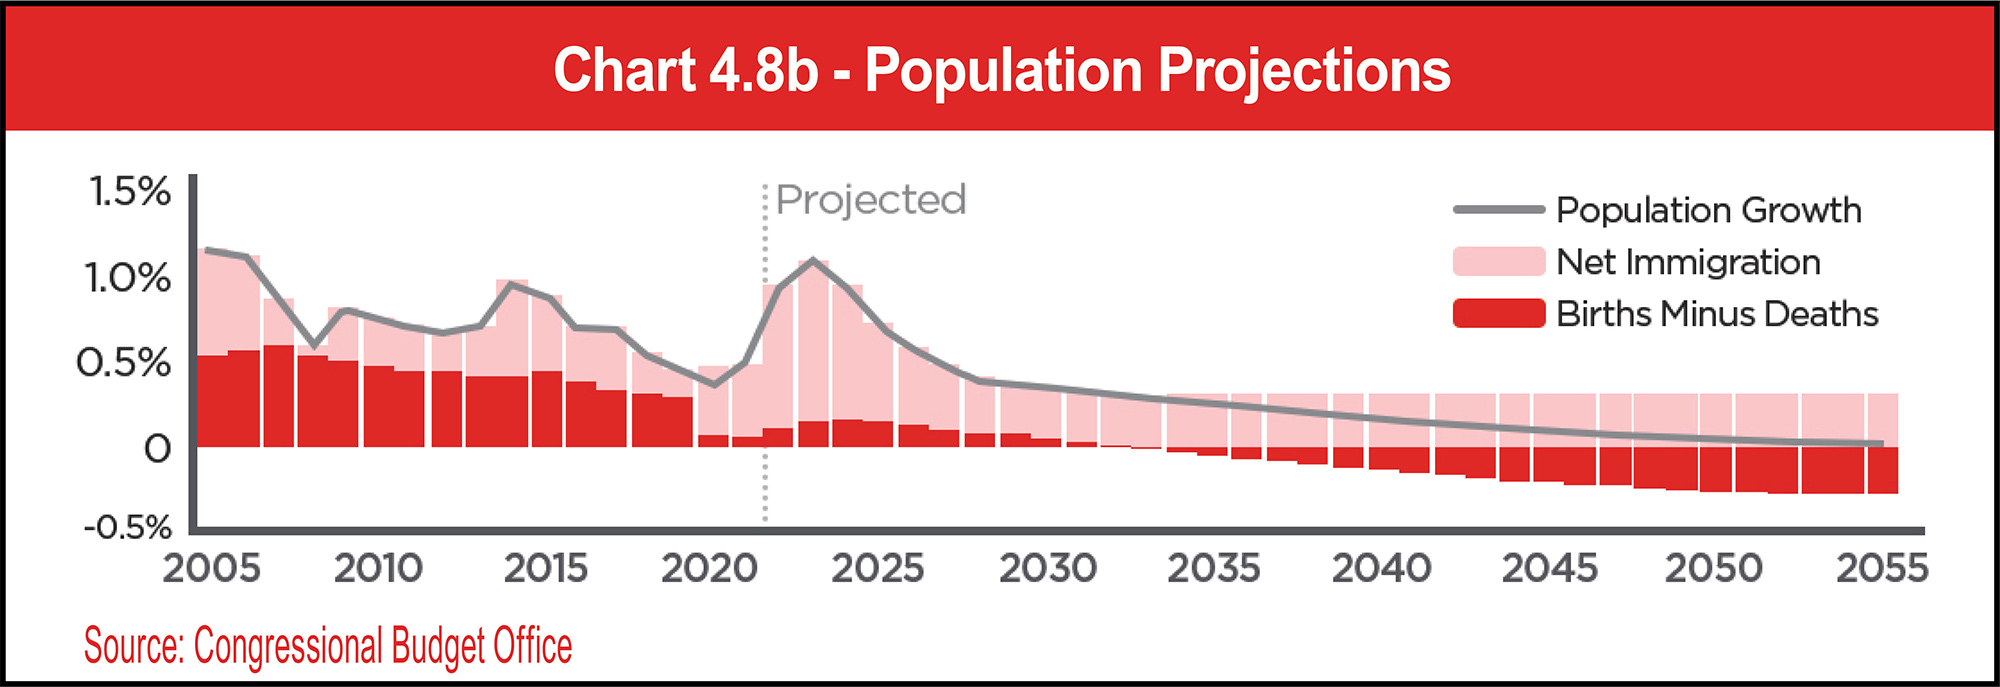
The size and age of the U.S. population have major implications for the economy and the federal budget, helping government agencies estimate the needs for services and infrastructure as well as anticipate forthcoming needs. The U.S. continues to experience robust population growth. Total population increased from 340.83 million in September 2024 to 342.74 million a year later, adding nearly 2 million people.
See Chart 4.8a.

See Chart 4.8b.
See Table 4.5.
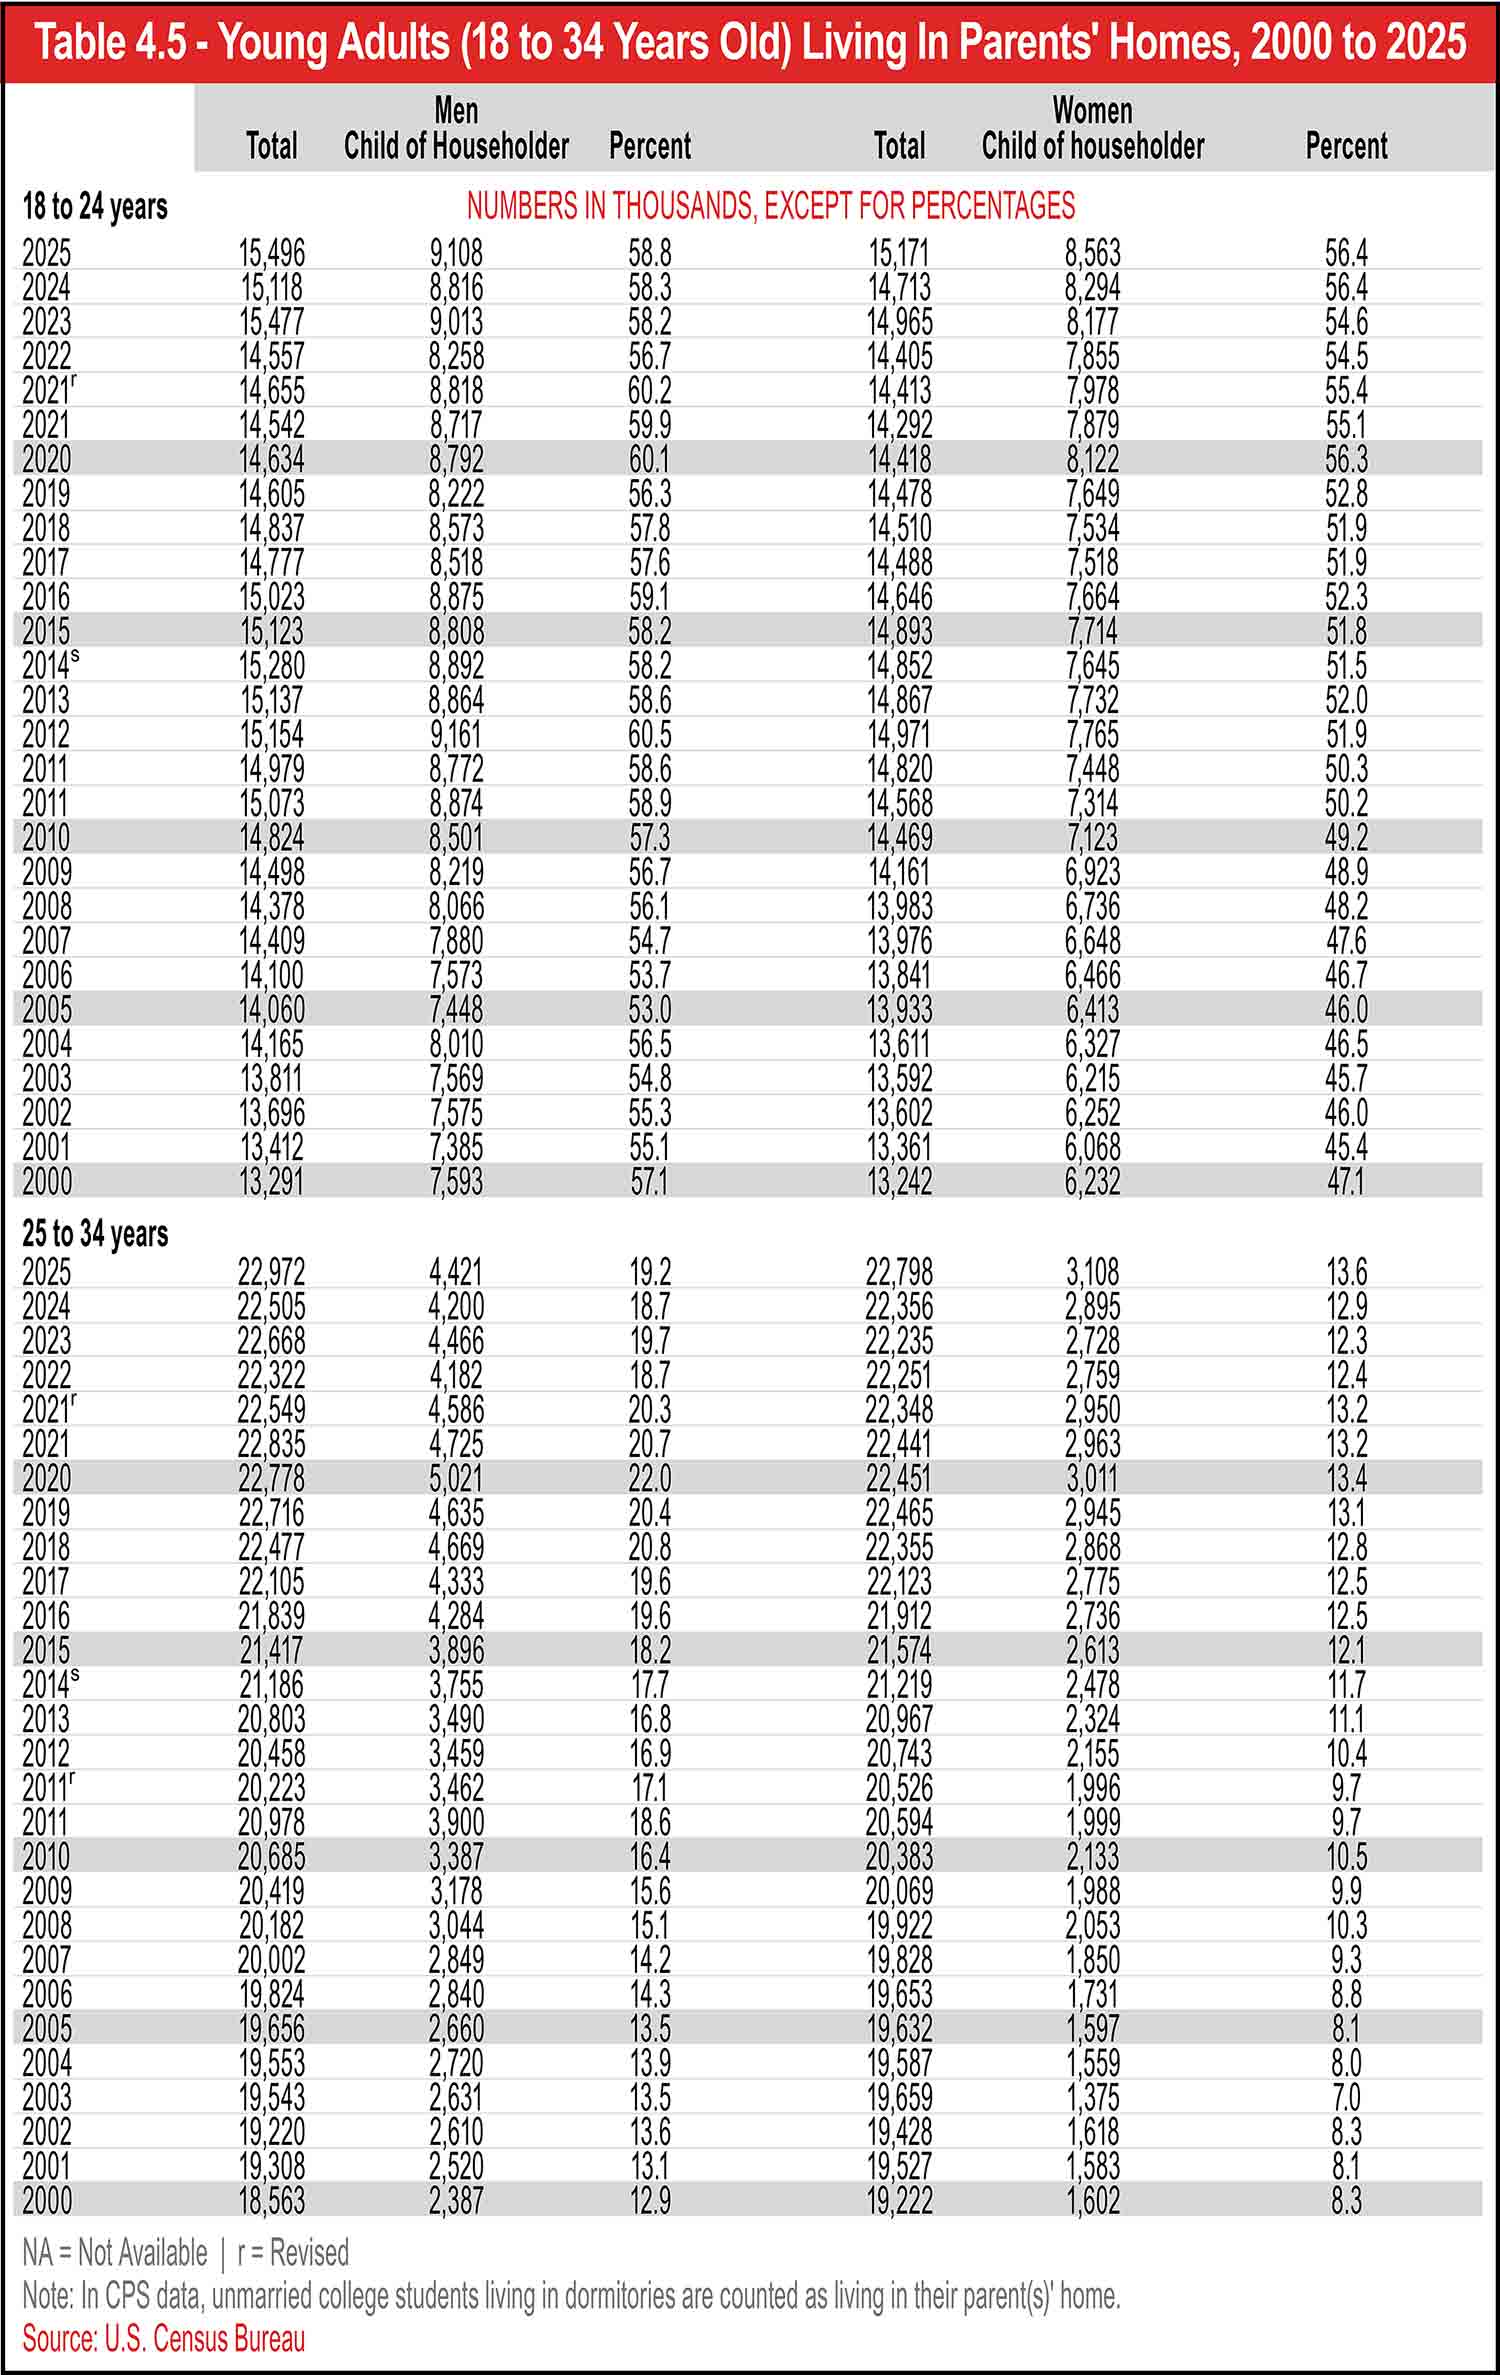
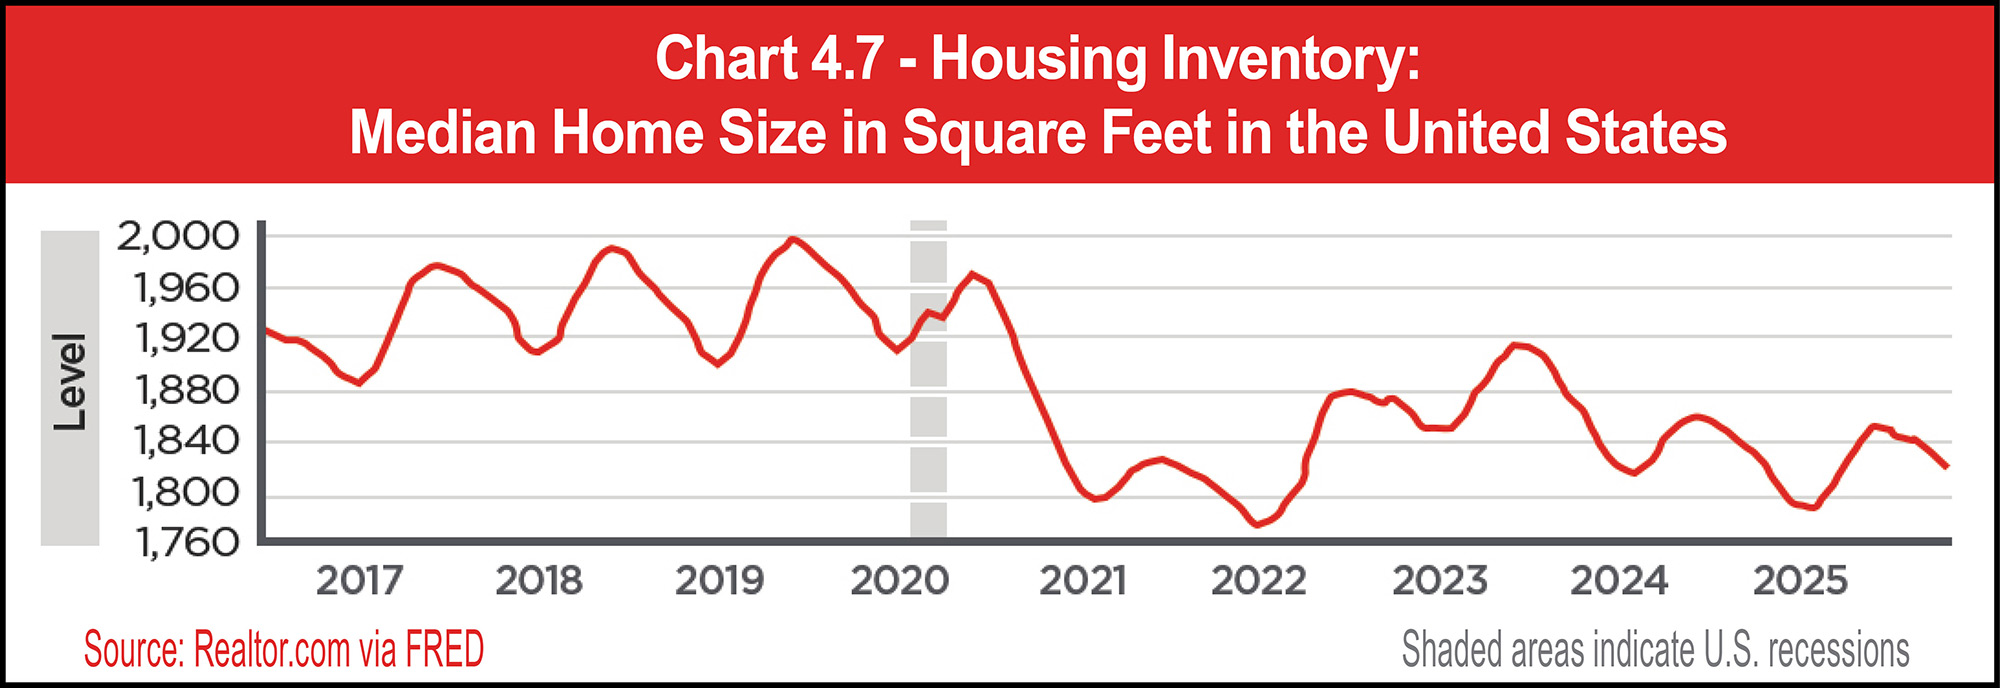
Shrinking household sizes and the rise of single-person households accompany the decline in traditional married-parent families. The average number of people per household was 2.5 in 2025, compared to 3.33 in 1960. The long-term decline of household sizes likely factors into the trend of home sizes shrinking in the last decade. The median home size was 1,820 square feet in November 2025, declining from a peak of 1,997 square feet in June 2019 (according to a Realtor.com data series starting in July 2016).
See Chart 4.7.




The future of the workforce is a major question mark heading into 2026. Many companies are racing to adopt AI tools, touting the technology’s potential to unleash innovation and productivity gains. While this presents significant upsides for employers, AI seems to have driven tens of thousands of job losses in 2025. Massive disruption to the U.S. and global workforce is a possibility if AI is widely adopted. Unemployment crept up in 2025 and AI could accelerate that trend, as employers focus on reducing their labor costs.
Inflation is another lingering uncertainty, with declining consumer confidence in the second half of 2025 reflecting concerns about stubbornly elevated costs. While inflation may ease in 2026, affordability concerns are becoming a major political issue. Housing affordability is a key part of this discussion as home prices keep rising and mortgage rates remain elevated, putting a damper on home sales activity. Median asking rents have seen a sustained decline, providing some relief.
Economic and demographic trends will continue to shape self-storage demand in 2026 and beyond. The declining mobility of the American population is a headwind for the industry, since movers seeking temporary storage are a core driver of demand. Shrinking home sizes, on the other hand, could prompt more people to seek extra space for their belongings. A sustained trend of people moving to more expensive, crowded metros could further support self-storage fundamentals in the years ahead.