

ccupancy data is arguably the hardest data to uncover when looking at any market. Unlike rental rates, there aren’t web scraping tools that gather occupancy data because the data is not publicly available on websites. One way to gather occupancy data in a market is by calling self-storage facilities in the area and asking for the data directly. Some owners and operators are willing to share this data as they realize the best way to improve total market efficiency is transparency, while others keep it confidential out of fear of losing a competitive edge.
Another way to get occupancy data is through publicly available sources. There are several publicly traded self-storage companies that publish quarterly and annual data on occupancy. Unless otherwise noted, the data in this section comes from two sources:
- Publicly traded self-storage companies (REIT same-store portfolios) and
- Storable, a leading management software company tailored to the self-storage industry. Storable has generously provided data for 25,000-plus same-store facilities.
Each company defines “same store” differently, but in general “same store” can be viewed synonymously with stabilized from a rental rate or occupancy perspective. Stabilized means that these stores have reached a steady state for occupancy and are no longer leasing up.
It is important to disclose that REIT occupancy in this section is not a representation of the entire self-storage industry. The REIT data presented is a small sample size compared to the rest of the industry. The number of facilities that make up the same-store pool for the four publicly traded REITs and U-Haul presented in this section does not exceed 7,000 facilities. That is less than 11 percent of the total number of facilities in the country. These facilities are also most likely the highest performers out of the entire industry, in the best condition, and located in the best markets. Storable’s same-store pool of 25,000-plus facilities (approximately 35 percent of the market) is likely a better representation of stabilized occupancy for the self-storage industry nationwide.
So, as you read this section, keep in mind that the data is showing occupancy for a small number of facilities on a stabilized basis; therefore, this data may not apply to your market or facility. Just because Extra Space is achieving 93 percent occupancy for a Class-A facility in downtown San Francisco doesn’t mean a self-storage professional should assume the same occupancy can be achieved for a Class-B self-storage facility located an hour away from San Francisco.
That being said, the data in this section is helpful in uncovering broad trends across the nation, across states, and across MSAs over time.
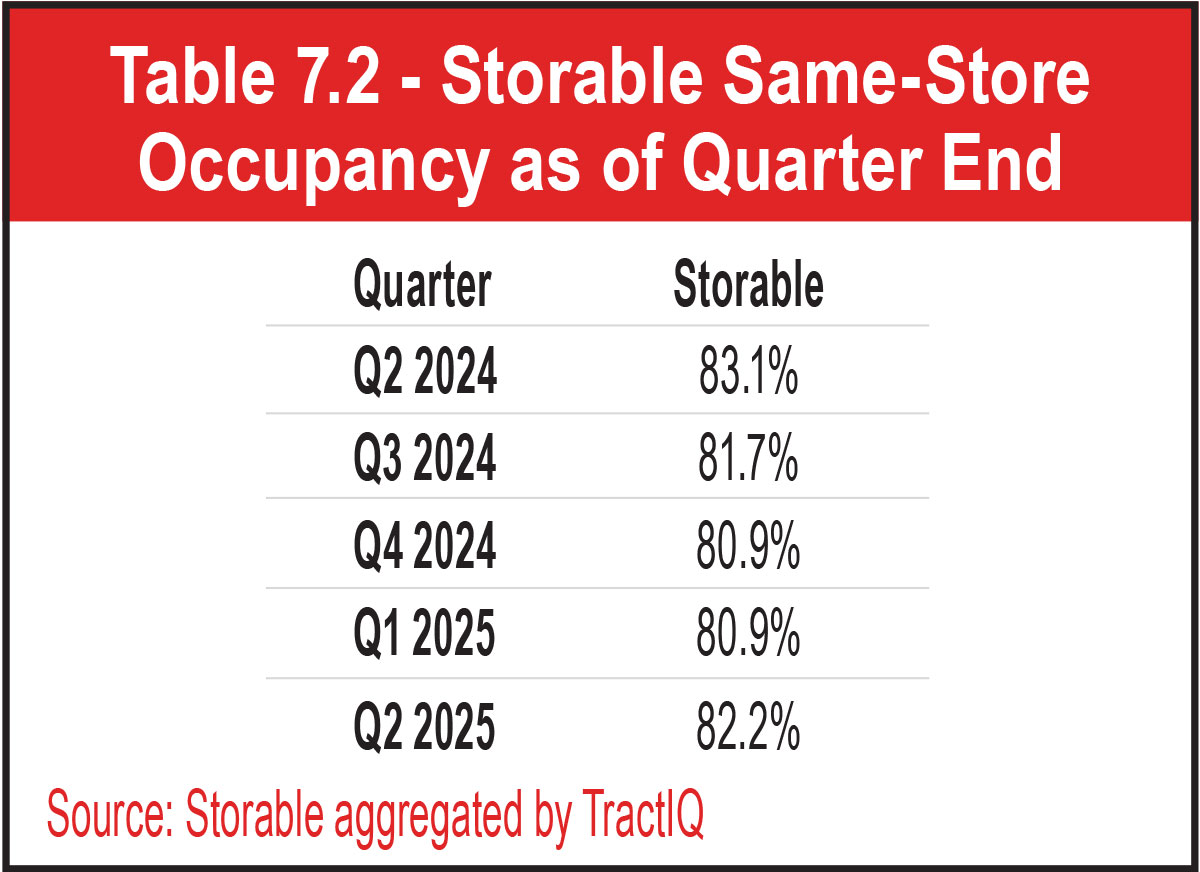
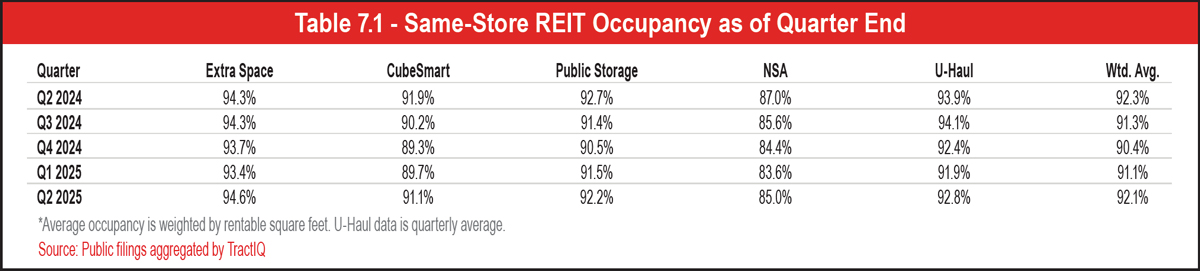
See Table 7.1, Table 7.2, Chart 7.1, and Chart 7.2.
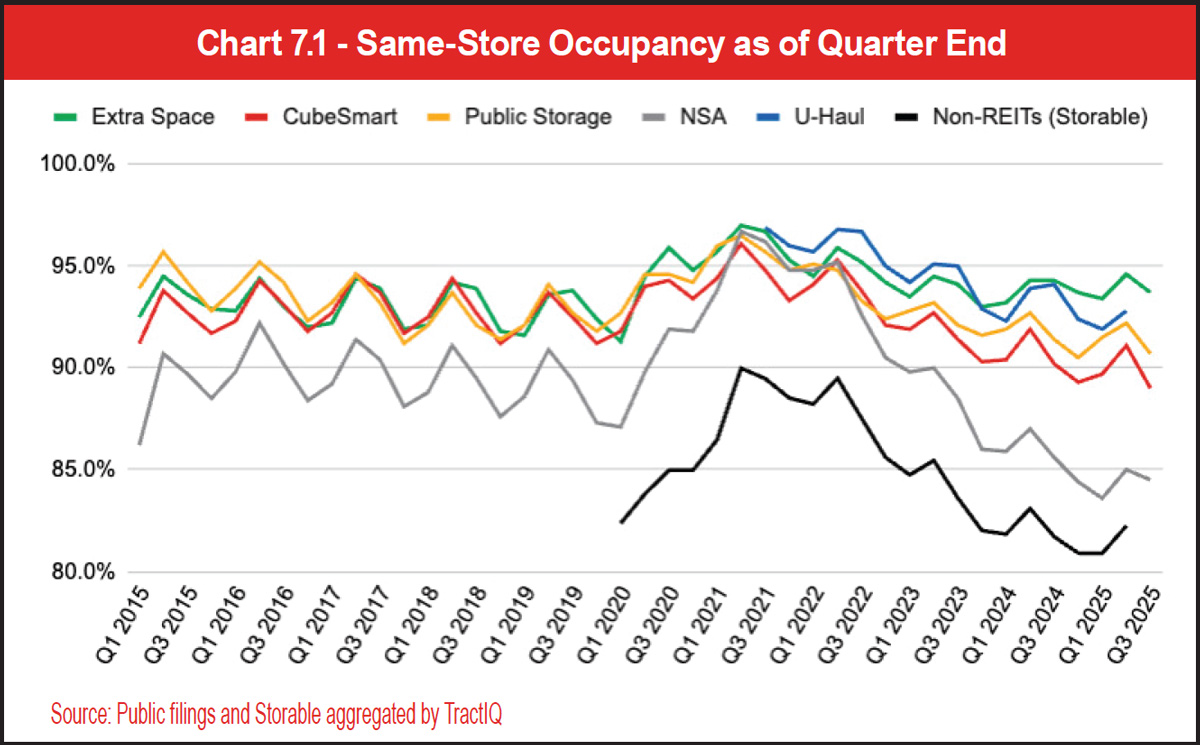
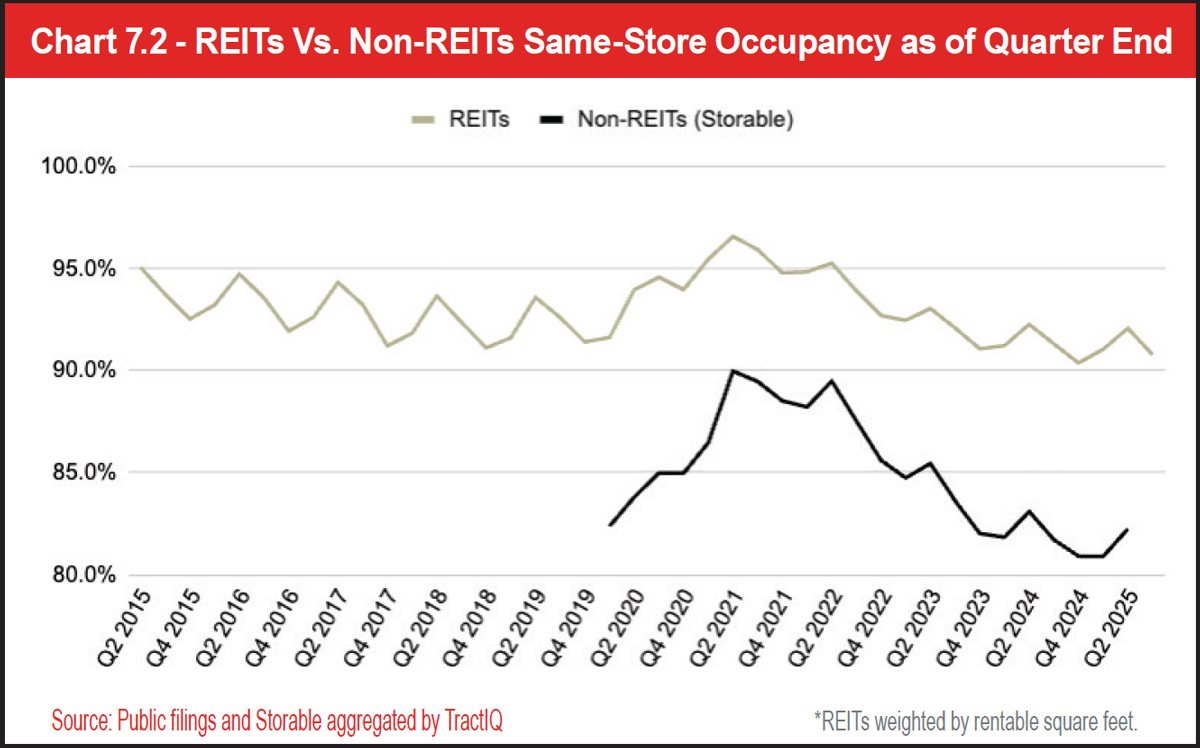
You will also notice distinct peaks and valleys in the charts showing increased occupancy in the summer months and decreased occupancy in the winter months. This highlights the seasonal nature of the self-storage business. Residential migration is typically higher in warmer months, increasing the need for self-storage. The occupancy data highlights this trend, but years 2020 to 2025 look less uniform than the years 2015 to 2019. A pandemic resulting in higher-than-normal residential mobility created increased demand for self-storage, as can be seen in the occupancy data from 2020 to 2021. Subsequently, the industry experienced inflation, higher interest rates, and general uncertainty from 2022 to 2025, which has brought occupancy back down to more normal levels. Although self-storage sees demand from customers in all stages of life, good or bad, self-storage is not immune to the volatility we’ve seen in recent history, as evidenced by the occupancy data.
See Charts 7.3, 7.4, 7.5, 7.6, 7.7, 7.8, and 7.9.
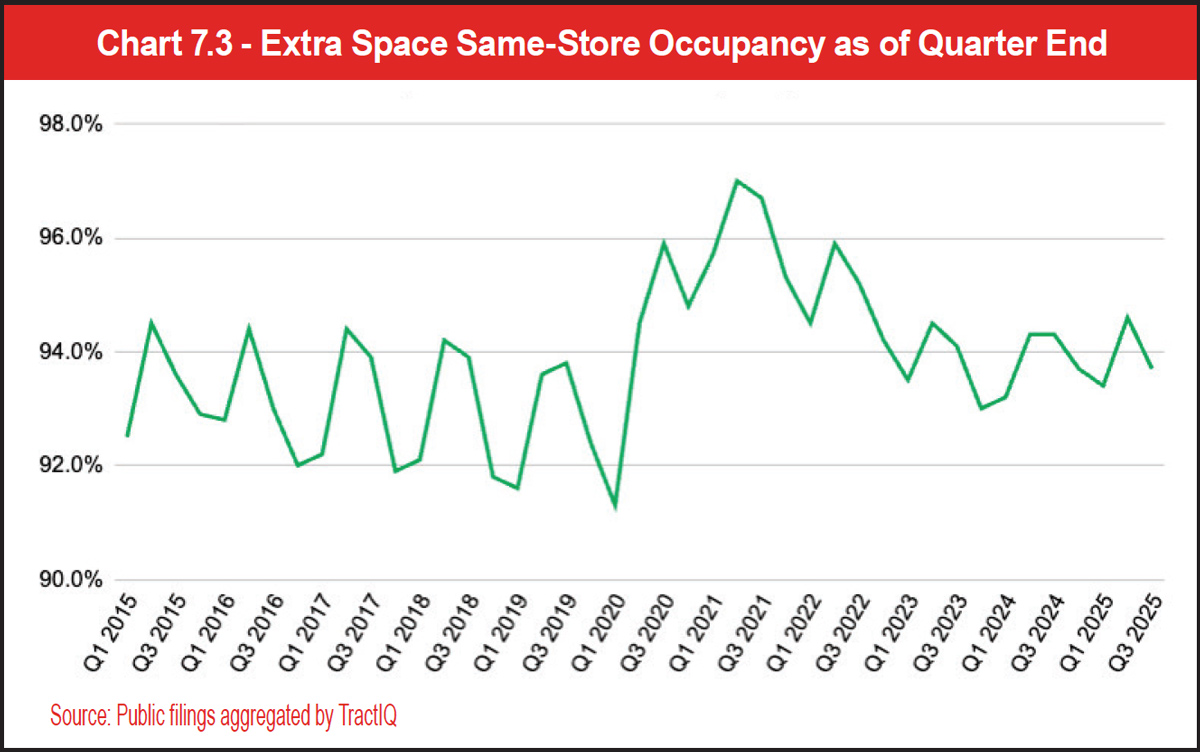
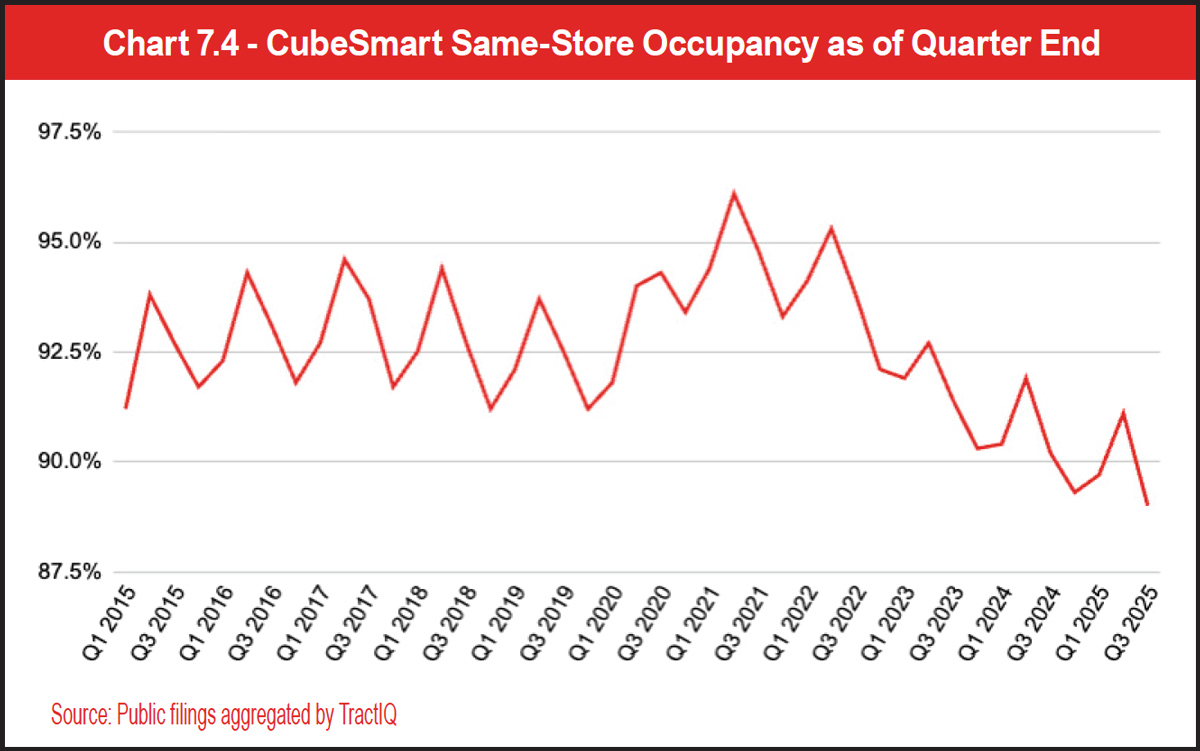
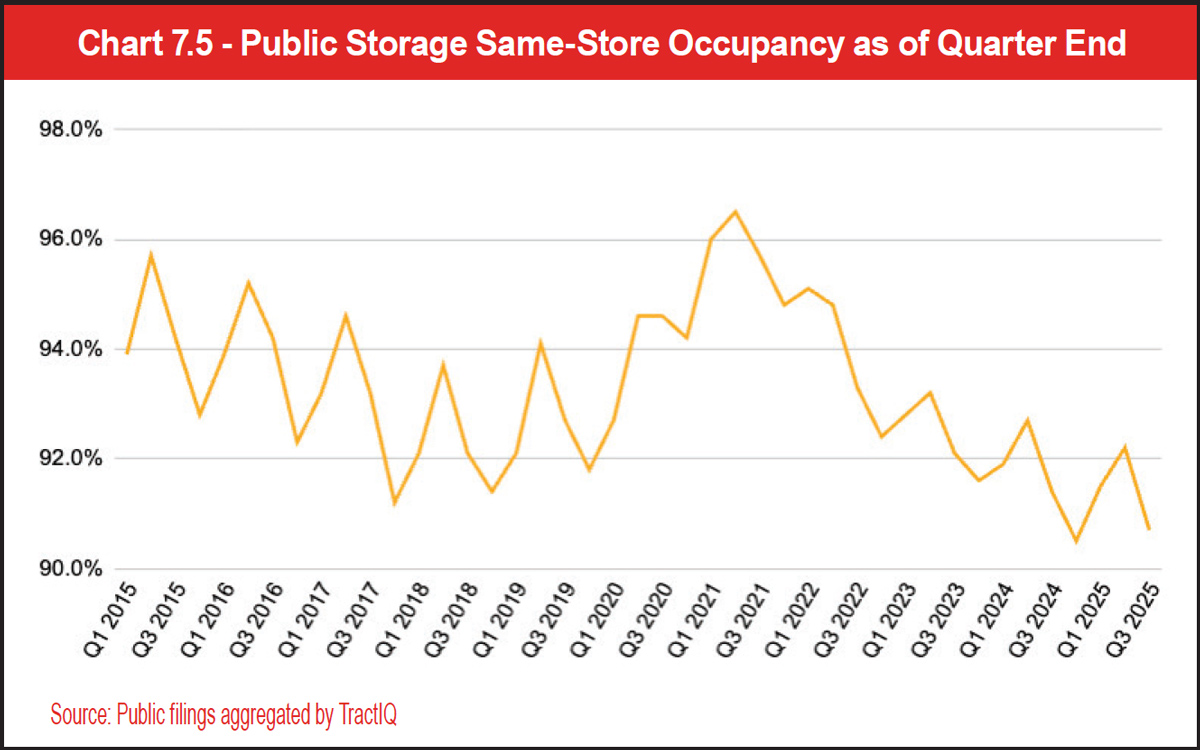
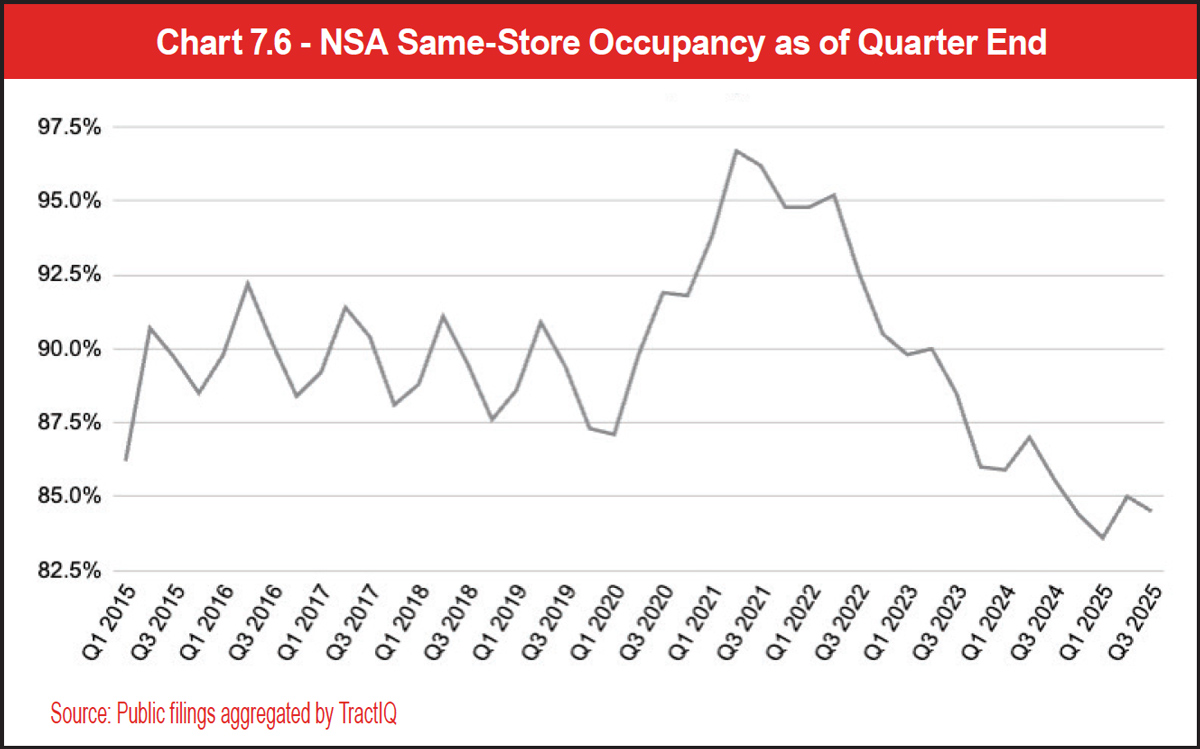
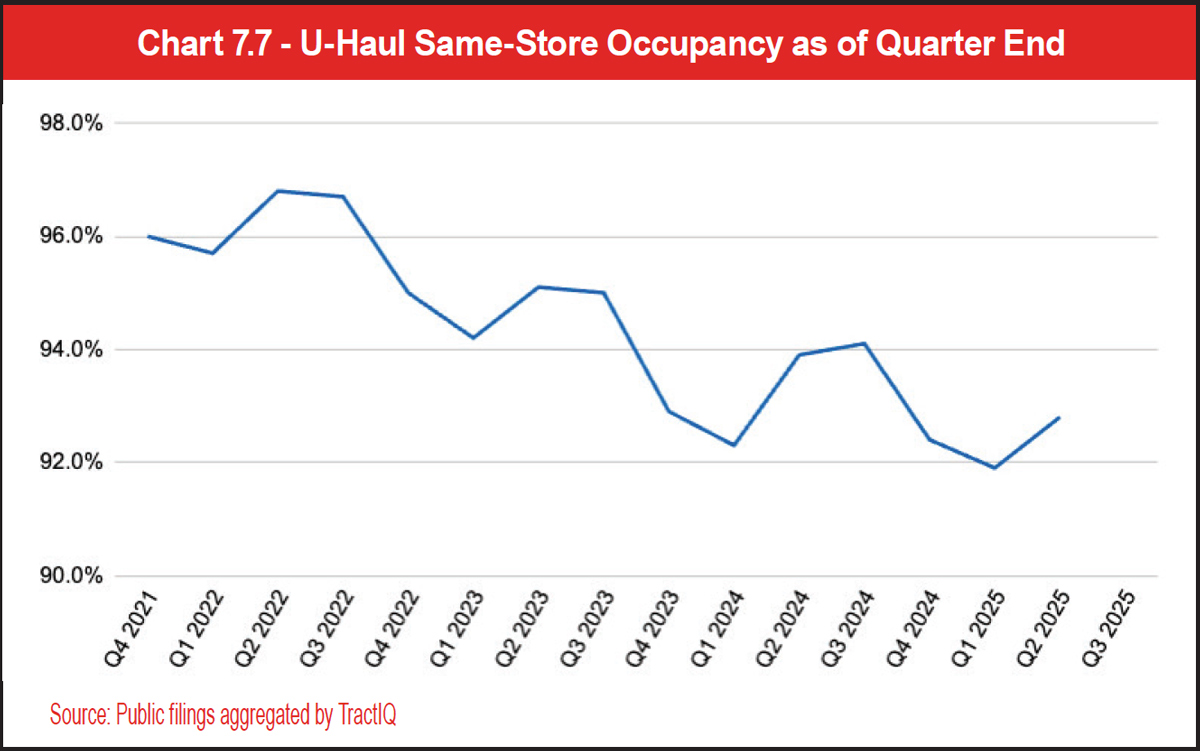
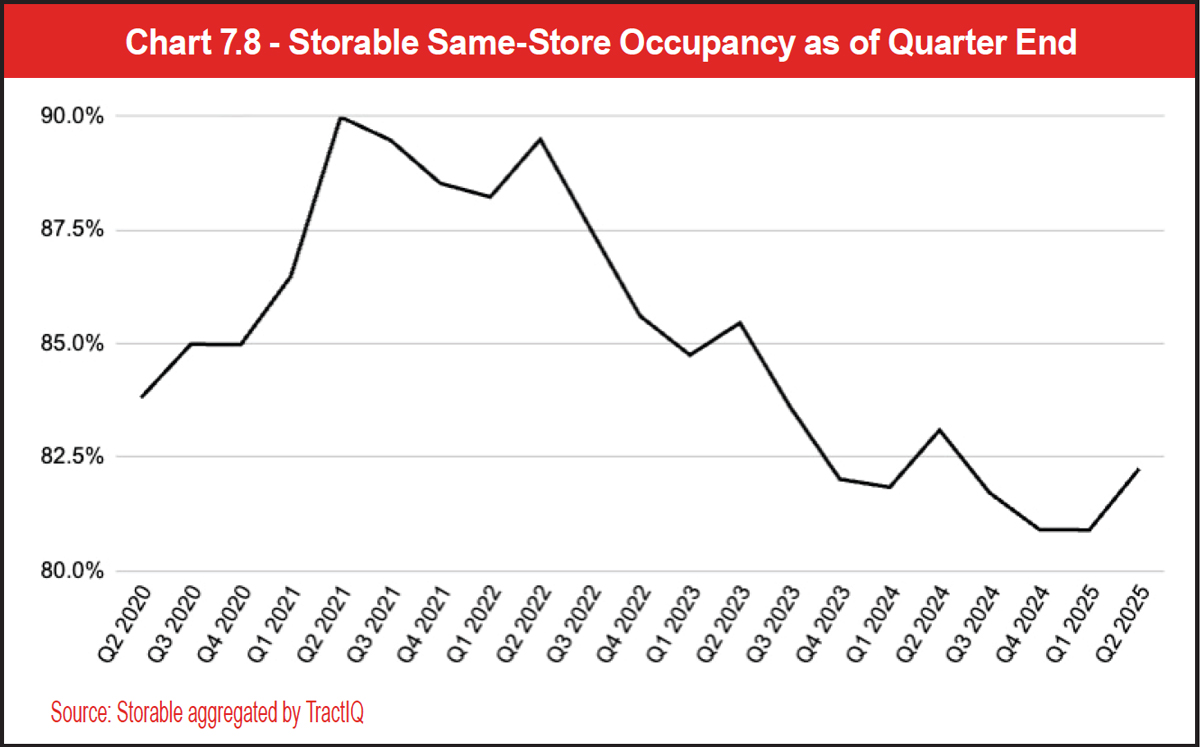
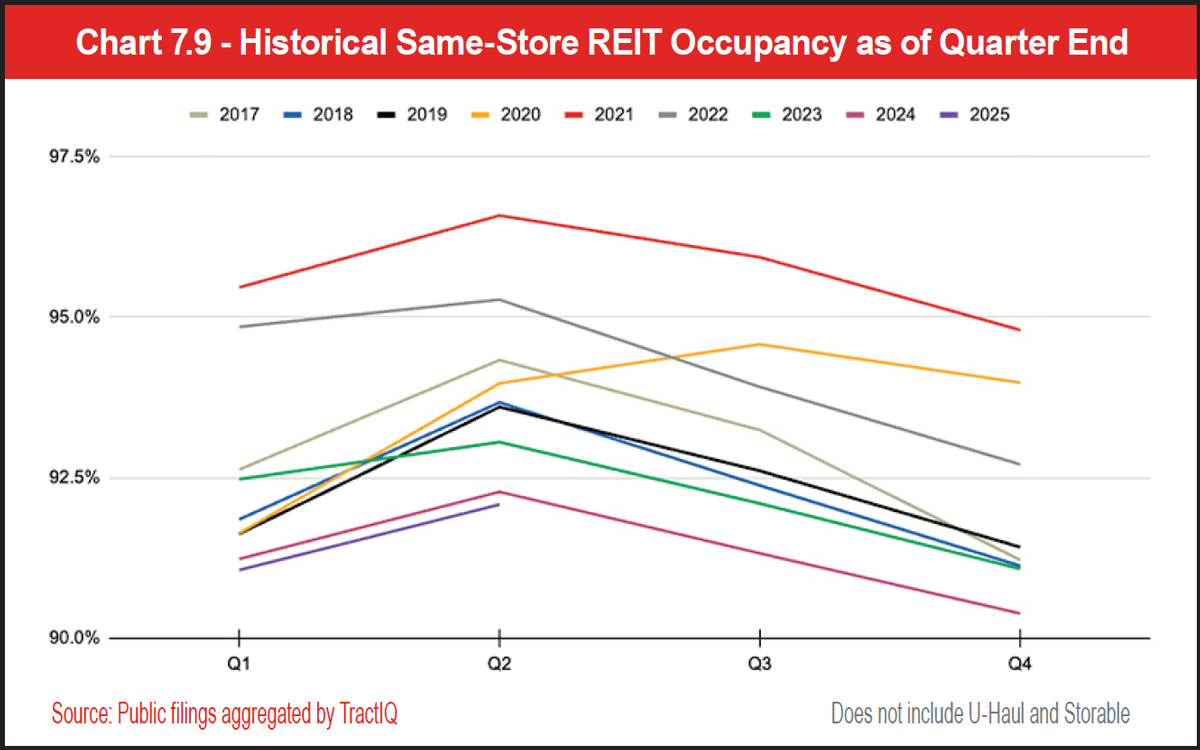
- Seasonality – You will notice distinct highs and lows in the chart showing increased occupancy in Q2/Q3 and decreased occupancy in Q4/Q1. The data highlights a higher need for storage during the spring/summer months, when residential migration is typically higher.
- 2020 was abnormal – The COVID-19 pandemic year created outsized demand for self-storage due to increased residential mobility, which is why Q3 and Q4 occupancy were higher than Q2 for that year (the only time this has happened in the last eight years).
- 2025 hits rock bottom – The first 2 quarters of 2025 have recorded the lowest occupancy levels since 2017. Inflation, high interest rates, and general uncertainty have been challenges for the overall real estate market since 2022, resulting in lower occupancy. It will be interesting to see if occupancy has truly bottomed out, or if 2026 will set a new record.
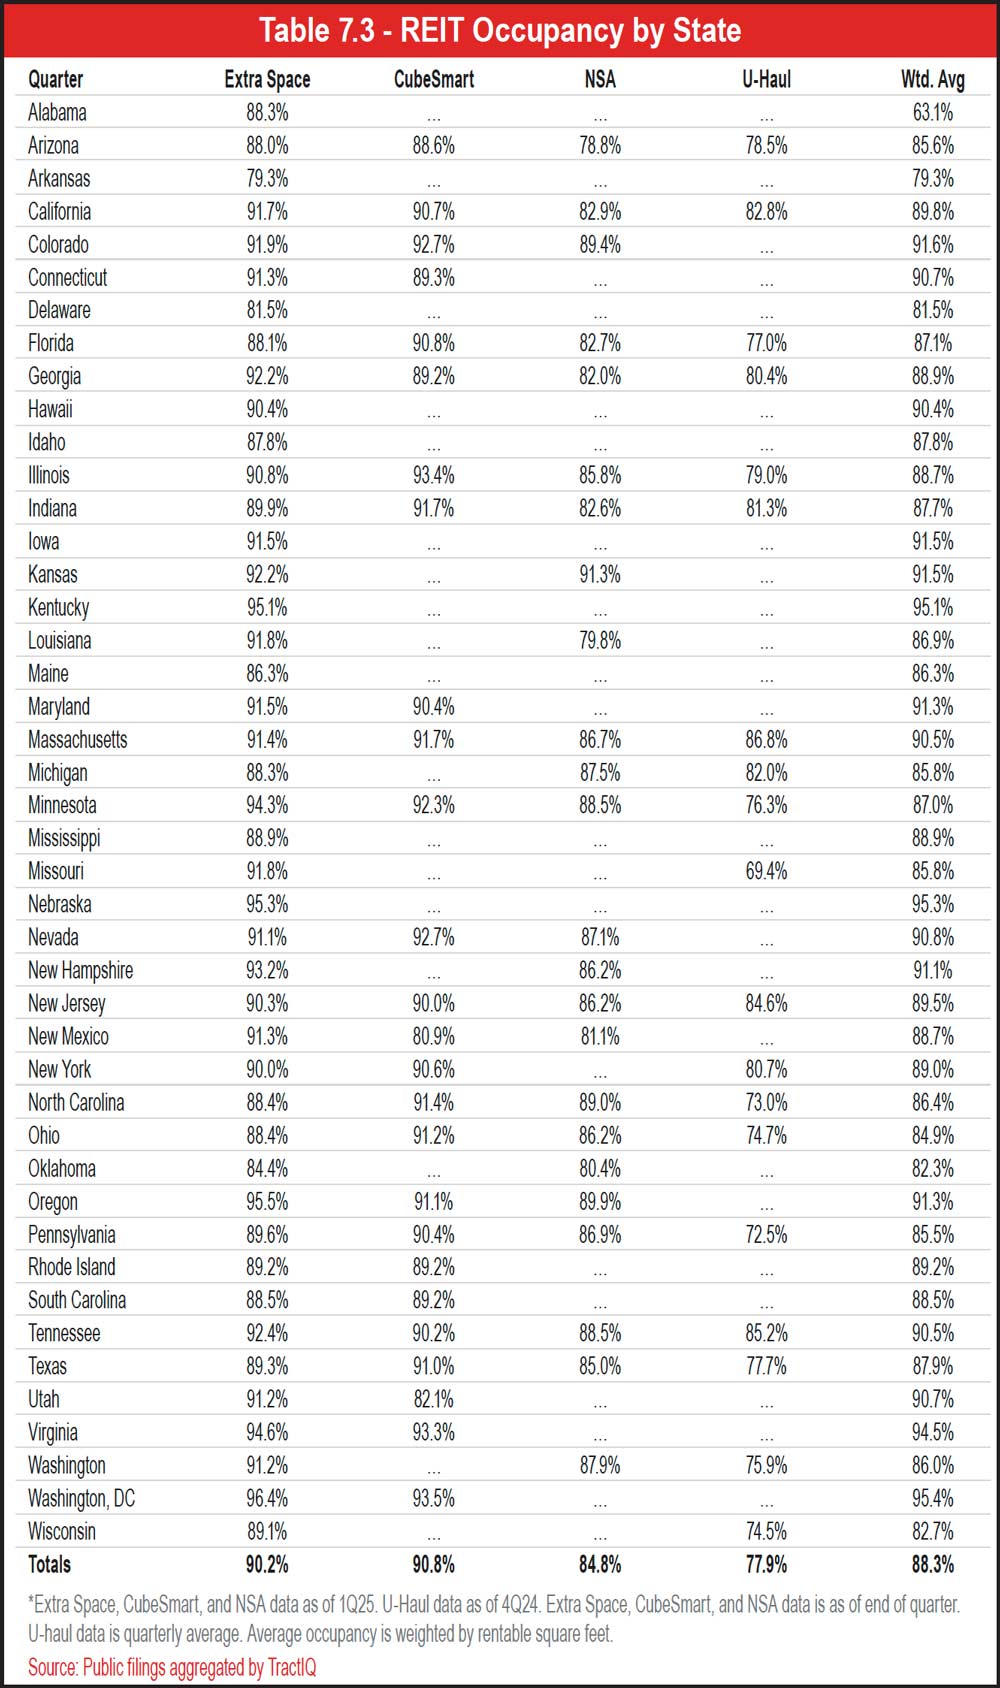
The data in Table 7.3 shows occupancy by state from Extra Space, CubeSmart, U-Haul, and NSA. This data includes same-store and non-same-store facilities, which means this data includes facilities that are stabilized and those that are not. Non-stabilized facilities could include facilities that just finished construction and are leasing up, or facilities that just finished leasing up but need more time to increase and mature rental rates. This state data is interesting because it gives a more realistic understanding of where REIT occupancy actually stands across each state and the nation.
See Table 7.3.
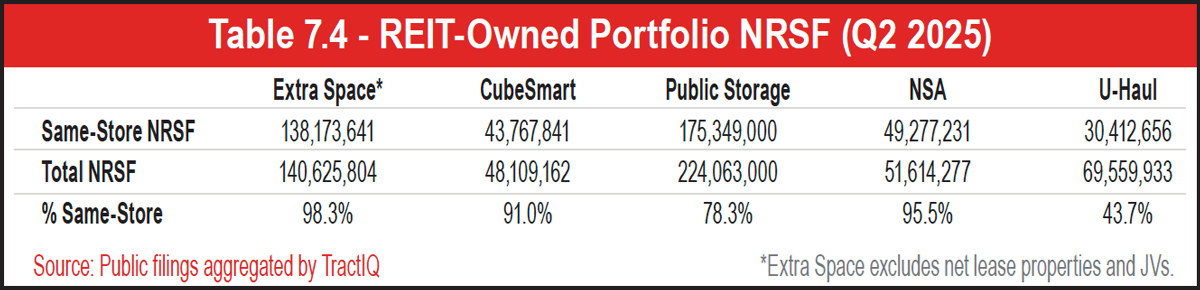
See Table 7.4.
There are 16 states that report occupancy above 90 percent: Colorado, Connecticut, Hawaii, Iowa, Kansas, Kentucky, Maryland, Massachusetts, Nebraska, Nevada, New Hampshire, Oregon, Tennessee, Utah, Virginia, and Washington, D.C. The rest of the states report occupancy between 80 percent and 90 percent. Please keep in mind the data may be skewed from two angles: limited reporting from multiple sources and limited facilities included in the reporting. For example, Extra Space Storage is the only company that reports occupancy for Arkansas, and their sample size is only 4 facilities.
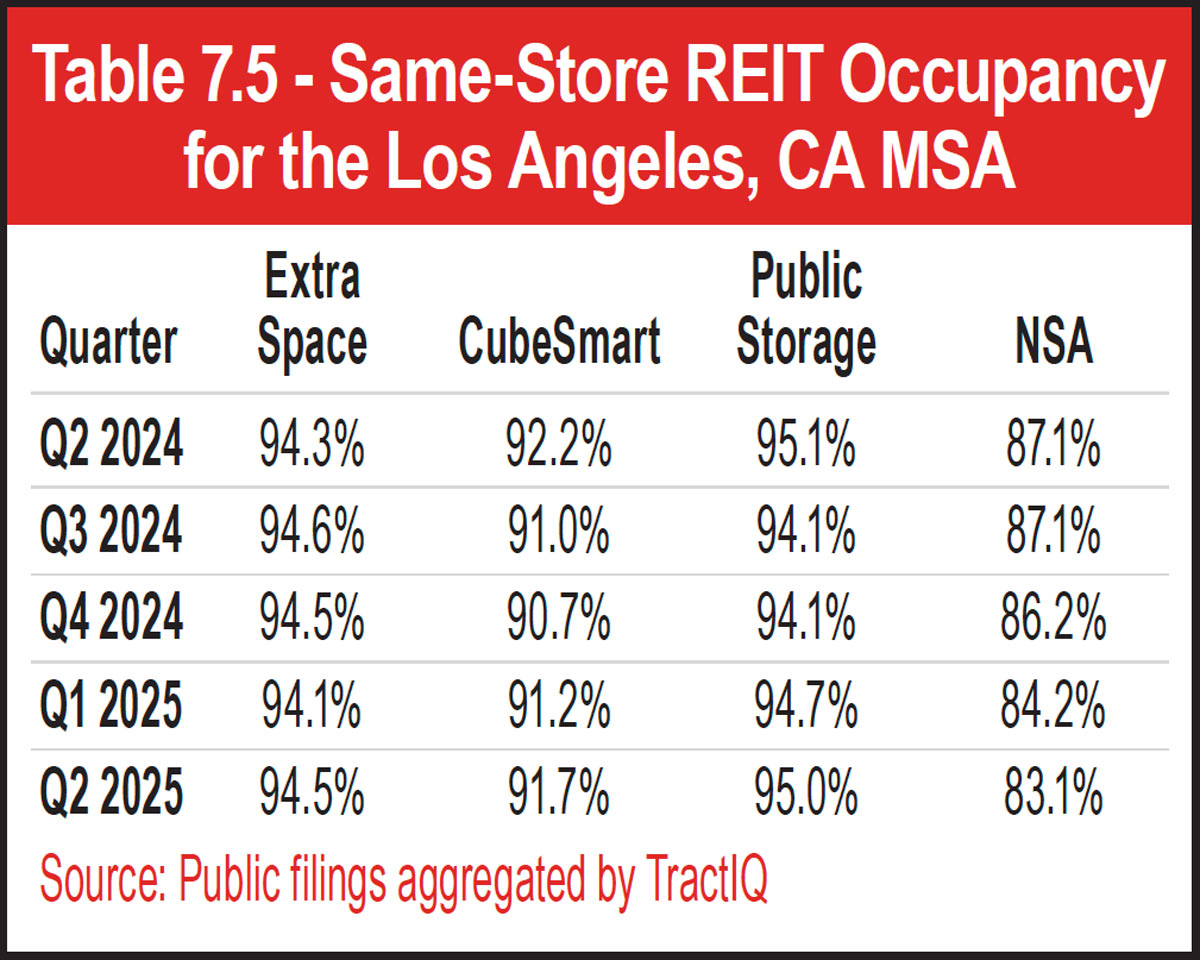
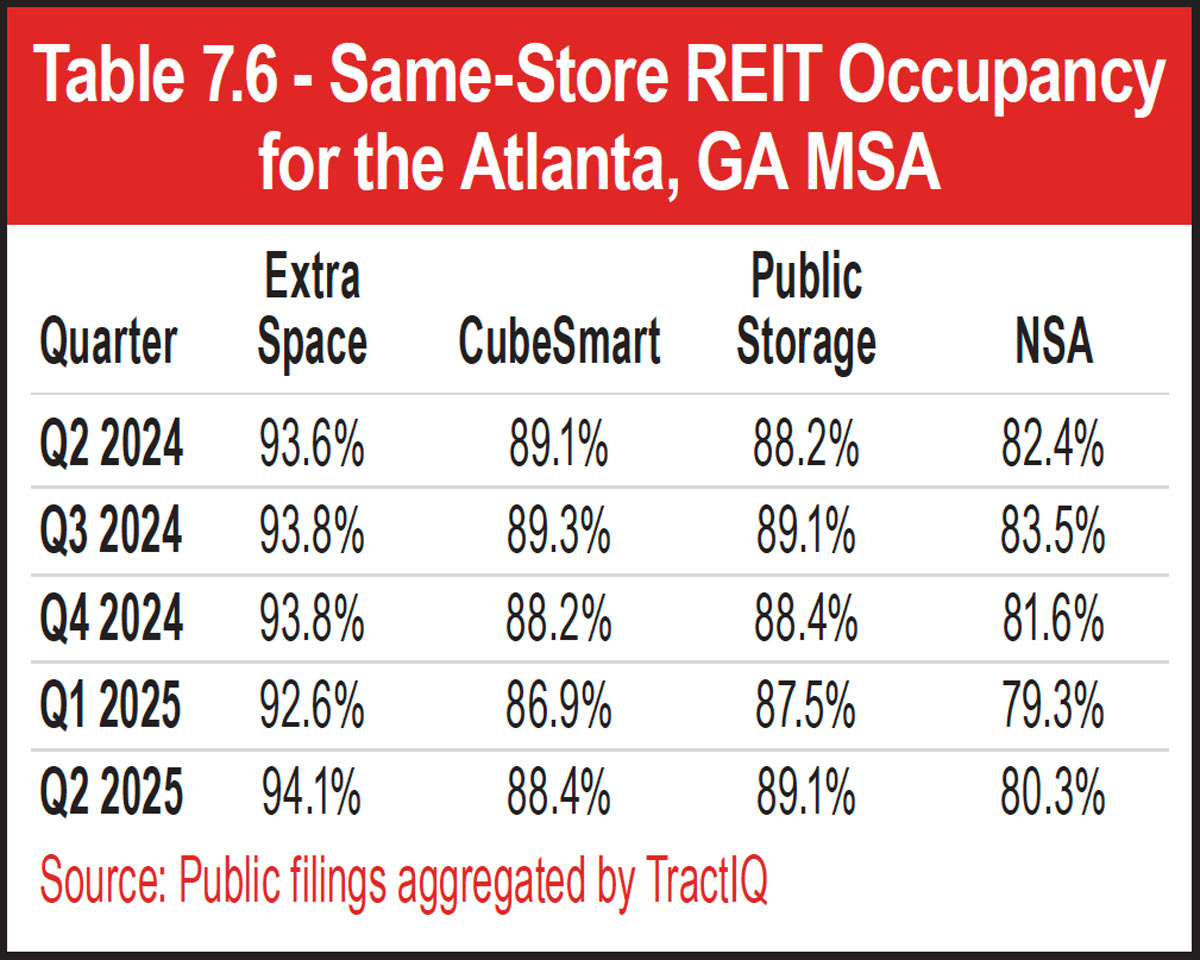
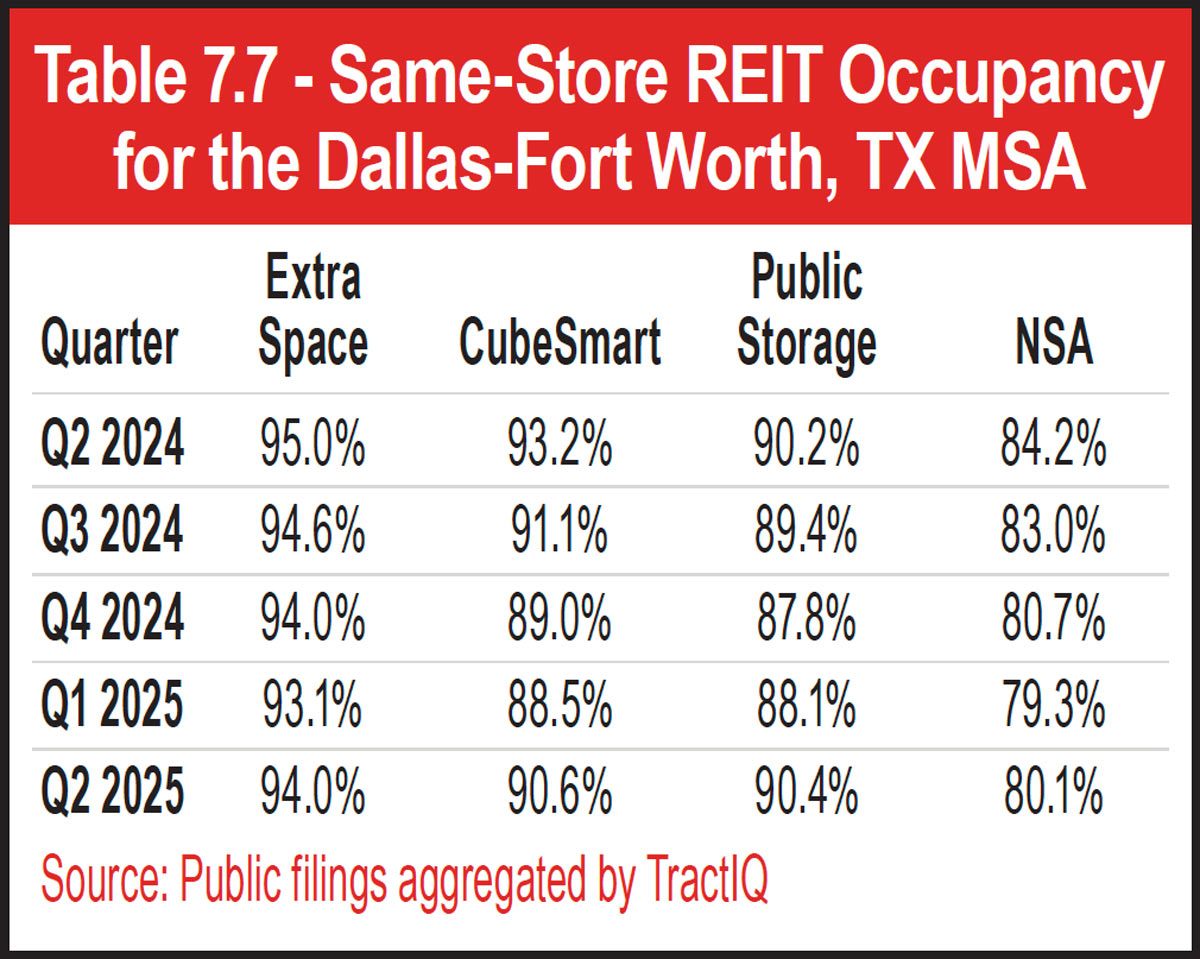
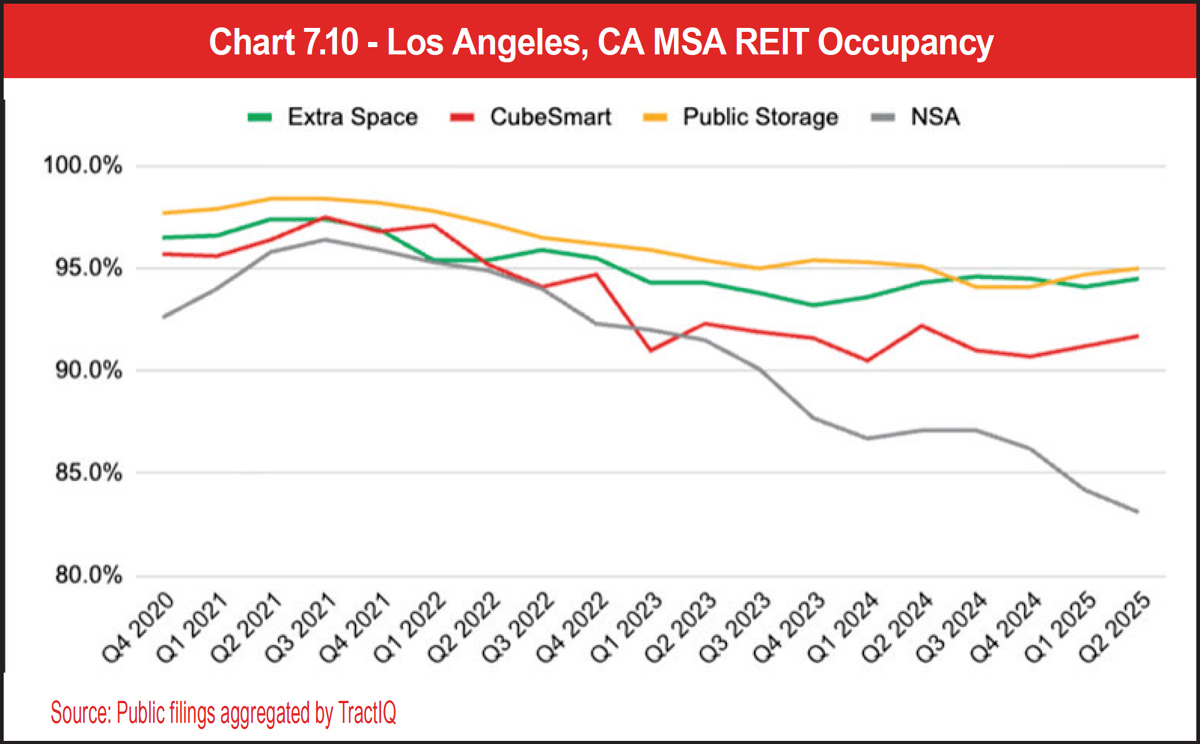
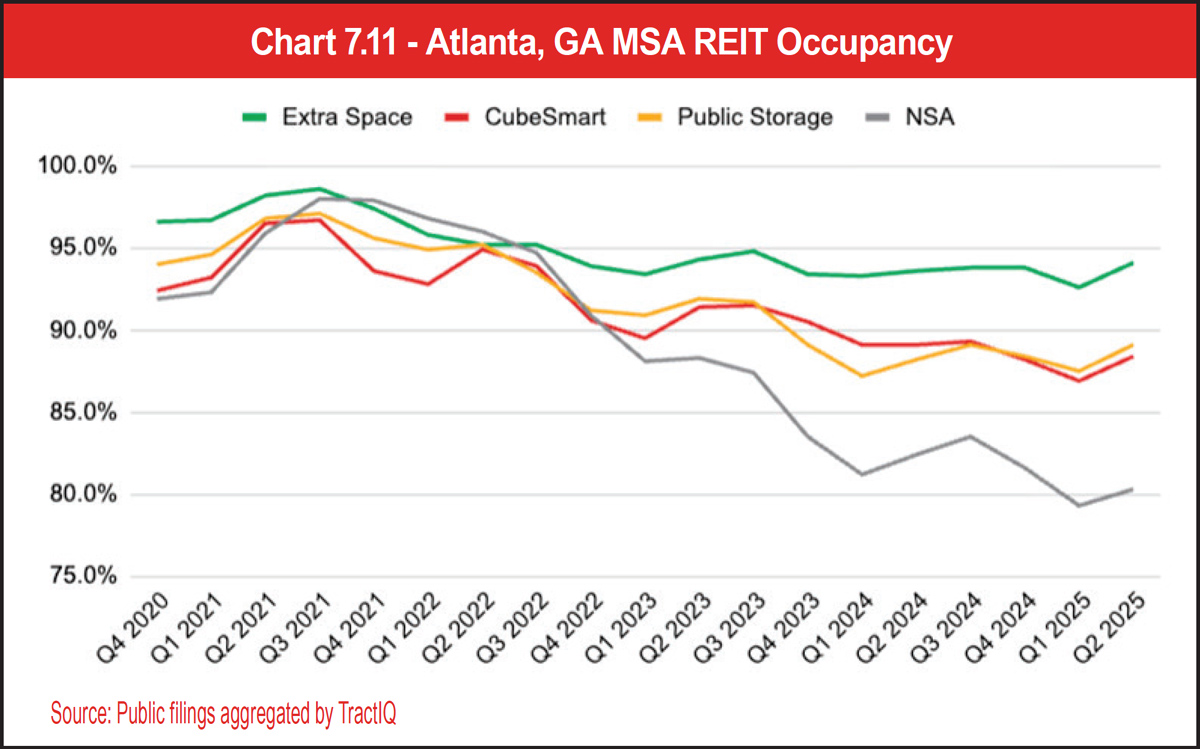
In Tables 7.5, 7.6, and 7.7, we can see occupancy data for Los Angeles, Atlanta, and Dallas. Dallas and Atlanta experienced self-storage booms during the COVID-19 pandemic (2021 to 2022) due to higher residential mobility. As a result, developers felt justified in building more self-storage during this time for these MSAs. On the other hand, Los Angeles was an MSA that experienced emigration during the COVID-19 pandemic. Less self-storage supply was introduced in Los Angeles than Dallas and Atlanta during this time. In general, MSAs that overbuilt self-storage facilities due to the pandemic boom underperformed during 2023 to 2024, and as of the second quarter of 2025, these MSAs are now seeing signs of recovery from an occupancy perspective. This is supported by the Los Angeles, Dallas, and Atlanta occupancy data shown in Charts 7.10, 7.11, and 7.12.
See Tables 7.5, 7.6, and 7.7.
See Charts 7.10, 7.11, and 7.12.
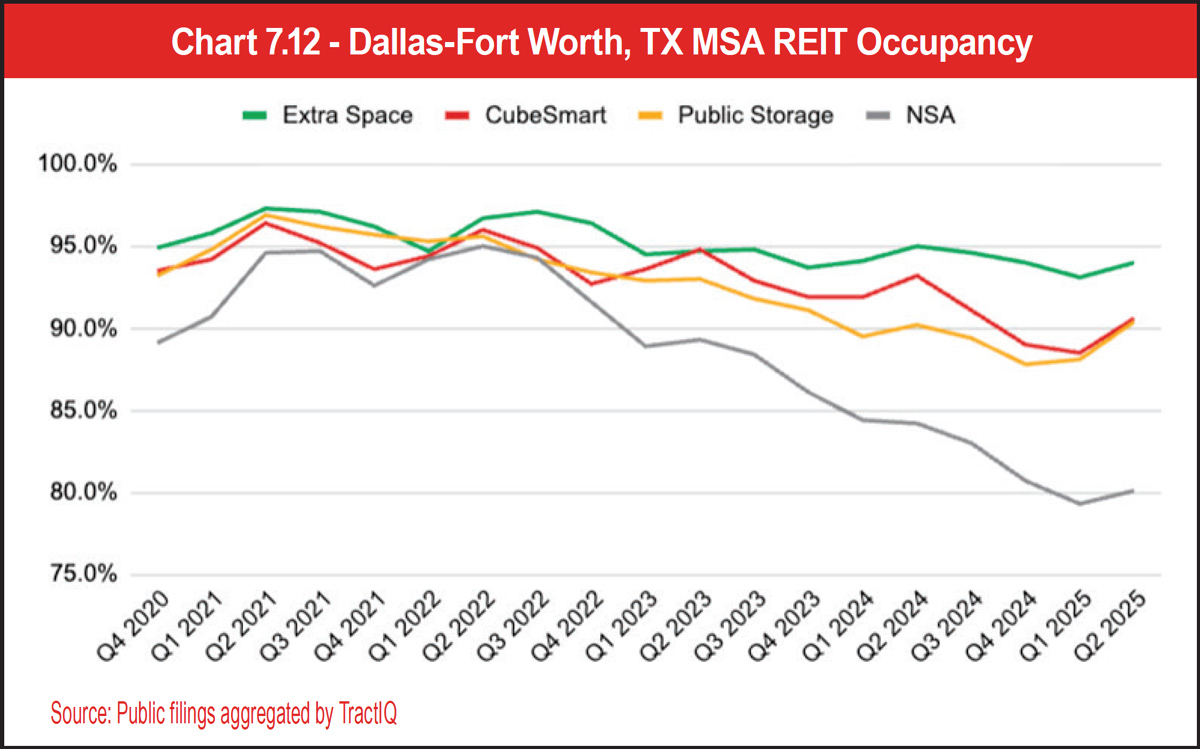
See Tables 7.8, 7.9, 7.10, 7.11, 7.12, 7.13, 7.14, 7.15, 7.16, 7.17, and 7.18.
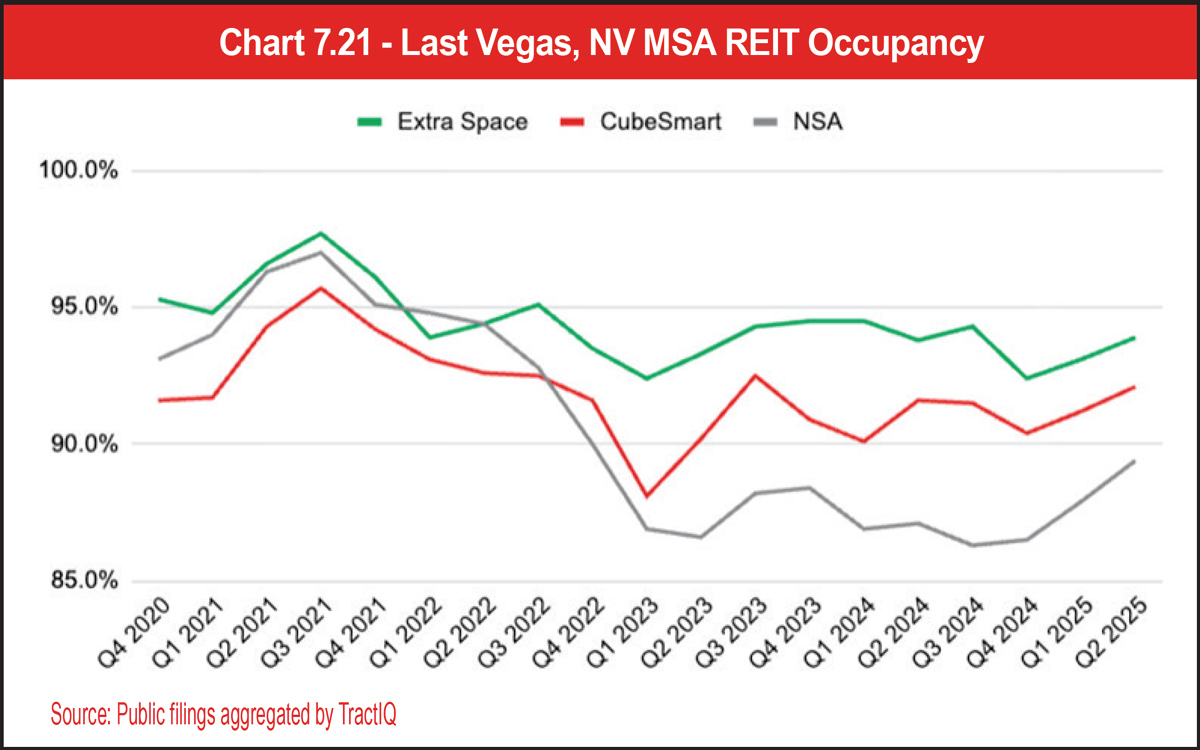
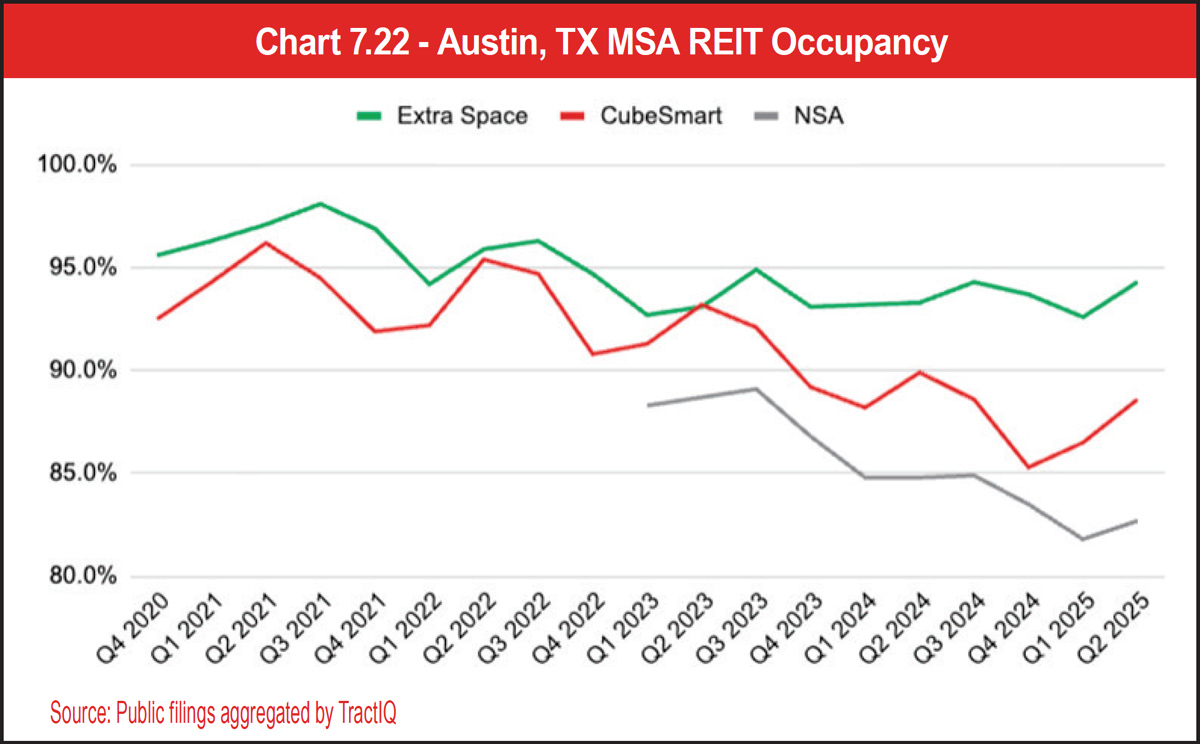
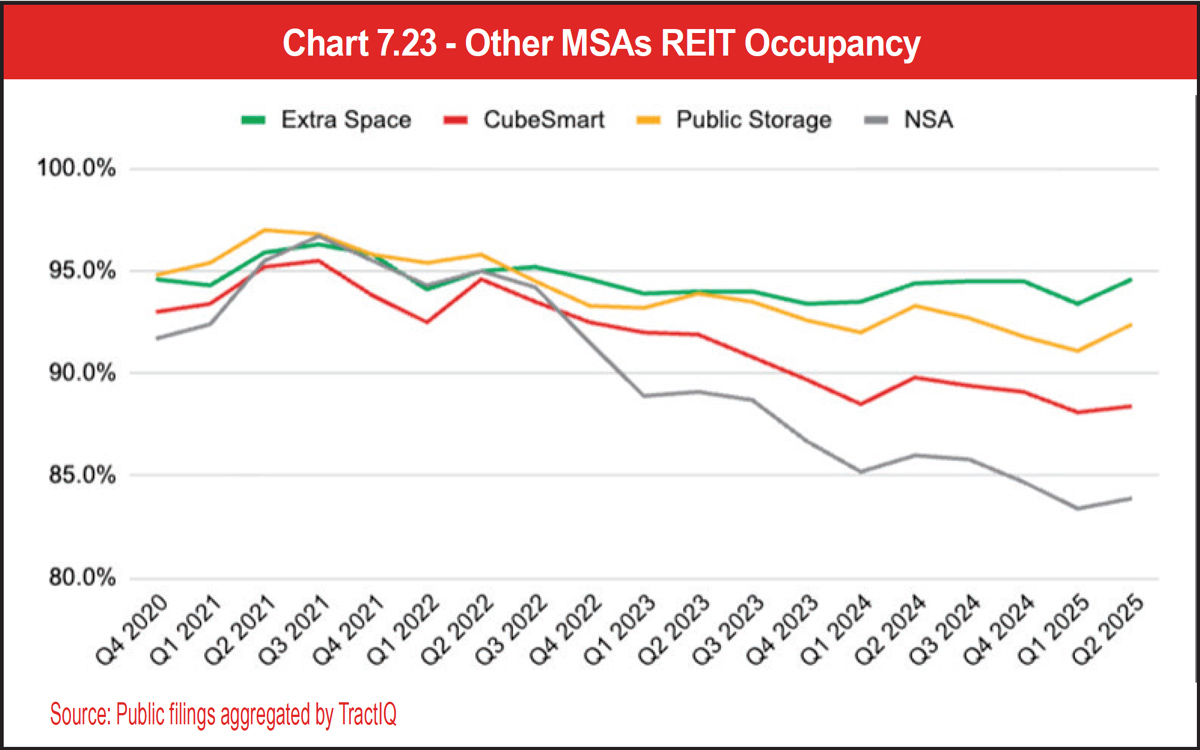
See Charts 7.13, 7.14, 7.15, 7.16, 7.17, 7.18, 7.19, 7.20, 7.21, 7.22, and 7.23.
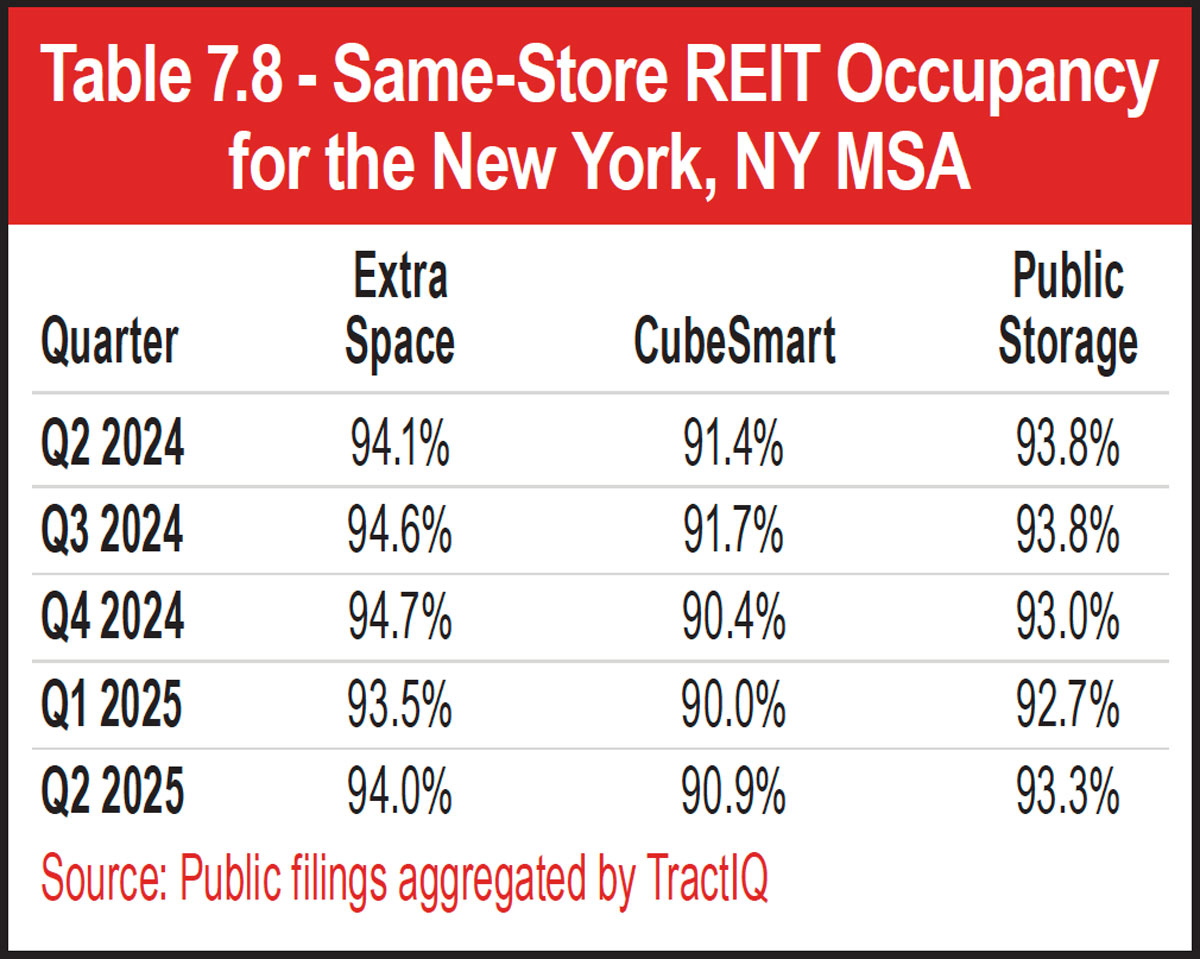
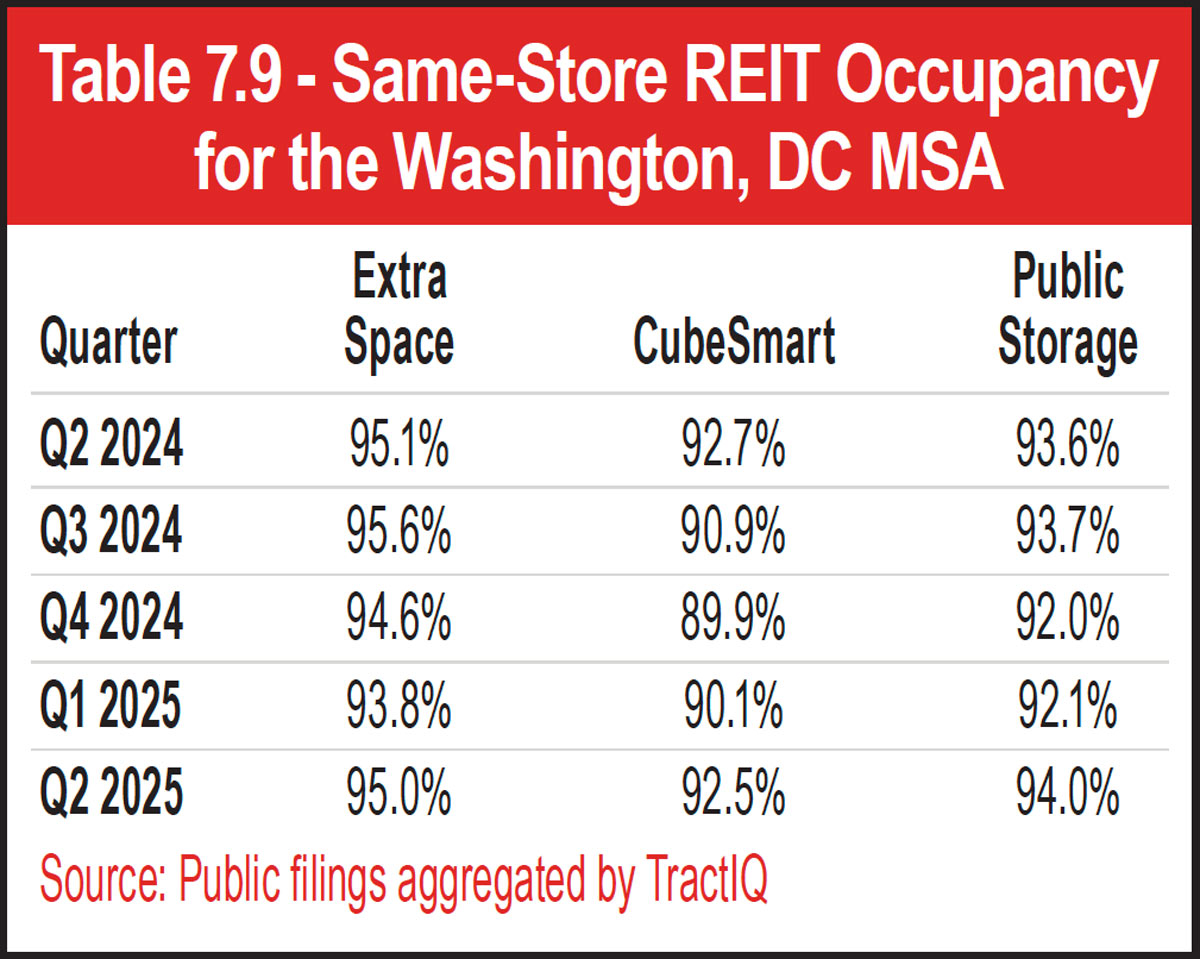
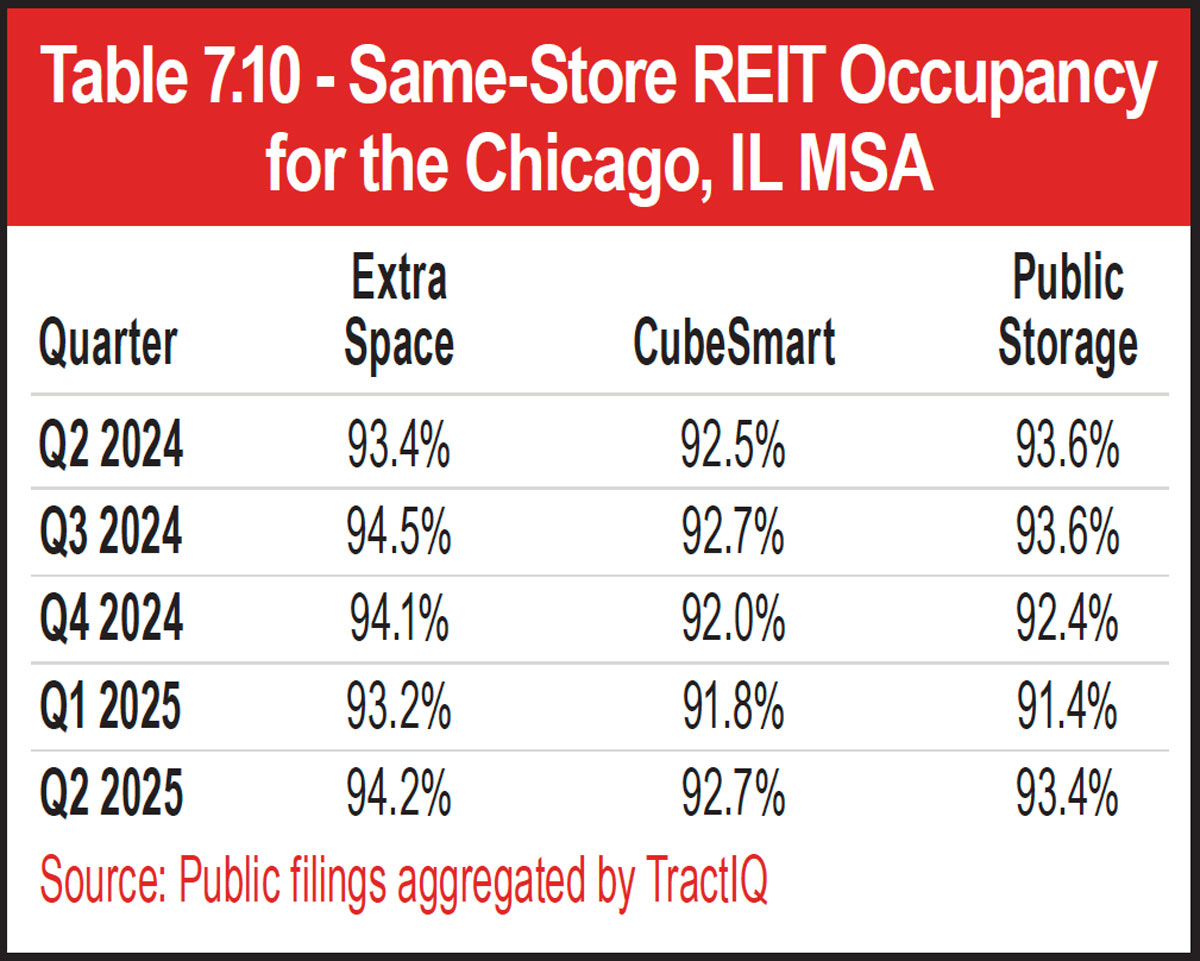
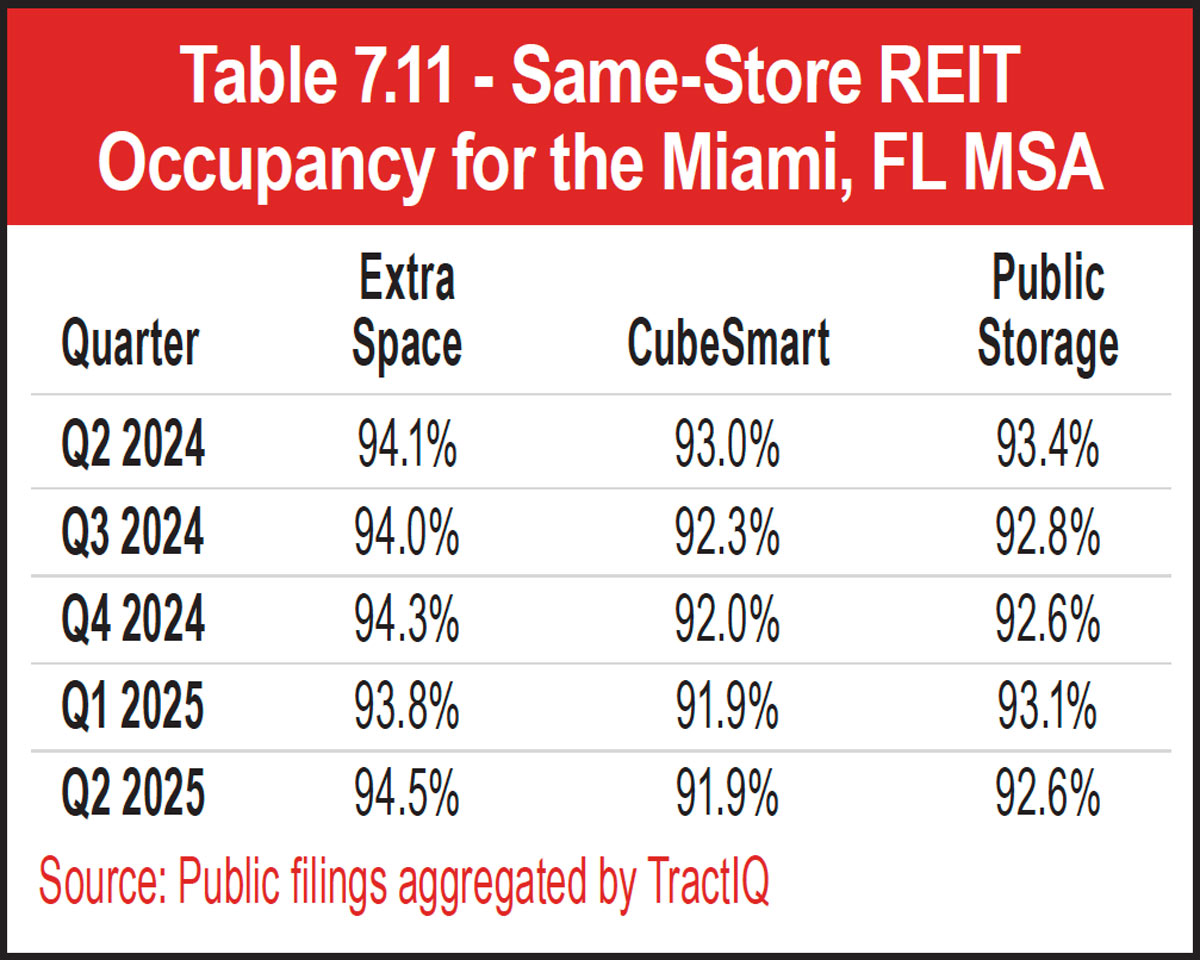
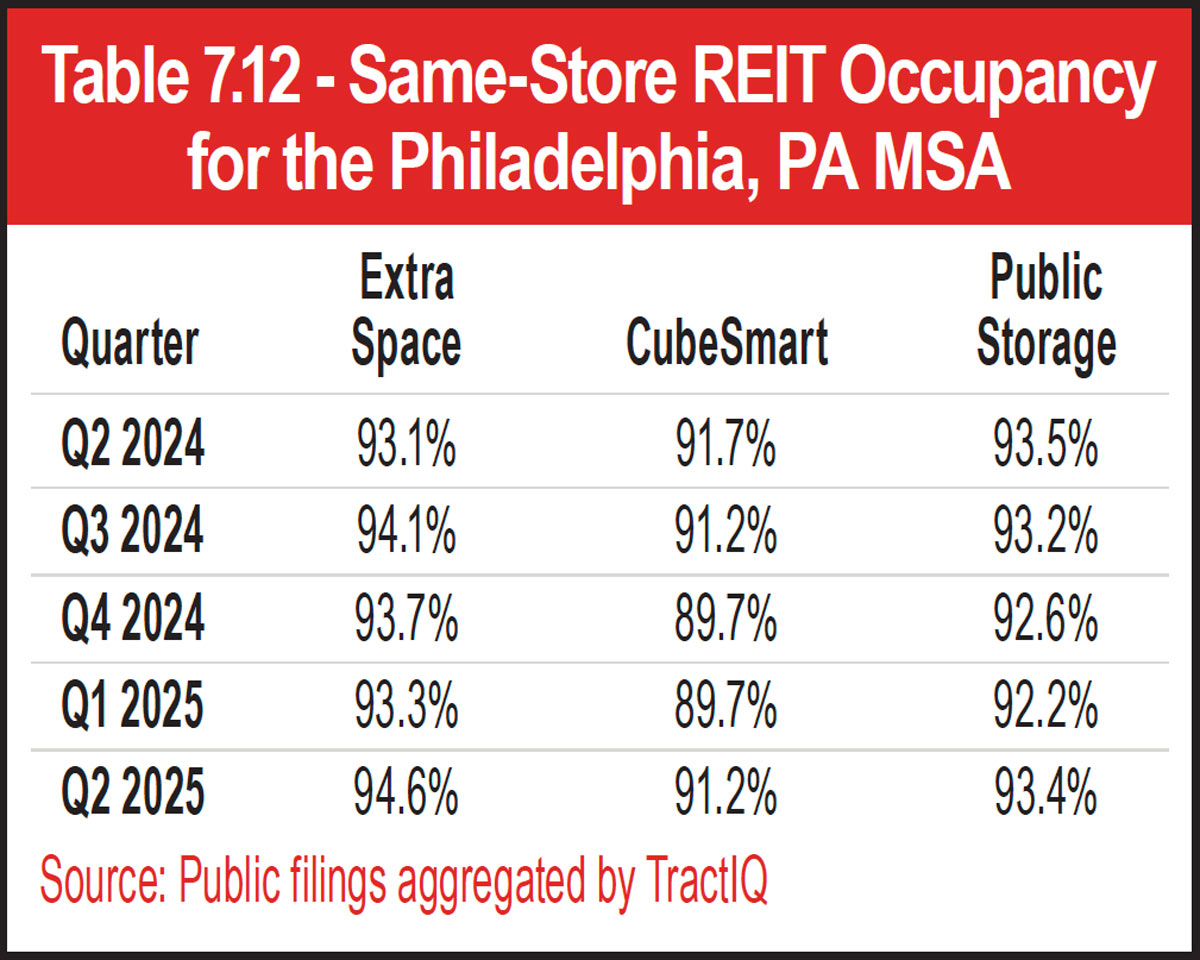
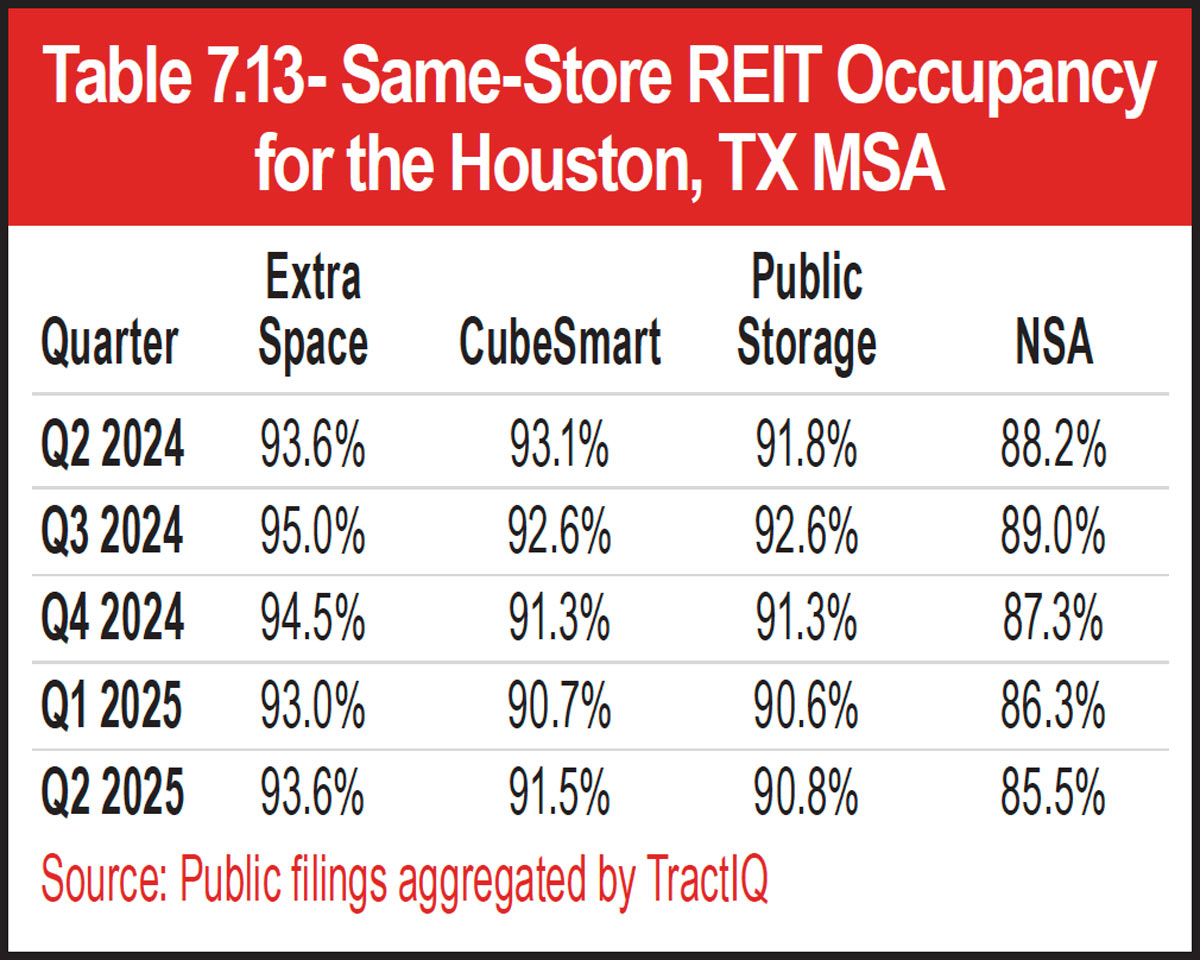
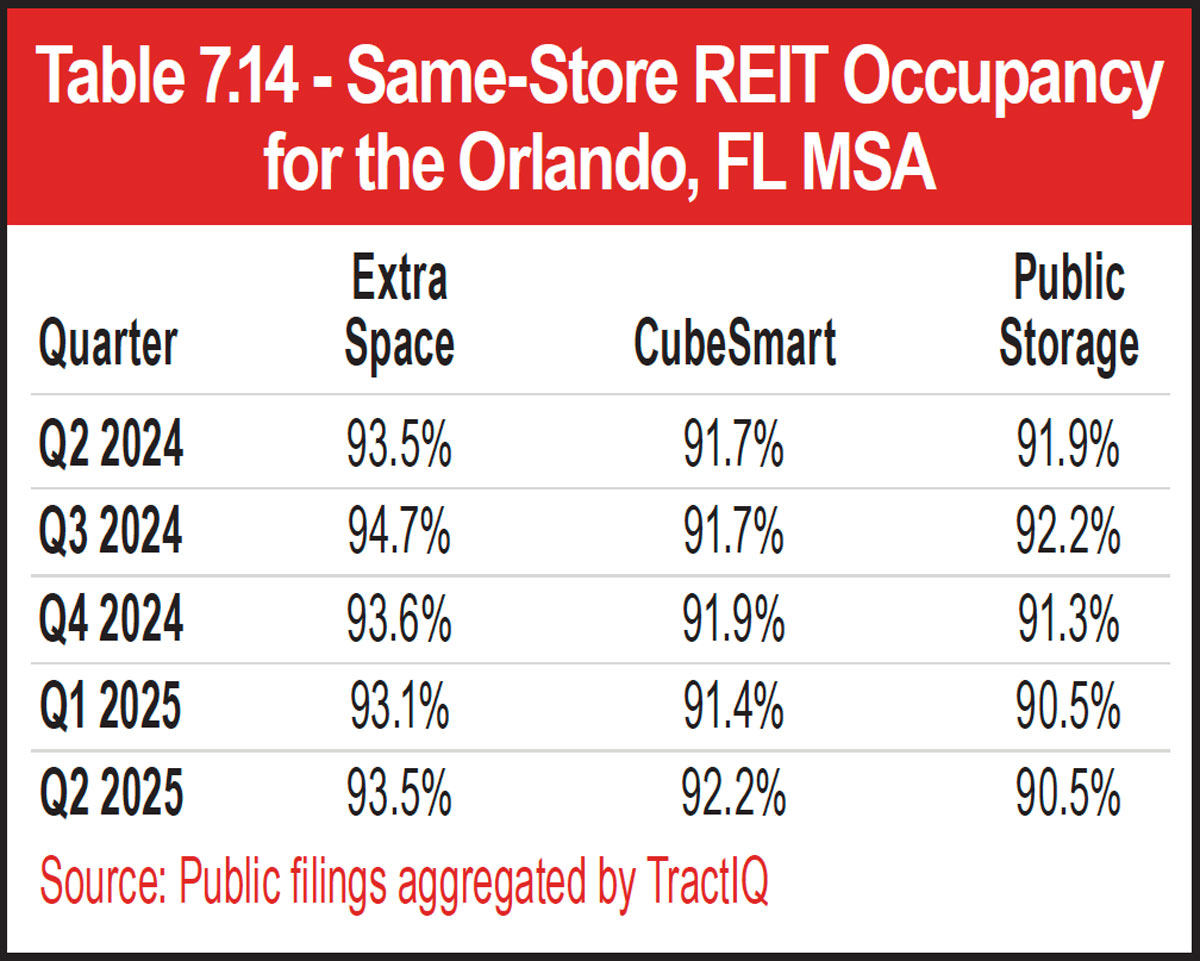
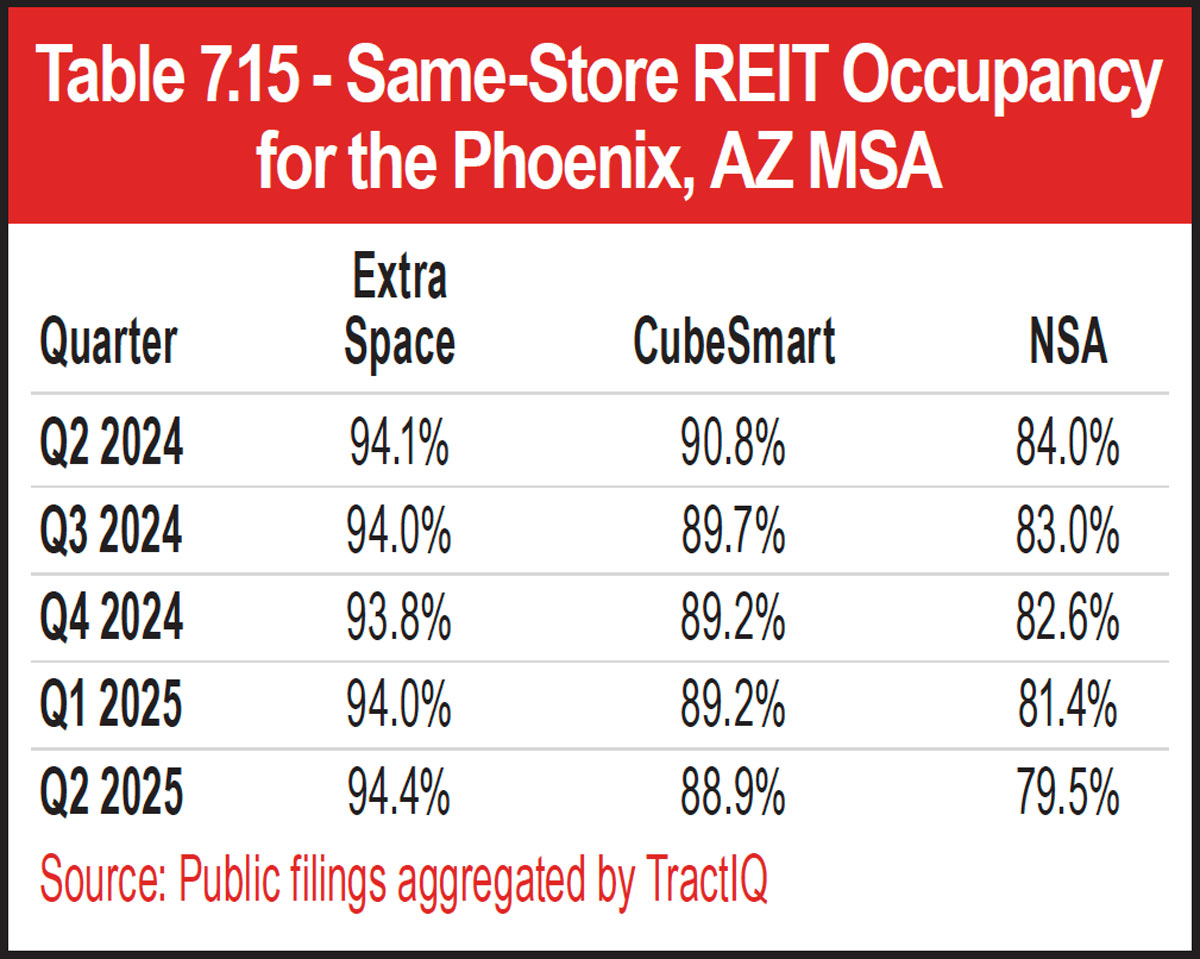
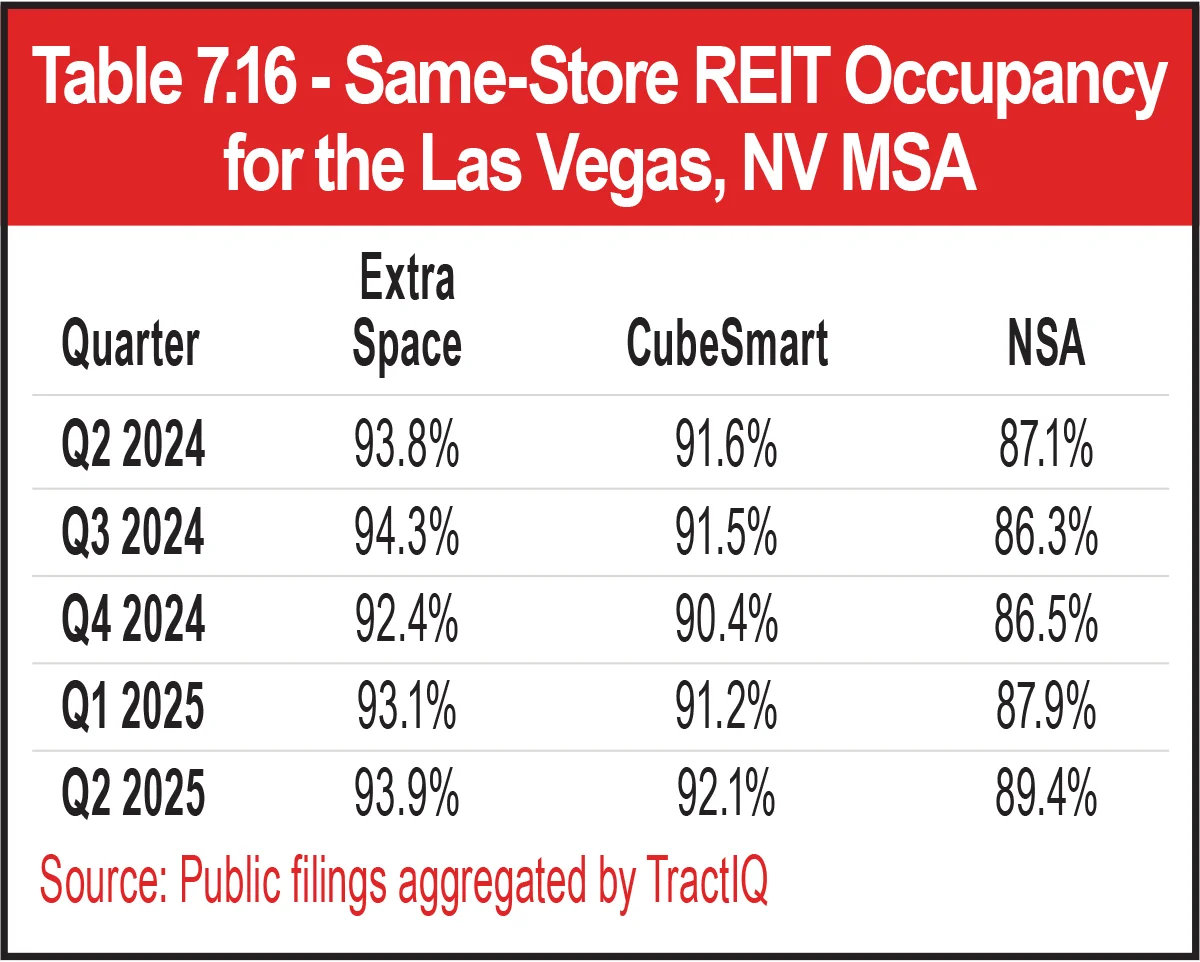
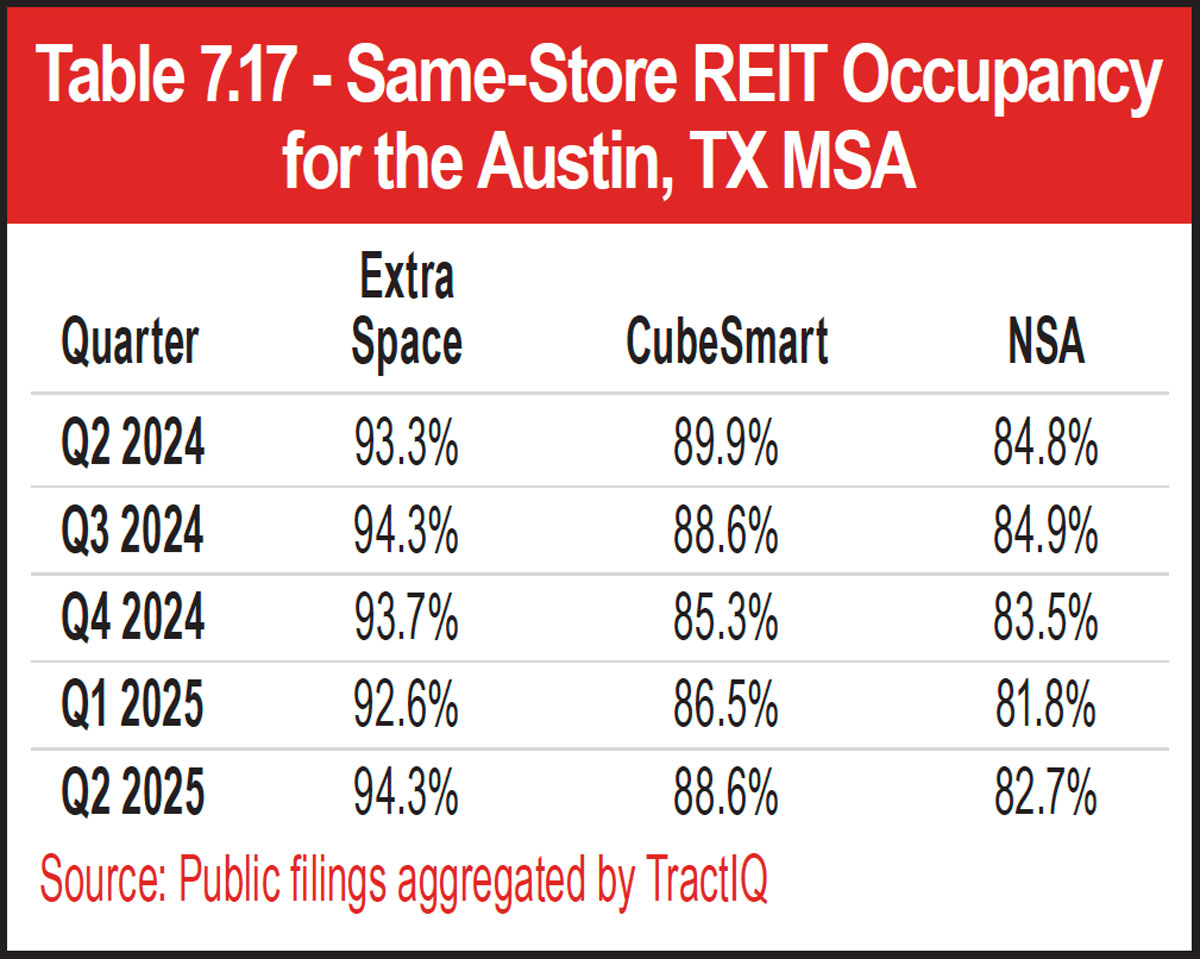
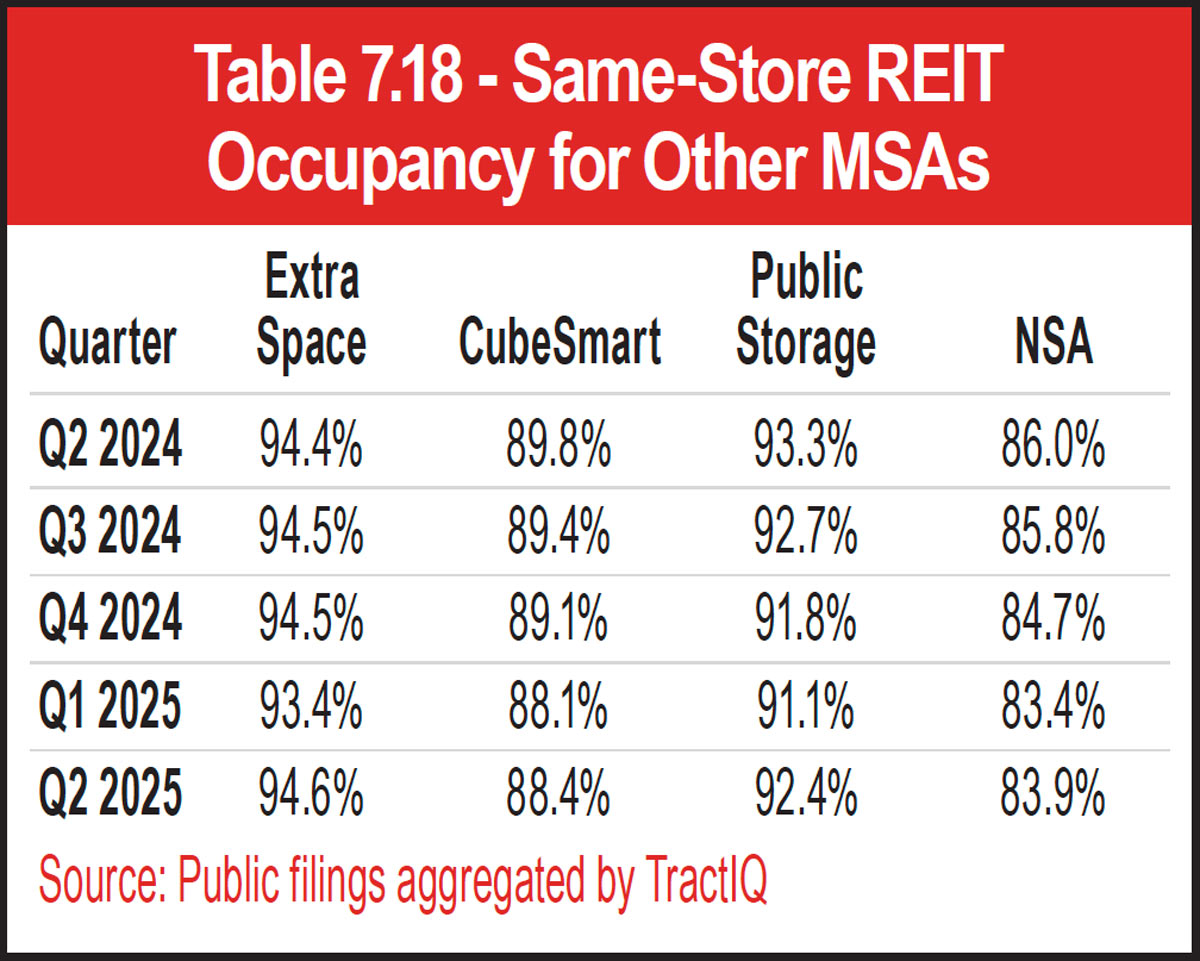
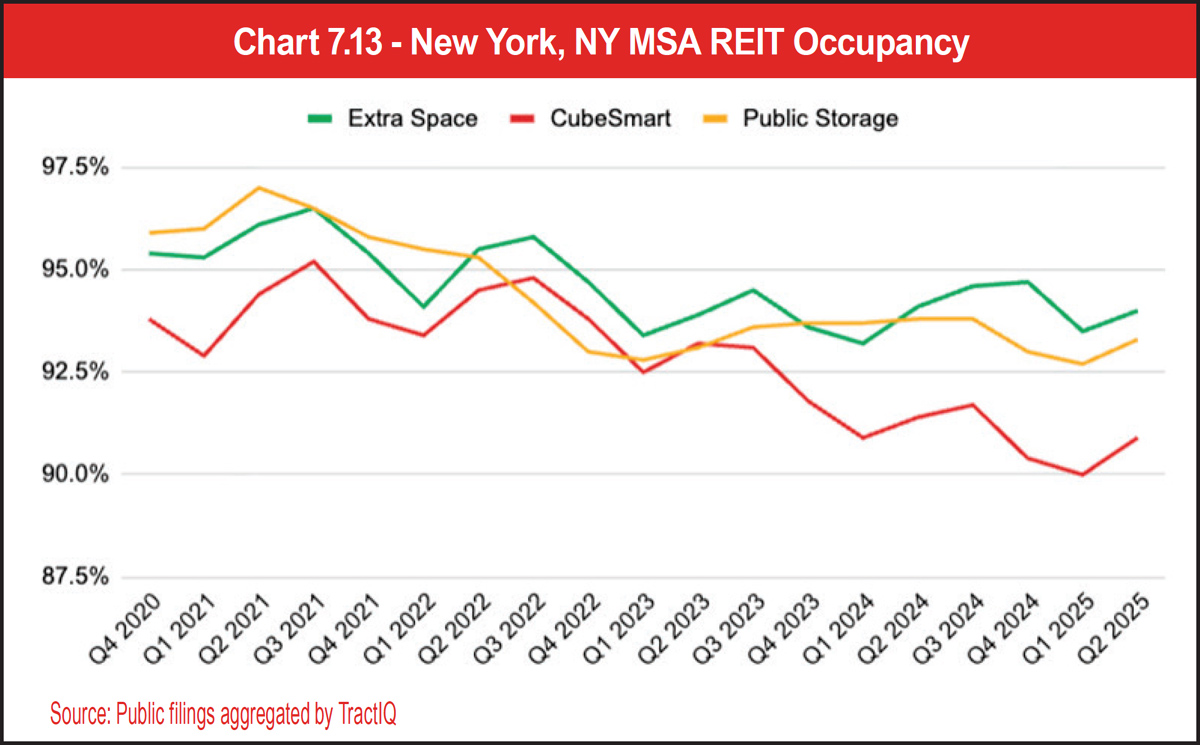
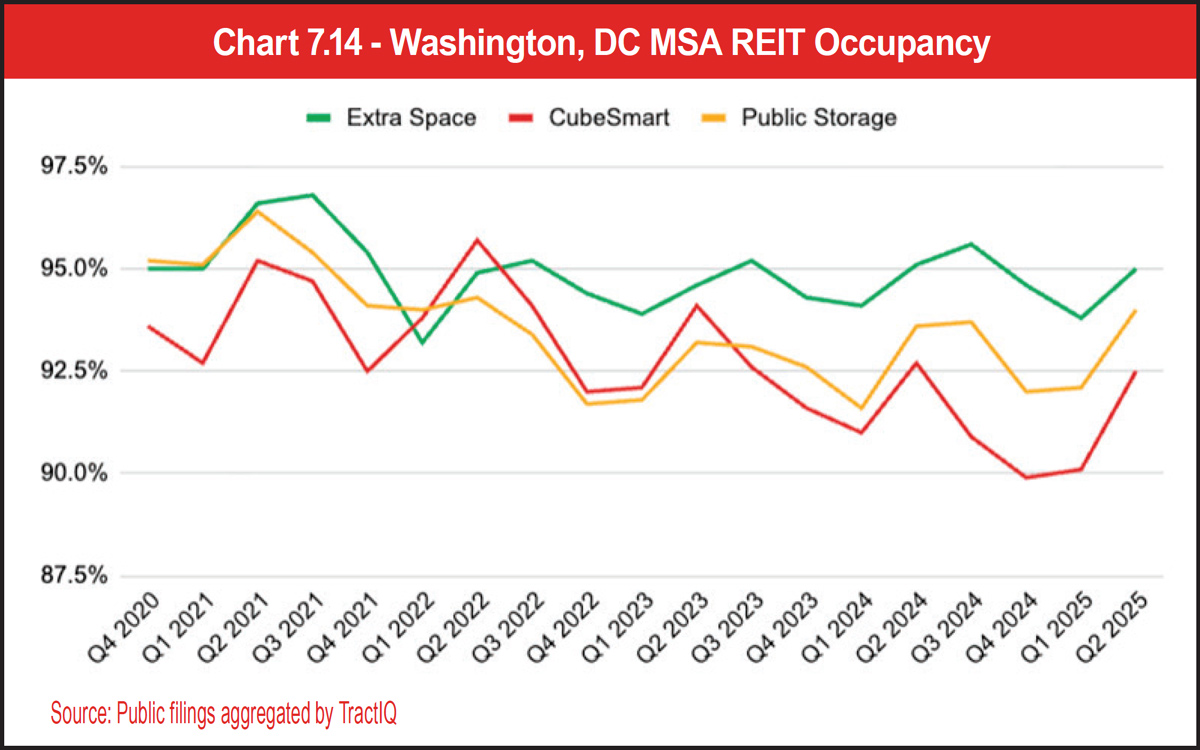
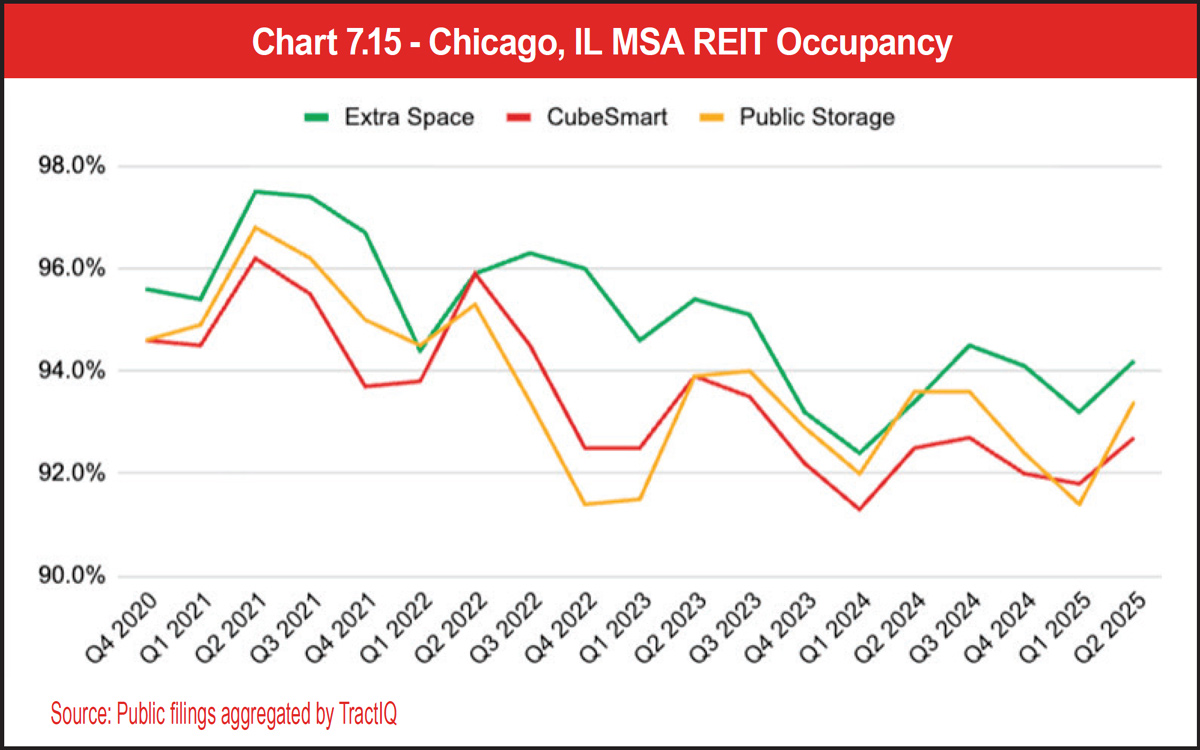
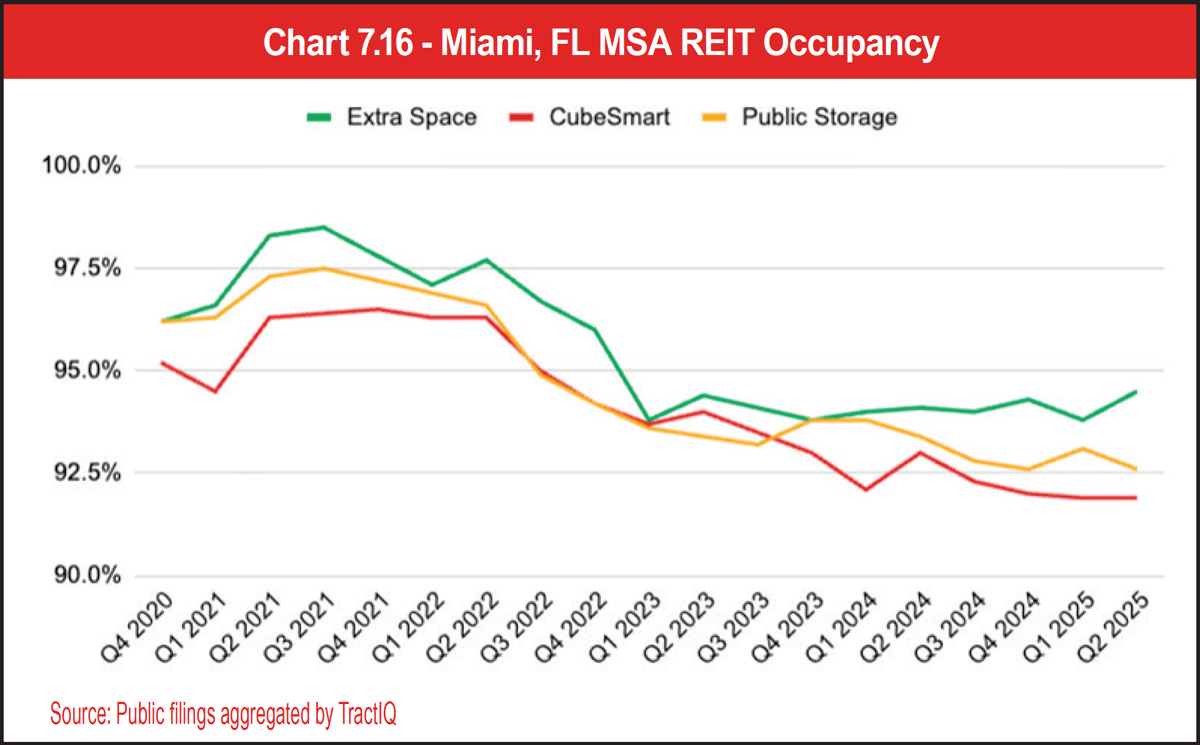
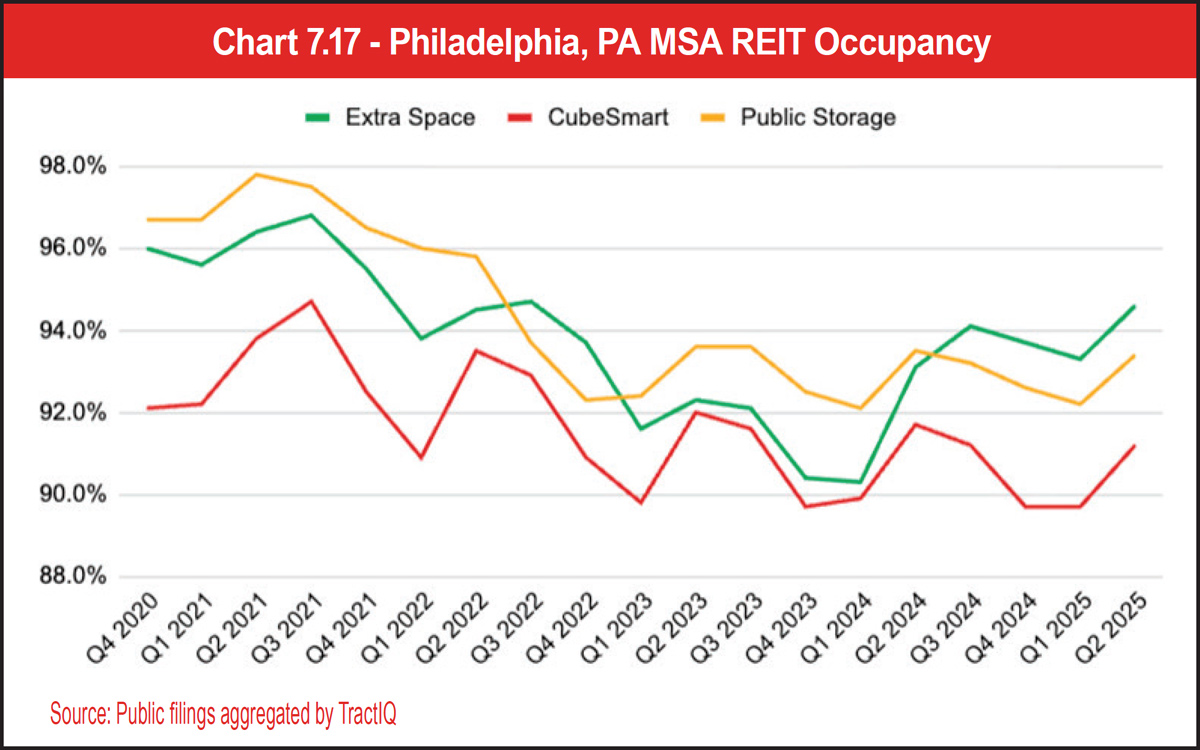
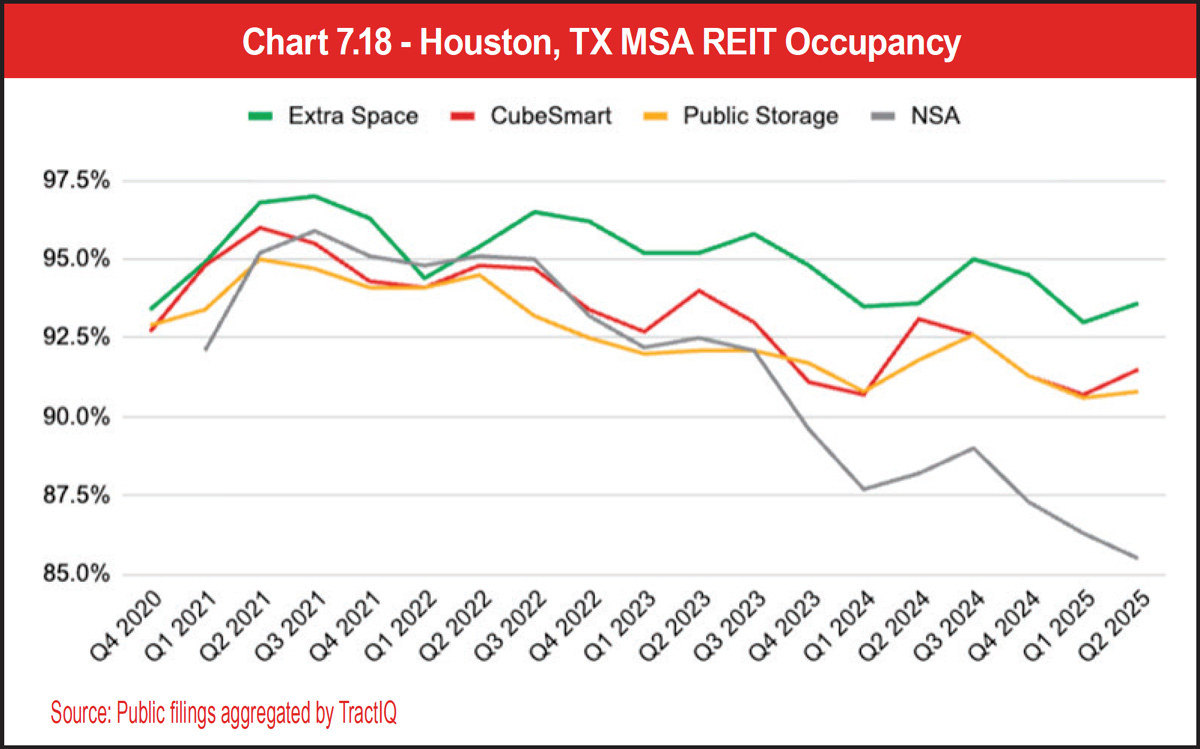
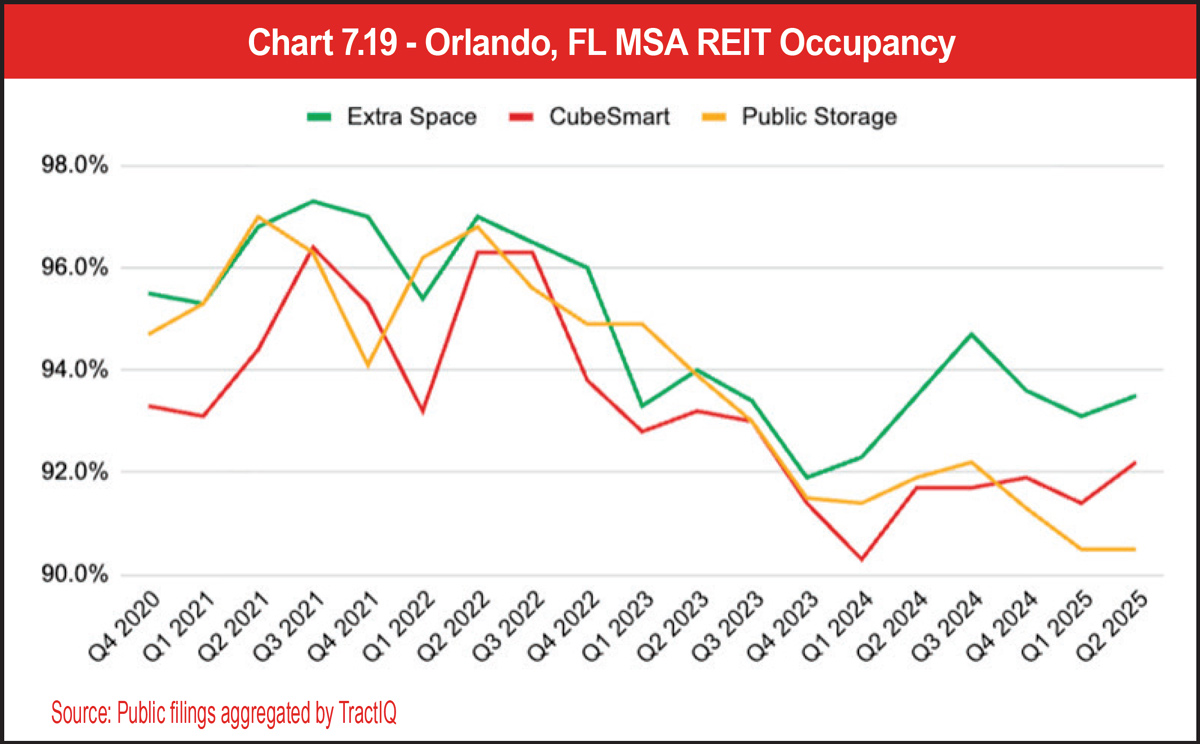
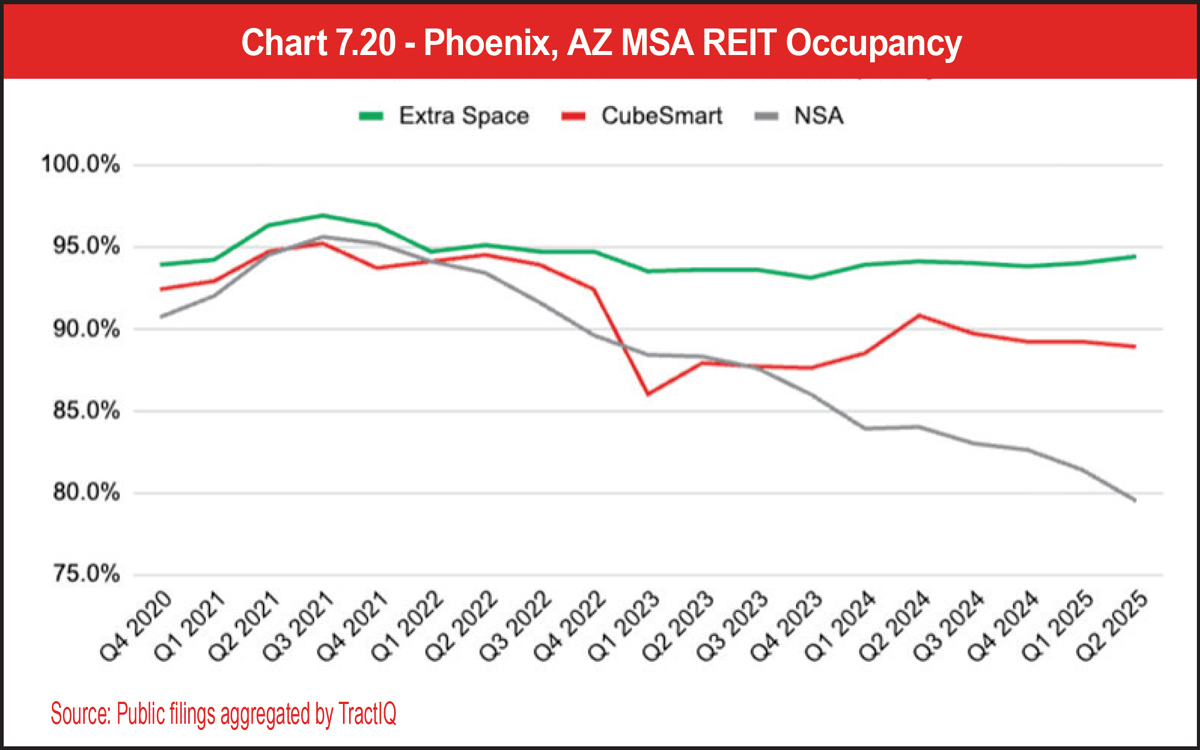
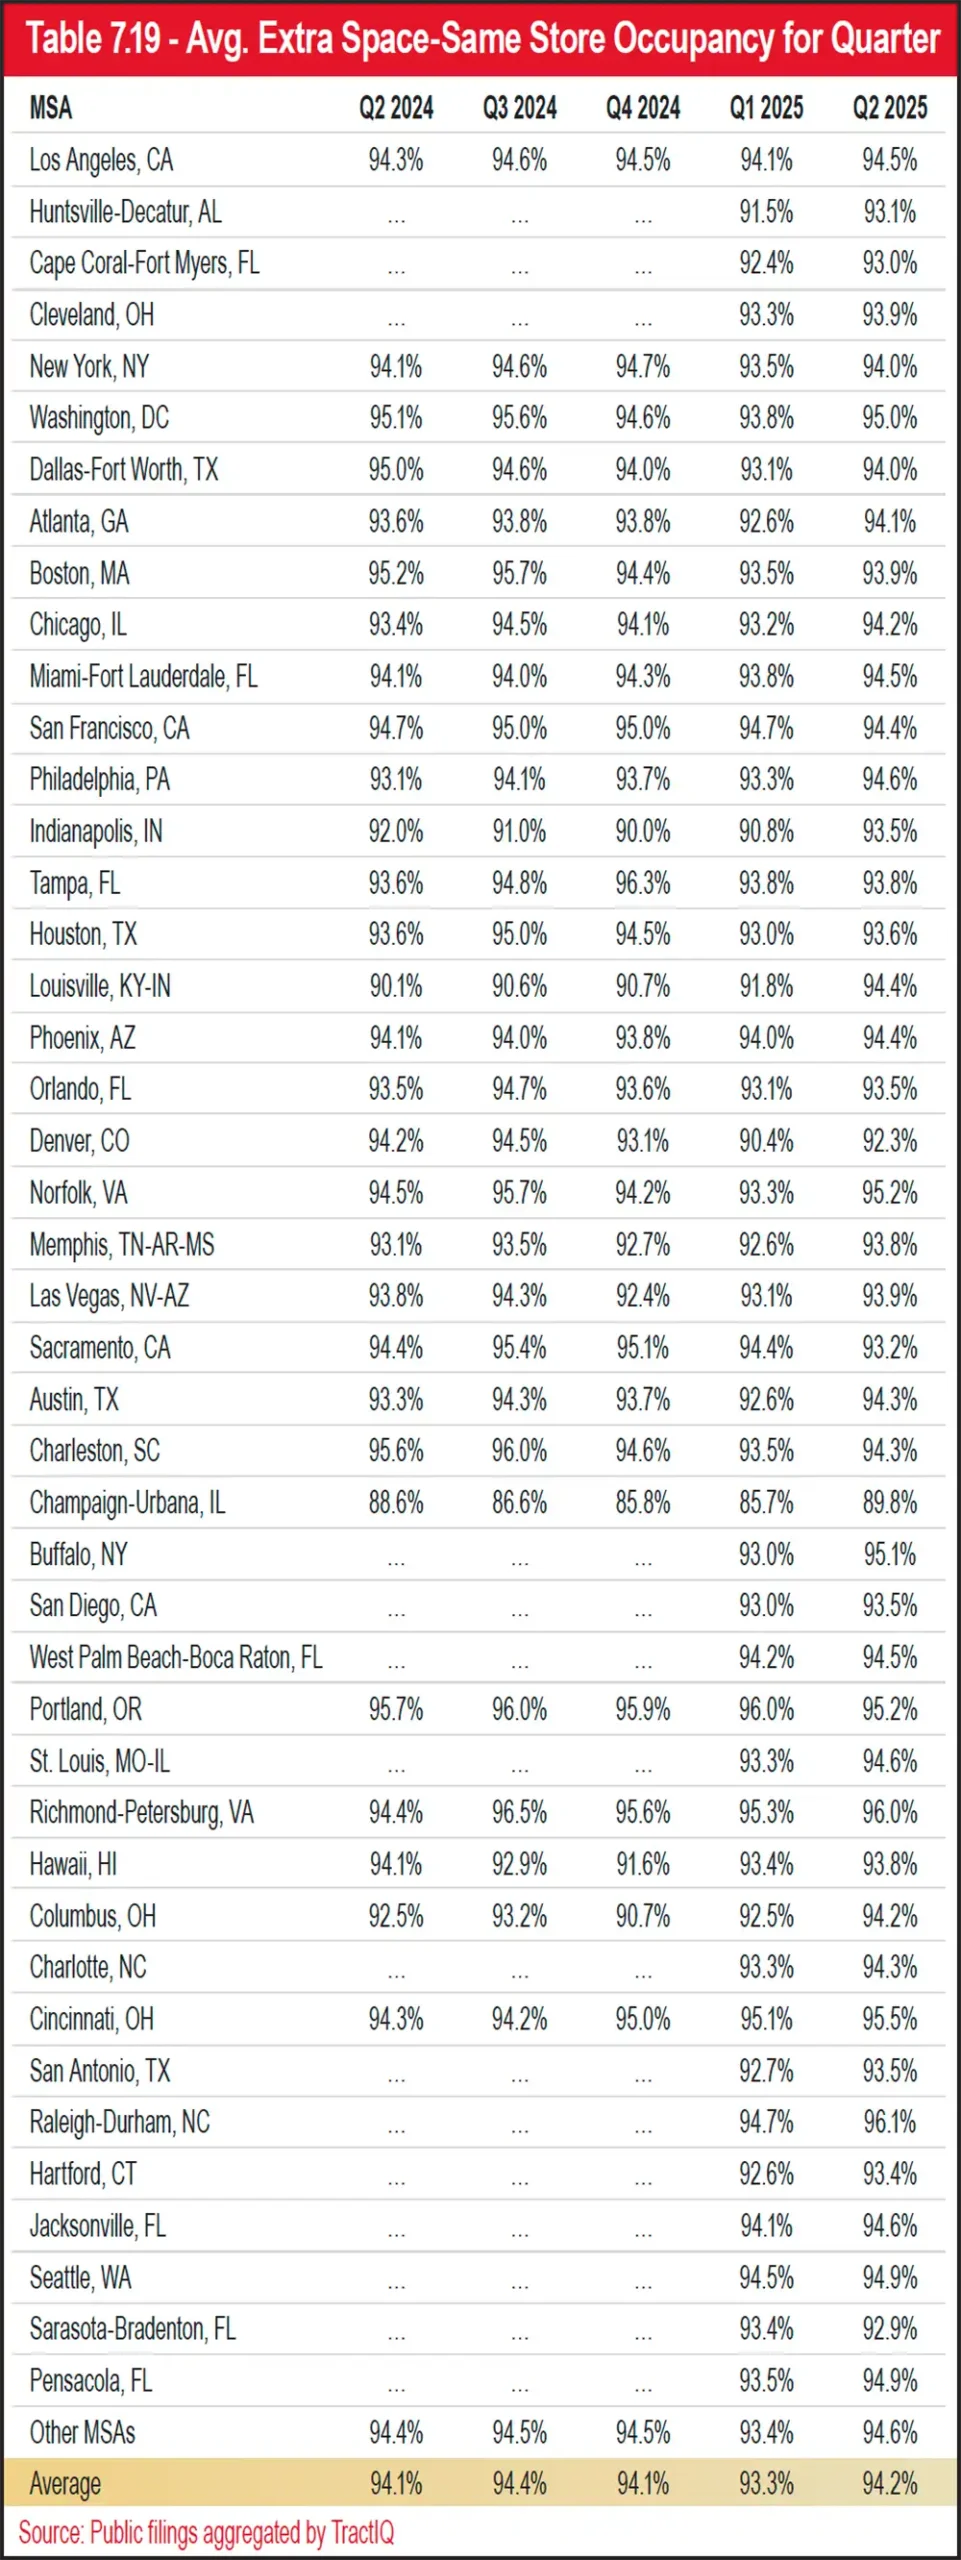
Interestingly, the only MSA in Extra Space’s same-store portfolio that is below 90 percent occupied over the last five quarters is the Champaign-Urbana, Ill., MSA. As of the latest quarter, the Raleigh-Durham, N.C., MSA had the highest occupancy out of all reported MSAs at 96.1 percent. Overall year-over-year occupancy has increased slightly by 0.1 percent percentage points.
See Table 7.19.
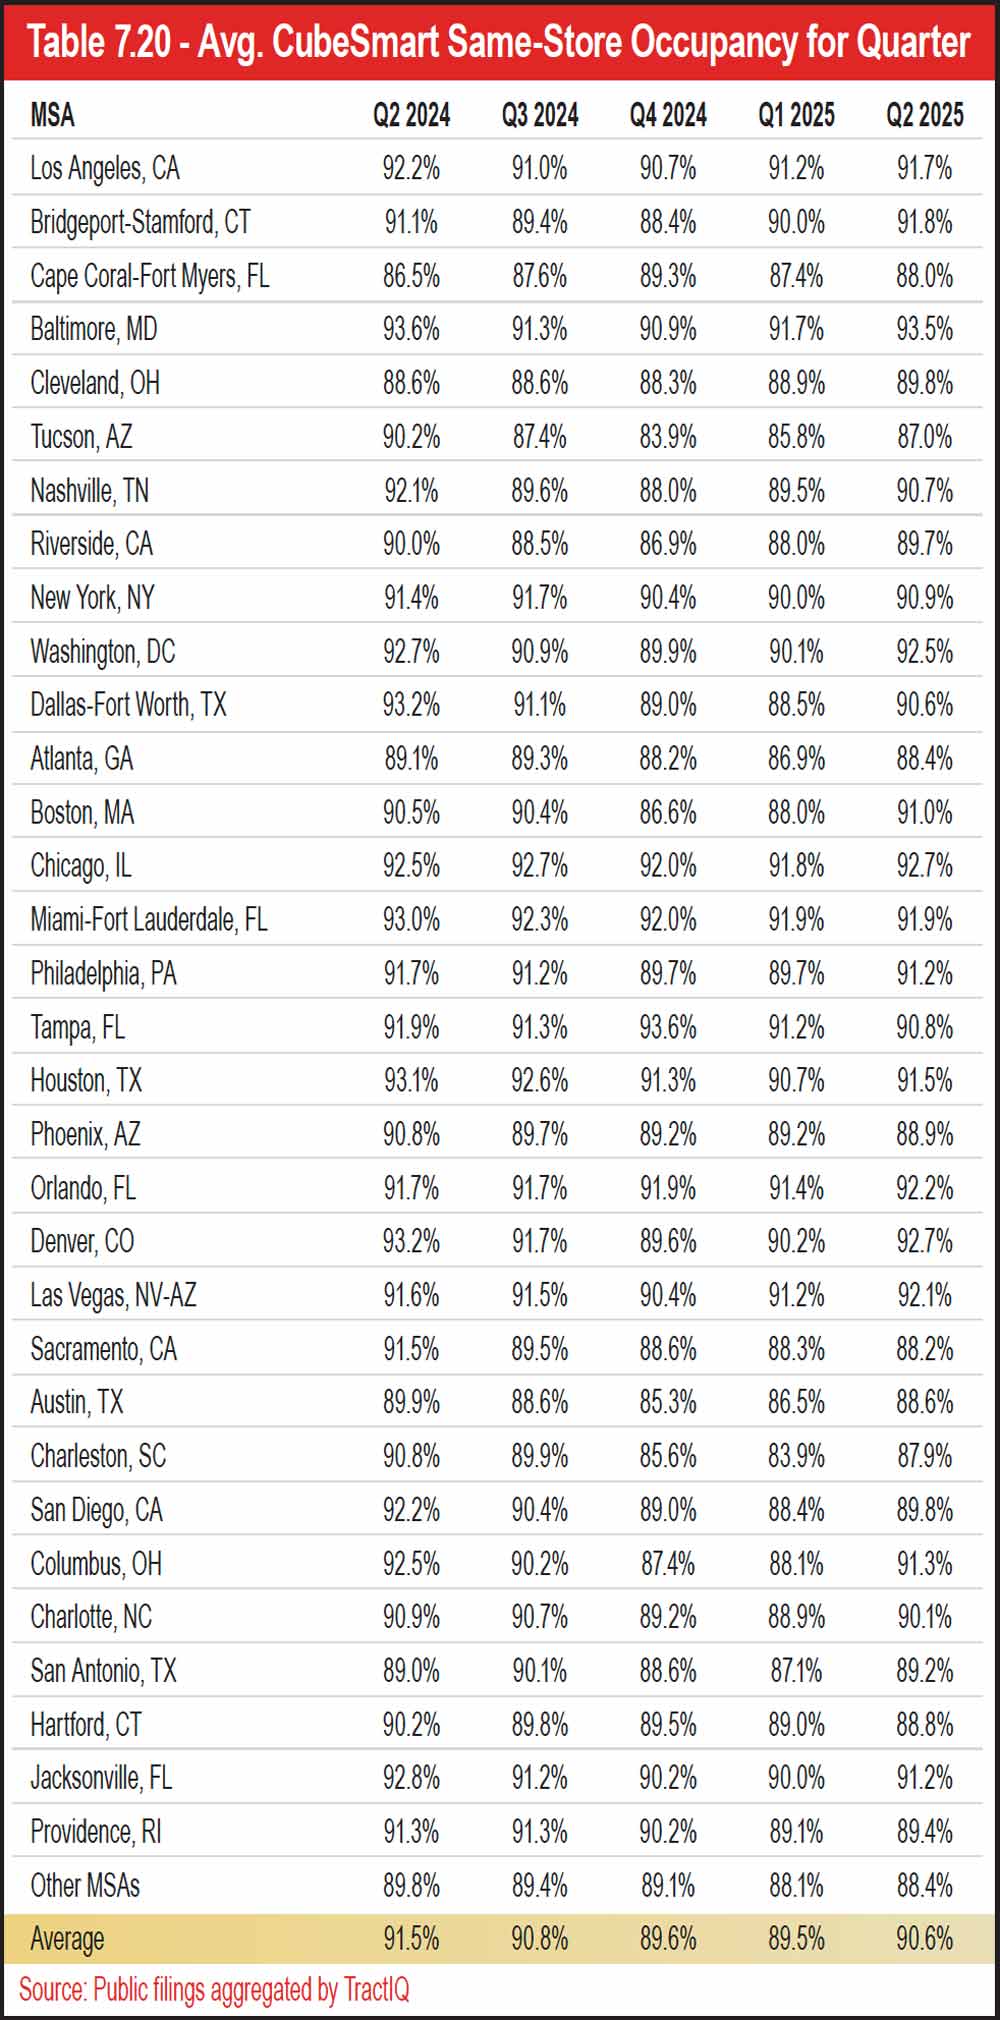
You will notice that CubeSmart reported an overall occupancy rate of 89.6 percent in Q4 2024 and 89.5 percent in Q1 2025. This was the first-time same-store occupancy for CubeSmart dipped below 90 percent since 2015. This puts into perspective how challenging of a time it is for the self-storage industry currently. As of Q2 2025 however, occupancy is back up above 90 percent, a good indicator. The MSA that had the lowest reported occupancy for CubeSmart was Tucson, Ariz., at 87.0 percent. The MSA with the highest reported occupancy for CubeSmart was Baltimore, Md., at 93.5 percent, as of Q2 2025.
See Table 7.20.
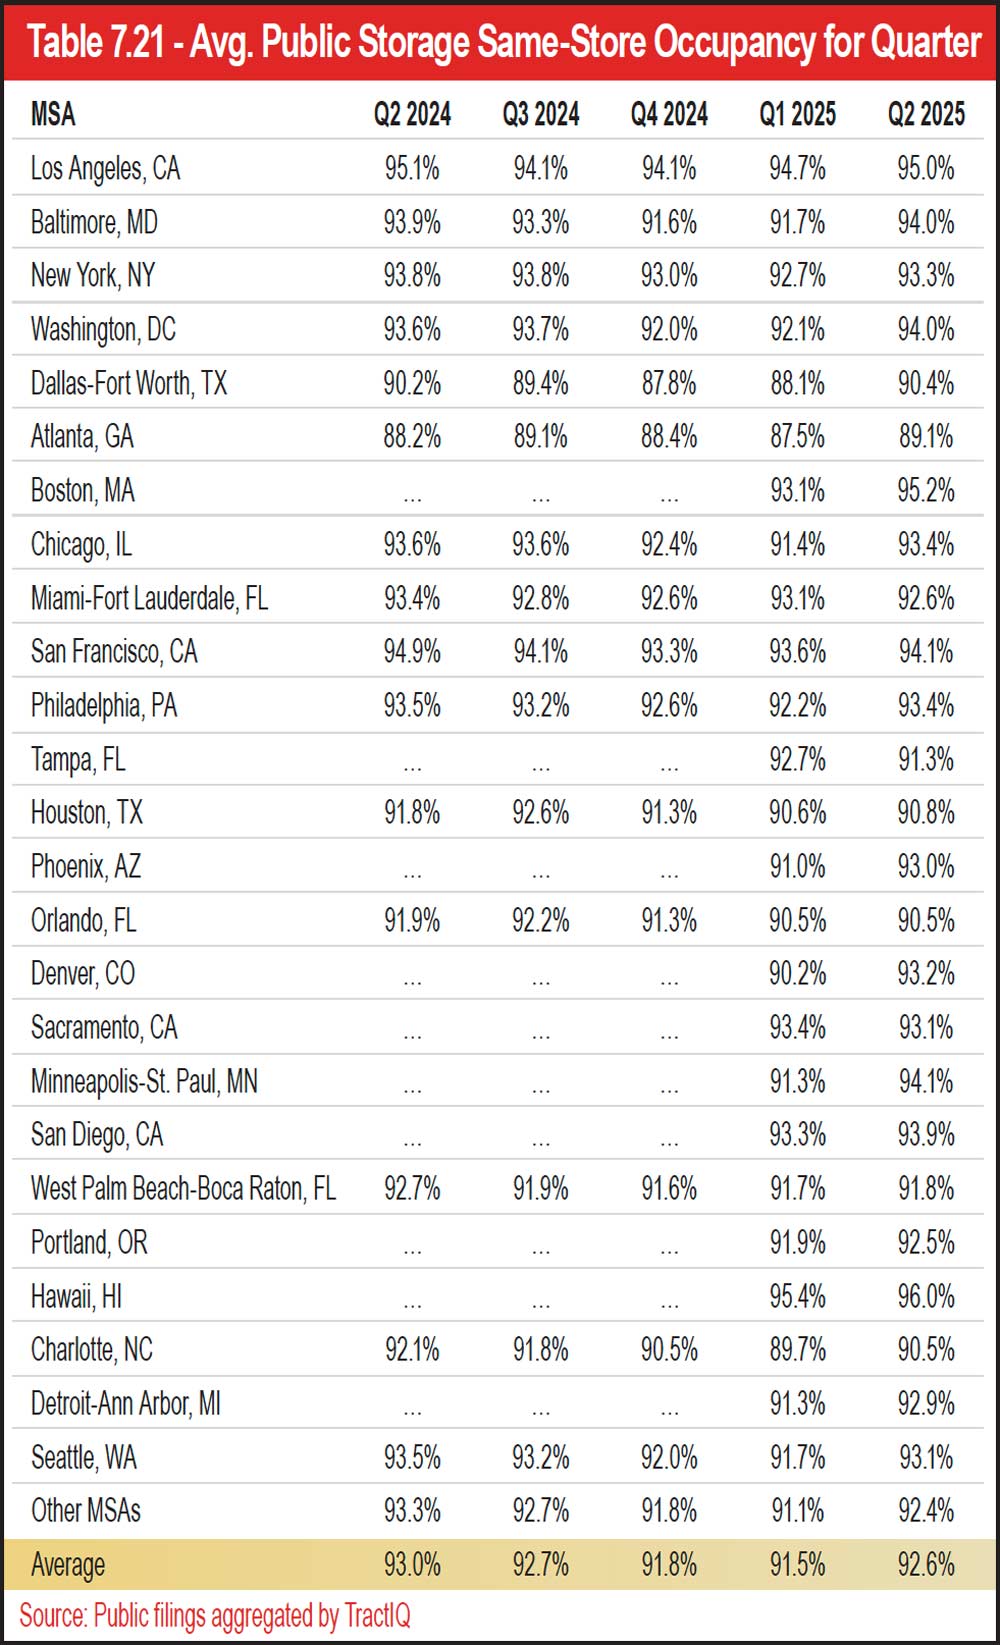
See Table 7.21.
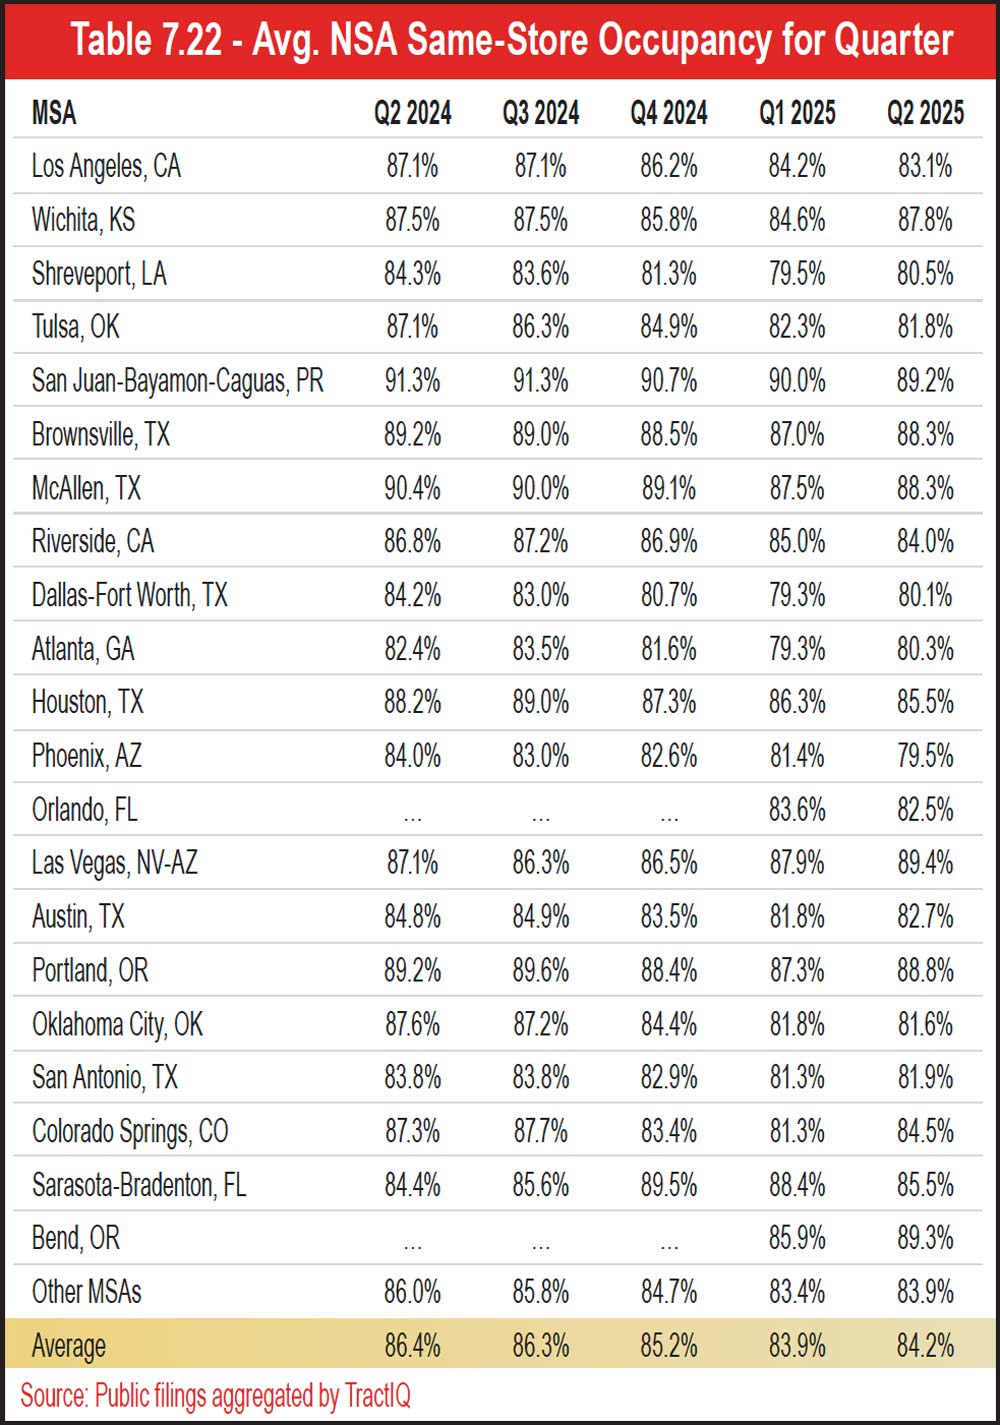
Similar to CubeSmart, occupancy in Q1 2025 for NSA was the lowest recorded since 2015, but it has since rebounded in Q2 2025. There was one MSA that reported occupancy lower than 80 percent for NSA as of the latest quarter: Phoenix, Ariz. The highest reported occupancy for NSA as of the latest quarter in the United States was the Bend, Ore., MSA at 89.3 percent.
See Table 7.22.