

Section 12 | Capitalization Rates
Stacks of coins with superimposed line and bar graphs against a gradient background.
C

apitalization rate (or cap rate) is a metric used in commercial real estate transactions to calculate the potential rate of return on an investment. It provides a good starting point when considering whether to purchase a property. However, it is only one component, since due diligence also requires studying the class type, supply and demand, and economic indicators such as inflation, unemployment rate, and gross domestic product (GDP).

In 2025, commercial real estate transactions saw a decrease (or more accurately, a market correction) of all class assets. It was only a matter of time, after the low cost of borrowing during the COVID-19 pandemic exponentially increased the price of real estate across the country.

In addition to the current higher interest rates, expense escalation has also resulted in a direct hit on net operating incomes (NOI). Since capitalization rates depend on an asset’s income, even modest declines in NOI can materially affect valuation.

But calculating NOI accurately requires a lot of attention to detail and categorizing expenses adequately. Failing to do so has often resulted in overestimating a return on investments.

How Cap Rates Are Calculated
Capitalization rates are calculated by dividing a property’s NOI by its market value. The higher the cap rate, the bigger the risk; but as with any type of investment, it also means a potentially higher ROI.

This formula may seem simple on its face, yet it requires a thorough understanding of all the elements that drive income and expenses, including rental revenue, vacancy rates, operating costs, and reasonable expense escalation.

Common Calculation Mistakes
Estimating an accurate rental income requires taking into account seasonal fluctuations in occupancy, as well as delinquency in payments. Assuming all invoices are collected can provide an overinflated NOI. A crucial step when estimating such calculations is to subtract historical bad debt and take into account potential delinquencies when calculating revenue projections.

Self-storage NOI is also highly sensitive to variable costs, such as fluctuations in utilities and labor costs, as well as repairs in geographical locations that are prone to natural disasters. By the same token, property management agreements often include charging a percentage of gross revenue. These typically range between 5 percent and 7 percent, depending on the size of the property and the services provided.

The other side of calculating NOI accurately is classifying capital expenses (CapEx) as recurring operational expenses (OpEx). Only routine maintenance should be included in the projected NOI; inflations in operational expenses should also be taken into account, such as increases in insurance and property taxes, which have typically ranged between 2 percent and 3 percent, with its peak at 9 percent in Q4 of 2024 and early 2025.

See Chart 12.1.
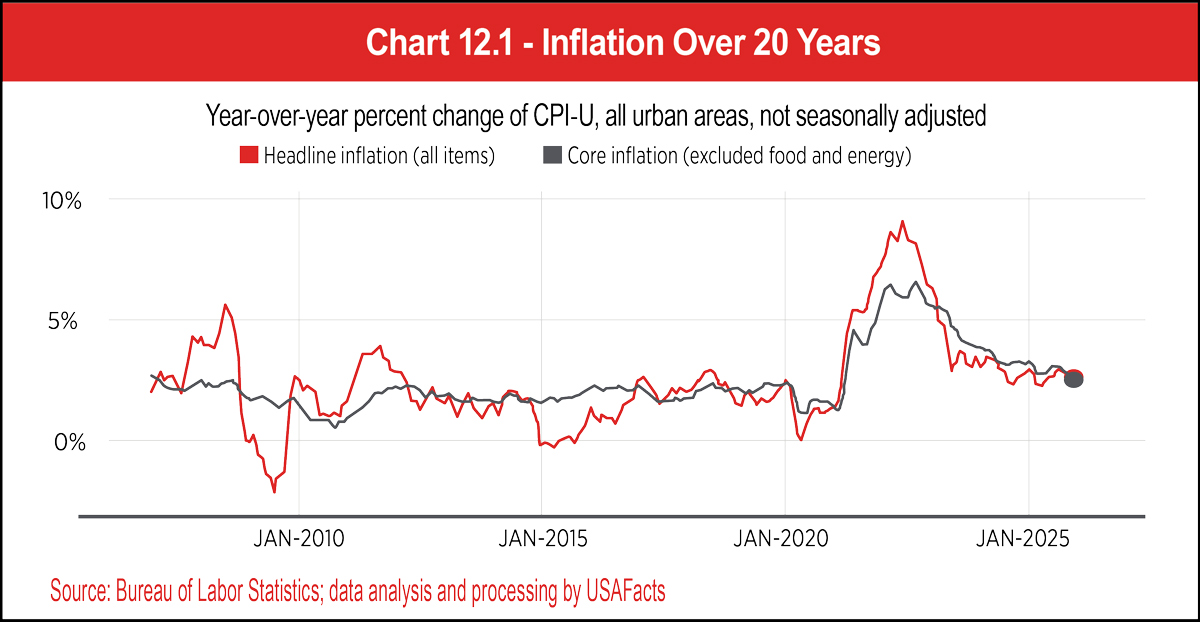
Chart 12.1 - Inflation Over 20 Years
Key Strategies
When determining NOI, investors should look at ancillary factors, such as property class; current and expected street rates; whether the facilities are urban, suburban, or rural locations; income from supplementary services; and market saturation. To get the most accurate picture, investors should consider several types of cap rates.
Trailing Cap Rates
This is calculated by dividing the facilities’ income from the immediately preceding 12 months by the purchase price. This number provides a baseline of NOI and should be considered along proforma cap rates to provide a complete picture.
ProForma Cap Rates
This is calculated by estimating future NOI and dividing it by the purchase price. This strategy accounts for rising costs (of operations, insurance, and property taxes), as well as upcoming property improvements (value adds) and competition.
Forward Cap Rates
Forward cap rates take the projected NOI for the next 12 months and divide it by the property’s purchase price. The trailing cap rate can serve as a baseline and factor in components such as scheduled rent increases, planned expansions, and expected operational increases.
Market Cap Rates
Market cap rates divide the NOI of a self-storage facility by the price of a comparable property that has been recently sold. To obtain the most accurate figures, choose a comparable property of a similar size, location, occupancy rate, and asset type.

The ideal cap rate should be between 5 percent and 10 percent. The higher the cap rate, the higher the risk. Anything lower from this range poses an even lower risk, but it will likely take longer to see a return on the investment.

Cap Rate Trends In 2025
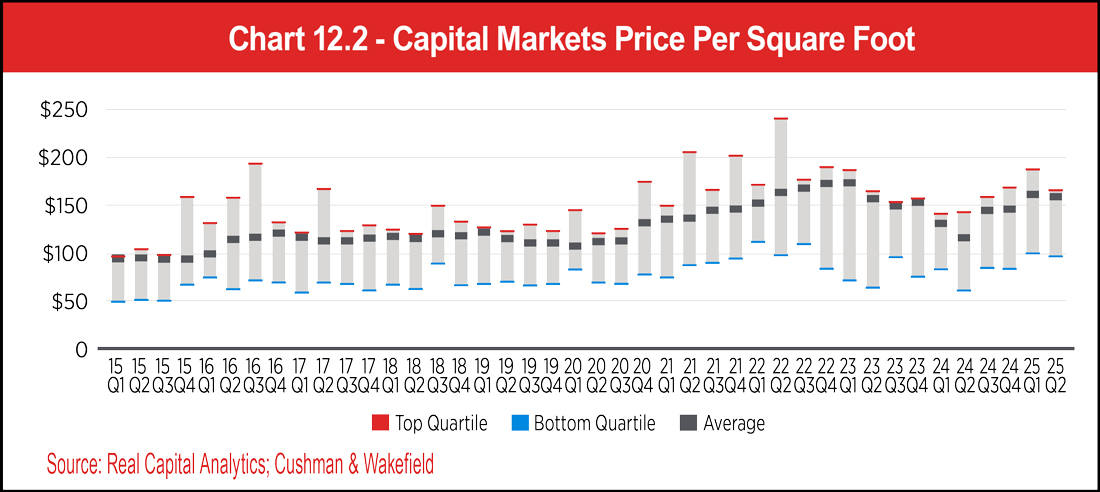
The COVID-19 pandemic brought along a myriad of circumstances that drove up the demand in real estate: historical low interest rates, stimulus checks from the federal government, and the demand for storage and residential properties driven by the surge in remote work. While the totality of circumstances resulted in a goldmine for real estate sellers and self-storage developers, such an increase in demand was unsustainable. After peaking in 2023 and slight reductions in demand in 2024, 2025 saw valuation steadily decline, with average prices falling by more than 20 percent.

See Chart 12.2.

Chart 12.2 - Capital Markets Price Per Square Foot
The downward trend in the economy was caused by many factors. Rising interest rates made everything more expensive, and the higher costs of borrowing money affected more than real estate transactions. Businesses stalled expansions; many of them resorted to multiple rounds of layoffs to cut costs and stay afloat, which, in turn, reduced consumer spending and slowed down economic growth even further.

Throughout the first half of the year, there was an inverted yield curve (the difference between a two-year treasury and a 30-year treasury). The weakening in job numbers likely served as a significant contributor, as fears of a recession increased.

See Chart 12.3.
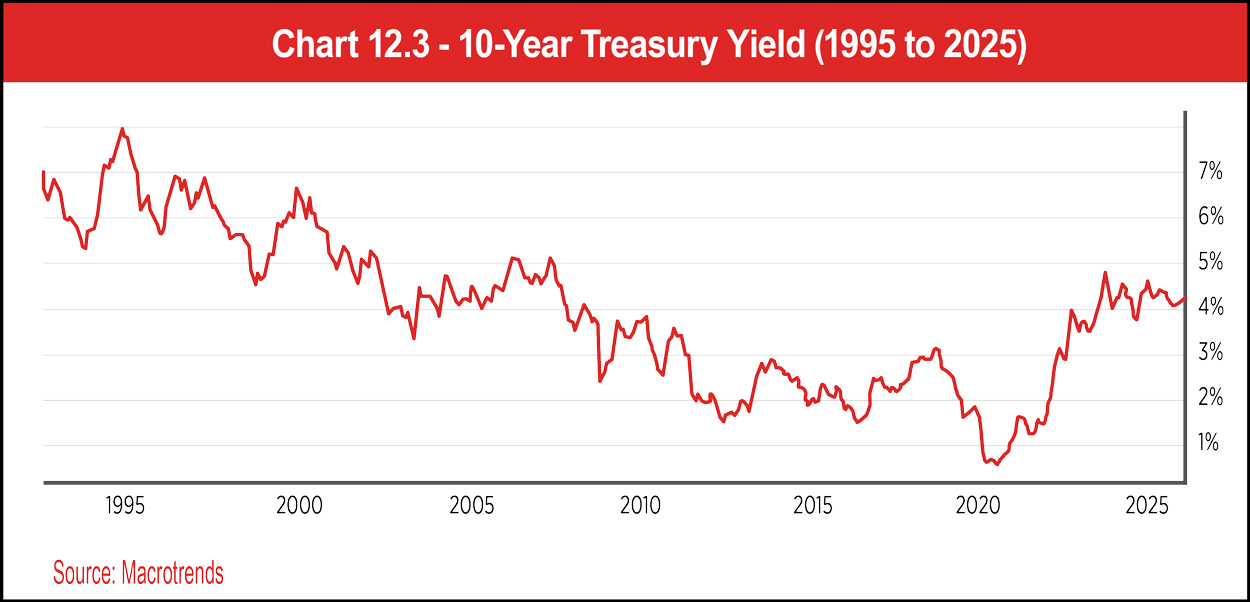
Chart 12.3 - 10-Year Treasury Yield (1995 to 2025)
For most of the year, the public at large watched the Federal Reserve closely during their Federal Open Market Committee (FOMC) meetings, hoping for a reduction in interest rates to once again promote economic growth. The rates did not come down until September, when the Federal Reserve cut rates for the first time all year. While the move had been long awaited, the reduction was barely negligible at 0.25 percent.

While this slight reduction did little to aid residential property transactions, when looking at the commercial mortgage-backed securities (CMBS) market, lending activity remained robust for commercial real estate.

See Charts 12.4a, 12.4b, 12.5a, and 12.5b.
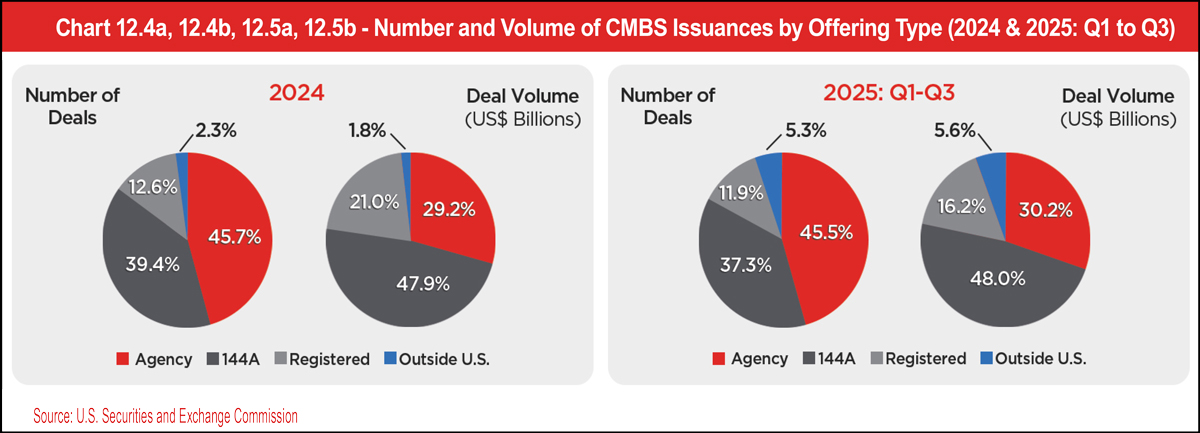
Chart 12.4a, 12.4b, 12.5a, 12.5b - Number and Volume of CMBS Issuances by Offering Type (2024 & 2025: Q1 to Q3)
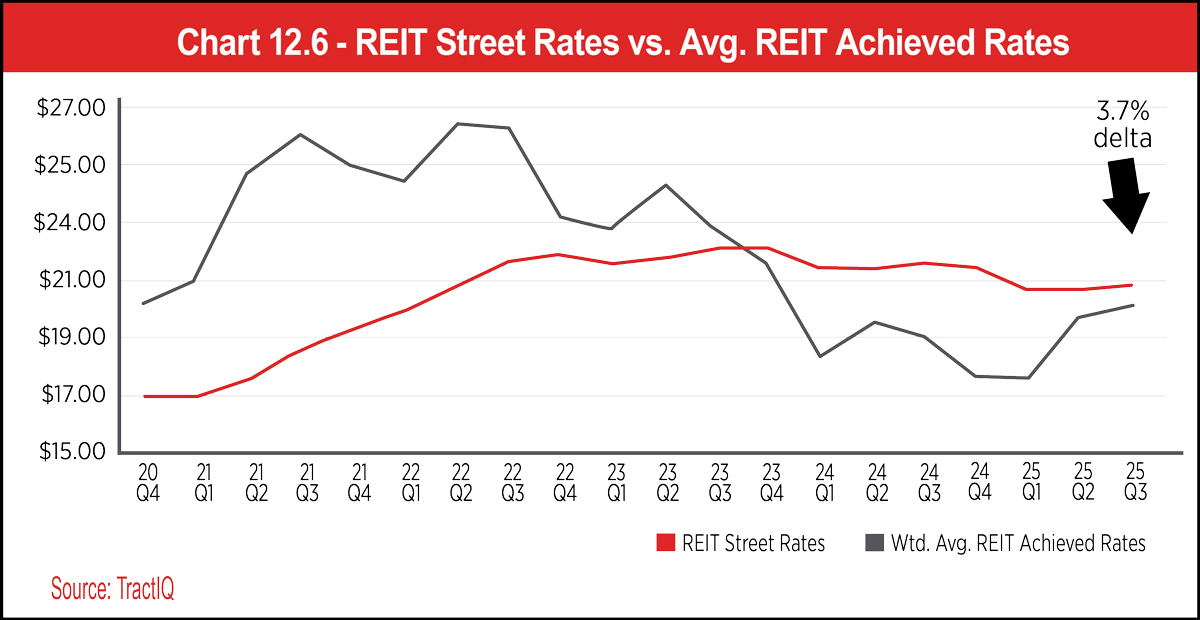
It is important to note that the upward trends in lending were observed in self-storage REITs, specifically in the last two quarters of 2025.

See Chart 12.6.

Chart 12.6 - REIT Street Rates vs. Avg. REIT Achieved Rates
Factors Affecting Cap Rates In 2026
Cap rates remain one of the most critical metrics when evaluating self-storage investments. In 2026, these will be shaped by macroeconomic factors, local markets, and property-specific characteristics.
Interest Rates
Once again, interest rates will play a central role in cap rates. When borrowing money costs more, fewer people purchase real estate. The reduced competition results in lower property values. Lower values mean higher cap rates for new investors. While this is a fundamental principle of cap rates, the changes do not happen automatically. In 2025, the three decreases in interest rates were so nominal that capitalization rates did not change in a significant way.
Buyer and Seller Price Alignment
Storage valuation peaked in 2003, at a time where the low cost of borrowing resulted in sellers having high price expectations due to aggressive buyer bidding, yet the gap in the bid-ask spread has significantly narrowed as the market corrected.
Occupancy and Rental Rates Growth
Self-storage occupancy has remained steady despite the official decrease after the peak during the pandemic. This means future NOI growth is more dependent on rates than on filling additional units.
Supply and New Developments
Limited supply in high demand markets can maintain strong property performance and thus, lower cap rates. By the same token, oversupply would likely reduce a property’s NOI and increase cap rates.
Demand Drivers
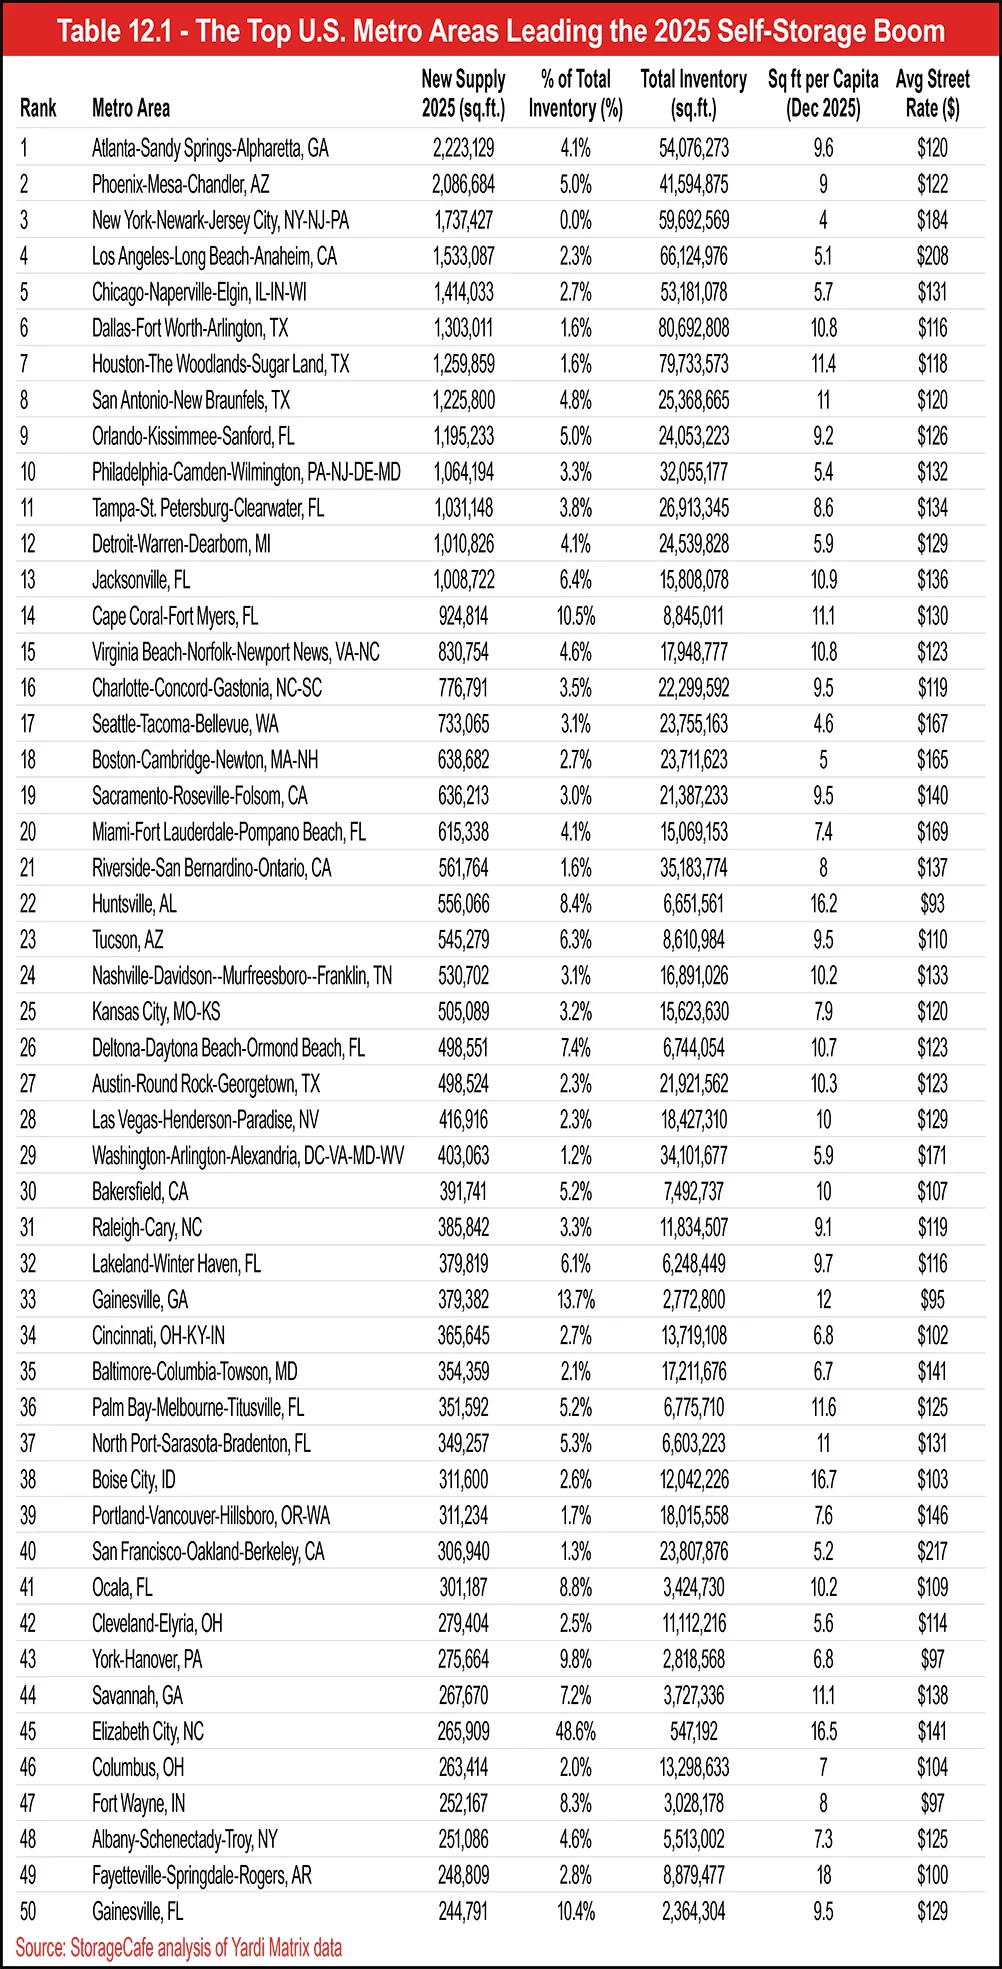
Self-storage demand will continue to be tied with rising populations and migration patterns, with numbers still looking strong in metropolitan areas in the Sun Belt regions (Atlanta, Phoenix, Los Angeles, Orlando, Tampa, and Miami, among others). And unlike other commercial real estate investments, self-storage is driven by the four Ds: divorce, death, dislocation, and downsizing.

See Table 12.1.

Table 12.1 - The Top U.S. Metro Areas Leading the 2025 Self-Storage Boom
Adjusting For Risks
While the Sun Belt has seen a boom throughout 2025, it’s crucial to keep an eye on the current supply and whether it is meeting a geographical location’s need. The result of overenthusiastic participation in new developments have historically resulted in an eventual over supply of storage space.

Lower rates should also not be the main reason for borrowing money for a new project. The investment should make sense regardless of the cost of financing.

Cap Rates In Boat And RV Storage
Boat and RV storage is a growing niche within the self-storage sector, driven by consumer demand, rising ownership of recreational vehicles, limited public storage alternatives, and the restrictions of homeowners associations(HOAs).

The sector also saw an increase in demand as a result of the work from home era sparked by the pandemic. And just as with all other factors from that unusual time period, the demand stabilized as return-to-office mandates proliferated.

Boat and RV storage facilities often have slightly lower capitalization rates than standard self-storage due to high barriers to entry, including zoning, code conformance, municipal licensing requirements, environmental impact studies, and storm water management permits. This type of storage also requires additional operational licenses, such as handling hazardous materials (fuel, oil, wastewater) and environmental compliance.

Finally, there are infrastructure requirements, including adequate road access and turning radius, utilities capacity, fire suppression systems, spill containment systems, lighting restrictions, noise ordinance compliance, and landscaping requirements. These factors collectively increase developmental complexity and operational oversight.

2025 Performance For Boat And RV Storage
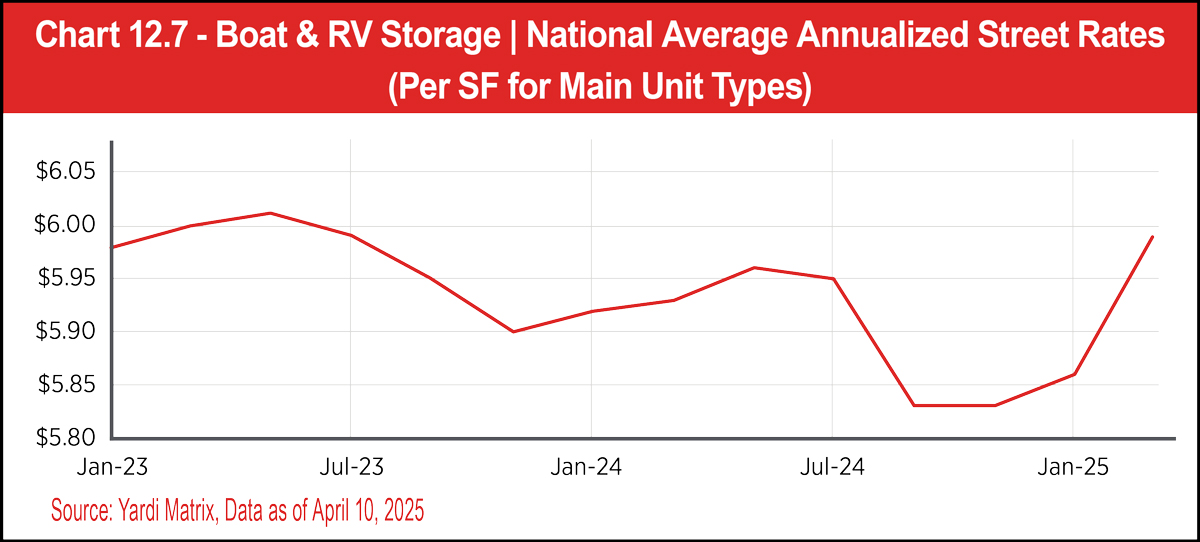
RV and boat storage rents slightly increased in early 2025, when compared to March of the previous year (1.1 percent), with the top performing market showing a 4.4 percent year over year growth.

See Chart 12.7.

Chart 12.7 - Boat & RV Storage | National Average Annualized Street Rates (Per SF for Main Unit Types)
Parking rent rates also increased significantly, with the top markets (Los Angeles, Charleston, New York, and Grand Rapids) reaching the double digits.

See Table 11.1 in Section 11. Click here

While there was a slight market correction in 2024, the sector remains strong. Nonetheless, most of the new supply has been concentrated in only a handful of locations (Chicago, San Antonio, Dallas, Houston, and Phoenix).

See Table 11.2 in Section 11. Click here

2026 Cap Rates Outlook
Boat and RV storage has seen an increase in institutional investors, a trend that is expected to continue in 2026. Most of these investors seek Class-A facilities, and development projects are expected to proliferate in areas with restrictive HOA policies.

Sales for these recreational vehicles are expected to continue a steady upward trajectory, building on the momentum sustained since 2024 and expected to remain strong into 2032.

See Chart 12.8.
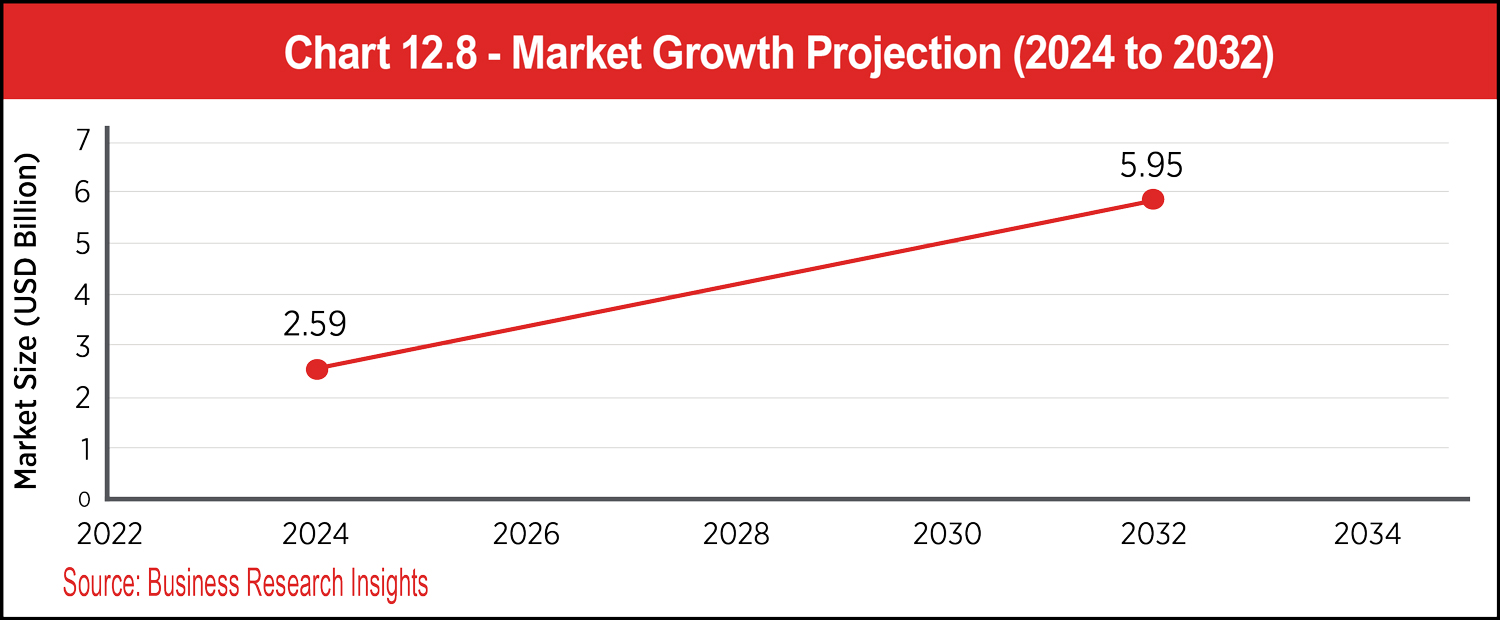
Chart 12.8 - Market Growth Projection (2024 to 2032)
Carports and canopies also provide ample space to install solar panels, which provide cost-cutting opportunities for facilities through reduced utility costs, government incentives, net metering, and tax benefits. Investors should look at the cost of energy in specific locations. For example, electricity in the northeast and west coast tends to be above the national average.

In addition, solar panels will continue to provide a competitive advantage in geographical locations with eco-conscious demographics that are often willing to pay higher rental rates for sustainable practices. All these factors will directly impact a facility’s net operating income and, ultimately, capitalization rate.

Continued Stability
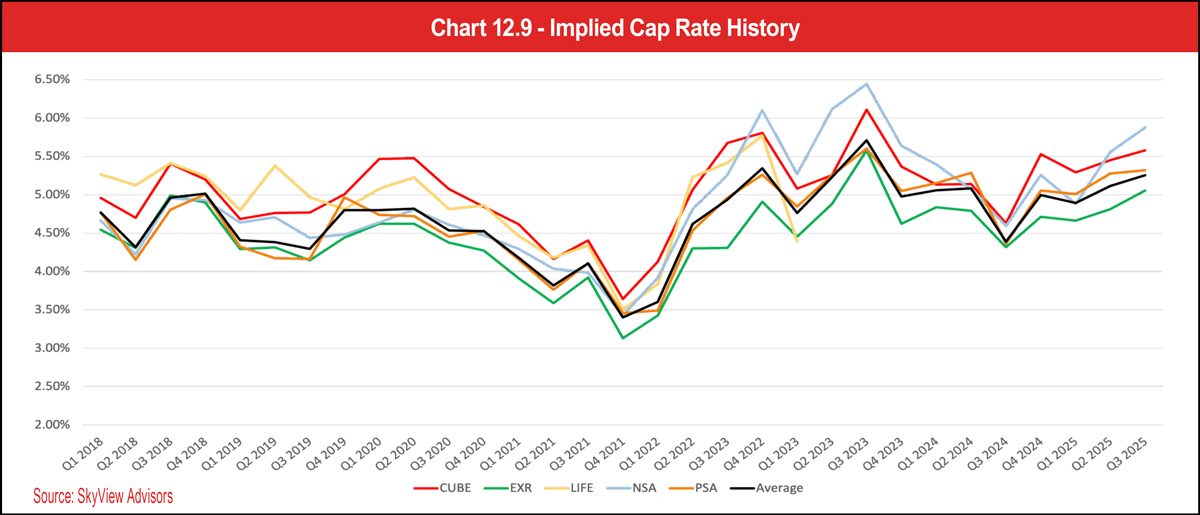
The high interest rates of 2025 changed the self-storage landscape, yet it was the kind of market correction that had, in varying degrees, been expected within the industry. Despite all the economic factors that led to such stabilization, the sector remains a sound investment, both for traditional and RV and boat storage. Q3 of 2025 brought sellers becoming more realistic about real estate values, and major operators, such as Public Storage, experienced capitalization rates in the mid-5 percent range. Moreover, 2026 projections point toward continued stability in rates.

See Chart 12.9.

Chart 12.9 - Implied Cap Rate History