

Section 10 | Site Information
A blue-themed graphic showing various line charts, bar graphs, and circular data icons overlaid on an office background.
U

nderstanding the dynamics of the complete rental experience helps operators make important business decisions about marketing, staffing, the use of technology, and on-site services. This section builds on the customer traits data in Section 5, adding critical site information statistics to help you optimize your business and maximize your profits. Taken from the SSA’s 2025 Self Storage Demand Study, data is analyzed and compared by region, urbanization, customer type, and other factors.
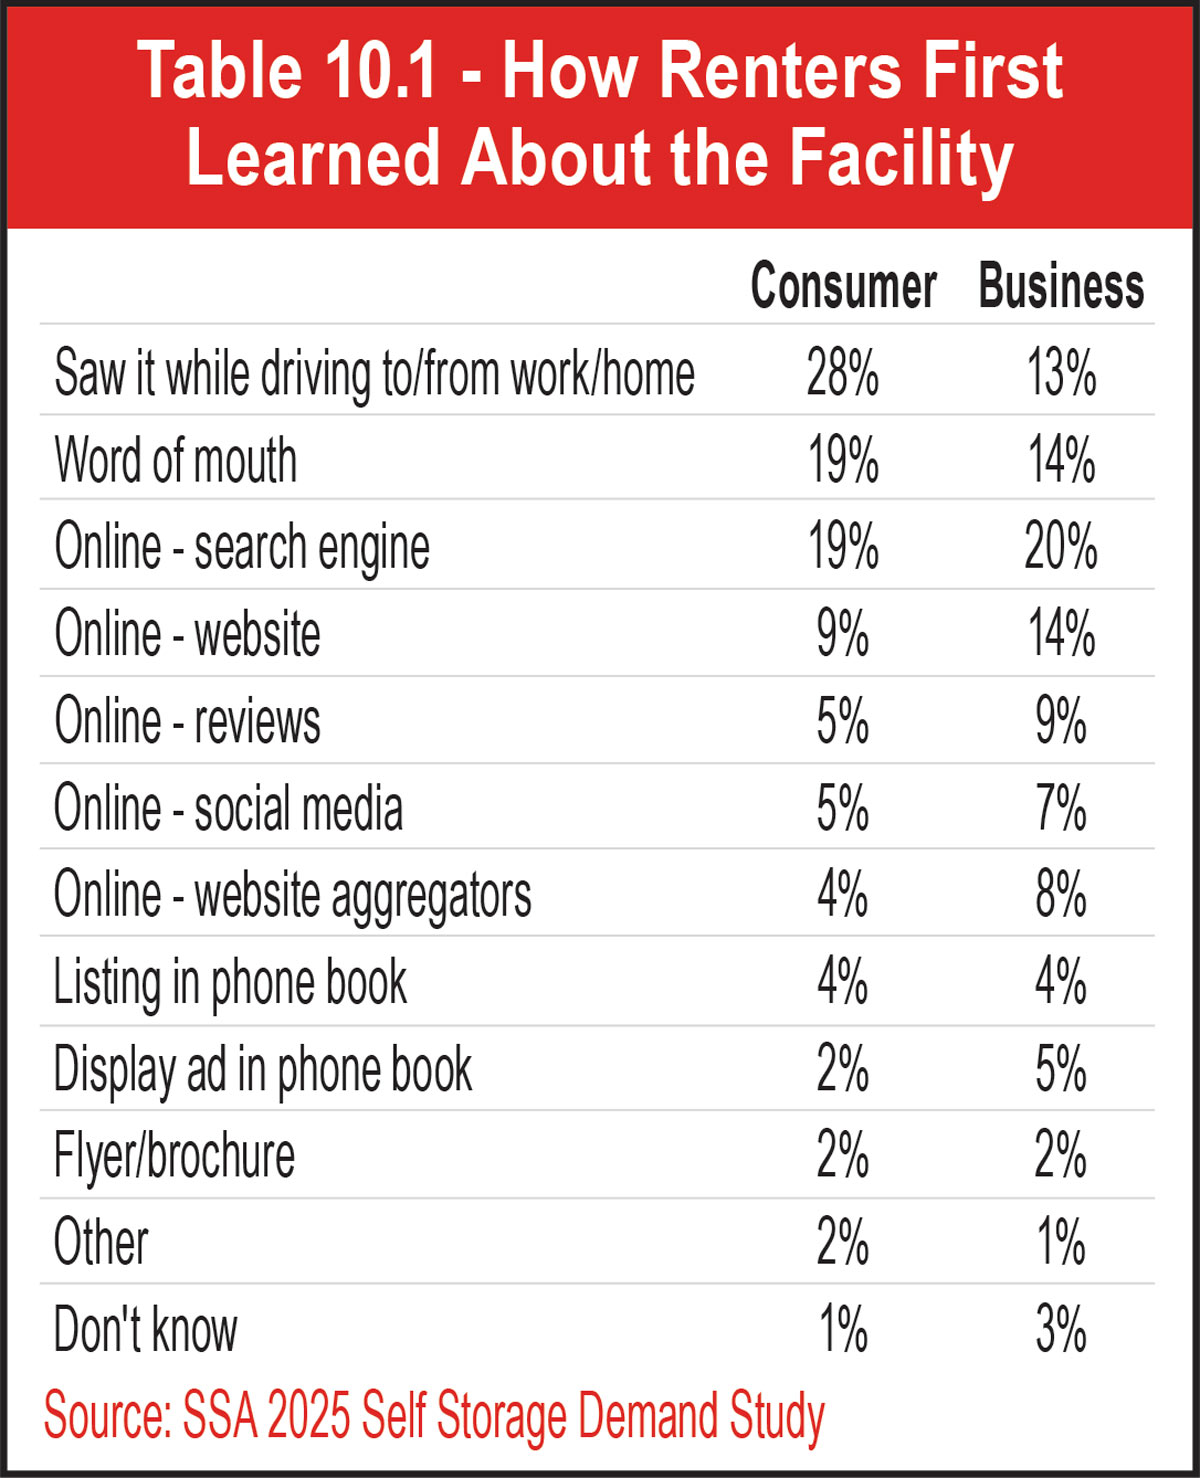
Table 10.1 - How Renters First Learned About the Facility
Finding A Facility
Before customers become tenants, they must find your self-storage facility. Customers find facilities through various marketing channels, as listed in Table 10.1. Nearly one-third (28 percent) of consumer (also referred to as residential) renters reported that they first learned about a facility while driving to or from their home or place of work.

This underscores the importance of having a location with a high traffic count. The greater the number of cars driving by every day, the more visibility you have and the more you are on the mind of the prospect when they develop a need for space. Remember, self-storage is a commodity. People “discover” your facility when they need storage, even if they have driven by your store hundreds of times.

Location seems less important to business renters, though, as only 13 percent of them first learned of a facility via drive-by. It is possible that they end up renting units at facilities that are not located within their daily commute but still close to their place of employment. Online search engine was the way 20 percent of business renters and 19 percent of consumer renters first learned of a facility. Word of mouth and facility websites were two other popular choices for both types of renters, but 5 percent fewer business renters cited word of mouth than consumer renters. Table 10.1 also shows that business renters are twice as likely to learn of a facility through online website aggregators than consumer renters (8 percent vs. 4 percent). Somewhat surprising is the fact that more business renters first learned of a facility through social media or online reviews than consumer renters.

See Table 10.1 and Chart 10.1.
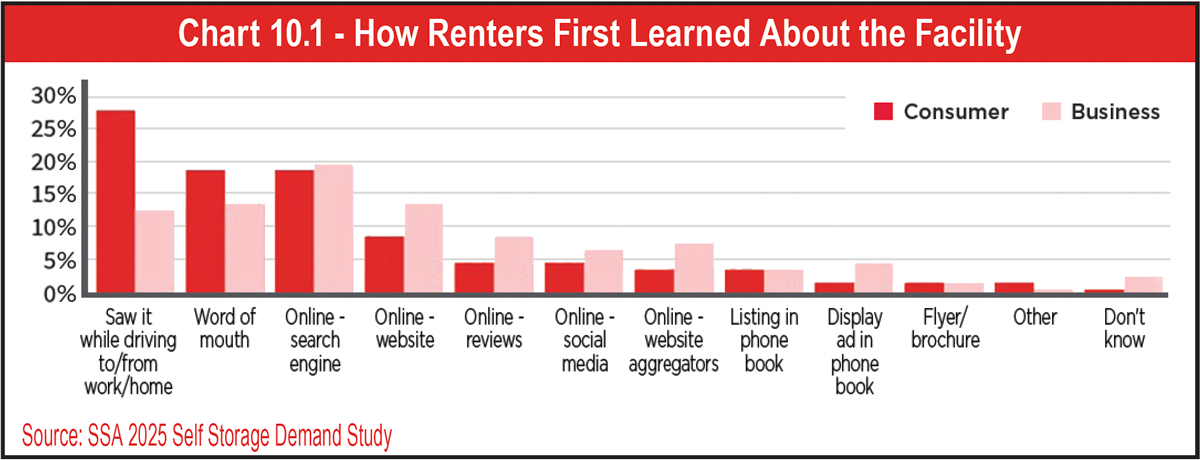
Chart 10.1 - How Renters First Learned About the Facility
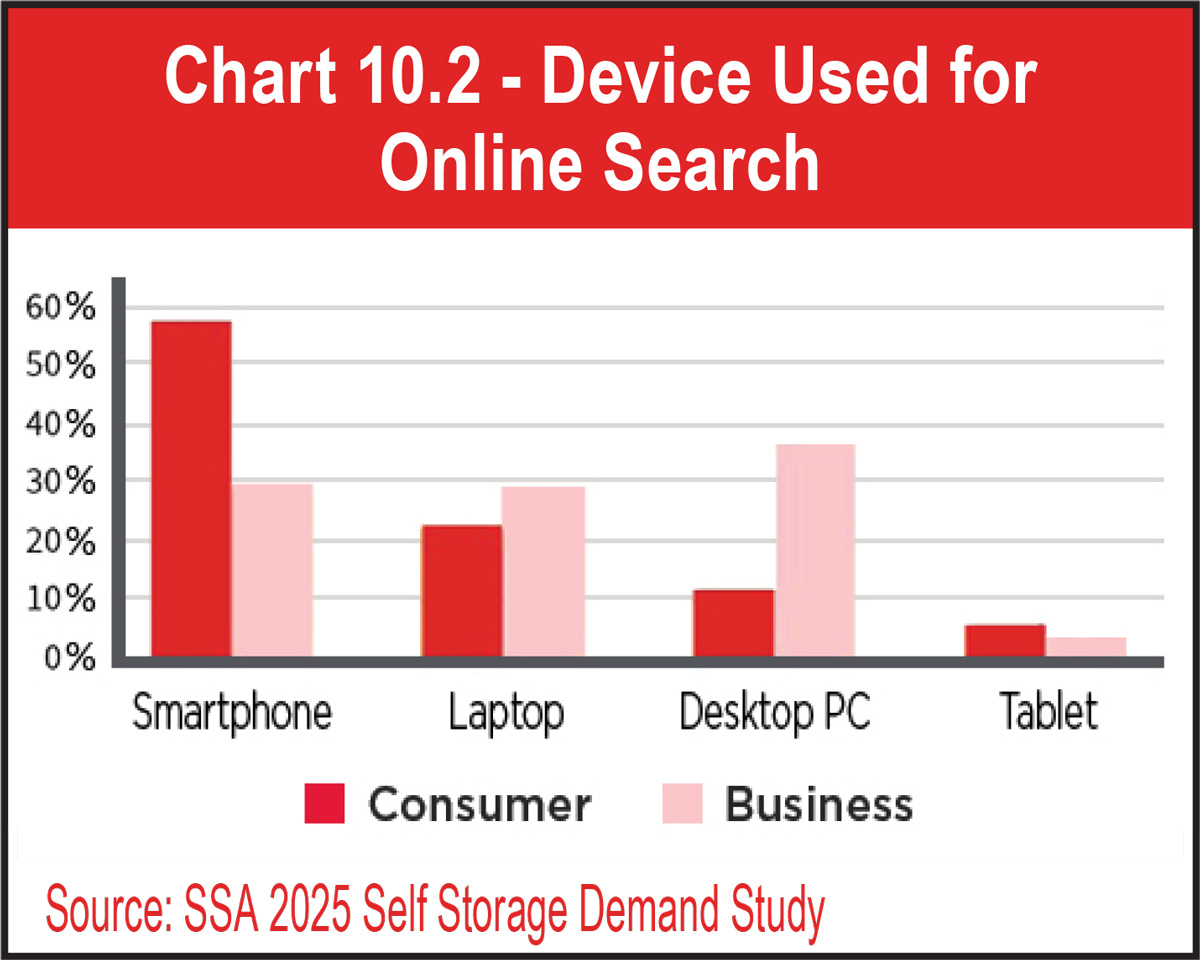
Renters who searched for a facility online used four different devices to do so: smartphone, laptop, desktop PC, or tablet. Smartphone is clearly the preferred search device for consumer renters (58 percent), so self-storage operators should ensure that their websites are both fast and mobile friendly, especially since this percentage has increased by nearly 8 percent from 2023 to 2025. Business renters most often search from their desktop PCs, as reported by 37 percent.

See Chart 10.2.

Chart 10.2 - Device Used for
Online Search
Making Contact
After finding facilities, customers must contact them to obtain additional information and/or secure a unit rental. How many facilities do they typically contact? According to the 2025 Self Storage Demand Study, more than half (57 percent) of consumer renters rent from the first facility they contact, which means they contacted one self-storage property. Similarly, 43 percent of business renters called only one facility. Twenty-eight percent of consumer and 38 percent of business renters contacted two facilities. Three or more facilities were contacted by 20 percent of business and 15 percent of consumer renters. These percentages show that business renters are more inclined to call multiple facilities before making rental decisions, but this could simply be related to the fact that many businesses require employees to review and/or submit multiple price quotes for expenses prior to approval.

See Chart 10.3.

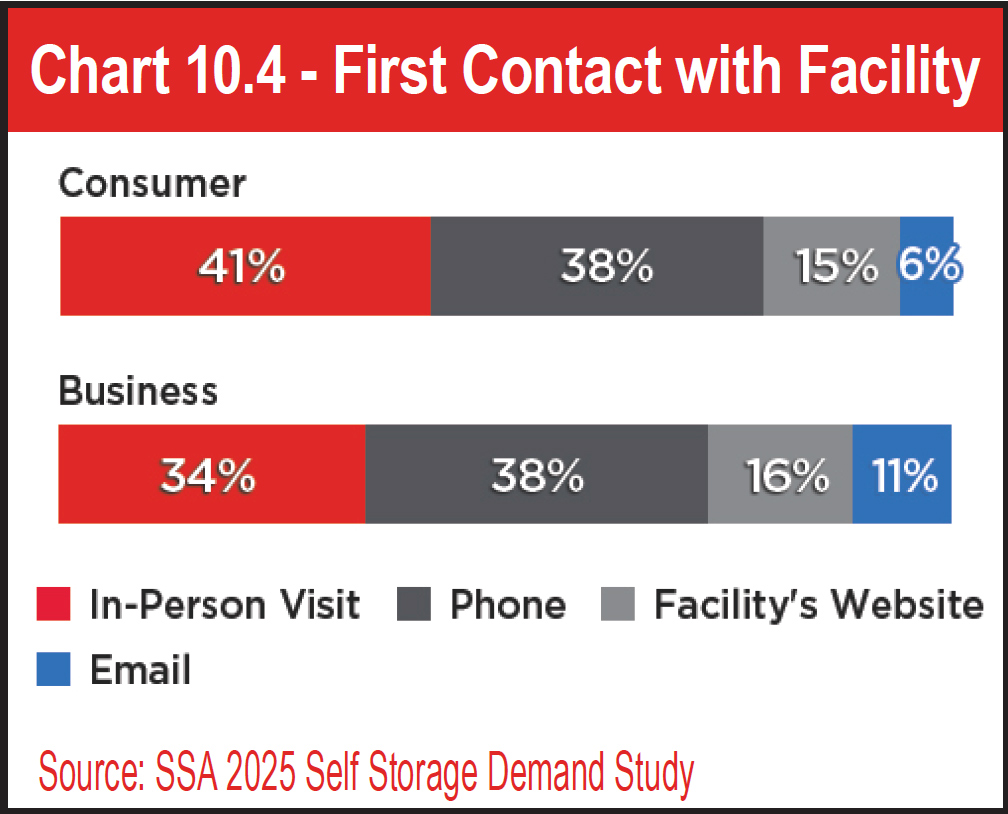
When first contacting a facility, 38 percent of consumer and business renters pick up the phone. For consumer renters, this percentage has dropped by 5.2 percent since 2023, with that portion of renters opting to instead visit the facility’s website or make an in-person visit in 2025. Compared to consumer renters, business renters are nearly twice as likely to make first contact via email.

See Chart 10.4.
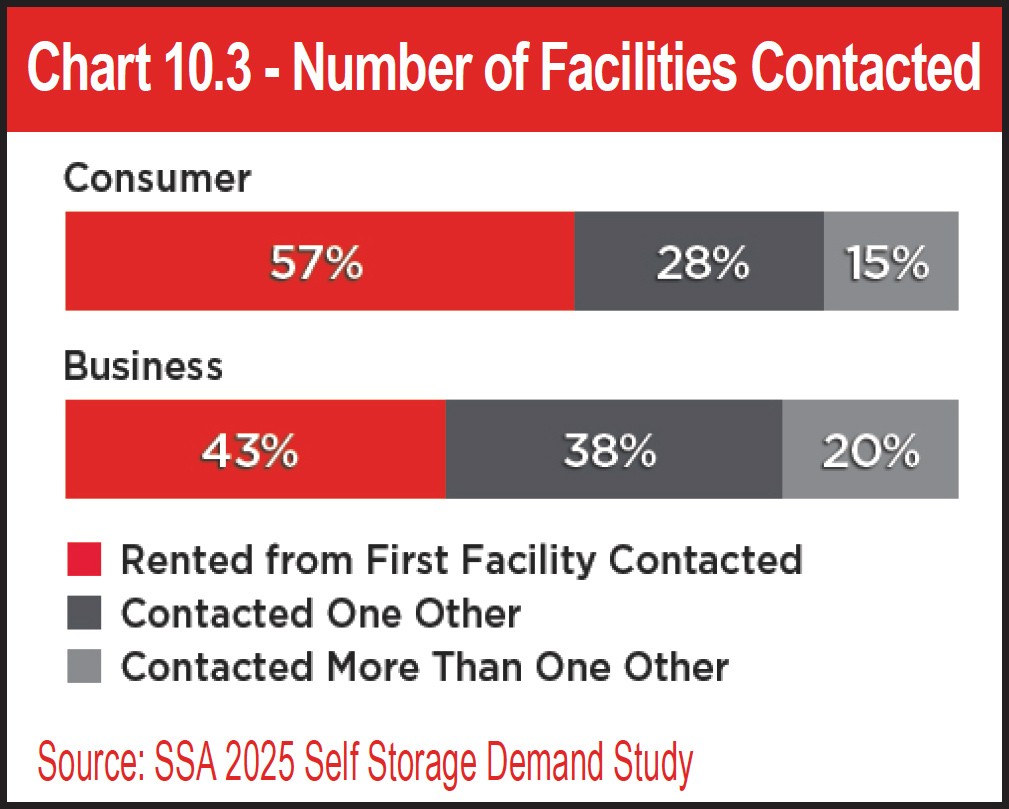
Chart 10.3 - Number of Facilities Contacted
Chart 10.4 - First Contact with Facility
If the phone is the No. 1 channel used by consumers to contact you, you’d better answer the phone! Regardless of your management style (traditional on-site management, remote management, a hybrid model, or third-party management) or use of services such as call centers, answering the phone should be a No. 1 priority. Consumers will not wait days for a call back; they may not even wait five rings for the phone to be answered. Picking up the phone every time it rings is the best way to follow up on a lead.
Chart 10.5 - Information Sought
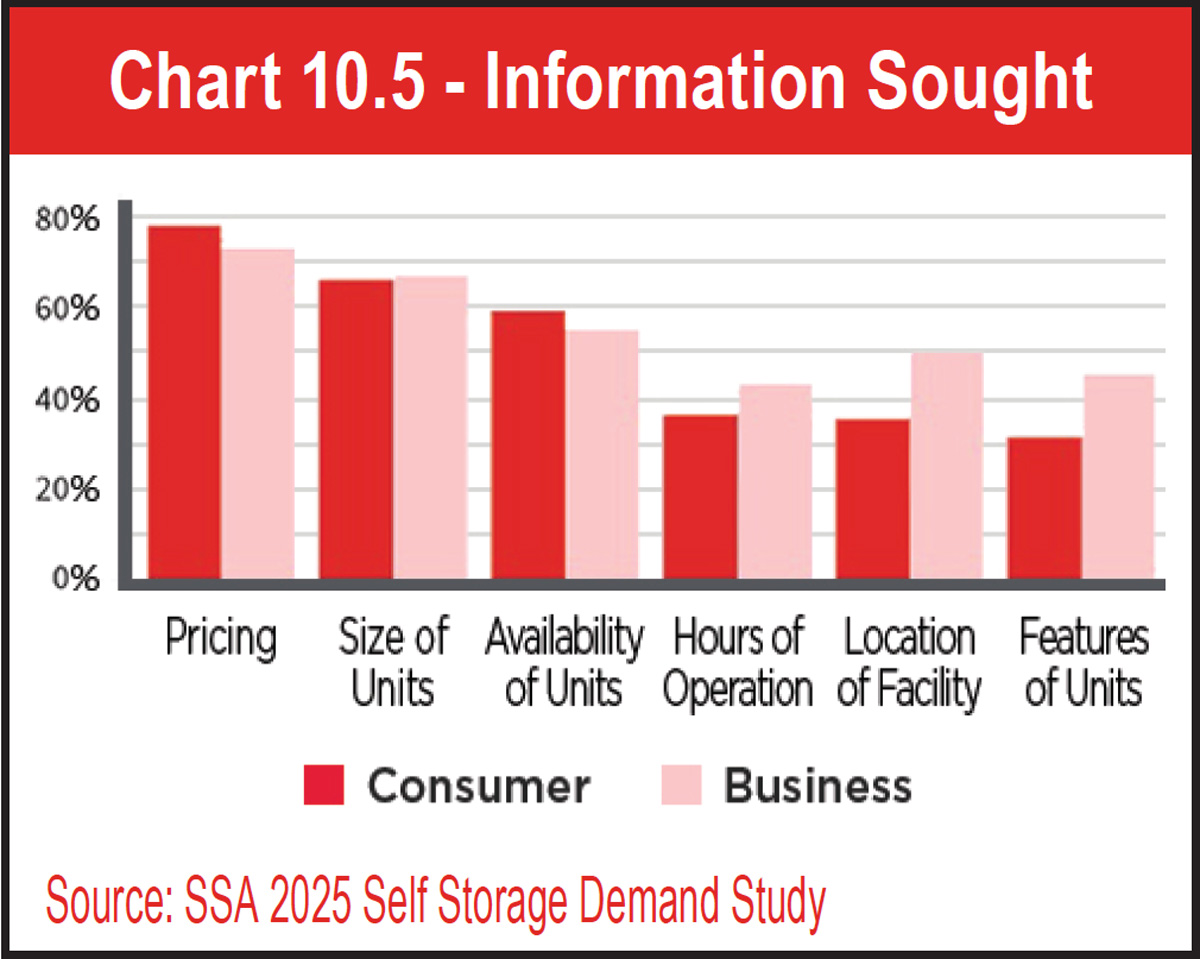
When customers make contact, what information are they seeking? For both renter types, the most frequent answer to that question is pricing. Although managers are trained not to sell on price, it’s still the first thing most customers ask about. In fact, 79 percent of consumer and 74 percent of business renters sought pricing information. While there are still self-storage operators who don’t post their rates online, it is becoming a more common practice. After pricing, renters tend to inquire about the sizes and availability of units more than half of the time. Other inquiries include the facility’s location, hours, and features—all of which should be listed on the facility’s website and included within its Google Business Profile (GBP) and social media.

See Chart 10.5.

Chart 10.6 - Type of Unit Rented
Units Rented
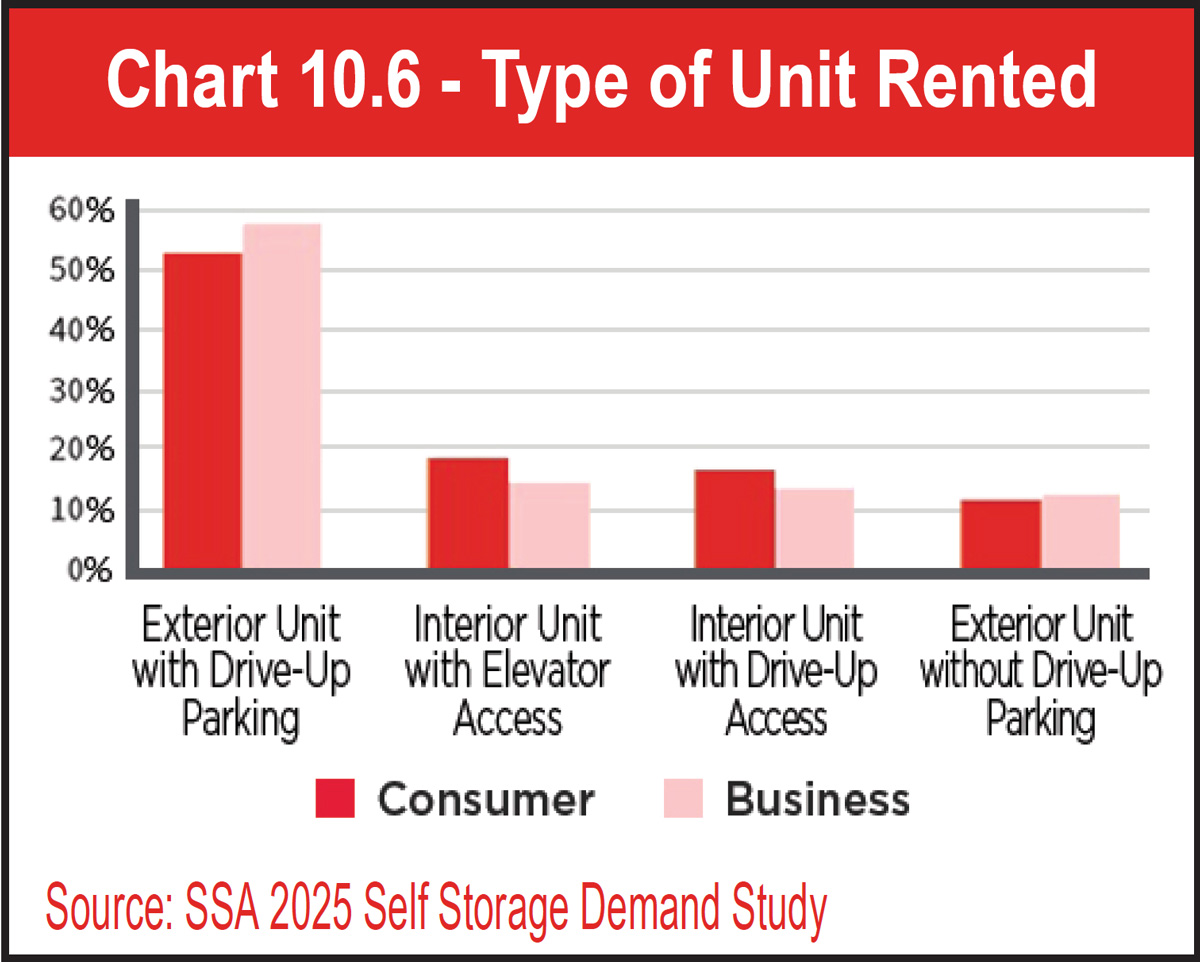
Once customers have gathered enough information to make a rental decision, they move into their units. However, not all units are created the same. In addition to various unit sizes, there are different types of units. Chart 10.6 presents data on four possibilities: exterior unit with drive-up parking, exterior unit without drive-up parking, interior unit with elevator access, and interior unit with drive-up access. More than half of consumer (53 percent) and business (58 percent) renters rent exterior units with drive-up parking; compared to the 2023 Self Storage Demand Study, 2.7 percent fewer consumer renters used this unit type in 2025. These exterior units with drive-up parking are likely located at facilities comprised of multiple single-story buildings with drive aisles between the rows of buildings. This is the original site layout for self-storage facilities and is much more common in rural and suburban areas than space-constrained urban markets. Interior units with elevator access or drive-up access are typically found within multistory facilities in urban areas because building vertically is necessary due to the cost and availability of land. A combined total of 36 percent of consumer renters and 29 percent of business renters reported renting an interior unit with either drive-up or elevator access. The fewest number of renters opted for exterior units without drive-up parking; this option would not be favored in areas with severe weather, as lugging belongings any distance in the extreme heat, cold, or precipitation is not a pleasant experience.

See Chart 10.6.

Chart 10.7 - Units Currently Heated or Air Conditioned
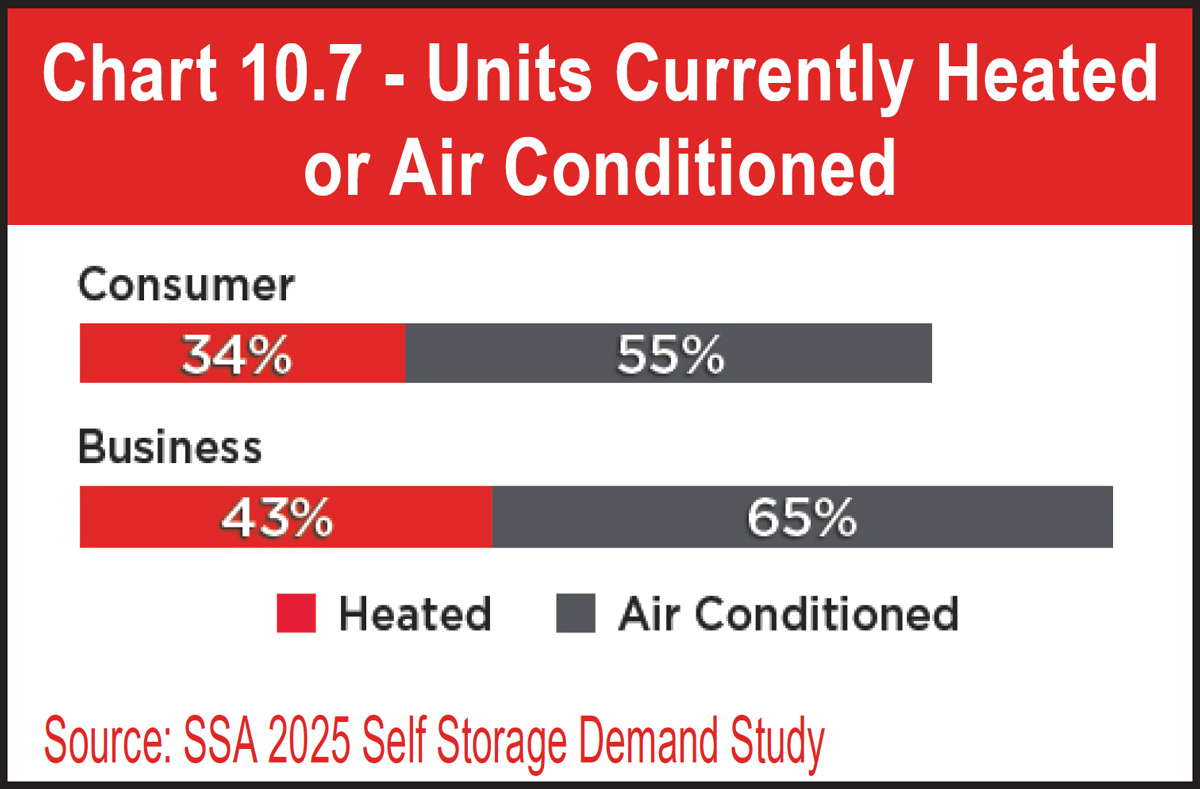
Some of the units rented by business and consumer customers may be heated or air conditioned to better protect the contents they hold. Although sometimes collectively referred to as “climate-controlled” features, both heating and air conditioning are not always offered for the same units. Table 10.2 shows how many renters had rented units that were heated or air conditioned. Twenty-one percent more business customers rented heated units than consumer customers. Similarly, air-conditioned units were rented by 22 percent more business renters than consumer. Perhaps more business renters choose heated and air-conditioned units because they are more aware of and concerned about the potential degradation of stored products from fluctuating temperatures. Between heat and air conditioning, about 10 percent more renters opted for air-conditioned units. This could correlate with the seasonality of self-storage usage, where an uptick in move-in activity occurs during the springtime and into summer. This seasonality is discussed in more detail in the occupancy and rental rates sections.

See Chart 10.7.

Chart 10.8 - Primary Unit Size
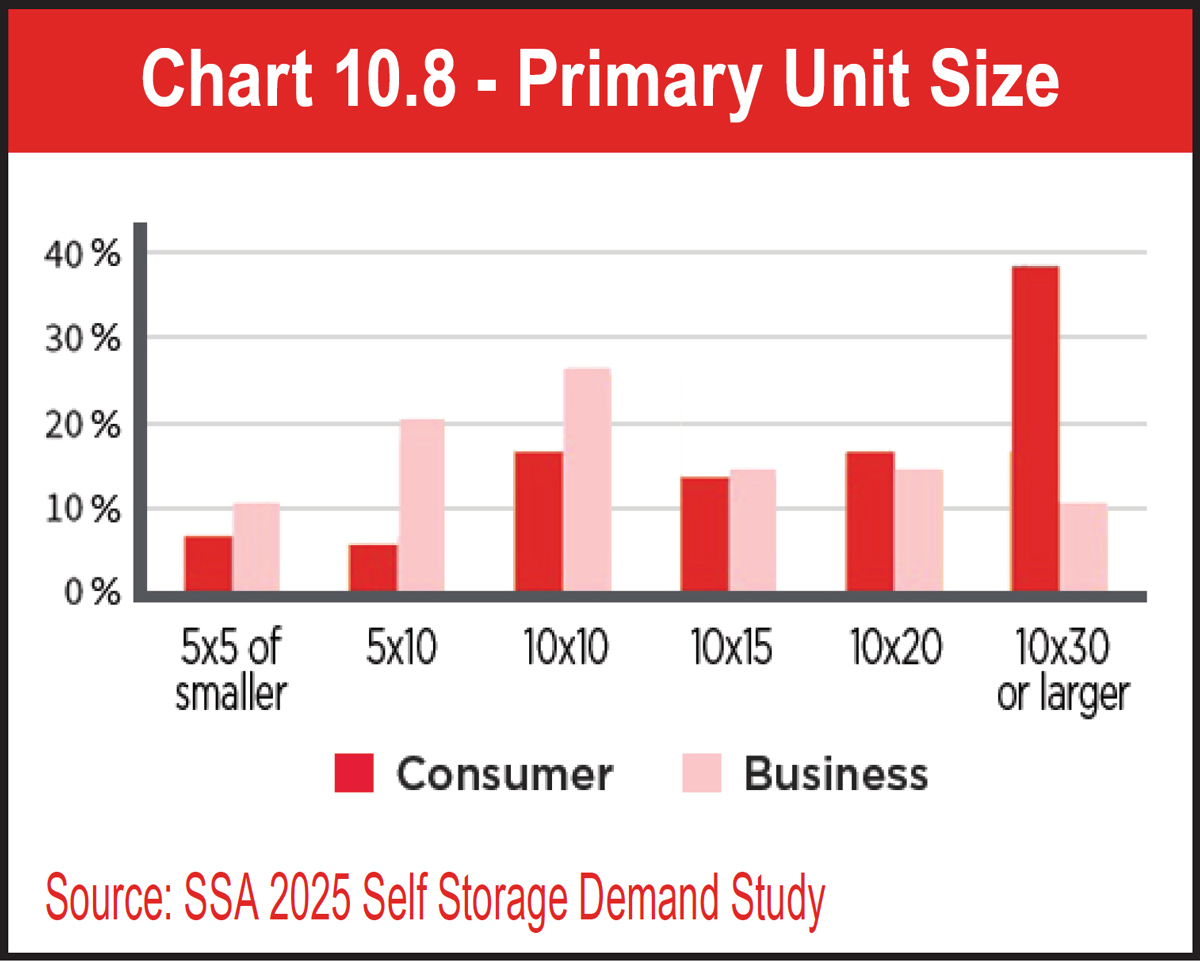
Customers select their unit size based on how much they plan to store. As seen in Chart 10.8, 10-by-10 is the size most consumers rent. This has been true for 20 years, according to data from the SSA’s 2023 Self Storage Demand Study. Next in line is the 5-by-10, which 21 percent of consumer renters use. Tied for third at 15 percent are 10-by-15 and 10-by-20. Business renters clearly have more items to store, as they primarily rent units that are 10-by-30 or larger.

See Chart 10.8.

According to the 2025 Self Storage Demand Study, the top three types of business renters are computers/IT, retail, and manufacturing. These business renters are using self-storage to store inventory (43 percent) and office supplies, furniture, or equipment (41 percent). Because their storage needs are vast, business renters often rent multiple units to adequately house their inventory, supplies, tools, and/or equipment. Thirty percent of business renters rent four or more units. Another 44 percent rent either two or three units, while 26 percent rent only one.

See Chart 10.9.
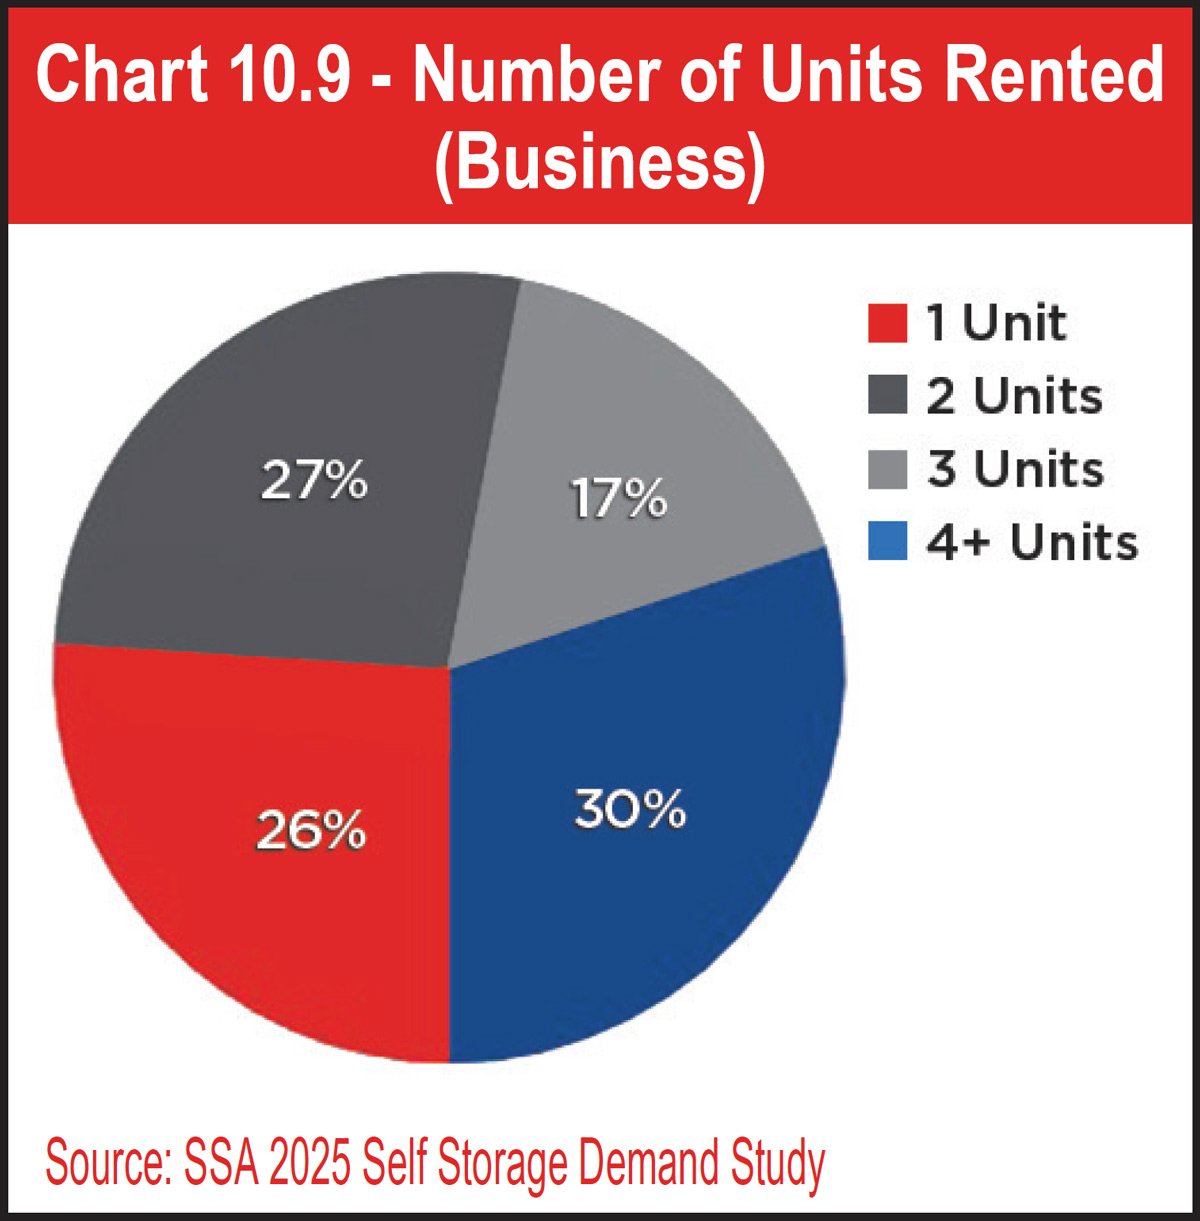
Chart 10.9 - Number of Units Rented (Business)
Costs And Purchases
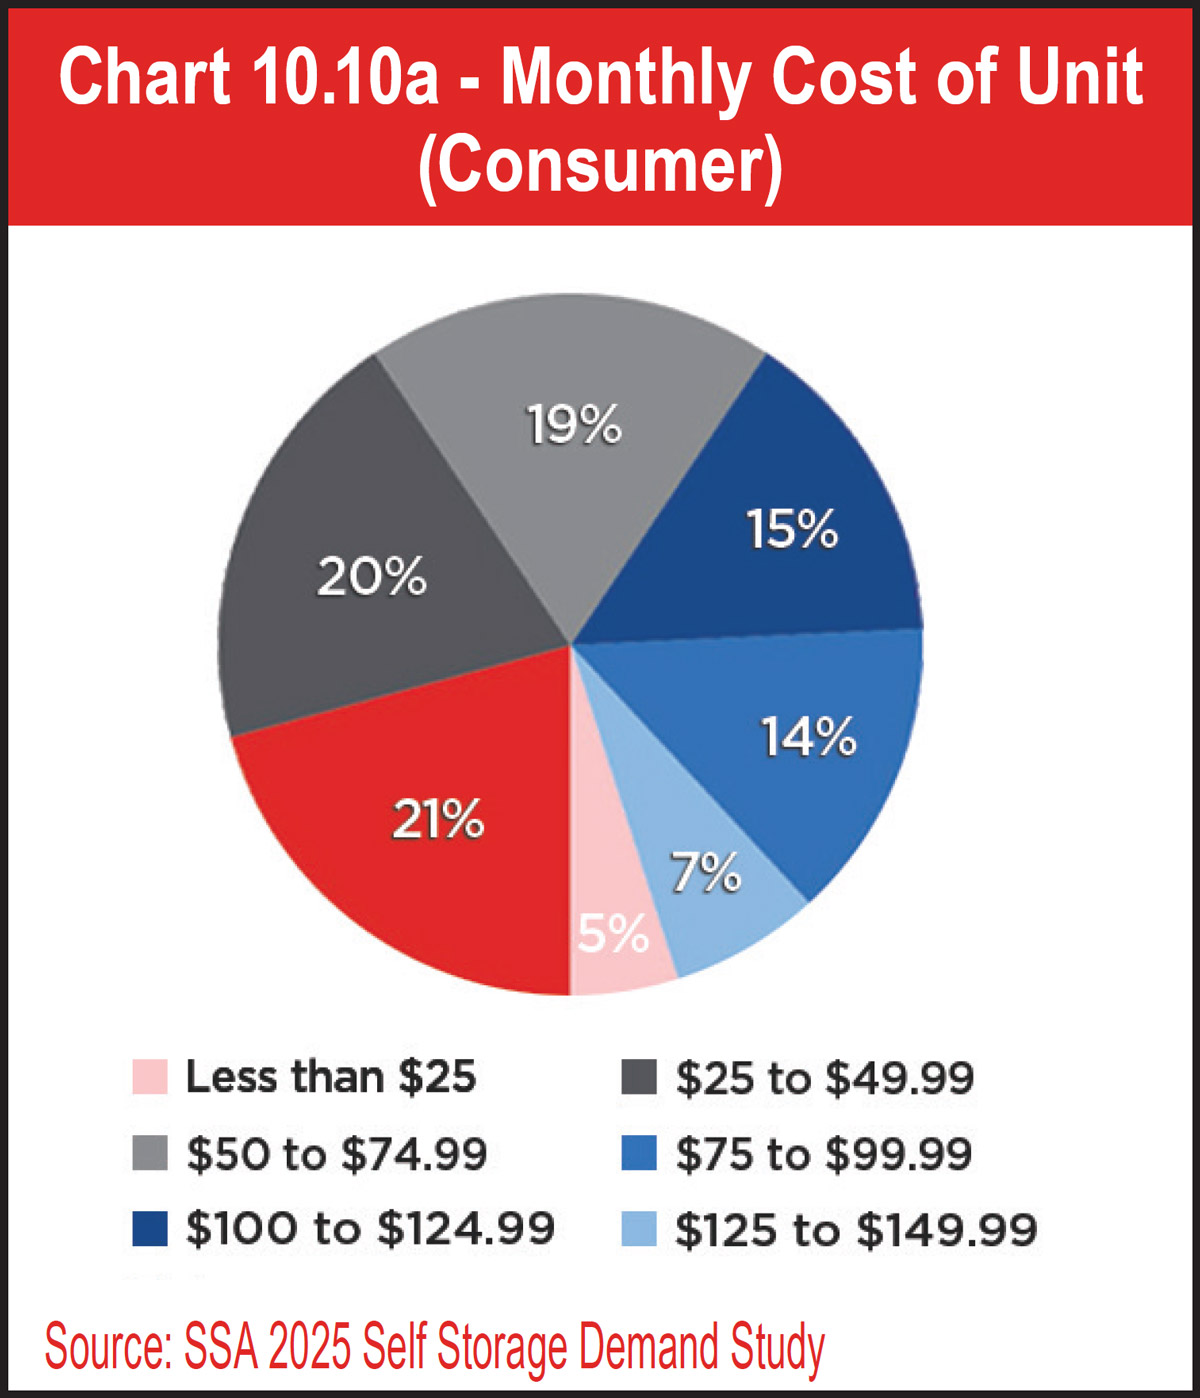
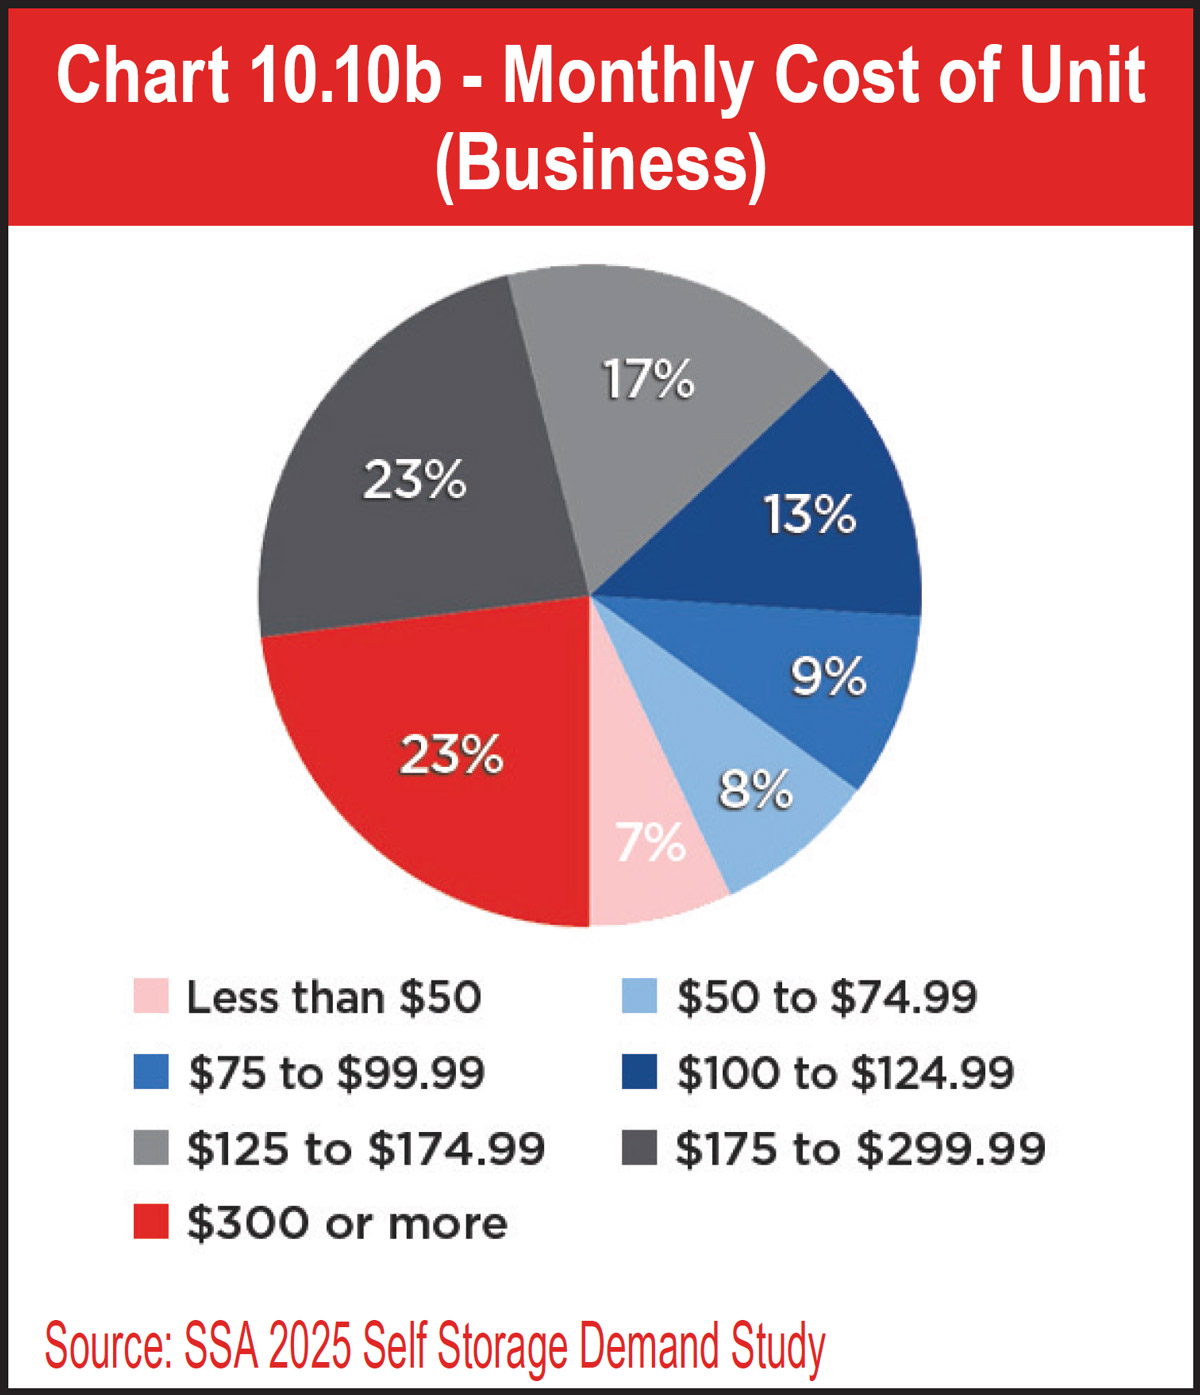
Like any other product, unit costs vary by size and type. Because the SSA uses slightly different dollar amounts for business and consumer renters, data on their monthly unit cost is presented separately in Charts 10.10a and 10.10b. Overall, consumer renters report paying less for their unit than business renters. It is possible that the cost for business renters’ units include additional fees or charges for services like 24-hour access, package acceptance, or other office-related amenities. As shown in 10.10a, 21 percent of consumers spend $150 or more, but another 20 percent pay $25 to $49.99 per month. Nineteen percent pay $50 to $74.99 each month, while a combined total of 36 percent spend $75 to $149.99 on their storage unit. Only 5 percent spend less than $25 a month to rent a unit. On the high end, nearly a quarter of business renters (23 percent) pay $300 or more each month for their self-storage unit. Another 23 percent of business renters have a monthly rental rate that falls between $175 and $299.99. When condensed, 24 percent spend less than $100 and 30 percent of business renters pay $100 to $174.99 for their unit.

See Charts 10.10a and 10.10b.

Chart 10.10a - Monthly Cost of Unit (Consumer)
Chart 10.10b - Monthly Cost of Unit (Business)
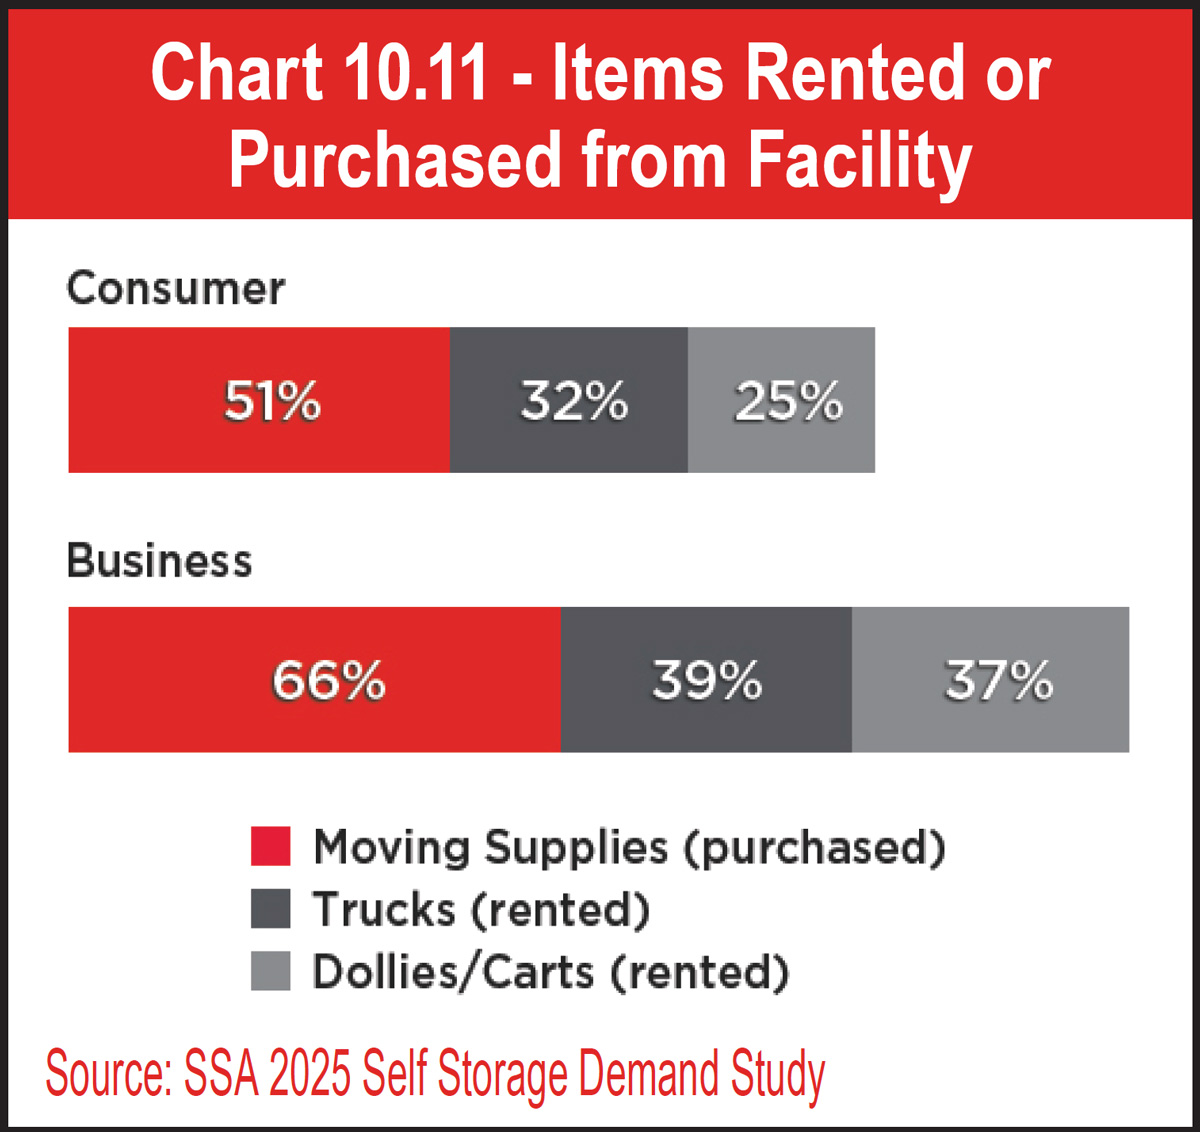
In addition to the unit cost, many renters choose to purchase moving supplies and/or rent moving trucks and dollies/carts. Like the results for heated and air-conditioned units, more business renters purchase/rent items than consumer renters. Perhaps they are less price-sensitive than consumers renters, as 15 percent more business renters purchased moving supplies when renting a unit. The fact that more than half of all renters purchased moving supplies proves that having a small retail area within the facility’s office for selling merchandise can be a profitable form of revenue.
Chart 10.11 - Items Rented or Purchased from Facility
The variance between consumer and business renters was smaller for trucks, with 32 percent and 39 percent renting them, respectfully. Finally, 37 percent of business customers rented dollies/carts, whereas only 25 percent of consumers paid to rent those. If some self-storage facilities didn’t offer free moving trucks, carts, and dollies as customer benefits, these percentages would likely be higher.

See Chart 10.11.

Site Features And Visits
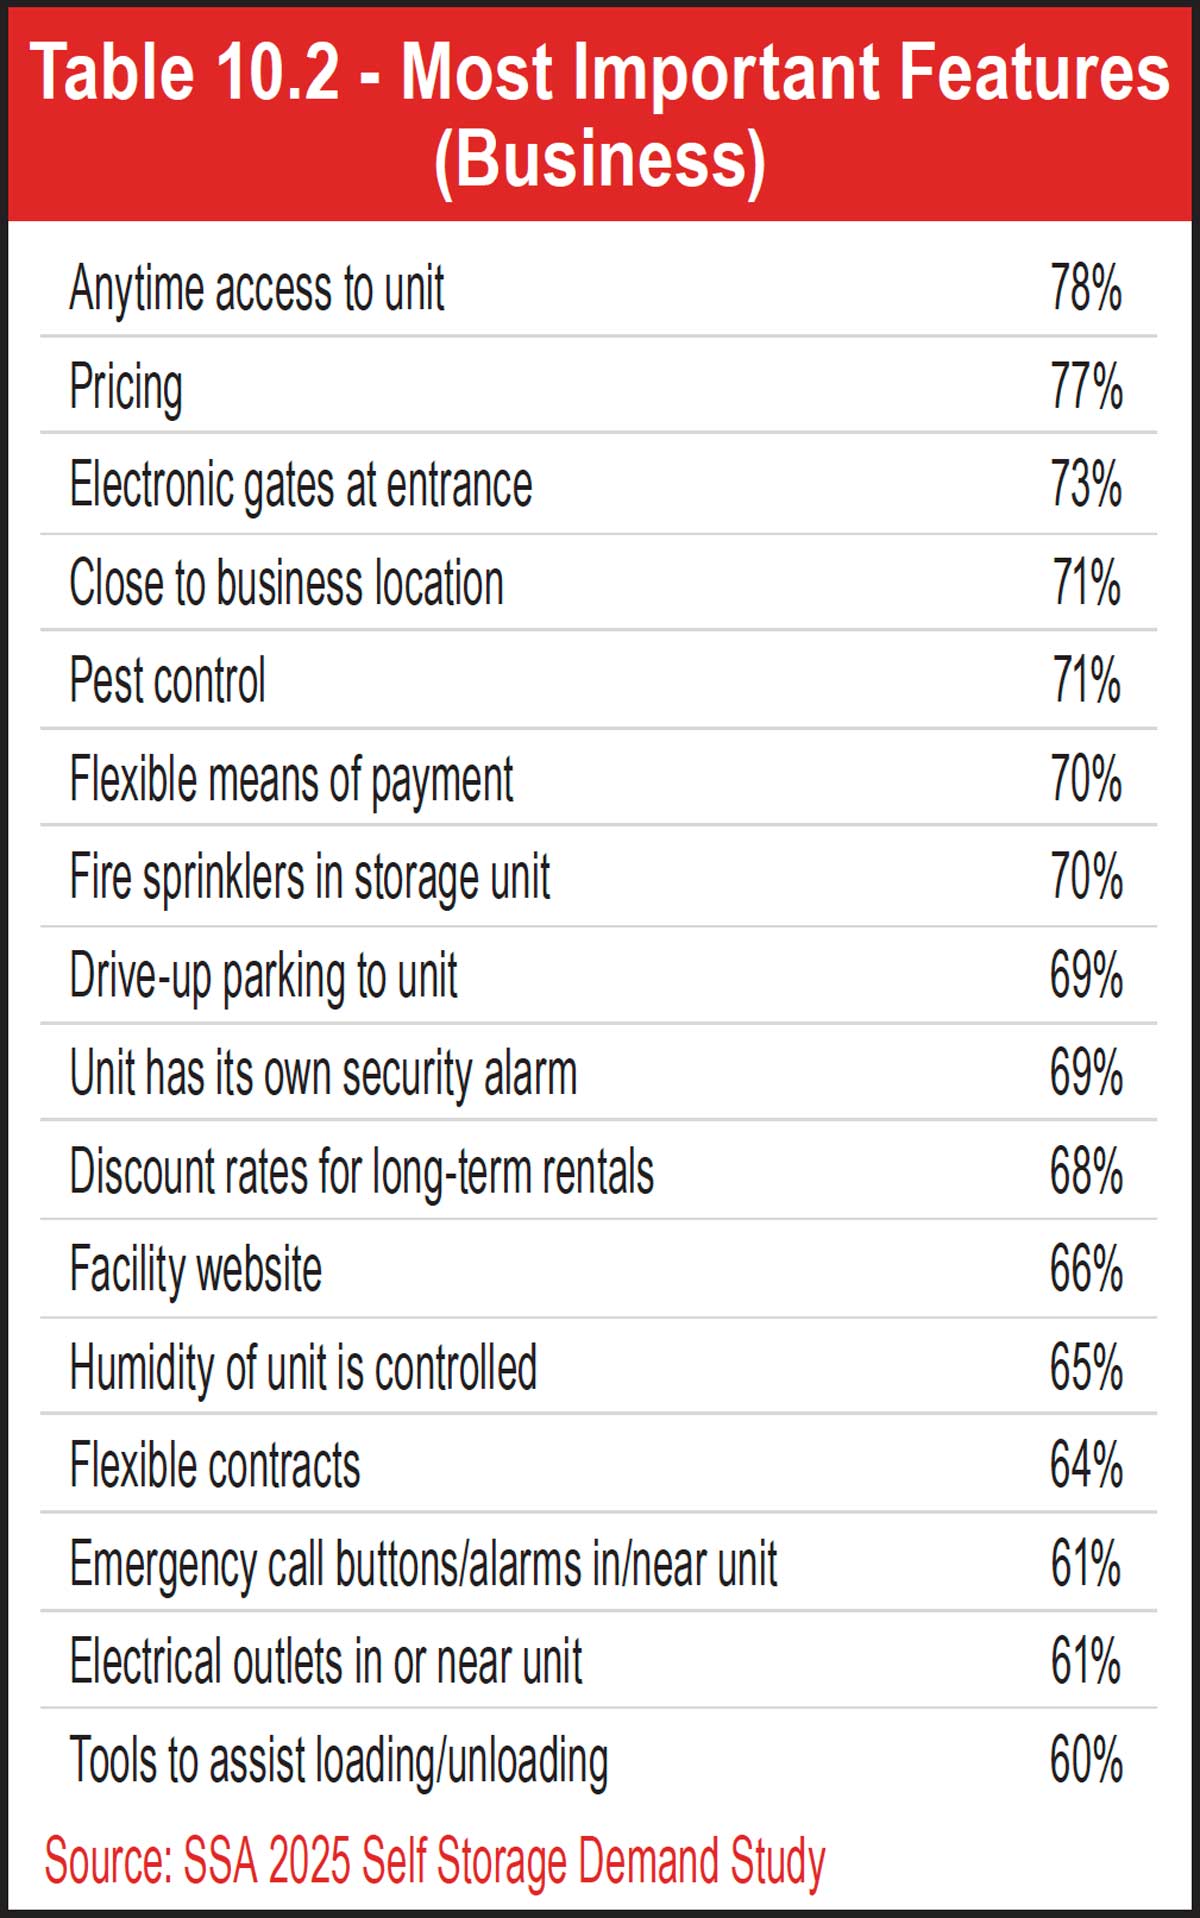
When it comes to facility features and amenities, 78 percent of business renters value anytime access to their units, as shown in Table 10.2. Pricing is close behind, with 77 percent of business renters choosing it as an important feature. Rounding out the top five most important features are electronic gates at entrance, proximity to business location, and pest control. Flexible payment options, which was selected as an important feature by 70 percent of business renters, are analyzed in more detail within the Customer Traits section. Although not listed, some self-storage facilities offer additional amenities to cater to business customers’ needs, such as conference rooms with boardroom tables, various office equipment, kitchenettes, and more. What’s more, according to the 2025 Self Storage Demand Study, about half of business renters are willing for pay more for many of the features they find important. For the features important to consumer renters, please refer to Section 5 on Customer Traits.

See Table 10.2.

Table 10.2 - Most Important Features (Business)
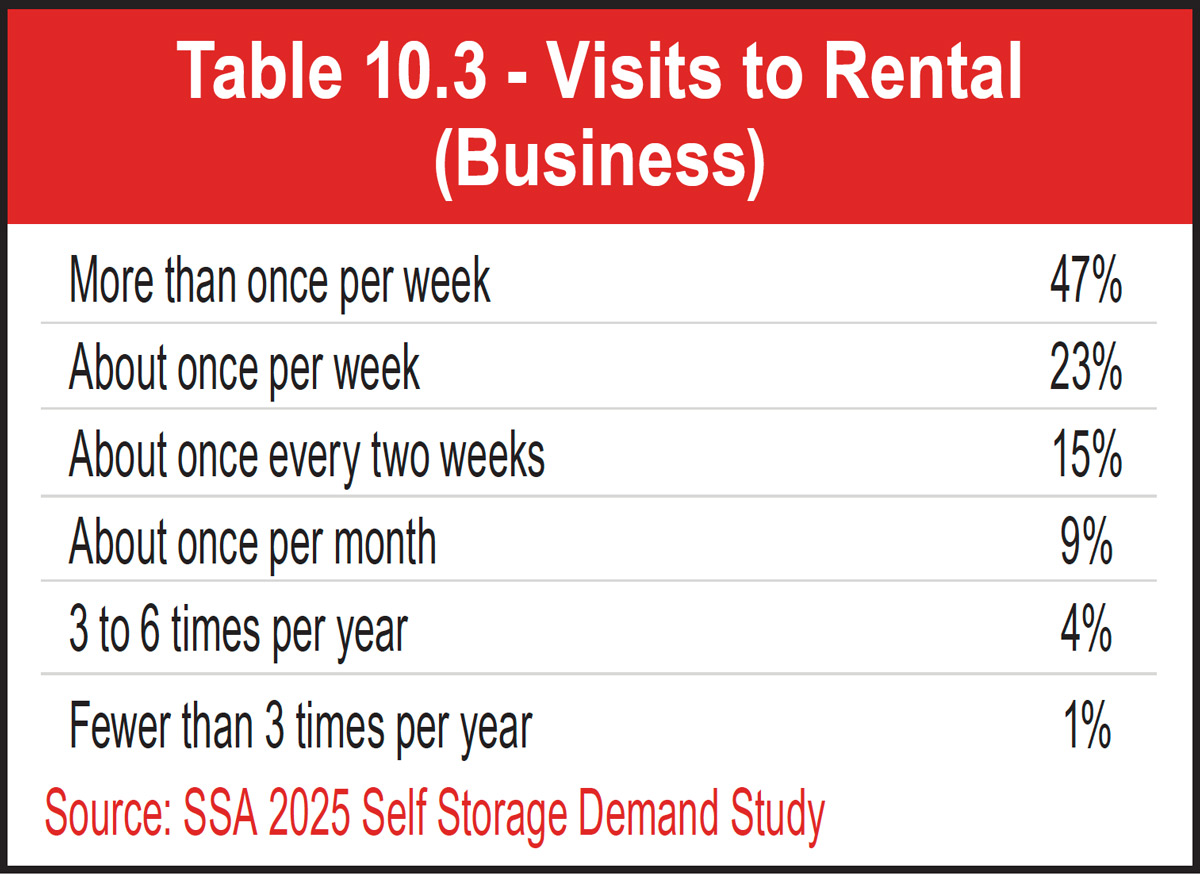
Like Gen-Z and millennial renters, business renters tend to visit their units more frequently than other consumer renters. Nearly half (47 percent) visit more than once per week, probably to remove, rotate, or stock inventory stored within the unit or gather supplies and equipment. Another 23 percent visit their unit about once per week. A total of 5 percent of business renters go to their unit six or fewer times per year, while 9 percent make monthly visits. Perhaps the business renters who visit less frequently are storing business records or other items that don’t require regular attention.

See Table 10.3.

Special Needs
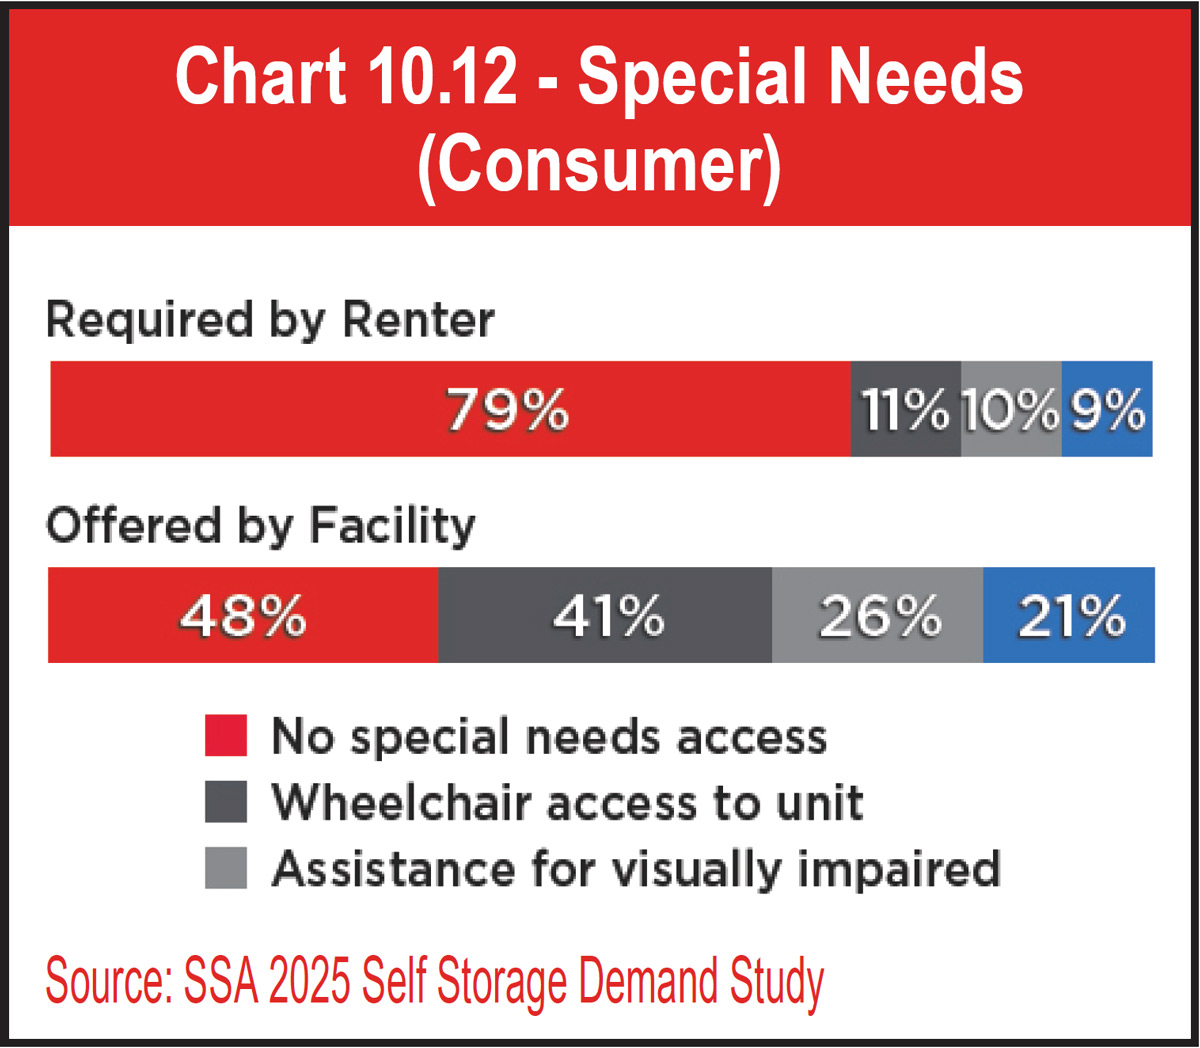
The 2025 Self Storage Demand Study also touches on special needs that do not fall into any of the important features categories, including wheelchair access and assistance for the visually and hearing impaired. As shown in Chart 10.12, most renters (79 percent) do not require special needs to access self-storage facilities. However, for renters who do need them, it is vital to find facilities offering them. Thanks to the Americans with Disabilities Act, there are some requirements that self-storage facilities must meet, such as having ADA accessible websites and pull ropes on the door handles of designated handicap units. While less than half (41 percent) of facilities offer wheelchair access, only 11 percent of renters needed it. Approximately a quarter (26 percent) of facilities offer assistance for the 10 percent of visually impaired renters, and 21 percent of facilities offer assistance for the 9 percent of hearing-impaired renters.

See Chart 10.12.

Table 10.3 - Visits to Rental (Business)
Chart 10.12 - Special Needs (Consumer)
Location And Travel Time
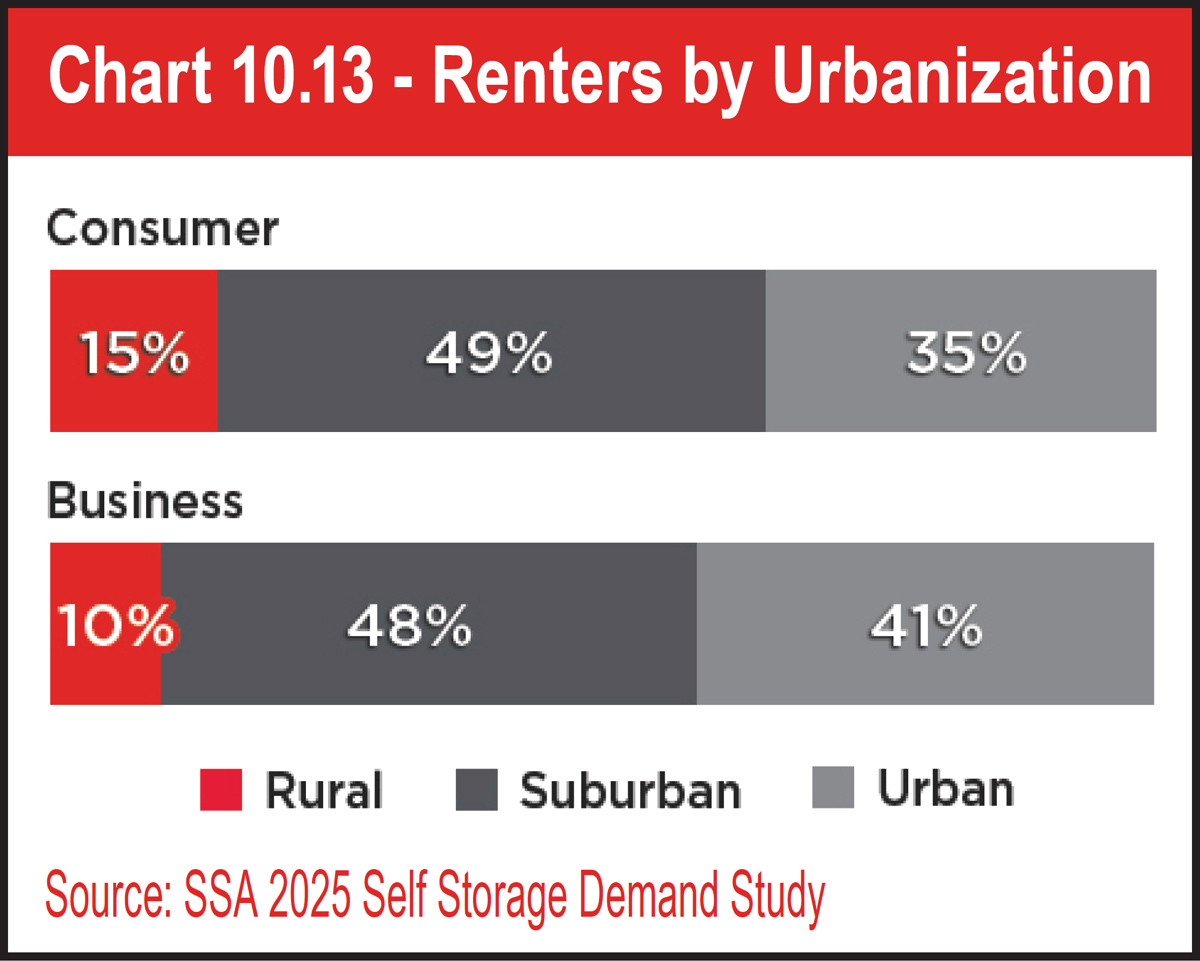
Two other important pieces of site information are where renters are from and their travel time to the facility. Chart 10.13 shows that most renters (49 percent consumer and 48 percent business) come from suburban areas. The other half of renters are from urban and rural areas. There are slightly more rural residential renters (15 percent) than rural business renters (10 percent). The reverse is true for urban areas, where 41 percent of renters are business and 35 percent are consumer.

See Chart 10.13.

Chart 10.13 - Renters by Urbanization
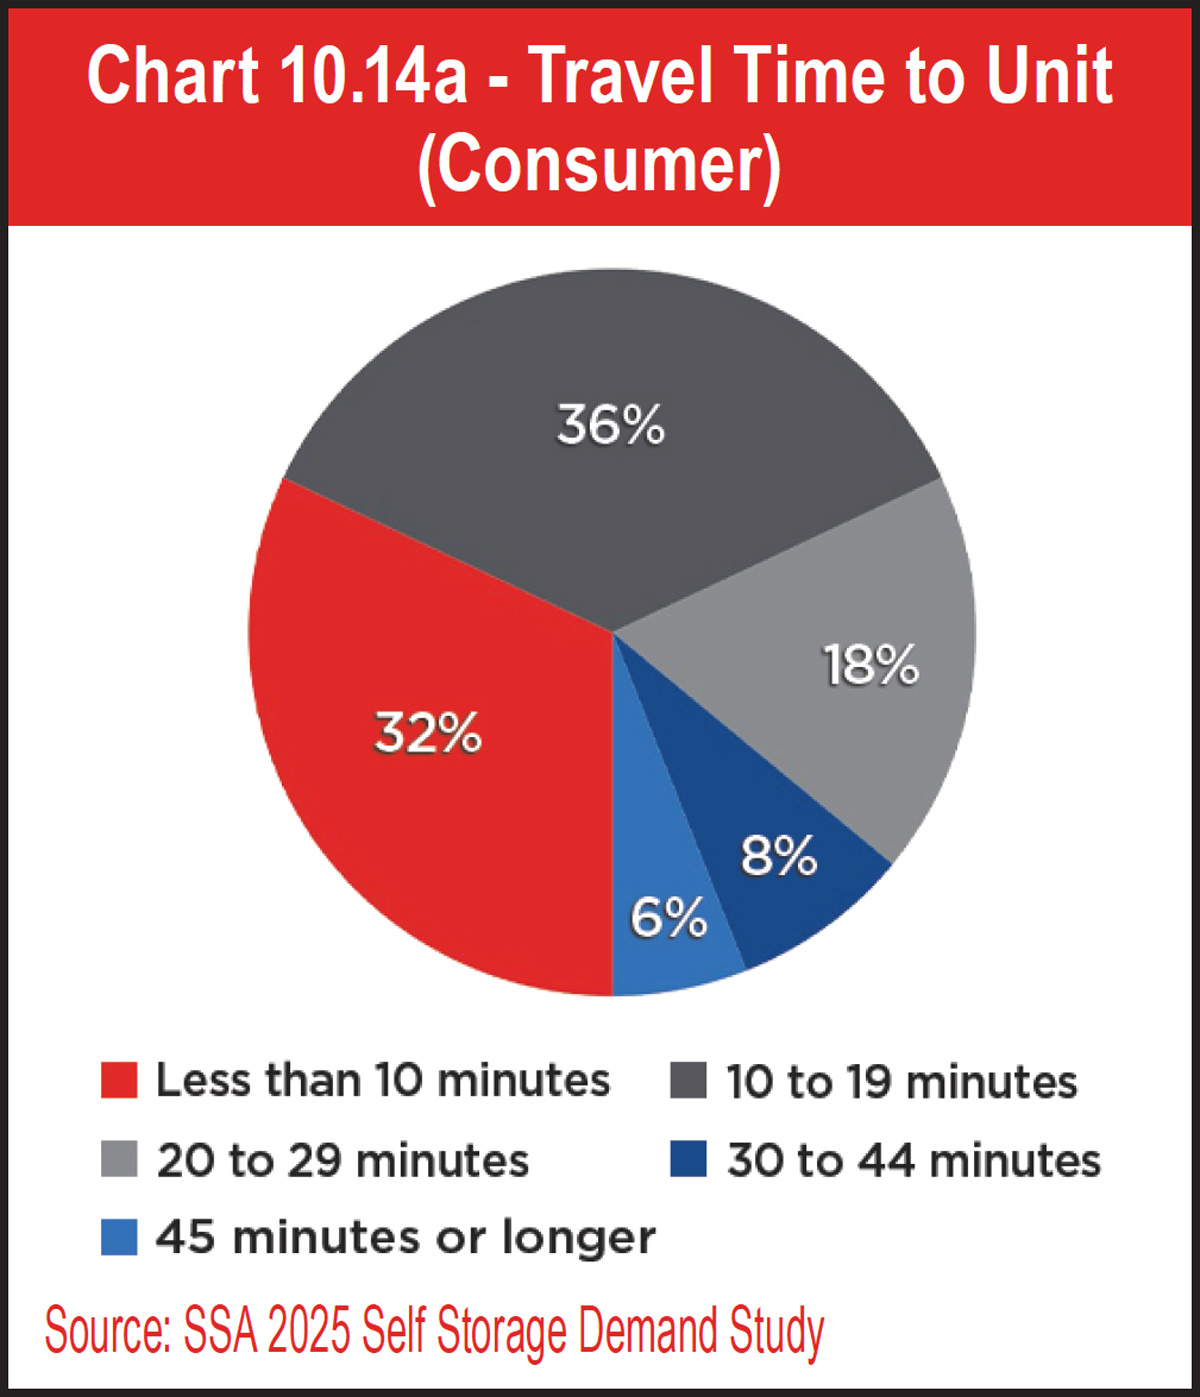
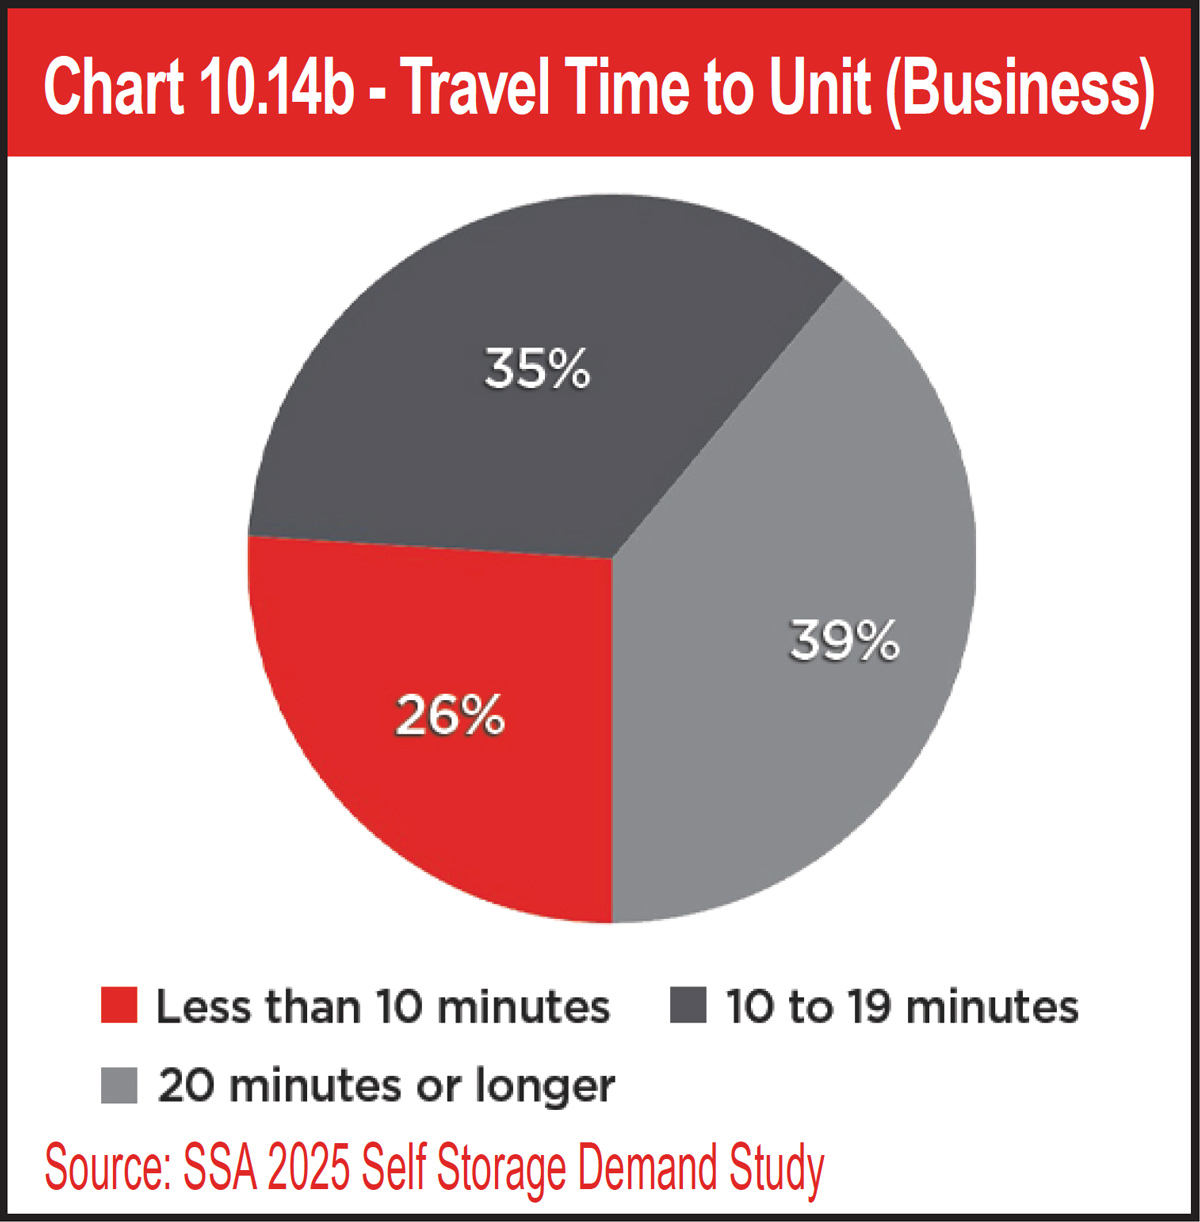
After looking at renter by urbanization, it’s time to see how long it takes renters to travel from their homes and businesses to their storage units. Two-thirds of consumer renters have a travel time of 19 minutes or less: 36 percent travel 10 to 19 minutes and 32 percent have a commute of less than 10 minutes. Eighteen percent are traveling 20 to 29 minutes, while 8 percent travel 30 to 44 minutes and 6 percent travel 45 minutes or longer. The travel times are categorized slightly different for business renters. Data shows that they seem to have longer travel times than consumers, with 39 percent traveling for 20 minutes or longer, which equates to 7 percent more of the business renter total than the consumer renter total (32 percent for 20 minutes or longer). Approximately a quarter (26 percent) of business renters travel less than 10 minutes, whereas 35 percent travel 10 to 19 minutes. Even though some of these travel times may seem too long for comfort, the 2025 Self Storage Demand Study reports that 91 percent of consumer renters find their travel time to be satisfactory.

See Charts 10.14a and 10.14b.

Chart 10.14a - Travel Time to Unit (Consumer)
Chart 10.14b - Travel Time to Unit (Business)
Length Of Stay
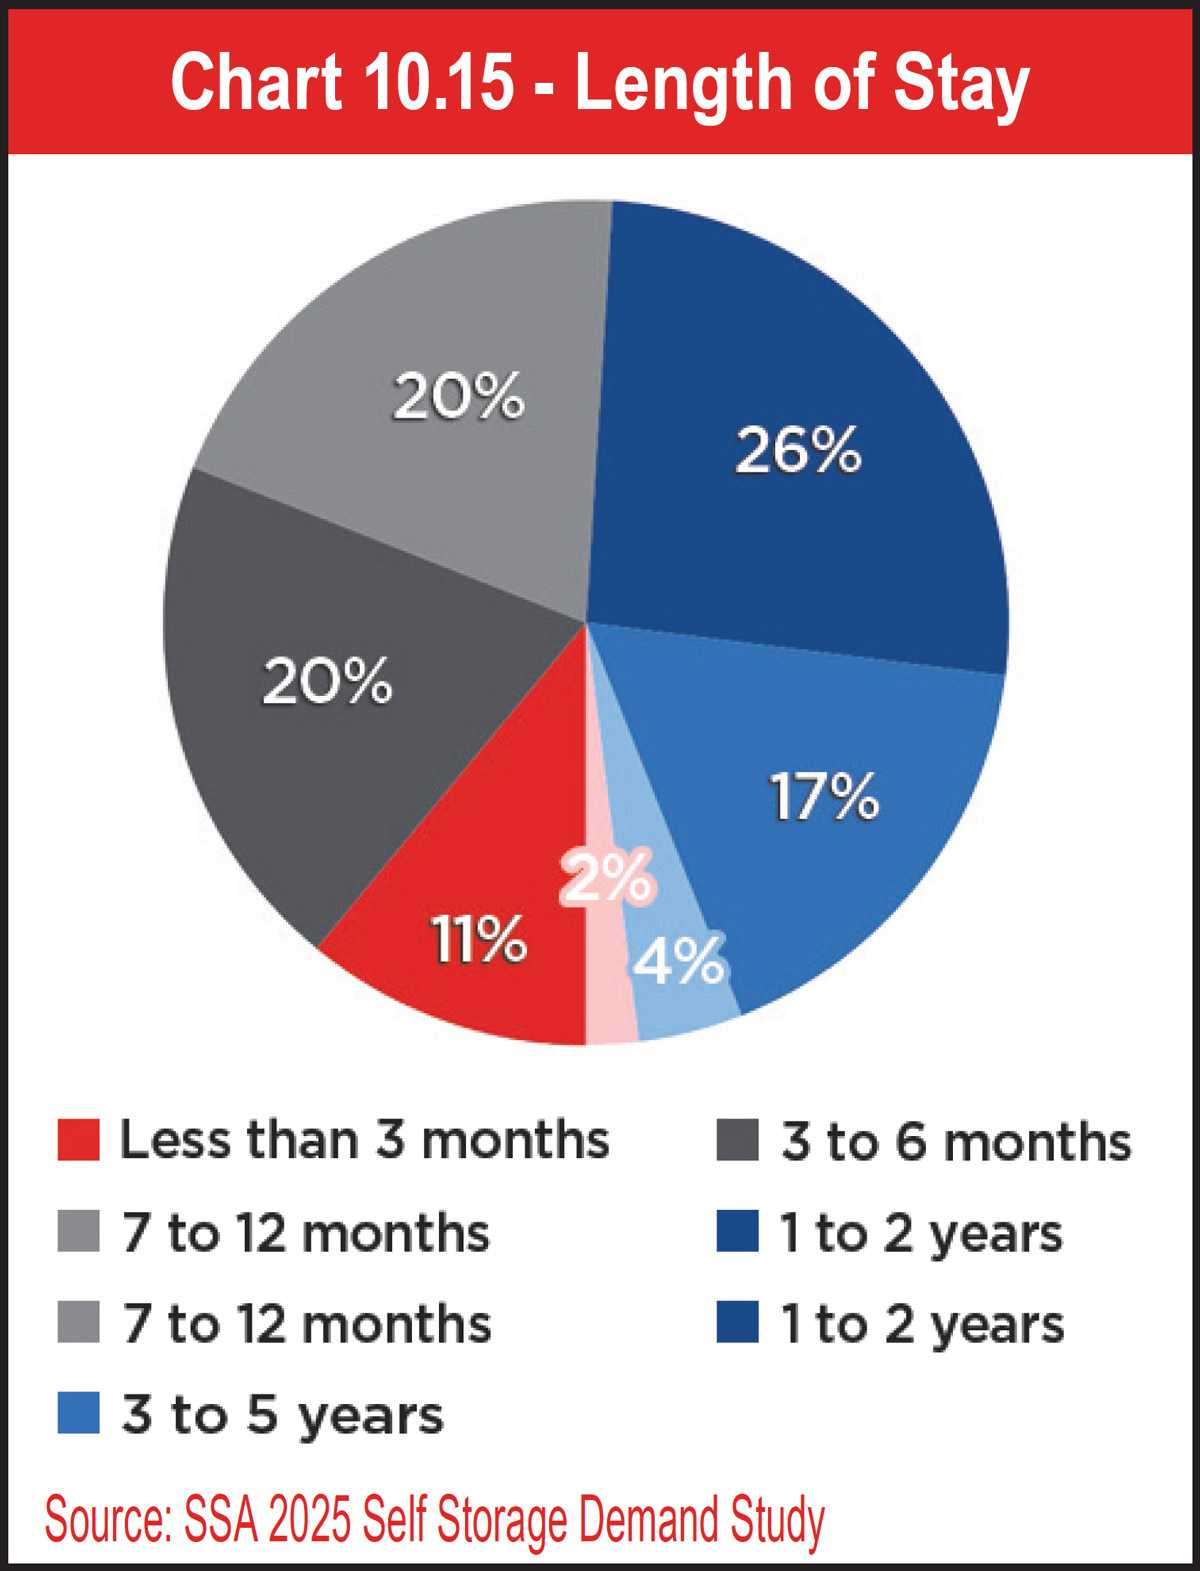
Chart 10.15 - Length of Stay
Now that a customer is a renter, how long can you expect them to stay? The next five charts answer that question by generation, urbanization, region, and renter type. In general, most renters (26 percent) stay for one to two years, as seen in Chart 10.15. But most of their storage needs could be considered short term, considering that a total of 51 percent reportedly stayed less than a year.

See Chart 10.15.

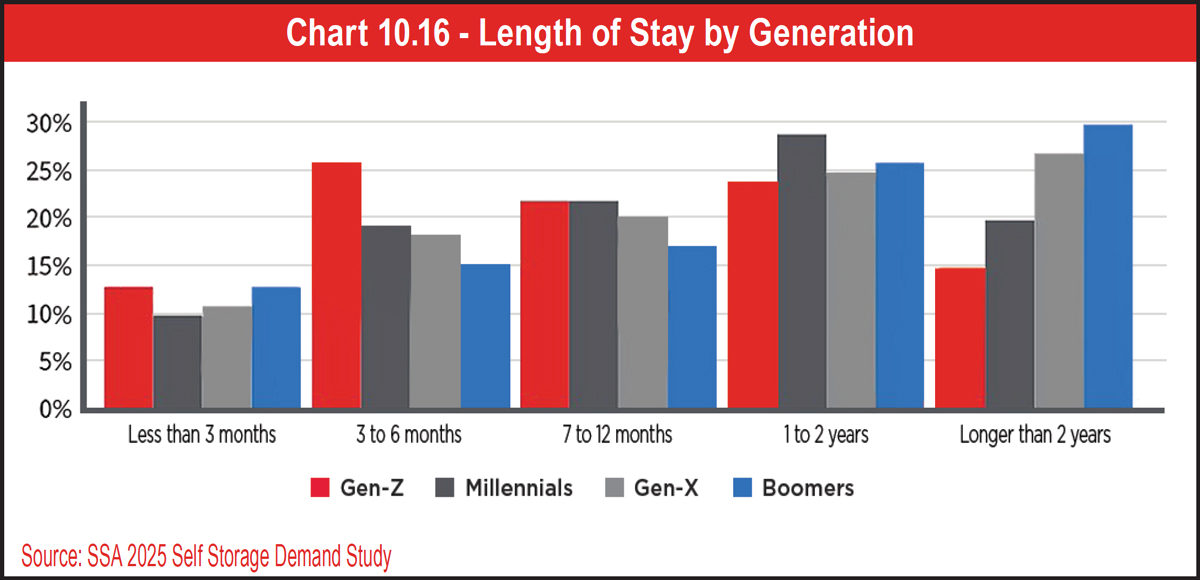
By generation, boomers are more likely to stay longer than two years than any other age group; in fact, they are twice as likely to stay two years or longer than Gen-Z renters (30 percent vs. 15 percent). Gen-Z renters’ storage needs seem to be more short term, with 26 percent staying three to six months. Millennials primarily stay one to two years (29 percent). As for Gen-X renters, like boomers, they most often rent for longer than two years (27 percent). Chart 10.16 also shows that only approximately one in 10 renters will move out within the first three months regardless of age.


In general, most renters (26 percent) stay for one to two years, as seen in Chart 10.15. But most of their storage needs could be considered short term, considering that a total of 51 percent reportedly stayed less than a year.
Chart 10.16 - Length of Stay by Generation
Similar trends are seen for data sorted by both urbanization and region. Chart 10.17 shows that more than a quarter of all urban, suburban, and rural renters stay for one to two years, whereas only 11 percent or 12 percent of renters move out within three months. All other length of stay categories were selected by around 20 percent of renters, give or take a few percentage points.

See Chart 10.17.

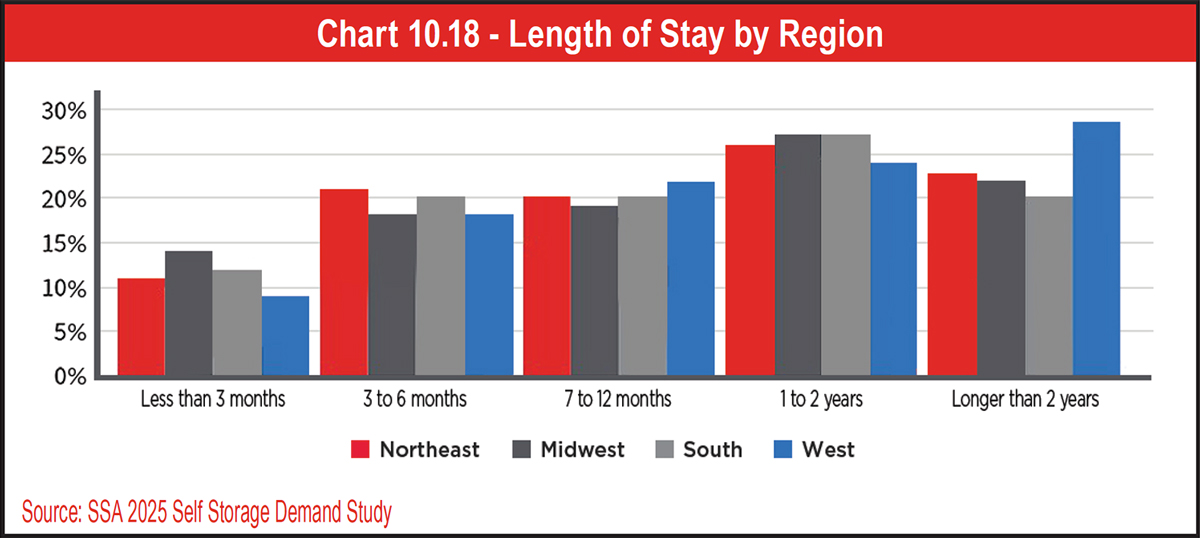
On a regional level, both the largest and smallest percentages tallied were for the West, where 28 percent of renters stay longer than two years and merely 9 percent stay for less than three months. Overall, renters in all regions tend to stay for one to two years and about 40 percent total stay between three and 12 months.

See Chart 10.18.
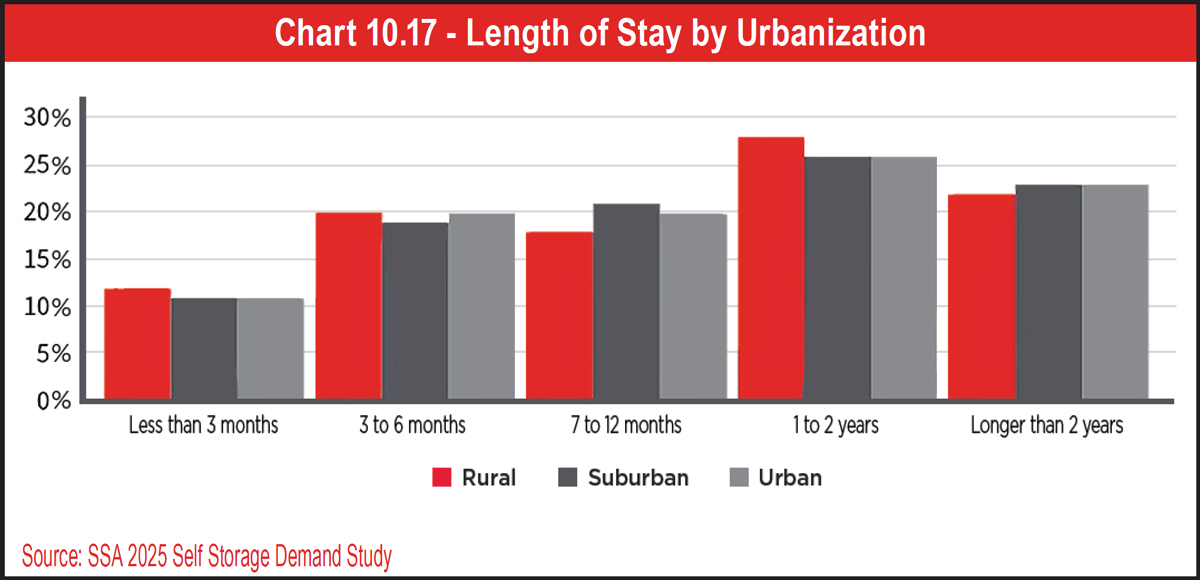
Chart 10.17 - Length of Stay by Urbanization
Chart 10.18 - Length of Stay by Region
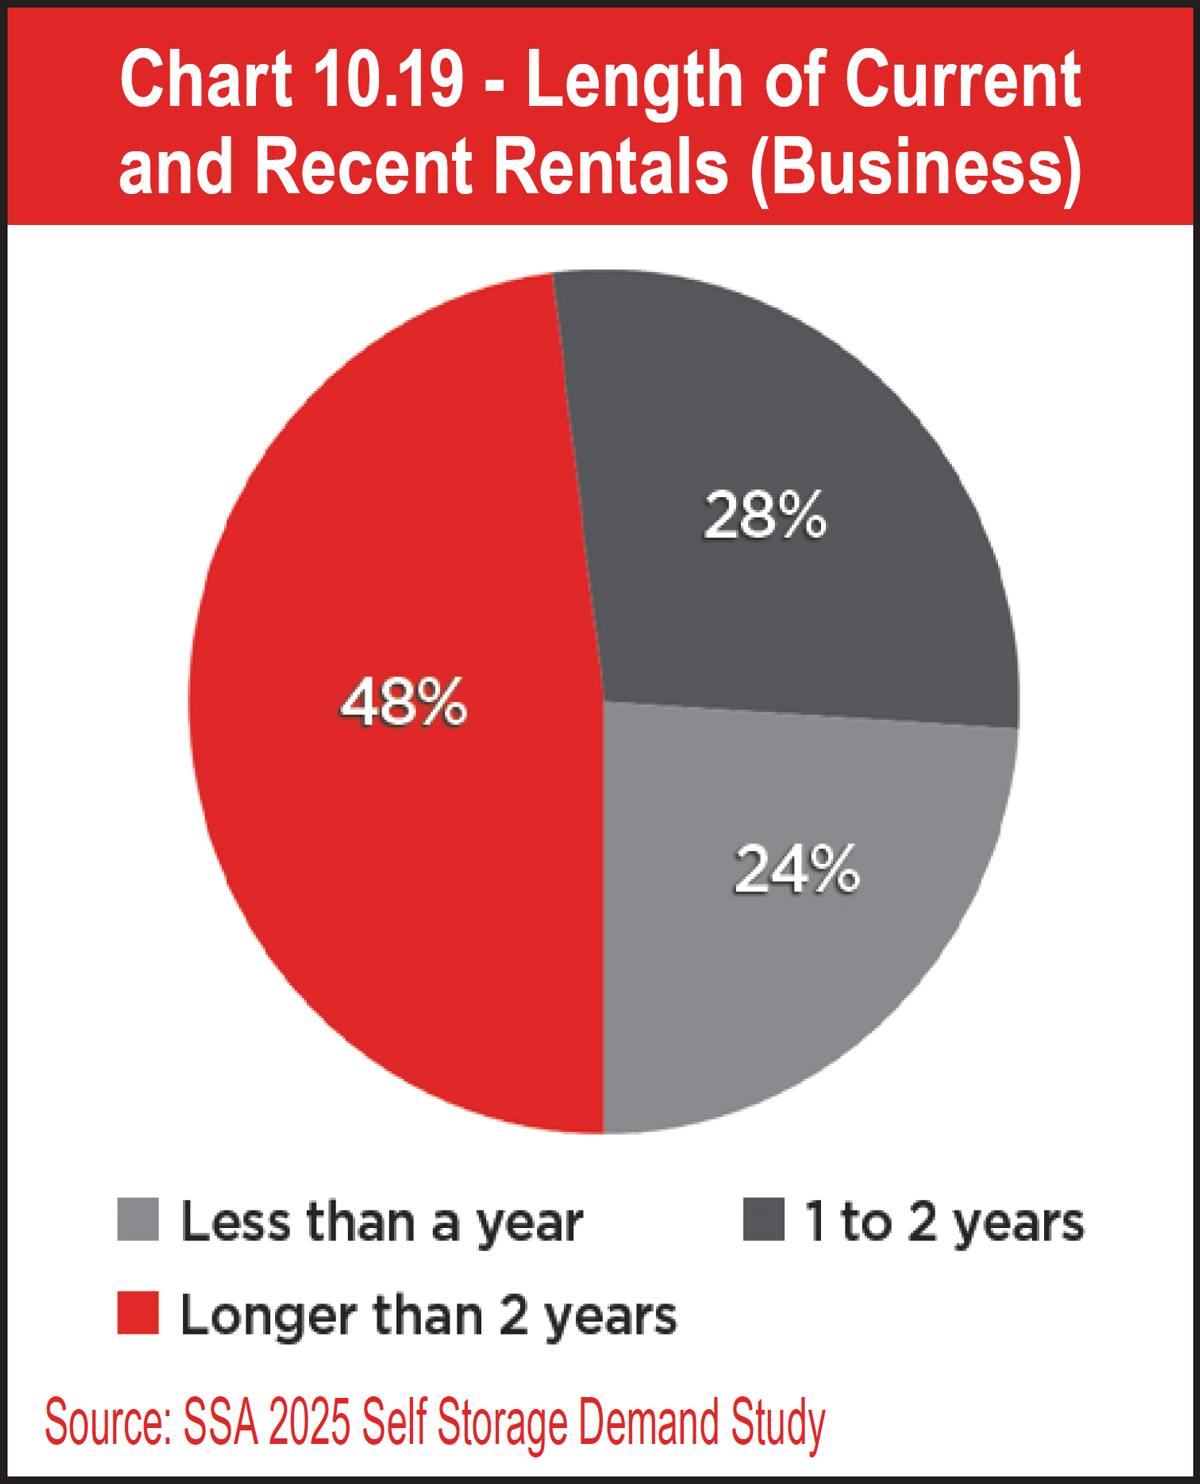
Chart 10.19 - Length of Current and Recent Rentals (Business)
Business renters, on the other hand, tend to stay longer, with 48 percent renting for more than two years and another 28 percent staying for one to two years.

See Chart 10.19.

Keeping Success In Sight
Providing the features, amenities, and services that customers value is vital for increasing their length of stay. While self-storage operators can sometimes find success with unique offerings that no other facility in the market has, there are many tried-and-true ones that self-storage customers have come to appreciate and expect. For the best results, be sure to provide the features that makes sense for the customers in your area, and keep in mind that customers’ expectations will only continue to grow.