How to enjoy our new magazine:
Just scroll!
Click or tap the table of contents icon in the menu bar to find any article.
Read any article by clicking or tapping the read full article button below each article intro.
Jump back to your previous browsing spot from any article using the menu bar or back to issue button.
GET MORE CASH OUT OF YOUR PROPERTY WITH MASS
—AND THAT ISN’T PLAY MONEY.
MASS Relocatable Storage Units and R3.


theparhamgroup.com
Almanac
-
PUBLISHER
Poppy Behrens
-
Creative Director
Jeffry Pettingill
-
Director Of Sales & Marketing
Lauri Longstrom-Henderson
(800) 824-6864 -
Circulation & Marketing Coordinator
Carlos Padilla • (800) 352-4636
-
Editor
Erica Shatzer
-
Web Manager / News Writer
Brad Hadfield
-
Storelocal® Media Corporation
Travis M. Morrow, CEO
-
Websites
-
Visit Messenger Online!
Visit our Self-Storage Resource Center online at
ModernStorageMedia.com
where you can research archived articles, sign up for a subscription, or submit a change of address. -
Reproduction in whole or in part without written permission is prohibited.
Printed in the United States.Unsolicited manuscripts, artwork and photographs must be accompanied by an addressed return envelope and the necessary postage. Publisher assumes no responsibility for the return of materials.
All correspondence and inquiries should be addressed to:
MSM
PO Box 608
Wittmann, Arizona 85361-9997
Phone: (800) 352-4636
- 1 Industry Data 15
- 2 Ownership 21
- 3 Self-Storage Supply Forecast 31
- 4 Economics & Demographics 37
- 5 Customer Traits 51
- 6 Smart Technology & Security 61
- 7 Occupancy 67
- 8 Rental Rates 75
- 9 Management 97
- 10 Marketing For The Modern Operator 117
- 11 Utilizing Self-Service Kiosks 125
- 12 A Growing Market: RV & Boat Storage 133
- 13 Market Conditions 143
- 14 The Overall Capitalization Rate 149
- 15 Self-Storage Valuation 155
- 16 Self-Storage Financing 163


Poppy Behrens
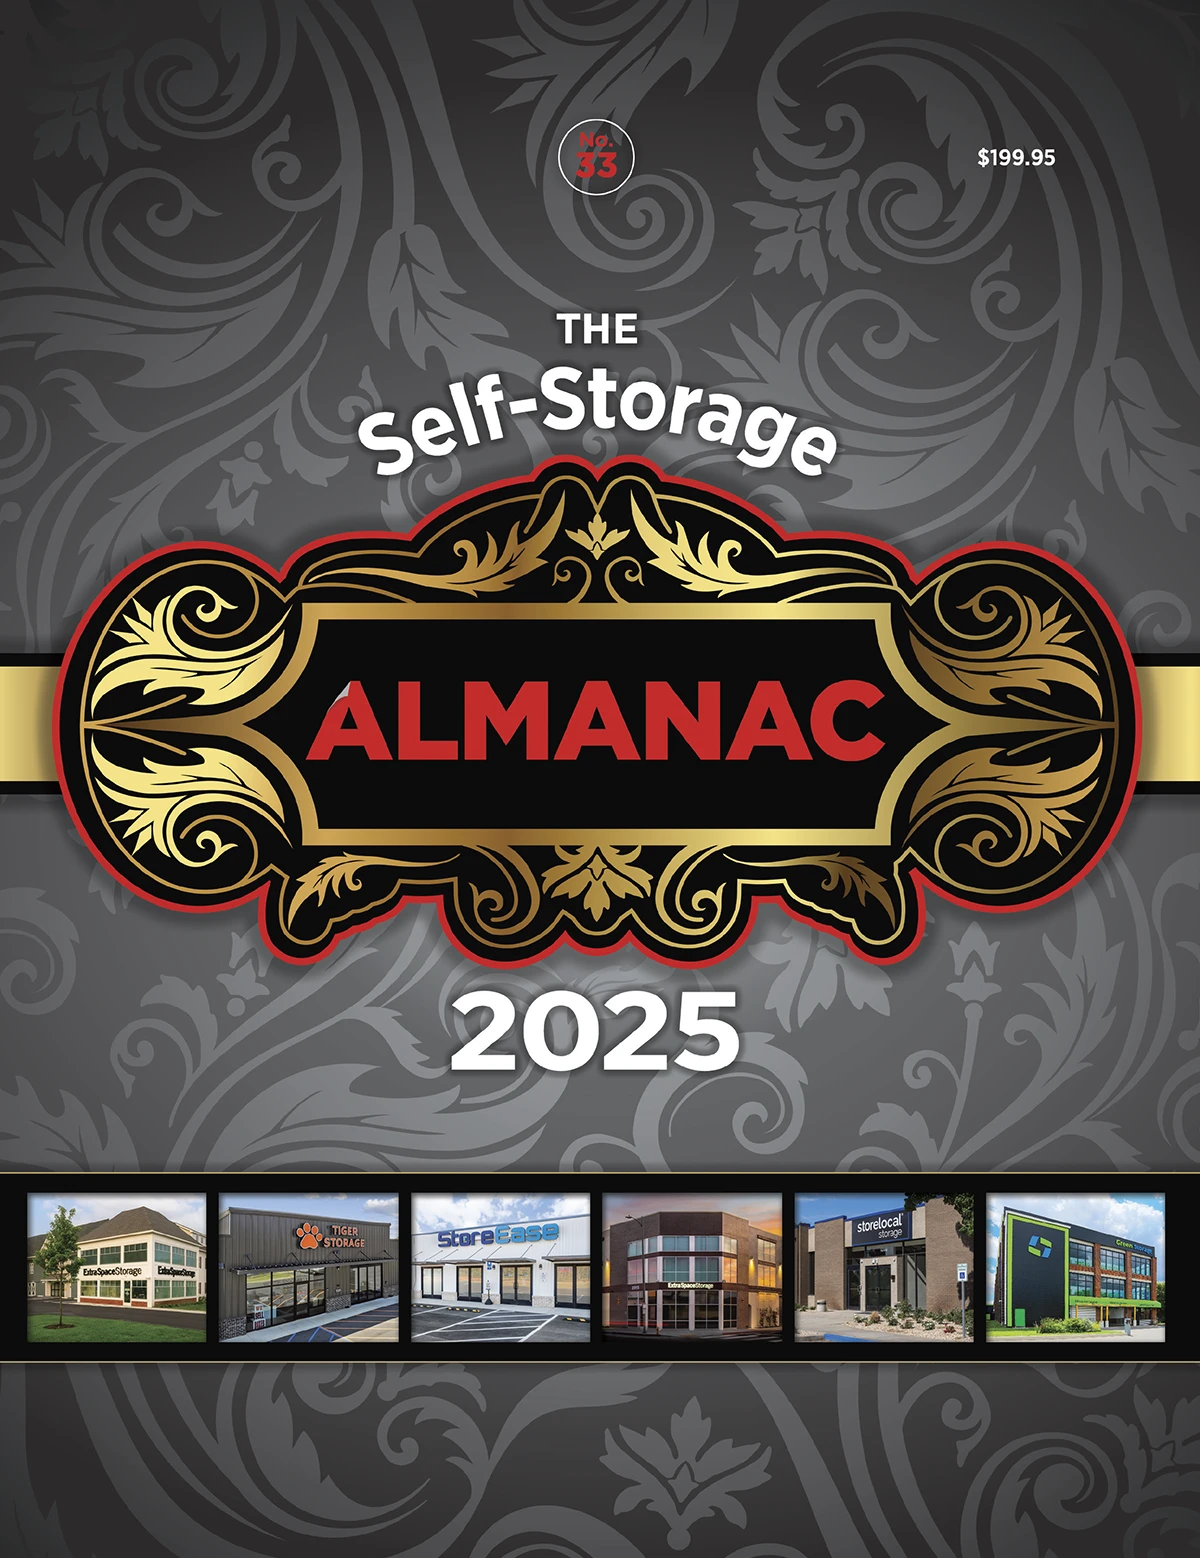
elcome to the 2025 Self-Storage Almanac. For 33 years, the Almanac has been the leading source of data for the self-storage industry. As the most sought-after publication in our industry, we take pride in delivering the best industry data in each and every edition. It is an essential tool for both developers and operators, regardless of whether they are industry newcomers or self-storage veterans.
Developers turn to the Almanac because it gives the demand per person in the United States and then drills down to individual markets. Calculated by taking the total supply of rentable square feet of self-storage in the U.S. or market, multiplied by the average occupancy and divided by the population, the demand figures presented in the Almanac are used nationwide in feasibility studies and reporting on the health of the industry. They are widely seen as the most accurate figures available to the industry. The information is gathered from our data partner, Radius+.
Developers use the figures from the Almanac to determine if the market they are interested in has unmet demand. By taking the population of a market and multiplying by the demand figure of the area, developers can determine the demand for self-storage in the market. Subtract out the rentable square footage of existing and/or planned development in the market and you are left with its unmet demand. But the Almanac isn’t solely for developers. Thousands of operators use the Almanac and other available industry data collection to assess key metrics regarding the performance of their facilities in a given market.
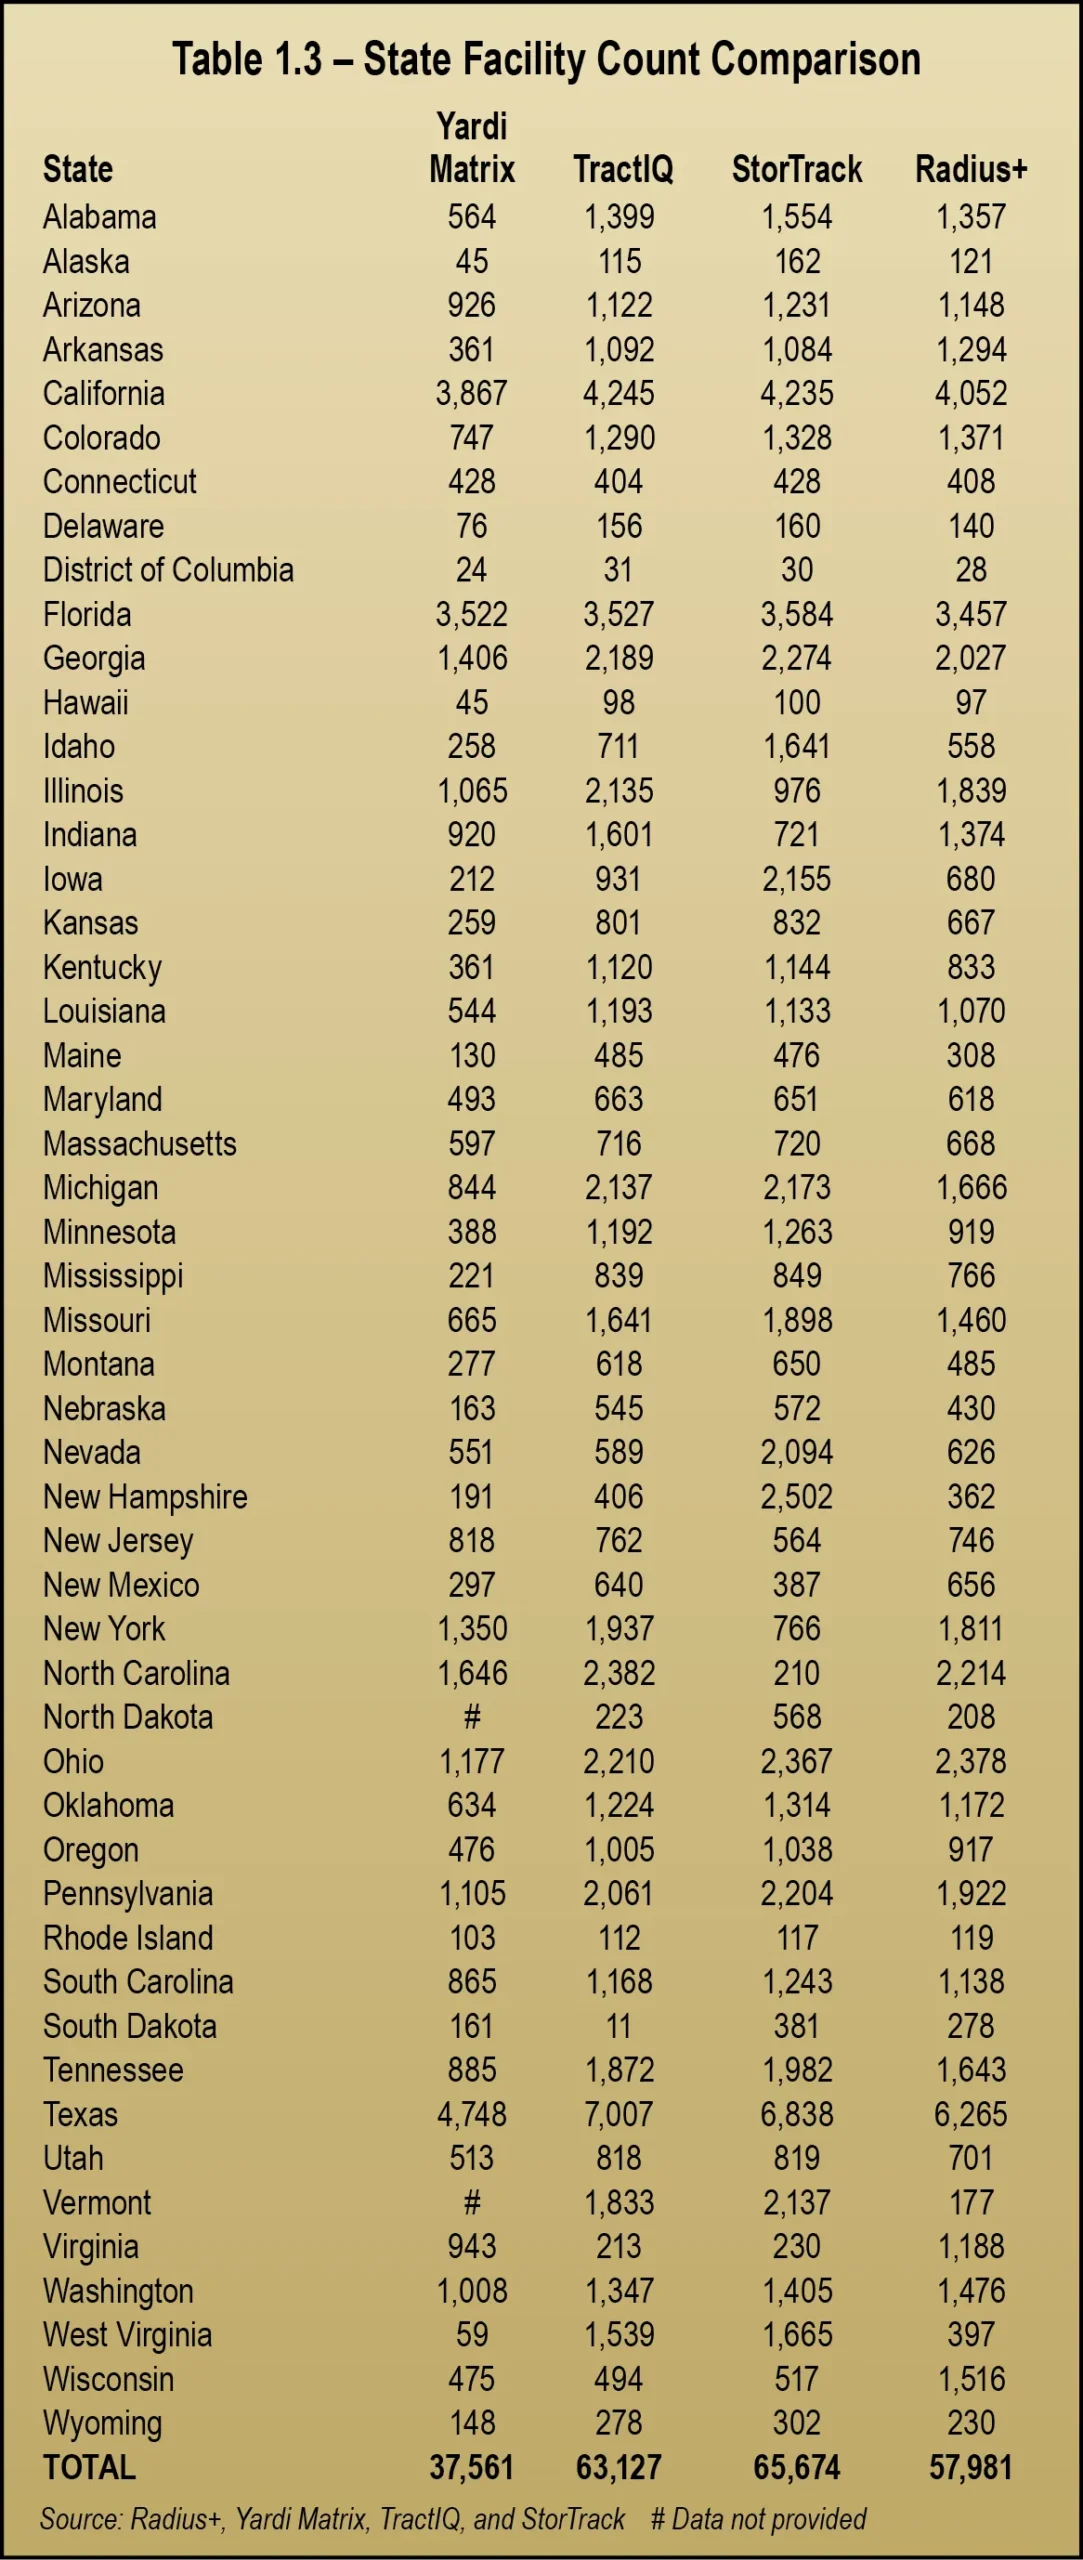
In keeping with our goal to provide the most accurate information available, this year we have presented comparative data on national facility counts in Section 1. Thank you to StorTrack, TractIQ, and Yardi Matrix for providing their facility counts and methodology for the comparison included in this year’s Industry Ownership section. It is important to note that this differing methodology impacts national facility counts. We believe it is our responsibility to provide this data. As such, we will continue to monitor new data sources over the coming months in order to continue to provide accurate industry-wide data.
We would like to extend a special thank you to Radius+, our data partner since 2014. In addition, thank you to the Self Storage Association for allowing us to use data from their 2023 Self Storage Demand Study. And last but certainly not least, thank you Chris Sonne of Newmark Valuation & Advisory for providing his expertise on so many levels.
Remember: The need for comprehensive, market-specific research and ample due diligence is vital to the success of any investment in our industry. Hence, it is essential to retain an unbiased, third-party consultant to conduct extensive feasibility and market studies.
As always, should you have any questions about the Almanac, please feel free to reach out to me directly at poppy@modernstoragemedia.com. Above all, we wish you the best in your self-storage endeavors.
invaluable contributions to the 2025 Self-Storage Almanac:
Chris Sonne, Newmark Valuation • Adam Karnes and Shawn Hill, The BSC Group
Anne Mari DeCoster, DeCoster Consulting • Tammy LeRoy • Christine DeBord, Janus International
Poppy Behrens • Sarah Beth Johnson, Universal Storage Group • Lou Barnholdt , Universal Storage Group
Brad Hadfield • Kimberly Robinson, OpenTech Alliance • Tim Garey, Cushman & Wakefield
Erica Shatzer • Cindy Rivera, StorTrack • Doug Ressler, Yardi Matrix • Noah Starr, TractIQ
Cover photos courtesy of DXD Bristol Extra Space, Tiger Storage, StoreEase Self Storage,
Extra Space Storage, Storelocal Storage Curtis, Green Storage Hamilton
This study, or parts thereof, may not be reproduced, copied, or transmitted in any form without prior written
permission of MSM, which has received one-time reproduction permission from the sources referred to herein.
All rights reserved • Copyright © 2025 • Printed in the U.S.A.
MSM • PO Box 608 • Wittmann, Arizona 85361-9997 • (800) 824-6864
ow more than ever, having the right data is essential for the success of your self-storage business. As such, for over 30 years, the annual Self-Storage Almanac has provided the industry with the best data available. Over the years, how that data is collected has evolved, from handwritten paper surveys in the early days to data purchased outside the industry to highly refined data collected by companies that specialize explicitly in self-storage data.
In 2017, Union Realtime (now Radius+) became the Almanac’s official data partner. Once again, this year, Radius+ is our data partner, providing state and CBSA data as well as occupancy and rental rate data. In this section, however, we will also compare state facility count data from several other prominent data sources in the industry. This aligns with our goal to continually provide the best data available.
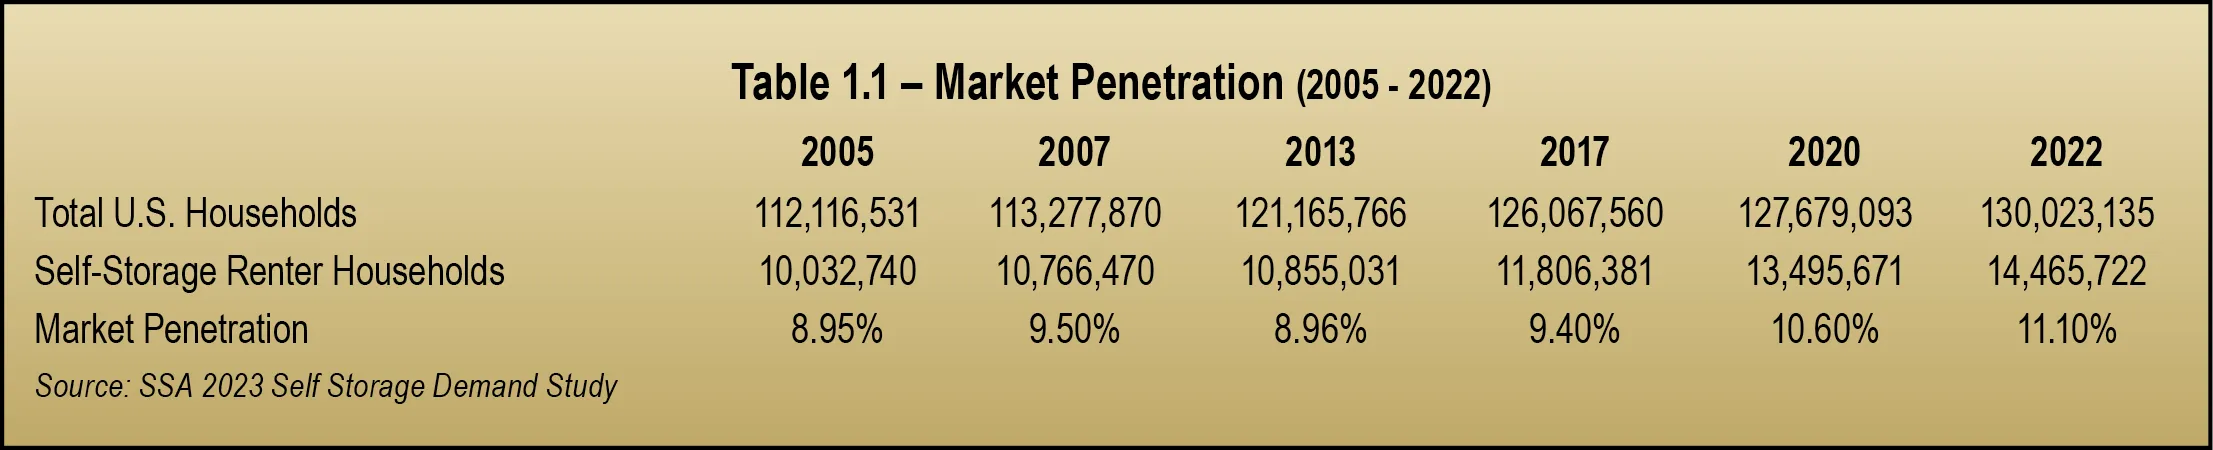
The SSA’s 2023 Self Storage Demand Study indicates that of 130,023,135 households in the U.S., 14,465,722 use self-storage, representing a market penetration of 11.1 percent. As seen in Table 1.1 below, market penetration has increased by 2.15 percent since 2005. Simplified, approximately 4,432,982 more households utilize self-storage today than in 2005. Moreover, since 2020, the industry has seen an uptick in market penetration of 970,051 households.
According to current projections, the self-storage industry is expected to experience significant growth in 2025, with the market size reaching approximately $68.75 billion. This growth represents a compound annual growth rate (CAGR) of 8.1 percent from 2024. Key drivers include a surge in mobility as more people plan to move, increased demand for short-term storage options, and a growing reliance on technology for online booking and virtual facility tours.
A surge in mobility continues to drive demand for self-storage operations. According to XPS Solutions, one of the most significant shifts expected for 2025 is the increase in moving activity across the United States. Recent data indicates that 37 percent of respondents are planning or considering a move in the next six to 12 months, up from 25 percent in early 2024.
Regarding rental rates, Argus states that while rates continued to fall in 2024, modest growth in 2025 is expected. Most markets’ rental rates will grow in the 2 percent to 3 percent range as demand starts to improve due to improving economic drivers and consumer confidence.
The Argus report also states that operators will be concerned about growing operating costs such as insurance, payroll, and real estate taxes. Reducing spending and office hours, implementing technology, and pushing for contactless rentals/payments will help with payroll costs. However, the industry will continue to see elevated real estate taxes and insurance costs for the foreseeable future.
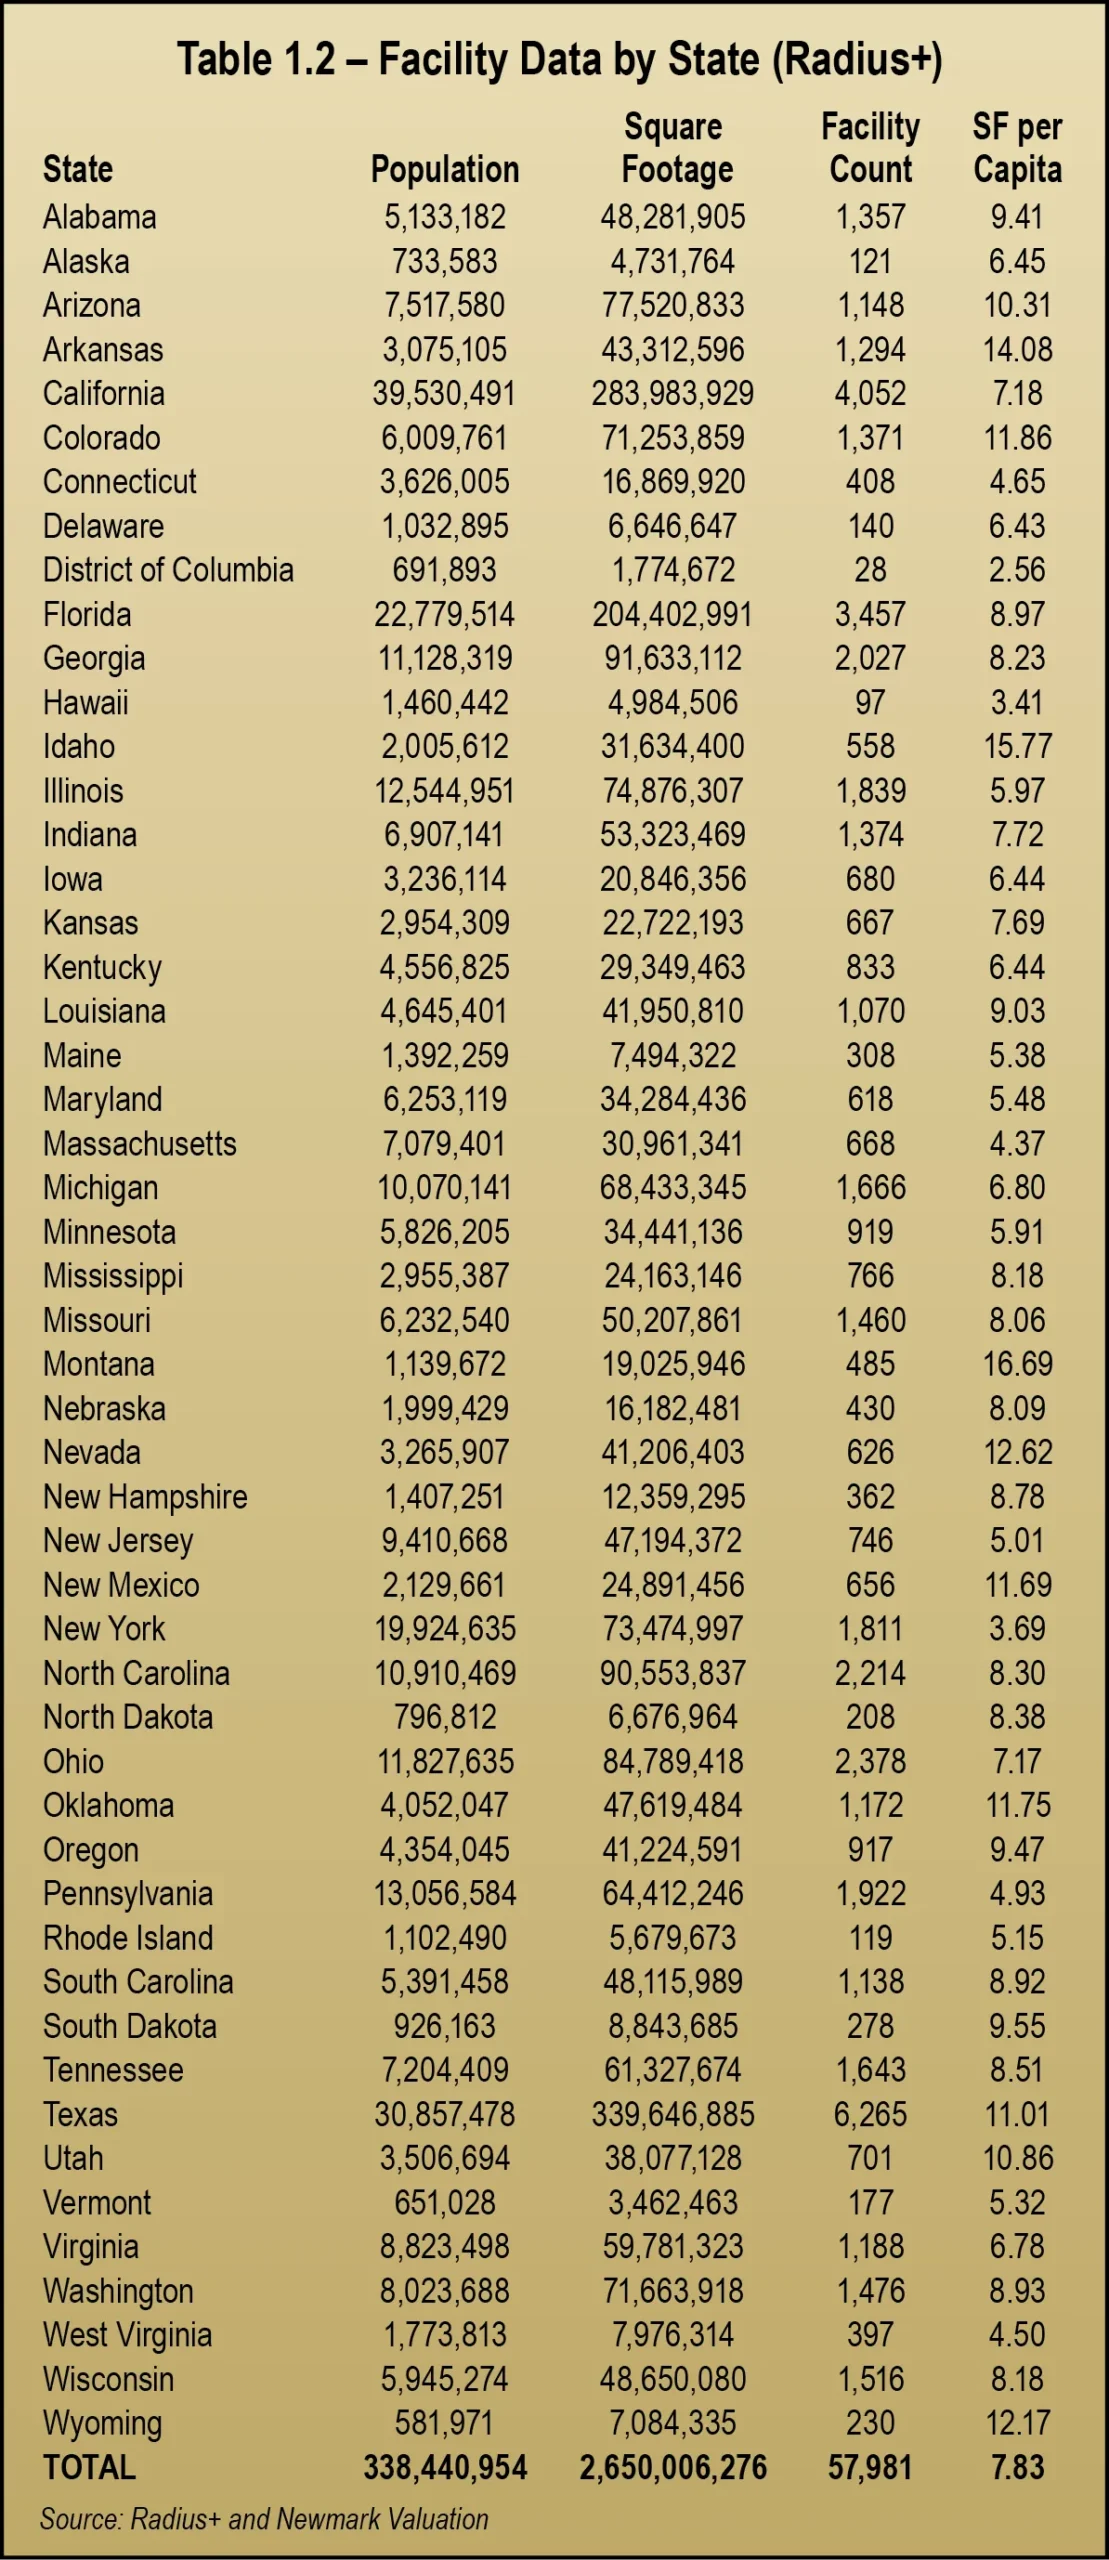
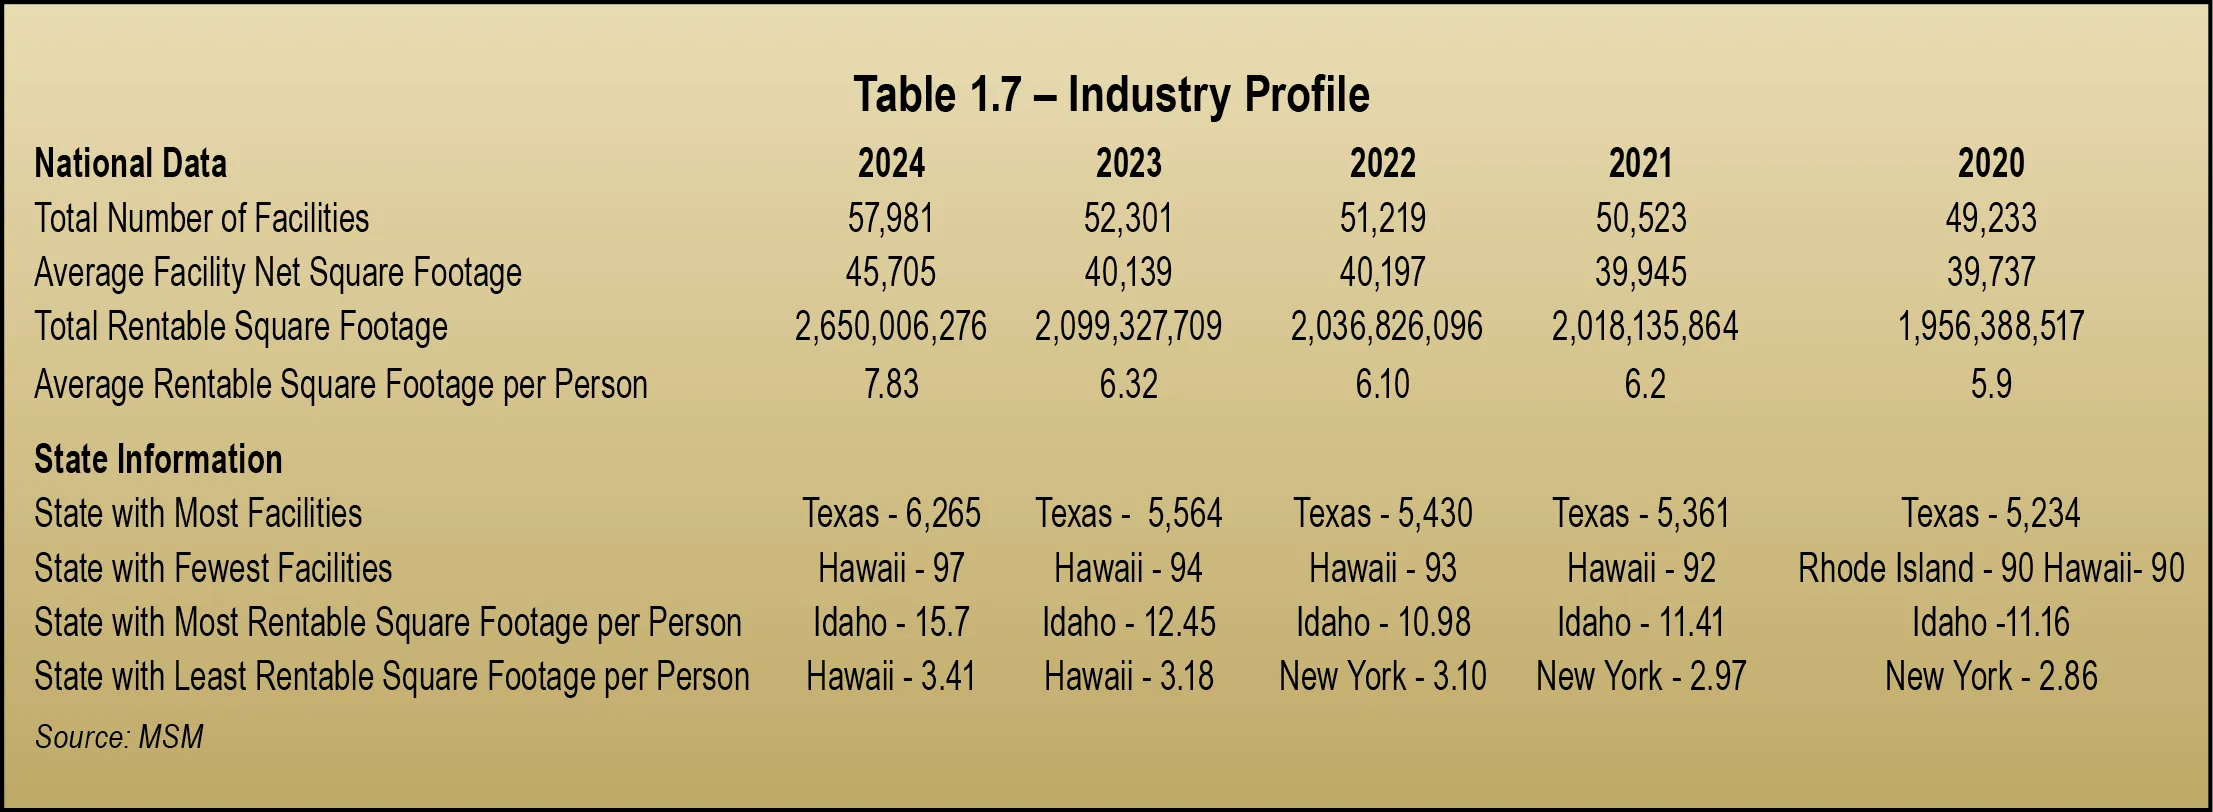
The industry’s total rentable square footage, according to Radius+, is 2,650,006,276, up from 2,099,327,709 last year, representing a gain of 550,678,567 square feet. This is substantially more than the increase of 62,501,613 from 2023.
Table 1.7 on page 19 looks at the industry profile for the past five years. Texas is still the state with the most self-storage facilities (6,265), while Hawaii still has the fewest (97). This equates to an increase of 701 and three facilities, respectively.
In line with data from the past five years, Idaho continues to have the highest rentable square footage per capita at 15.7. For the second year in a row, Hawaii has the lowest rentable square footage per person at 3.41.
A breakdown of this data by CBSA can be found in Section 13, Market Conditions, starting on page 143. Likewise, information for RV and boat storage can be found in Section 12, which starts on page 133.
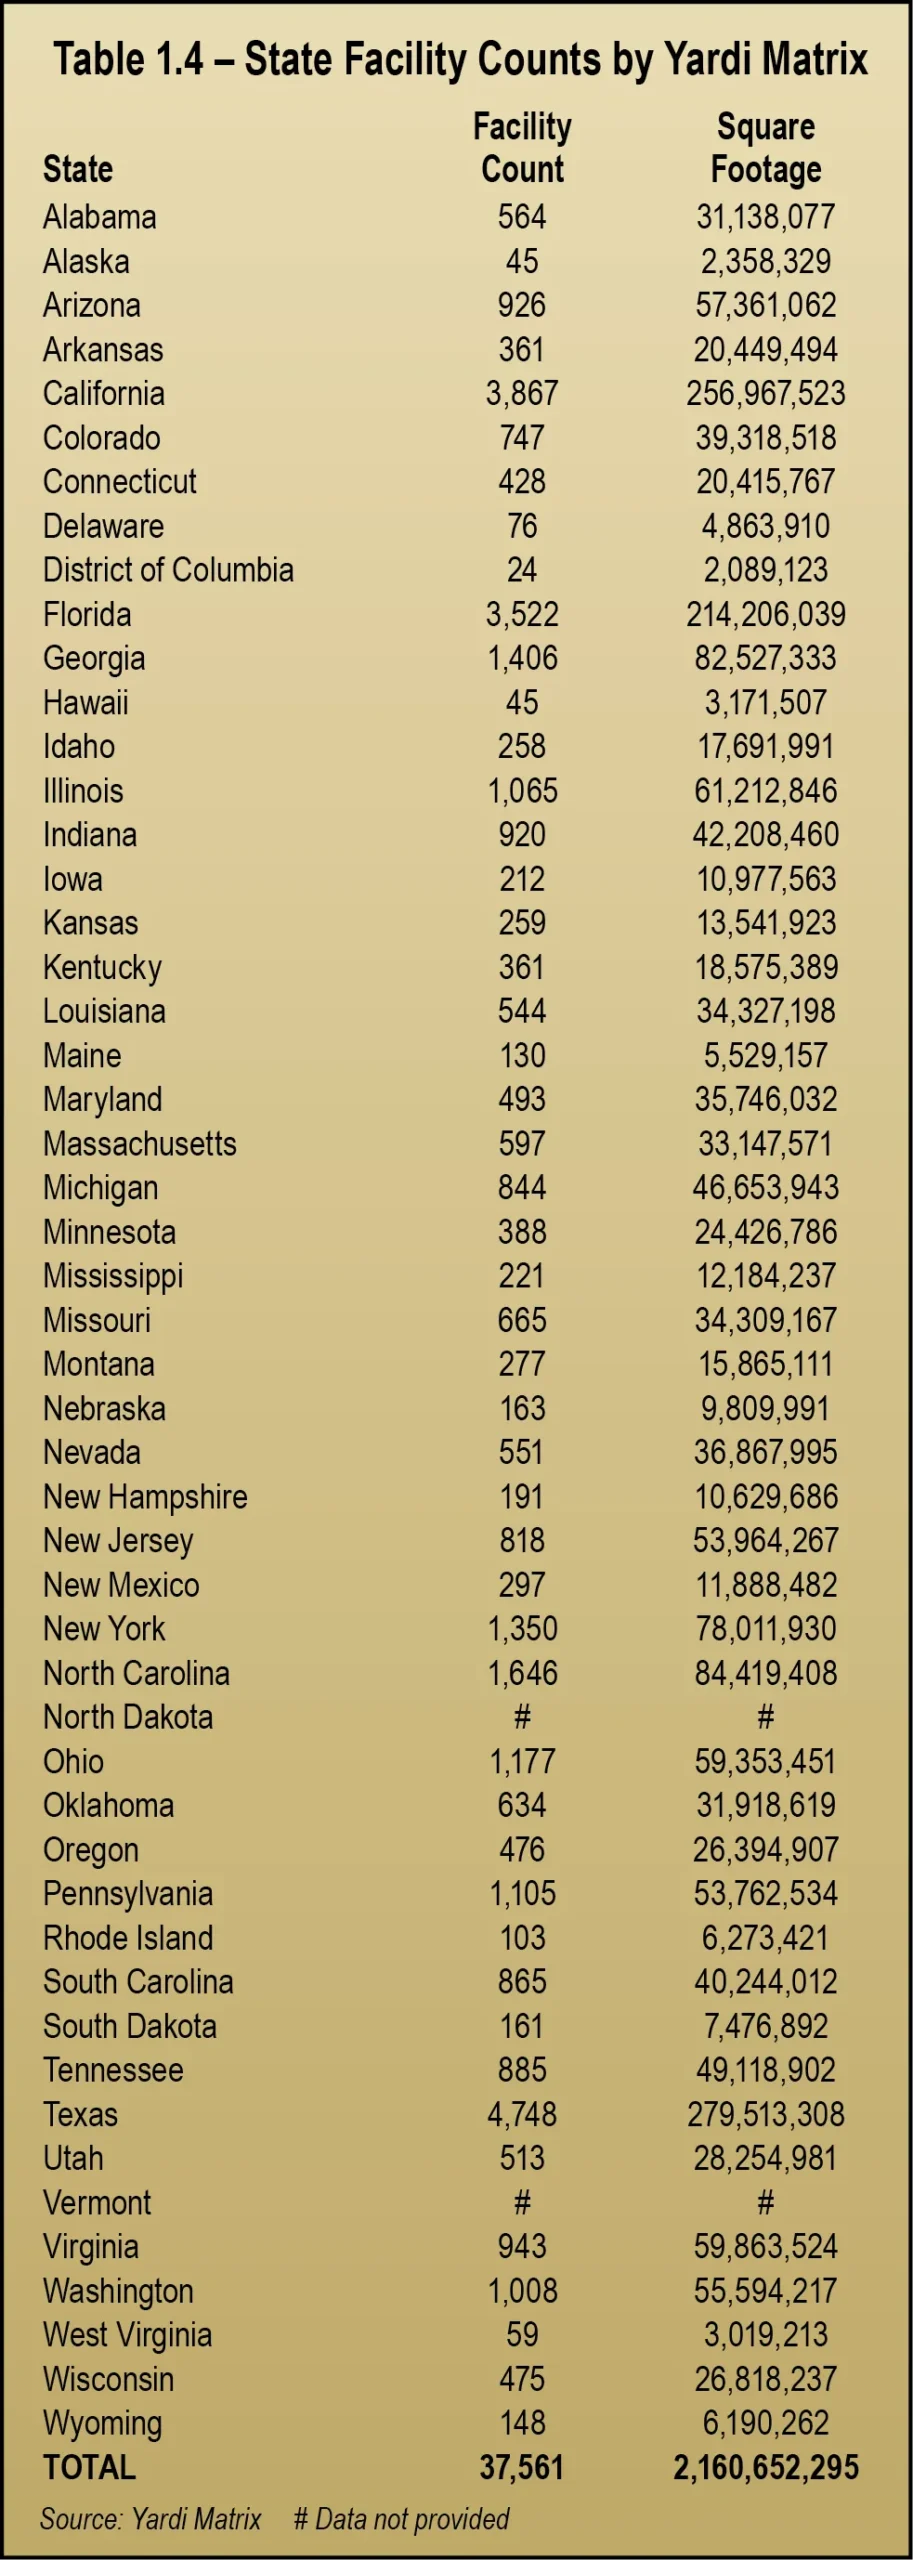
Yardi Matrix researches and compiles static and dynamic self-storage market data specific to individual self-storage properties and to general self-storage market conditions. The company’s research methods are formulated to allow quick and accurate access to the information that a wide spectrum of investors, owners, and developers need to maximize their business strategies.
Information is developed through a combination of original research calls from their research team representing themselves as consumers, industry studies, and various references to secondary sources. Its manner of sourcing and compiling information is defined within its subscription portal. See Table 1.4 on page 17.
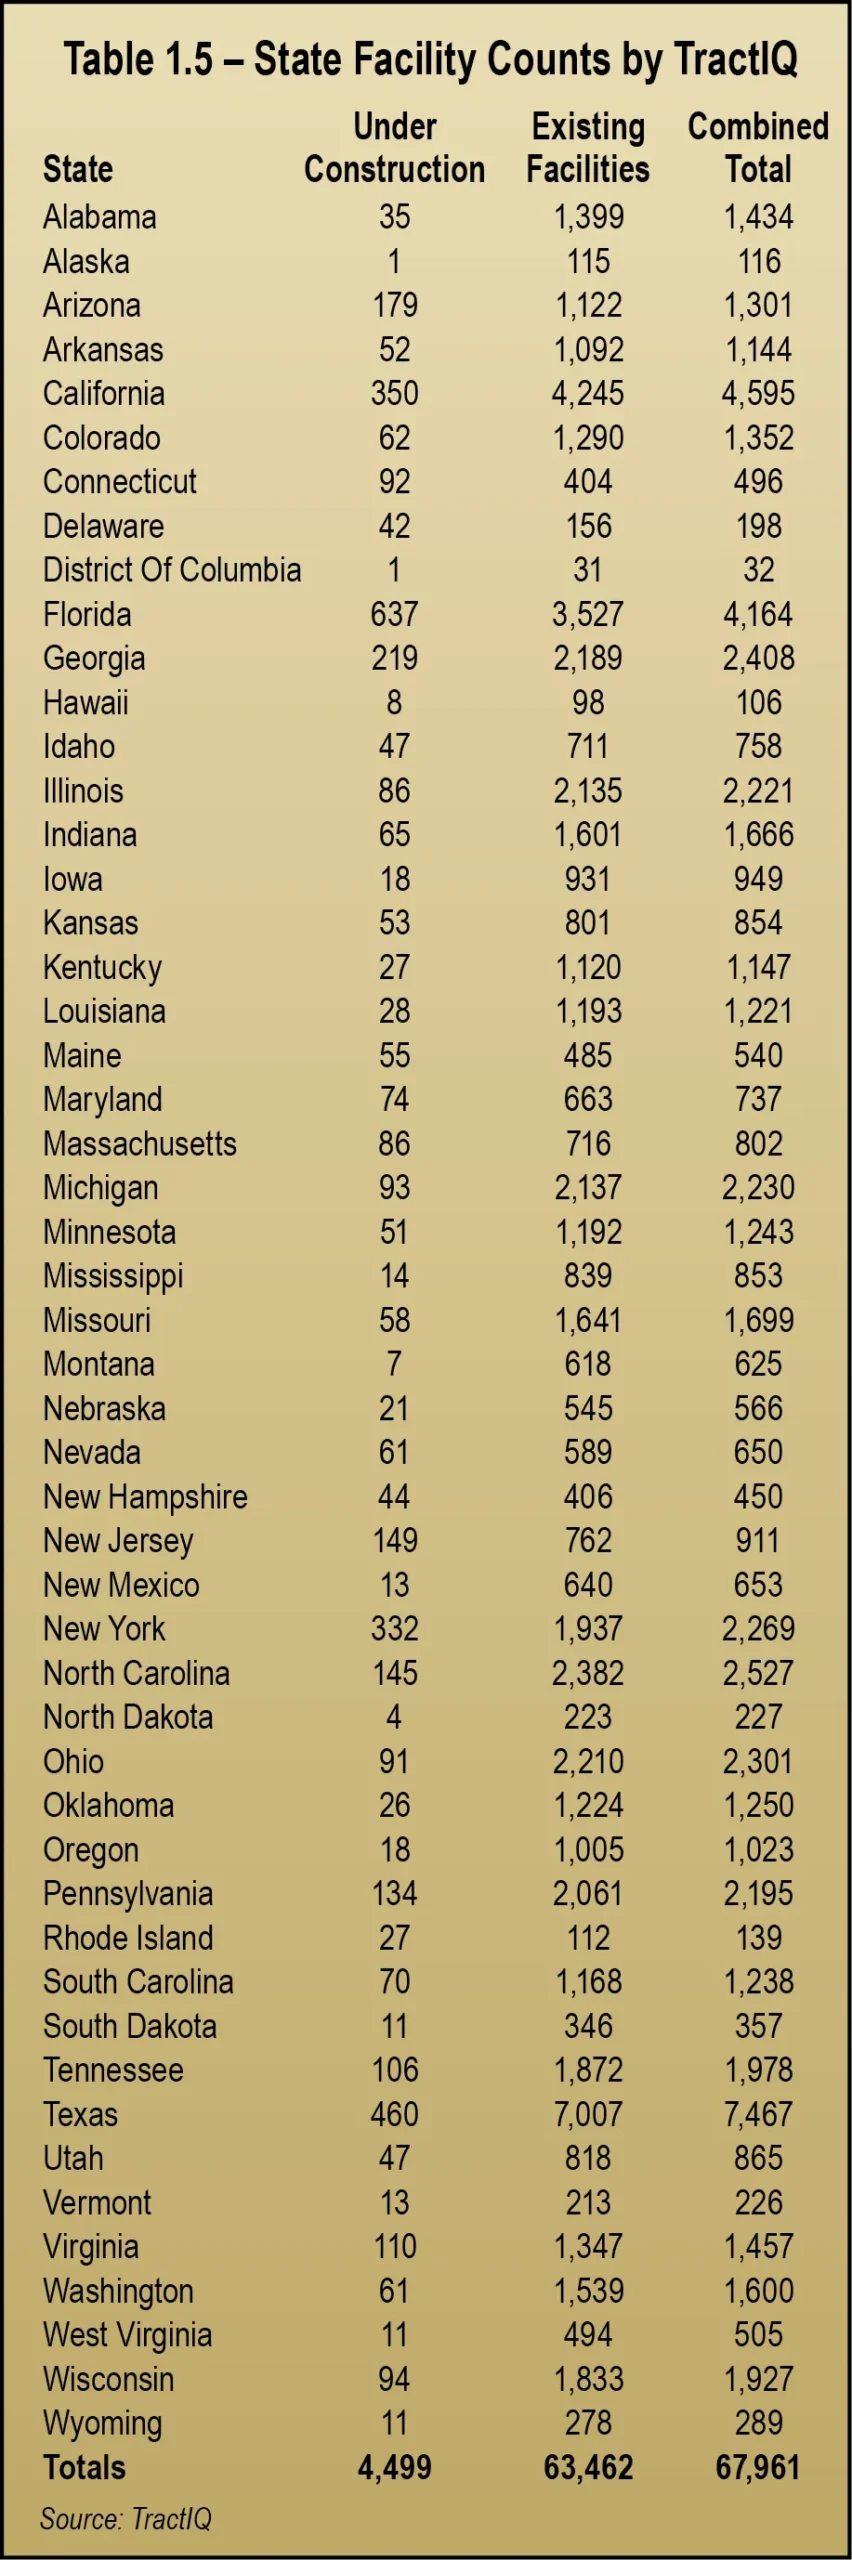
In terms of facility supply, TractIQ’s data pipelines continually interact with hundreds of sources across the internet to identify facilities. Every facility in its database is then reviewed by a qualified storage data expert to confirm not only its existence, size, and offering but also to uncover hard-to-find metadata like owner information. Additionally, users continuously help by verifying site information as sites are built, expand, and change hands.
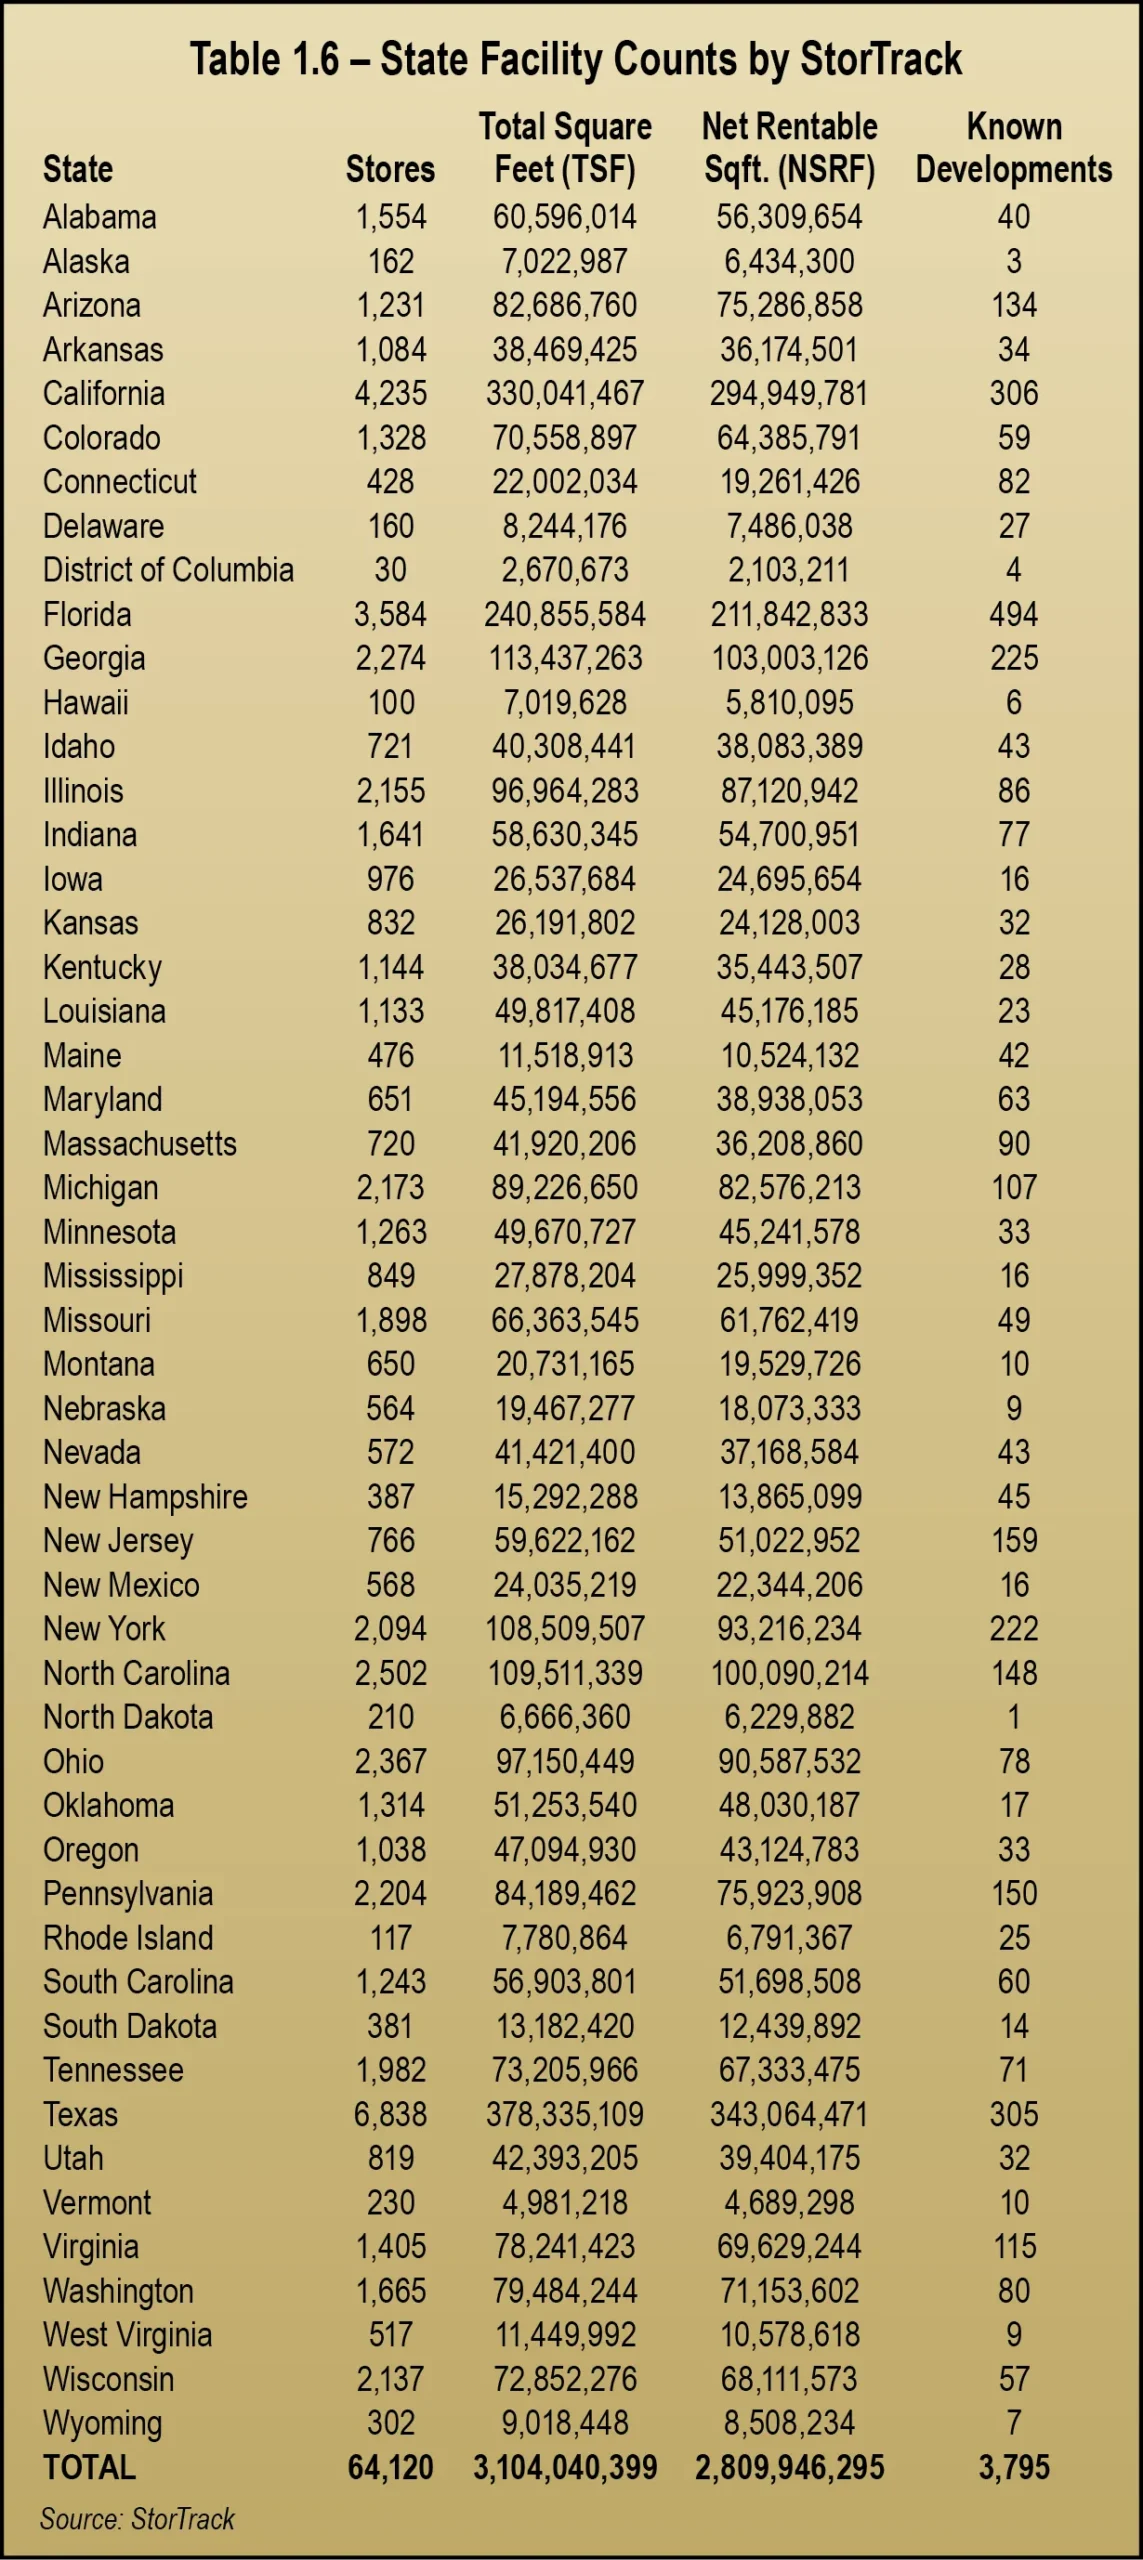
StorTrack has been helping self-storage professionals get the insights they need to make smarter, data-driven decisions since 2014. The company’s extensive data coverage spans not only the United States but also Canada, the U.K., Europe, Australasia, and parts of Asia. With a database that now includes over 90,000 facilities around the world, including boat and RV storage facilities, StorTrack provides the reliable data needed for market analysis, pricing strategies, and development planning.
StorTrack identifies self-storage facilities using a wide range of sources, including internet searches, business directories, news articles, and public records. This comprehensive approach ensures that it captures a broad and accurate view of the market, covering both well-known facilities and smaller, independently operated properties.
The Radius+ process for validating storage is proprietary, but the company states that it hand maps every facility to ensure they meet its definition of self-storage and to ensure accuracy of square footage, climate mix, name, and open date.

hile we discussed industry numbers from other vendors in Section 1, only the data from Radius+ and the MSM 2024 Top Operator’s list were used for this section.
The 2024 Top Operators list (published by MSM in November 2024) and national data show a change in the trend we have seen for many years in the self-storage industry. Instead of showing increased consolidation of ownership, it shows the opposite: The market share of small independent owner-operators grew in number of facilities and square footage, as seen in Tables 2.1A and 2.2B on the following pages. As mentioned in Section 1, as data sources improve and it becomes easier to compare one year to the next, it will be very interesting to see if this trend continues in the years to come.
In analyzing ownership data among the top 100 operators, we look at four groups:
- Public companies (REITs and U-Haul),
- Other top operators with portfolios of both properties they own and properties they manage,
- Other top operators whose portfolios only include properties they own, and
- Other top operators whose portfolios only include properties they manage.
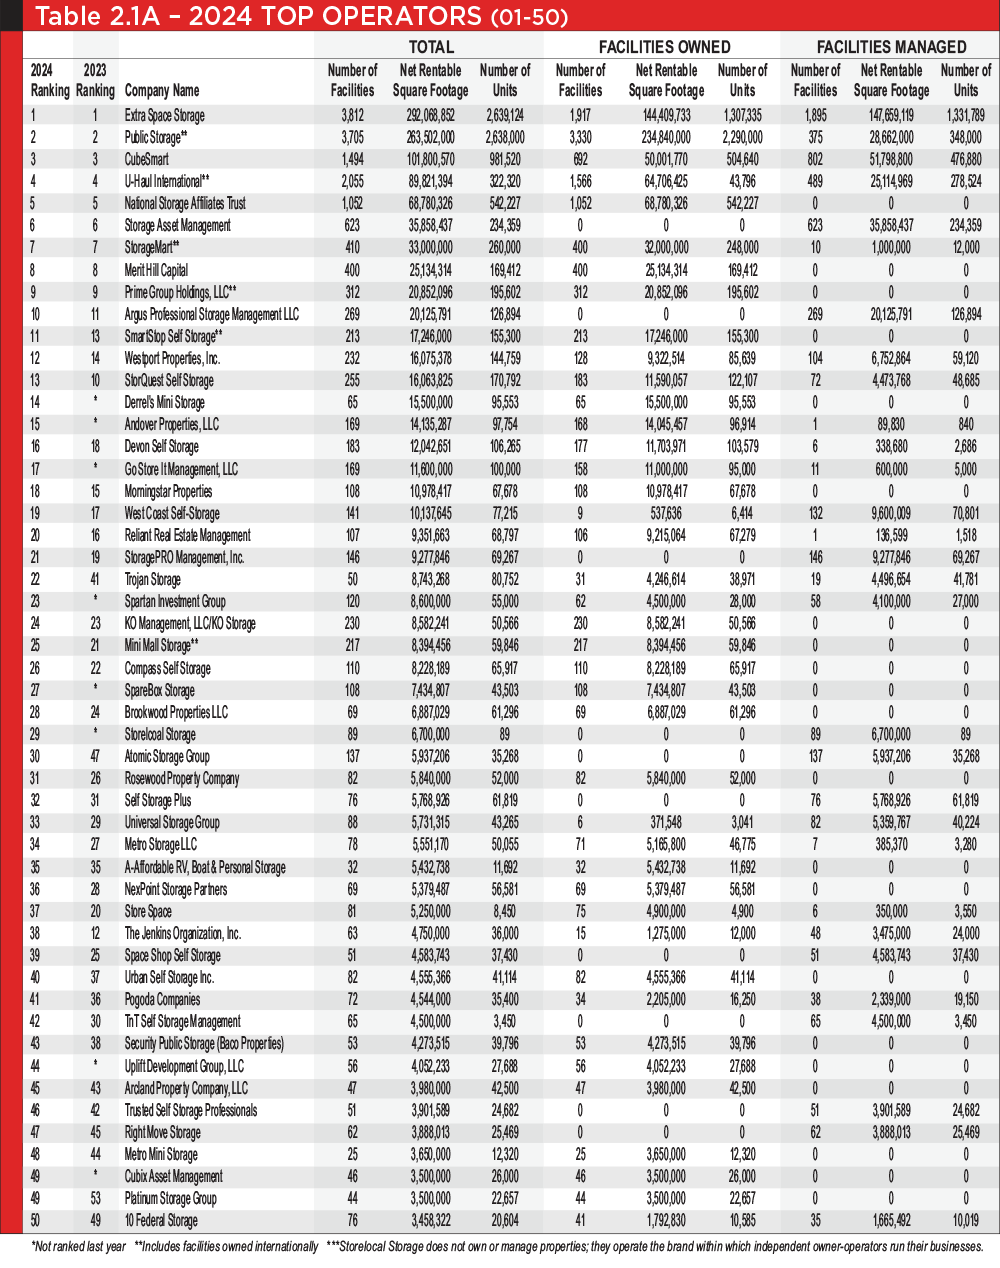
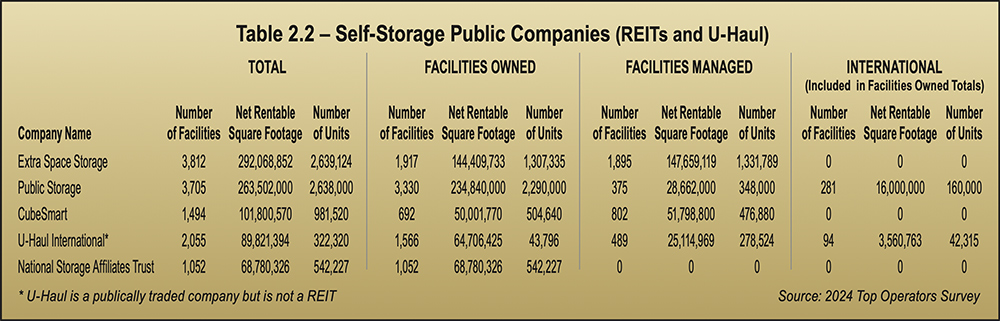
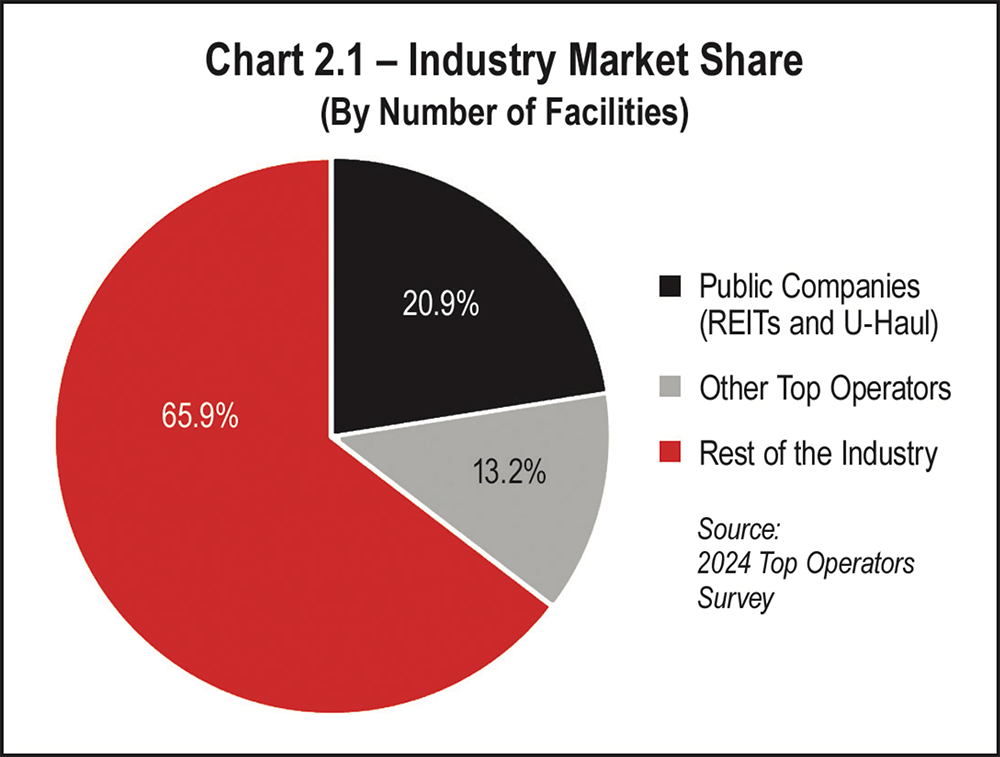
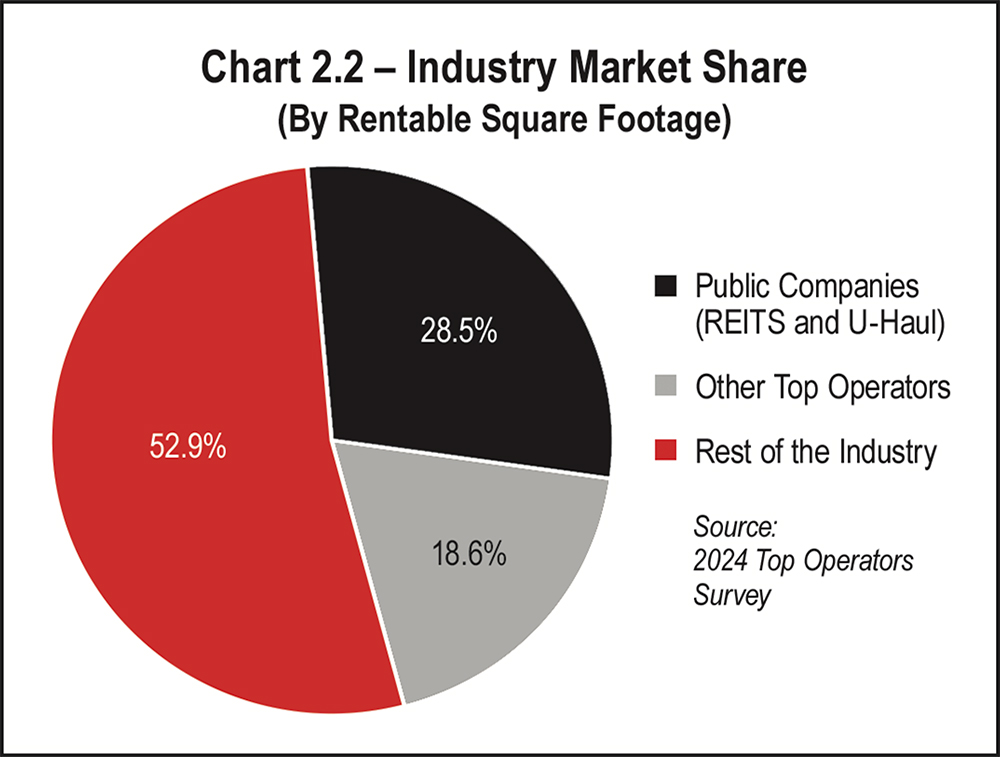
The five largest self-storage operators are REITs, comprising 20.9 percent of facilities and 28.5 percent of square footage. Their portfolios include properties they own and manage, except for National Storage Affiliates (NSA), whose portfolio does not include any third-party managed facilities as of 2024.
Other top operators, ranked No. 6 to 100 on the list, have portfolios of owned facilities only, managed facilities only, or both owned and managed. Moreover, 33 other top operators have portfolios of properties they own and manage. Other top operators whose portfolios only include properties they own comprise 48 companies on MSM’s 2024 Top Operators list. Finally, 15 companies on the Top Operators list only provide third-party management. They do not own any facilities.
Adding up the five public companies (REITs and U-Haul International), 33 top operators with both owned and managed facilities, 48 with owned facilities only, and 15 with exclusively managed facilities brings us to 101 operators on the 2024 Top Operators list. But that’s not a mistake! Cubix and Platinum tied for the No. 49 position, and both are included in the count, bringing it to 101 instead of 100.
This year, 23 operators are new to MSM’s Top Operators list. Of those 23, 17 own properties exclusively and do not offer third-party management.
For many years, each REIT’s portfolio has grown significantly. This year, Extra Space’s, Public Storage’s, and CubeSmart’s portfolios showed growth like years past, but U-Haul was only slightly up and National Storage Affiliates actually shrunk, due to selling stores and changing its operational structure. See Table 2.2 on page 24.
Increasing by 146 facilities, Extra Space’s facility count grew 4 percent and square footage grew 3.9 percent. Adding 172 facilities, Public Storage now has 4.9 percent more facilities and 5.5 percent more square feet than last year. CubeSmart had the fasted growth rate, increasing by 156 facilities, representing growth of 11.7 percent in facility count and 10.5 percent in square footage.
Notice that all three portfolios showed faster growth in facility count than in square footage, indicating that smaller facilities are being added to their portfolios. Perhaps the supply of large facilities available for the REITs to buy is shrinking. This trend is visible in facility and square footage metrics for the entire industry as well as for these REITs.
On the other hand, U-Haul increased facility count by only 1.9 percent but increased square footage by 4.4 percent; hence, while fewer facilities were added to the portfolio, they were large ones, perhaps with more RV and boat storage than the average facility.
When measured by the number of facilities, industry market share paints a better picture for the independent owner-operator than in recent years. The number of facilities owned by the “Rest of Industry,” i.e., independent owner-operators who are not among the top operators, grew to 65.9 percent this year, up from 64.6 percent last year. This year’s market share is higher than the previous year as well, reported as 65.3 percent in the 2023 Self-Storage Almanac.
Likewise, “Other Top Operators,” as seen in Table 2.1, also increased number of facilities to 13.2 percent this year. Last year they comprised 12.9 percent market share, which was the same percentage reported in the 2023 Self-Storage Almanac.
Meanwhile, public companies’ (REITs and U-Haul) market share as measured by facility count decreased to 20.9 percent this year, down from 22.5 percent and 21.9 percent in the 2024 Self-Storage Almanac and the 2023 Self-Storage Almanac.
Measuring industry market share by square footage shows even more dramatic gains by small operators. At 52.9 percent this year, “Rest of Industry” picked up 12.7 percentage points, up from 40.2 percent reported in the 2024 Self-Storage Almanac and 41 percent in the 2023 Self-Storage Almanac.
The market share of “Other Top Operators” ranked No. 6 to 100 decreased to 18.6 percent of the industry’s total square footage, down from 22 percent and 22.4 percent in 2024 and 2023, respectively.
Public companies’ market share likewise declined. This year, REITs and U-Haul represent 28.5 percent of the market as measured by square footage, down 9.1 percentage points from 2024, when they had 37.6 percent market share. Their market share in 2023 was 36.6 percent.
Taking a broad picture of all the top operators, a dozen operators experienced significant changes in rankings. Five reported positive gains:
- Trojan shot up to No. 22 from No. 41.
- Atomic Storage Group rose to No. 30 from No. 47.
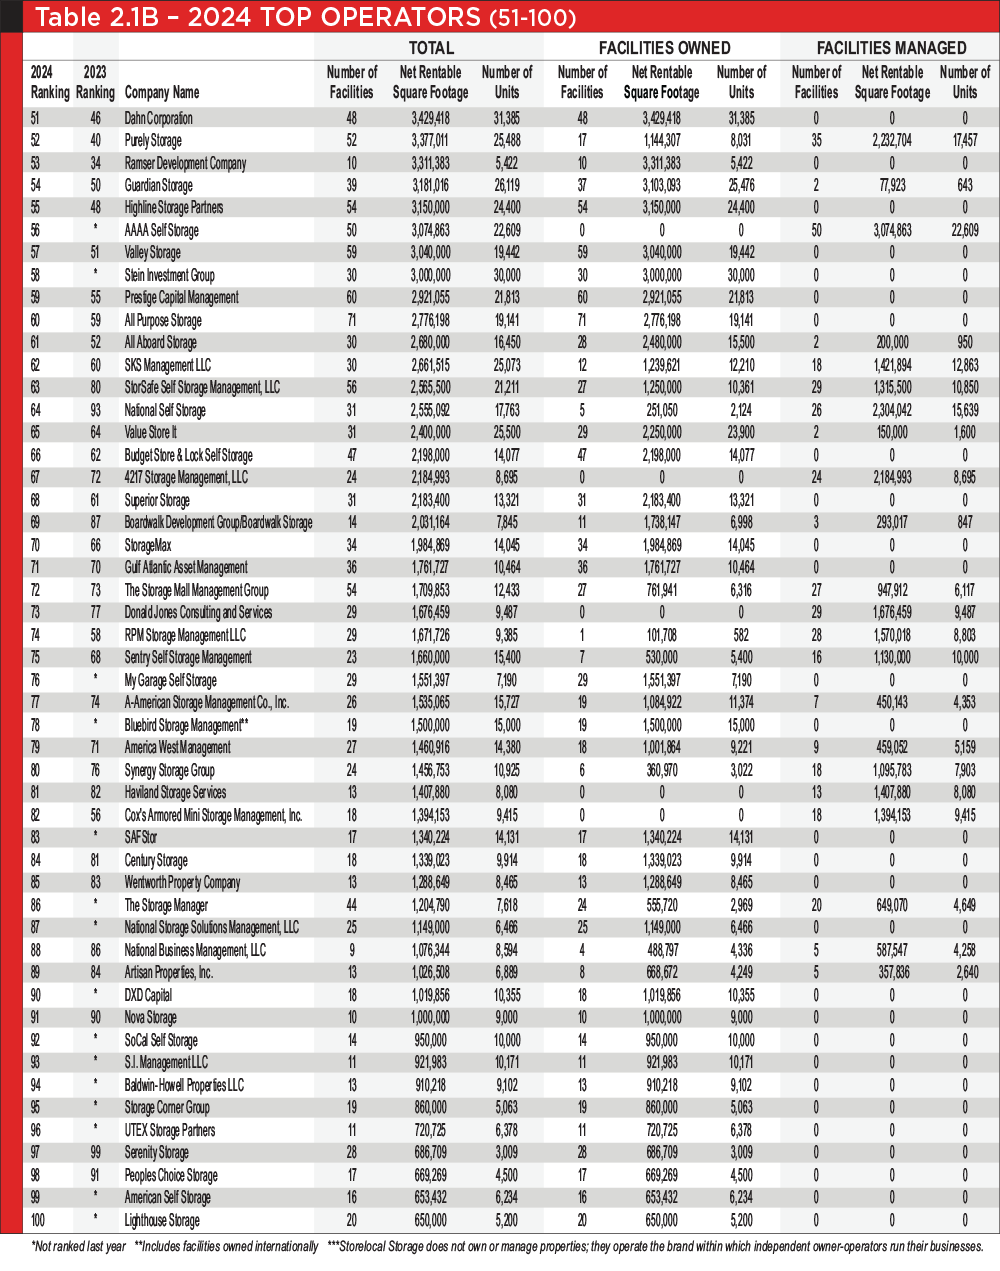
- StorSafe Self Storage Management, LLC jumped up to No. 63 from No. 80.
- National Self Storage climbed up to No. 64 from No. 93.
- Boardwalk Development Group/Boardwalk Storage moved up to No. 69 from No. 87.
Seven operators experienced double-digit drops in ranking:
- The Jenkins Organization, Inc. moved down to No. 38 from No. 12.
- Space Shop Self Storage declined to No. 39 from No. 25.
- TnT Self Storage Management dropped to No. 42 from No. 30.
- Purely Storage moved down to No. 52 from No. 40.
- Ramser Development dropped to No. 53 from No. 34.
- RPM Storage Management LLC declined to No. 74 from No. 58.
- Cox’s Armored Mini Storage Management, Inc. dropped to No. 82 from No. 56.
The Jenkins Organization, Inc. dropped to No. 38 with 63 facilities and 4,750,000 net rentable square feet (NRSF) from last year’s No. 12 spot, with 49 facilities and 16,400,000 NRSF. They shed three quarters of their third-party managed portfolio, and their owned facility count increased by 1, increasing to 15.
Space Shop Self Storage declined to No. 39 from No. 25 last year. It’s store count shrunk to 51 with 4,583,743 NRSF from 83 with 6,464,163 NRSF. The company sold all 36 facilities it owned, while marginally increasing the number of managed facilities.
TnT Self Storage Management dropped to No. 42 from No. 30 last year. They show a net loss of 10 third-party managed stores, reducing portfolio size to 65 with 4,500,000 NRSF from 75 with 5,200,345 NRSF.
Purely Storage increased two facilities in their third-party managed portfolio, but they declined in ranking to No. 52 from No. 40 the year prior. This year they have more stores, but they are smaller. The 2024 Top Operator list reports 52 stores with 3,377,011 NRSF, whereas last year they only had 50 stores but more square footage (3,879,891 NRSF).
Ramser Development reported a difference of about a dozen facilities, dropping in rank to No. 53 from No. 34 last year. They shed all nine third-party managed facilities, and their store count is down by two facilities.
RPM Storage Management LLC declined in rank to No. 74 from No. 58 last year. They are managing only 28 facilities now, instead of 40, and their owned facility count is down by one. The portfolio decreased to 29 stores with 1,671,726 NRSF, which is down from 42 stores with 2,444,700 NRSF.
Cox’s Armored Mini Storage Management, Inc. dropped to No. 82 this year, down from No. 56 the year before. They had a net loss of two facilities in their third-party managed portfolio, which consists of 18 stores with 1,394,153 NRSF this year. Last year they managed two more facilities for a total of 20 stores and 2,511,492 NRSF. That’s a loss of 1,117,339 NRSF. Several of the facilities that left the portfolio were very large RV/boat storage facilities.
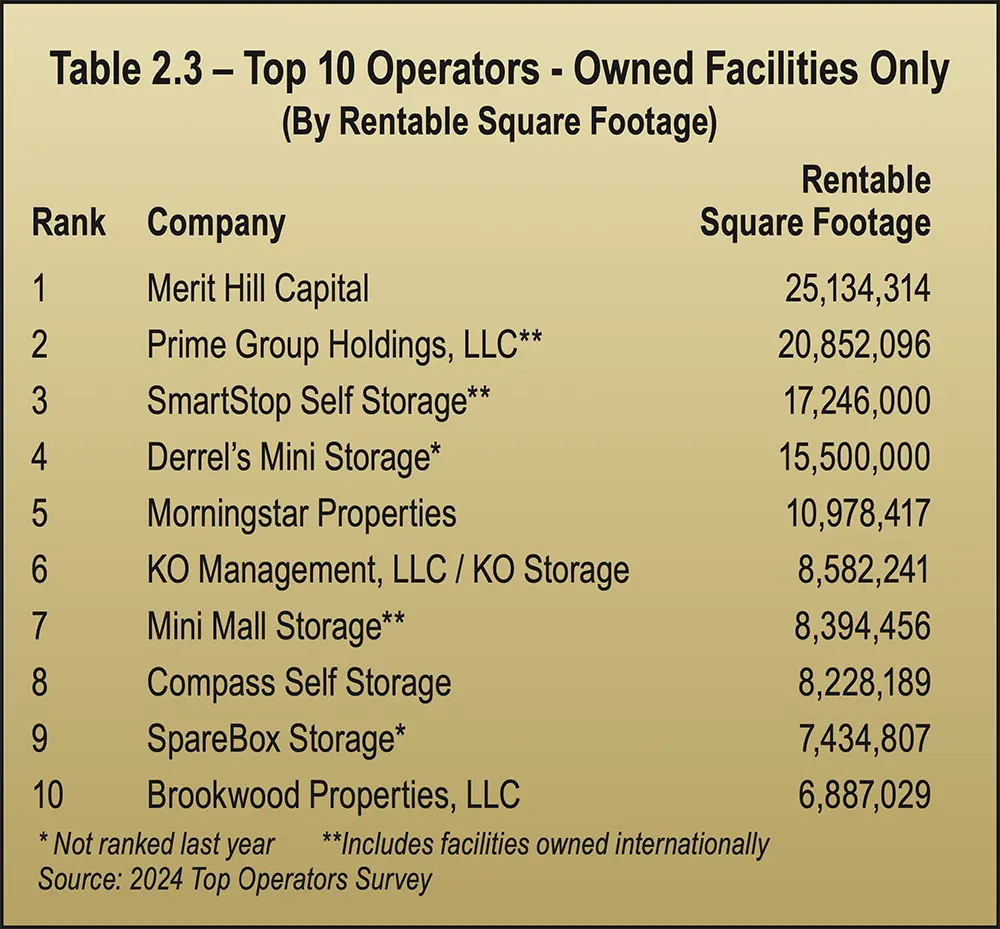
There are 48 companies in MSM’s 2024 Top Operators list with portfolios consisting exclusively of properties they own. The top 10 of these operators are included in Table 2.3 and Chart 2.3, which shows relative size based on square footage.
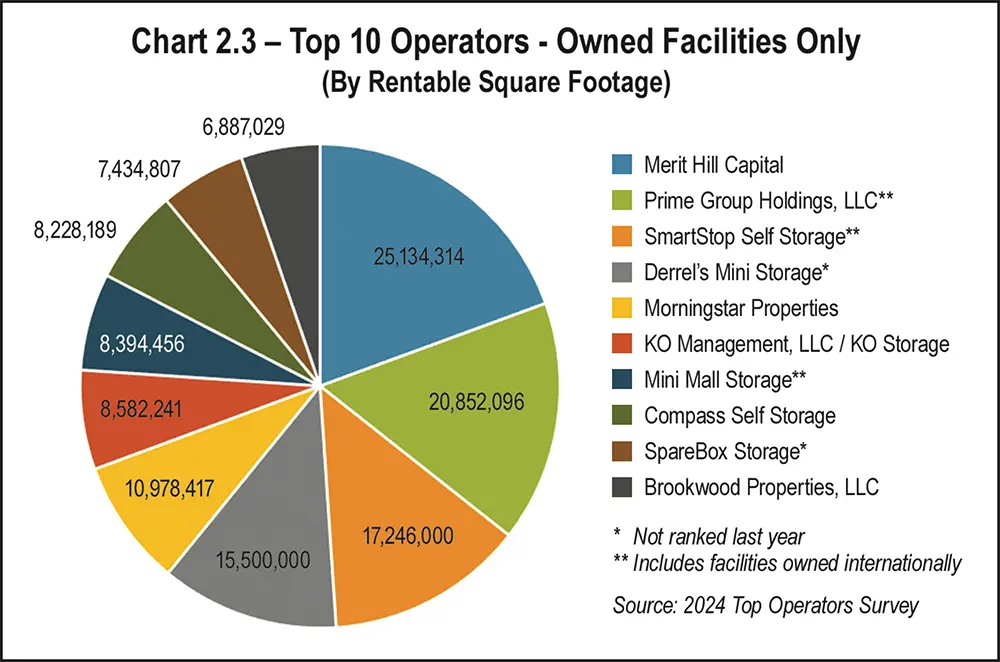
New to the list this year and moving into the No. 4 position is Derrel’s Mini Storage, a regional owner-operator in California. Morningstar Properties moved down from No. 4 to No. 5. KO Management, LLC moved up in one rank to No. 6. Mini Mall Storage moved down two positions to No. 7, as did Compass Self Storage, which now in the No. 8 slot.
SpareBox Storage joined the list of Top 10 Operators (non-REIT) in the No. 9 position.
Like Mini Mall, Brookwood Properties LLC moved down two positions into the last spot on this list.
Rosewood and NexPoint were bumped off the Top 10 list this year by Derrel’s and SpareBox, but they still came in the respectable positions of No. 11 and No. 13.
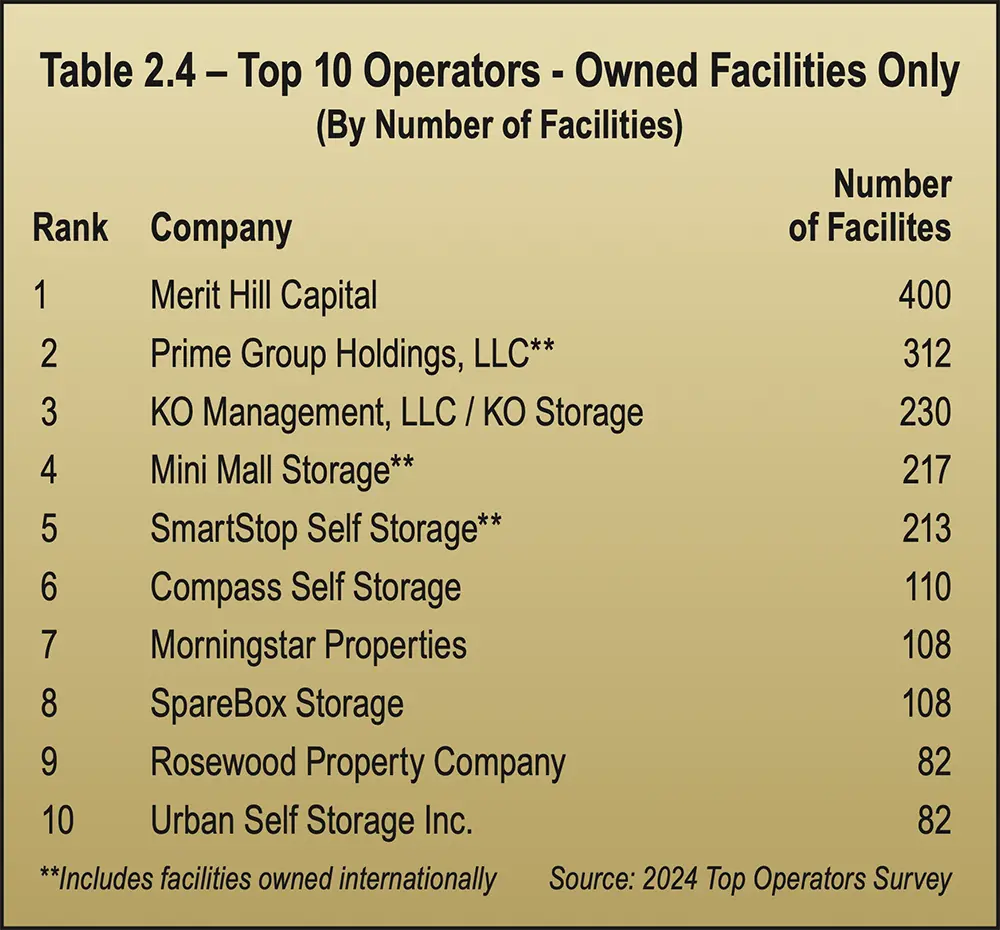
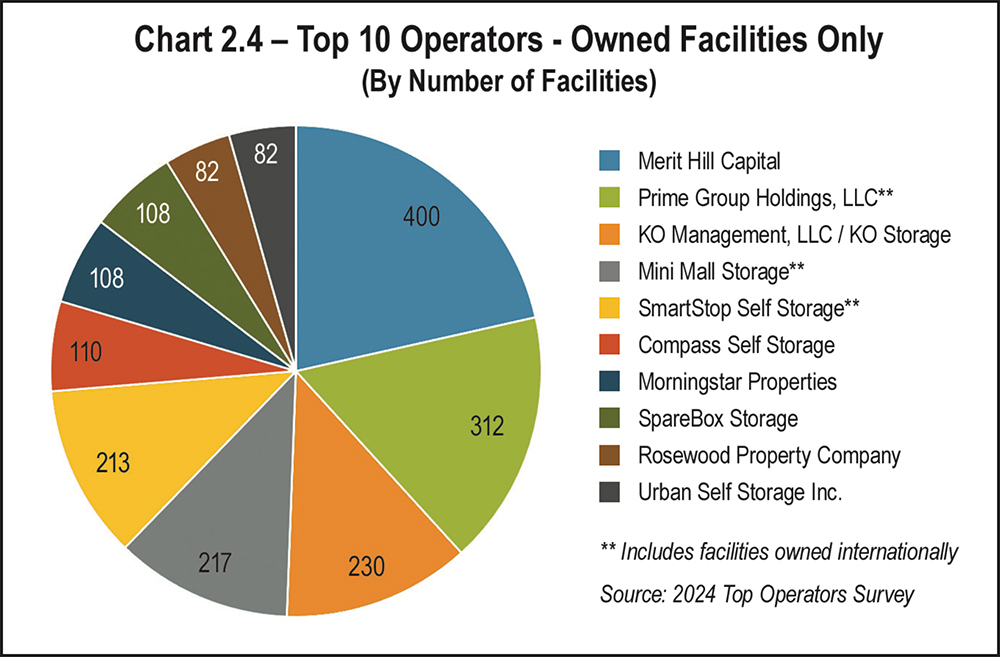
We rank the Top 10 Operators by square footage, as shown in Table 2.3 and Chart 2.3, or by number of facilities, as shown in Table 2.4 and Chart 2.4.
Eight companies appear on both lists. The top two are in the same position (Merit Hill and Prime).
KO ranks higher in number of facilities (No. 3) than square footage (No. 6). Likewise for Mini Mall, which is No. 4 in number of facilities and No. 7 in square footage.
With facilities larger on average than others, SmartShop has the No. 5 position when ranked by number of facilities, whereas it ranks No. 3 when measured by NRSF.
Compass ranks higher for number of facilities, at No. 6, than square footage (No. 8).
Morningstar is the opposite, ranking No. 7 in number of facilities but No. 5 by square footage. It has 108 facilities; the same amount as SpareBox, which ranks No. 8 on the facility count list and No. 9 on the square footage list.
Rosewood and Urban earned spots No. 9 and No. 10 on the list measuring by number of facilities, even though they were bumped off the list measuring size by NRSF. They both have 82 facilities in their portfolios.
Derrel’s and Brookwood do not rank among the top 10 largest portfolios when measured by number of facilities. Derrel’s comes in at No. 14 and Brookwood at No. 12, because they have fewer but larger facilities.
Comparing this year’s data to last year’s, Merit Hill remains No. 1 and Prime No. 2 on both measures last year and this year.
KO and Mini Mall changed positions this year, with KO in No. 3 and Mini Mall in No. 4. SmartStop retains the No. 5 position again this year. Compass moved up the list to No. 5; last year it was No. 7.
Morningstar moved down the list to No. 7; it was No. 6. Rosewood also moved down one spot, from No. 8 to No. 9.
SpareBox and Urban join the list this year in spots No. 8 and No. 10, when measured by facility count. A mentioned earlier, Brookwood and NexPoint fell off this list this year. SpareBox, being the newcomer to the list, ranked slightly higher in the number of facilities rank than NRSF, appearing in the No. 8 spot on this list but No. 9 on the NRSF list. (See Table 2.3 and Chart 2.3.) SpareBox also bumped Rosewood down one rank to No. 9.
Urban Self Storage appeared on this list of top 10 operators for the first time this year because it reported 82 owned facilities and zero third-party managed facilities. Last year, Urban reported zero owned facilities and 78 managed facilities. Clearly, Urban has changed its strategy.
Also interesting is that National Storage Affiliates (NSA) shows zero managed facilities this year, because of the change in their PRO structure, thereby eliminating the 120 managed facilities NSA reported in the 2023 Top Operators list. This, plus the sale of the large portfolio mentioned above, brought NSA’s overall facility count down to 1,052 this year, compared to 1,237 in 2023.
SAM, Argus, and StoragePRO remain in the top three spots of the top 10 management companies when measured by square footage.
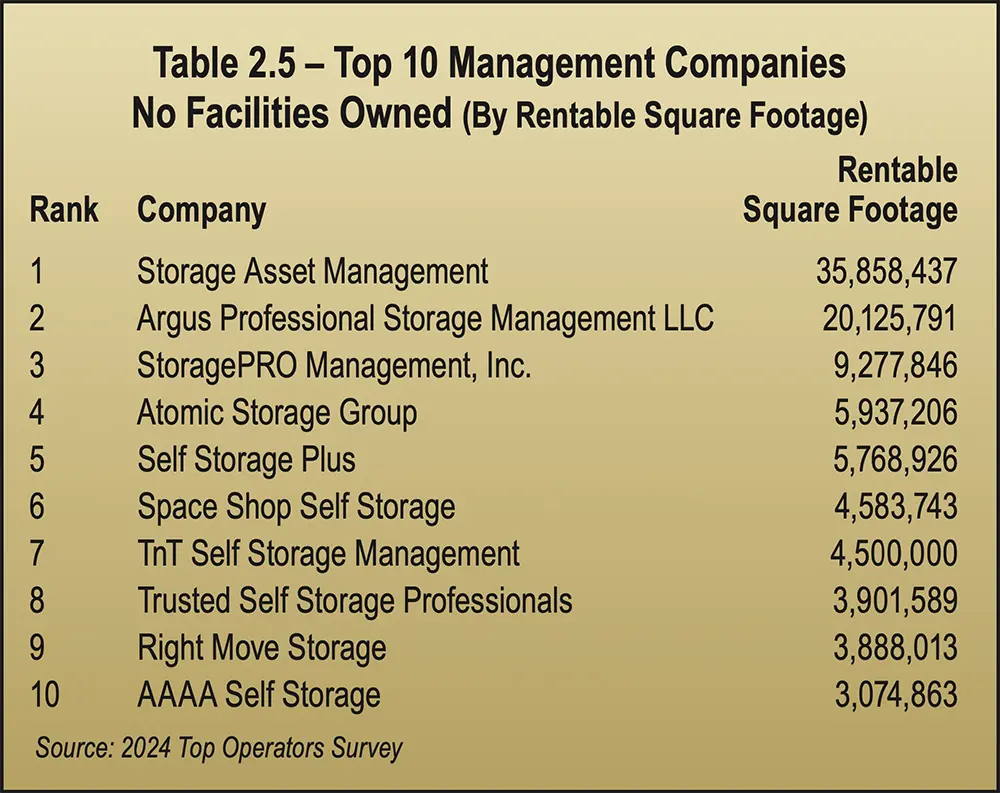
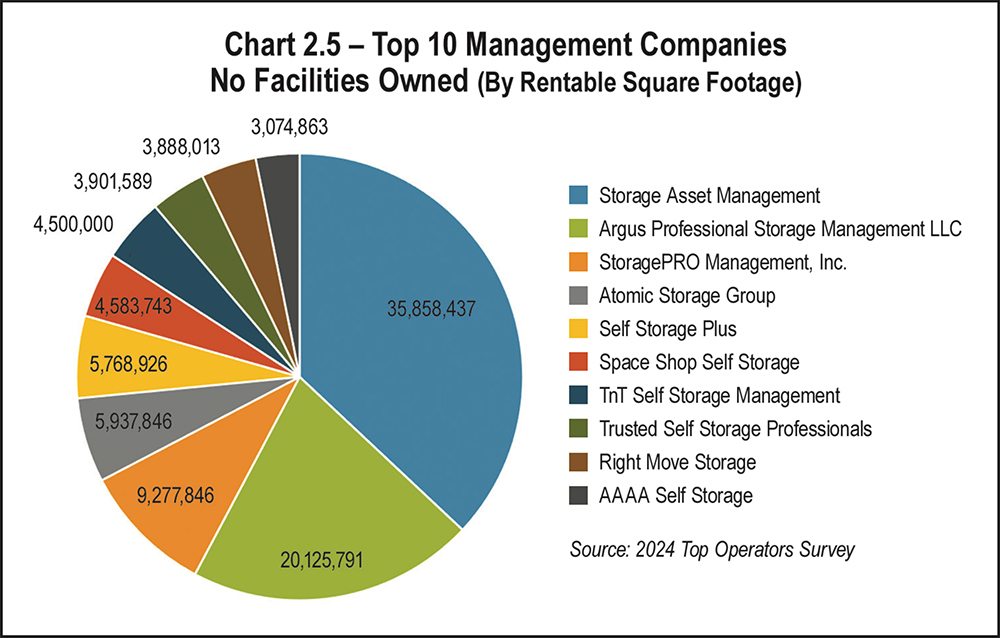
Self Storage Plus retained the No. 5 position.
Like Atomic, Space Shop Self Storage also climbed far up the top management company list this year, to the No. 6 spot, increasing their managed facility count to 51 from last year’s 47. Overall, their ranking declined to No. 39, compared to last year’s No. 25 because they sold all 36 facilities of the facilities they reported as owned facilities in MSM’s 2023 Top Operators list.
TnT slid down the list to No. 7, compared to the No. 4 position last year. As mentioned earlier, TnT’s third-party managed portfolio shrank by 10 facilities, down from 75 reported last year to 65 reported this year, which also decreased their overall ranking among top operators to No. 42, down from No. 30.
Trusted Self Storage Professionals and Right Move Storage retained the No. 8 and No. 9 positions among the top 10 management companies.
Dropping off the list is Cox’s Armored Mini Storage Management, which went from 20 larger facilities to 18 smaller facilities, as explained previously.
The No. 10 position was assumed by AAAA Self Storage, which wasn’t on last year’s list. This year, they manage 50 facilities and captured the last position among the top 10 management companies.
Copper Storage Management is not in this year’s list, but they ranked No. 6 on last year’s top 10 management company list, and No. 32 overall in 2023, with 174 third-party managed facilities. The year before that, the 2022 list ranked Copper No. 42 overall.
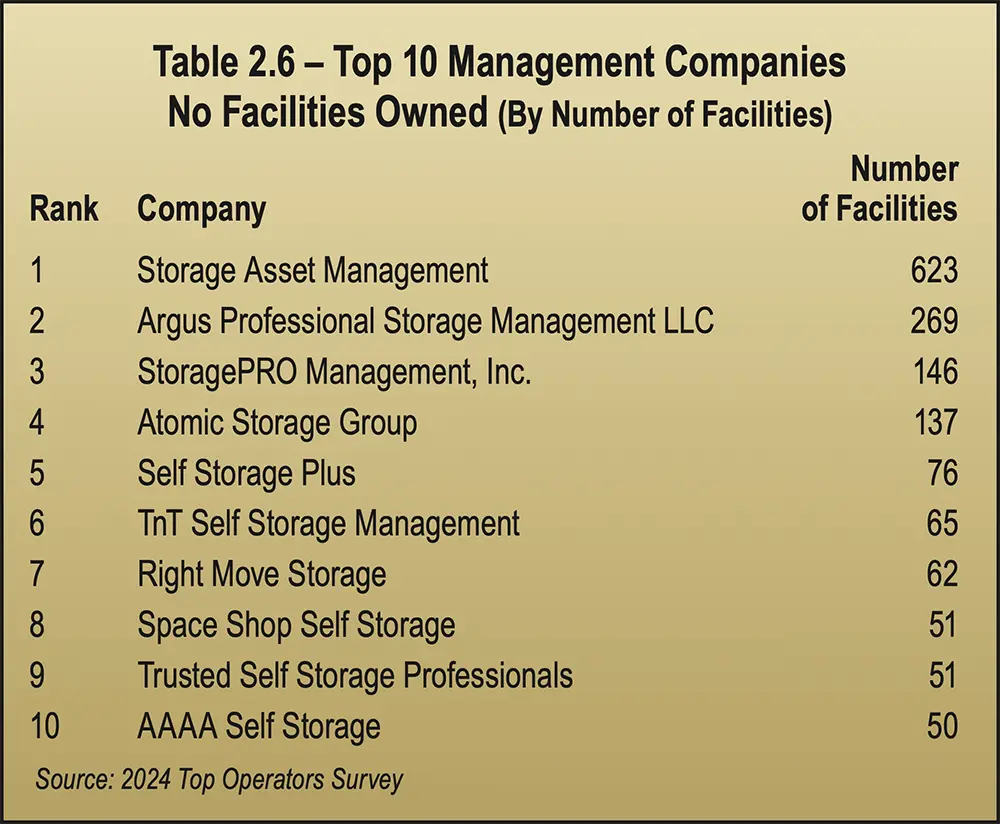
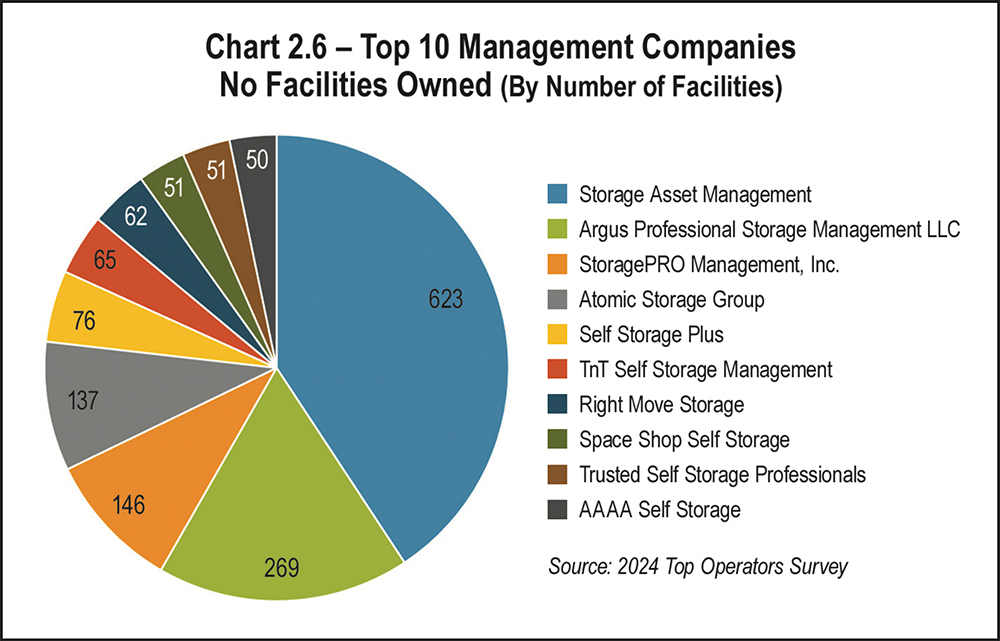
Now for a look at the top 10 management companies as measured by number of facilities. The No. 1 and No. 2 management companies by number of facilities are the same as square footage: SAM and Argus. In fact, SAM and Argus hold the No. 1 and No. 2 positions on both lists, both this year and last year.
When sorted by total number of facilities, the No. 3 spot this year goes to StoragePRO, taking Copper’s position on the list.
Atomic shot up to No. 4 on this list too, capturing the same position on both lists (number of facilities and square footage).
Self Storage Plus increased to No. 5 on this list. It was in the No. 7 position last year.
TnT remains in the No. 6 spot, and Right Move increased to No. 7 this year, from No. 8 last year.
Space Shop Self Storage moved into No. 8, after not being on the list last year.
Trusted Self Storage Professionals maintained the No. 9 position. Cox’s Armored Mini Storage Management, which dropped off the list, was replaced by AAAA Self Storage.
It also shows changes in market share that should grab your attention. This is the first year the data shows an increase in market share by the small, independent owner-operators, both in terms of number of facilities and square footage.
The changes are observable for operators whose strategy is to own facilities (only), provide third-party management (only), and for portfolios that include both owned and managed facilities.
This kind of change in industry ownership, and relative change in size, both up and down, suggest that the self-storage industry is more dynamic than it has been in recent years. Is there more flexibility and opportunity for the independent owner-operator now than in recent years? The COVID years were full of opportunity for owners of all sizes to buy and sell facilities. However, as this year’s data on rates and occupancy underscores, it’s more difficult to grow revenue than in recent years.
How these trends develop in the years to come will have a major impact on portfolios of all sizes, structures, and management styles. One thing is certain: These are indeed very interesting times!
hile in-progress self-storage construction levels remain high, the majority of these builds began in late 2023 or early 2024. Since then, new deliveries have dropped significantly, moving at a much slower pace given interest rates, the rental rate environment, and lack of market confidence. While the Federal Reserve’s rate cut in November 2024 should offer smaller monthly mortgage payments for homebuyers, experts feel it’s unlikely to lead to a surge in demand for storage. Even with the rate cut, many believe it will remain difficult for homebuyers to purchase a home at a reasonable price. While the heated 2024 election has been settled, providing some stability, the new administration’s policies, under President Trump’s leadership, also begs questions that only time can answer.
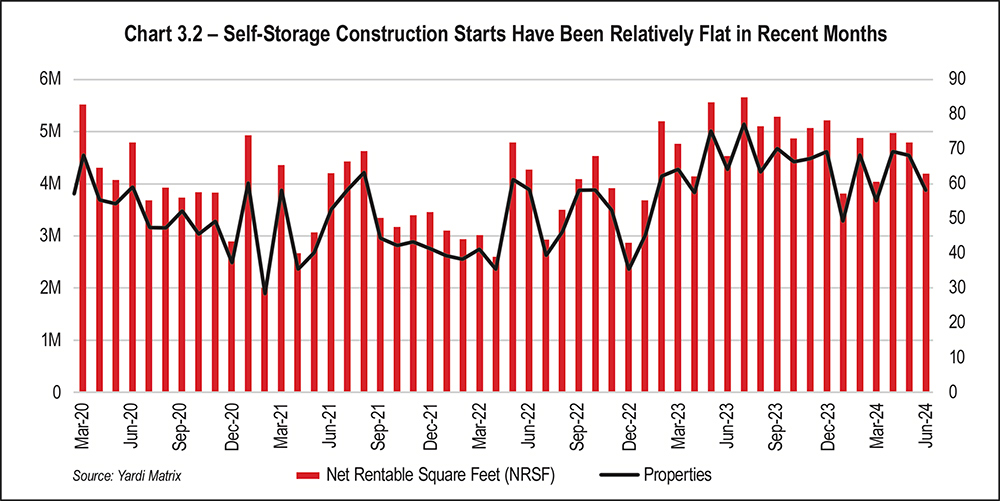
On average, the under-construction pipeline was relatively flat in 2024, averaging around 59 million net rentable square feet (NRSF) (See Chart 3.2 on page 32). Plus, the monthly average rate at which planned projects moved to under construction continued to trend downward. (It should be noted that the new data includes 17 new self-storage markets, so while the level of the forecast has increased, the rate of change remains the same.)
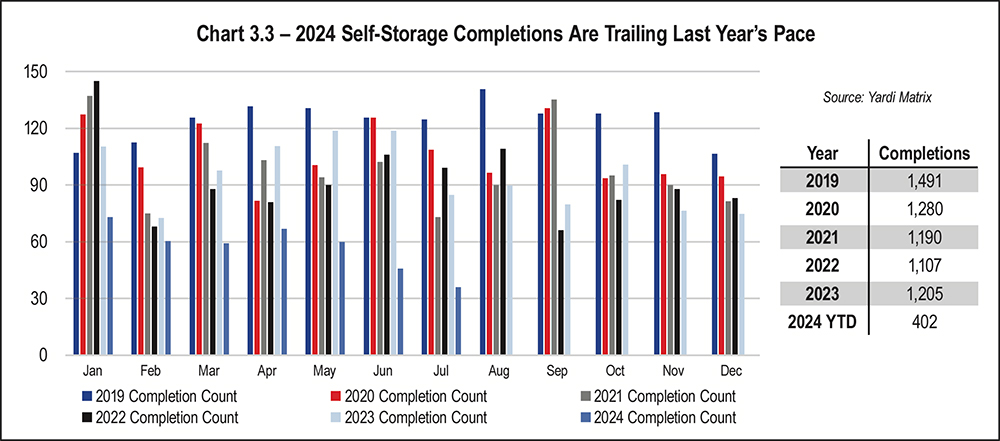
Self-storage completions are also behind that of previous years. In November 2024, approximately one-third of projects had been completed compared to 2023 (See Chart 3.3 on page 32).
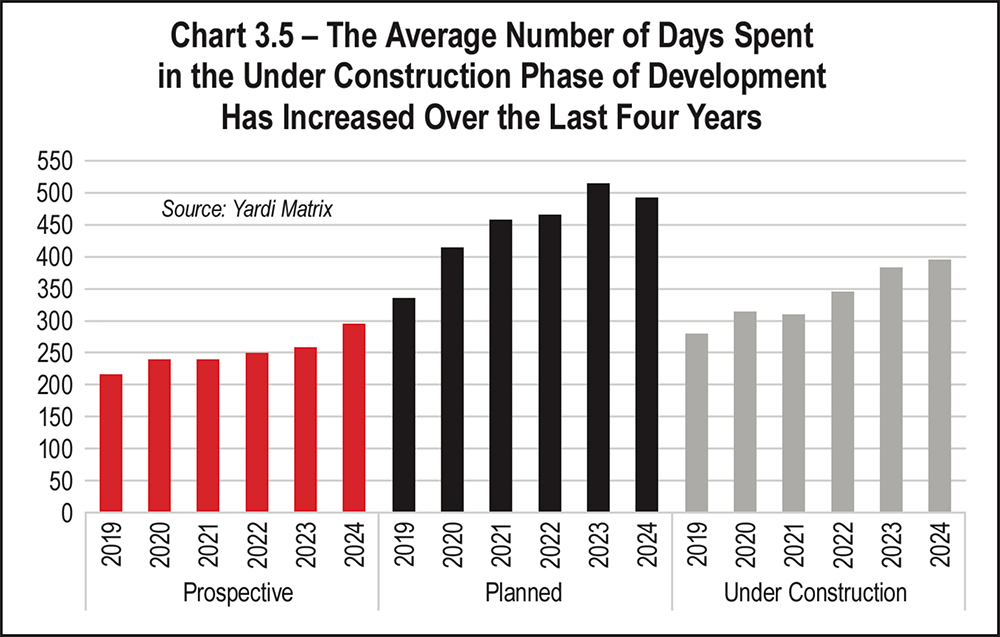
Planning and construction timelines continue to oppose one another. While the number of days spent in planning has decreased slightly, the number of days in construction has increased, from under a year (~275 days in 2019) to over a year (~400 days in 2024). (See Chart 3.5 on page 33).
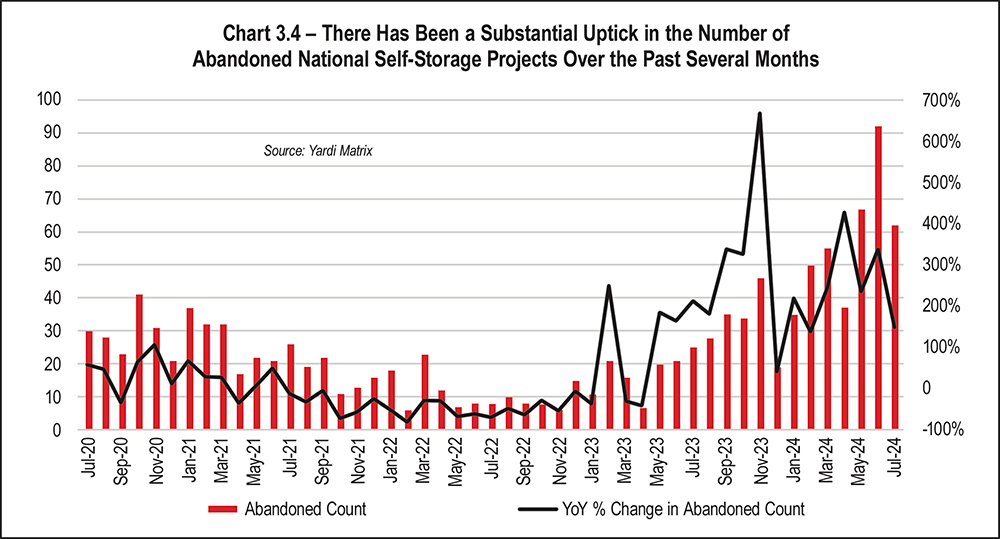
- The planned pipeline contracted quarter-over-quarter for the first time,
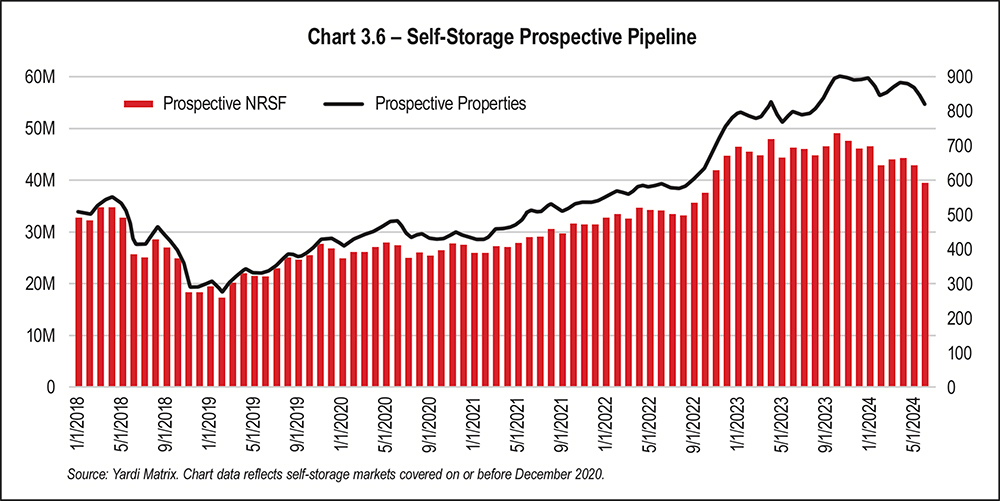
- The prospective pipeline continued to contract, and
- The number of abandoned self-storage projects continues to increase.
Yardi does report that markets that just a few years ago had the weakest growth patterns and issues with new supply have emerged as top performers. Although advertised rent growth is still negative, the report puts Denver, New York, Portland, Seattle, and Washington, D.C., into this camp. This demonstrates that markets can outperform coming out of a high-supply cycle and shows the advantages of having a geographically diversified portfolio that balances high growth/high supply with slow growth/moderate supply markets and submarkets.
Ultimately, the biggest impact on self-storage right now is being able to solve for more movement in home sales. Currently 70 percent of all existing homeowners have mortgages under 4 percent, housing prices are on the rise, and interest rates on purchases are elevated. This means mobility will likely remain flat. Promises have been made for more affordable housing, and there may be a marked improvement if this comes to fruition.
Lastly, it’s important to remember that supply is relative to the specific submarket in which facilities operate. While national trends are alarming, each submarket tells its own story, and there are cases to be made for individual sites that may fare better than others. With supply being the Achilles’ heel of the sector, it’s more important than ever to exercise a great deal of caution when developing. But some things are certain: Cycles come and go, and markets do recover.
Special thanks to Armand Aghadjanians (Store Here Self Storage), Neal Gussis (SPMI Capital), and Doug Ressler (Yardi) for their help in this reporting!

he state of our economy and its projected path provides the groundwork from which businesses and investors make decisions. The cost of capital, building costs, supply chain conditions, and the employment situation inform these decisions. Consumers, too, make financial decisions based on indicators such as the trajectories of interest rates, inflation, and housing costs. Indeed, the economy was the No. 1 issue for voters in the 2024 presidential election.
The pandemic and post-pandemic years created a new economy beleaguered with unexpected disruptions and an uncertain path forward. Yet, in a year of instabilities such as strikes, hurricanes, a dismal October job report, and a heated presidential election, the resilience of the U.S. economy remained a marvel in 2024. The economy grew 2.7 percent in the third quarter when compared with the same quarter in 2023.
The encouraging economic news for 2024, however, was equally mingled with unfavorable aspects. Growth in business investment slowed as the cost of capital remained high. Mortgage rates also remained elevated, keeping many would-be homebuyers out of the market. The jobs market lost its post-pandemic momentum, and the costs of just about everything consumers and businesses purchase remained inflated.
The most significant takeaway is that 2024 didn’t bring the recession many had forewarned of in 2023. While several storms threatened to capsize the ship, the U.S. economy proved to be seaworthy.
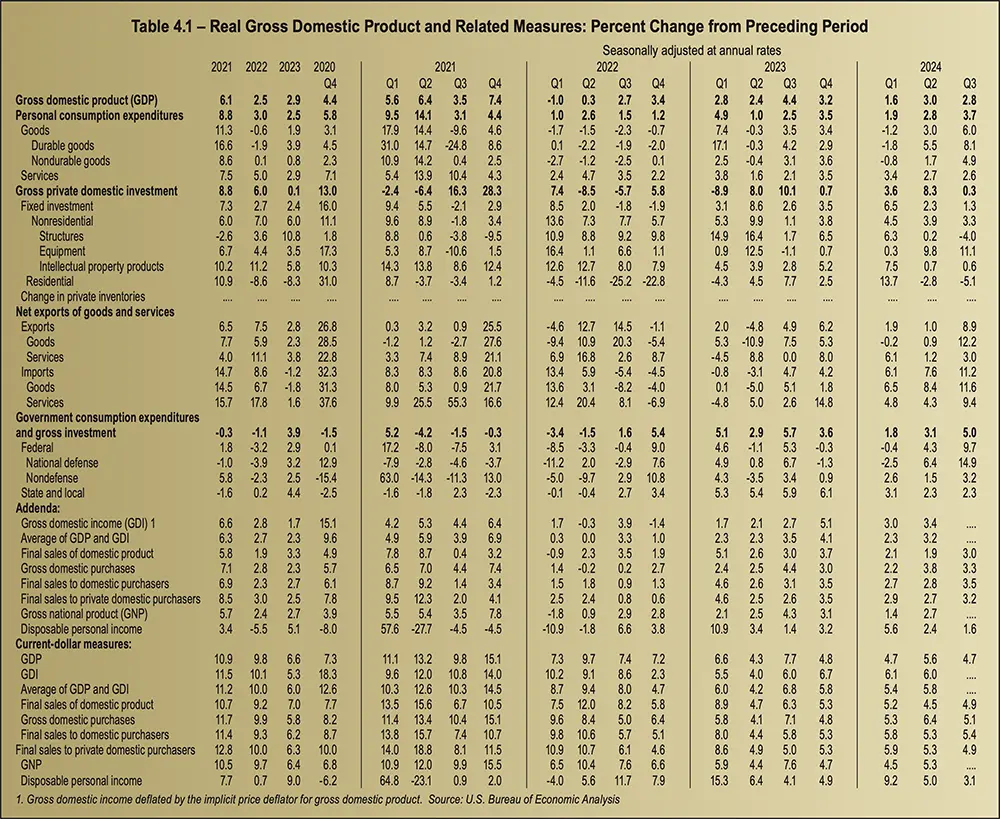
After a disappointing 1.6 percent growth in the first quarter, the increase in real GDP in the third quarter was mostly a result of increases in consumer spending. Real gross domestic product (GDP) increased at an annual rate of 2.8 percent in the third quarter of 2024, following a second-quarter increase of 3.0 percent. See Table 4.1, Real GDP, on page 38.
Hurricanes Helene and Milton caused widespread damage in the Southeastern U.S. in late September and early October, which suggested a slow start to real GDP growth as the third quarter began. Hurricanes and tropical cyclones have cost the U.S. economy roughly $2.6 trillion in lost output since 1980—roughly $60 billion per year on average. A considerable hit to the economy, that amount represents a cut of 0.3 percentage points from year-over-year real GDP growth.
Although these natural disasters cause substantial disruptions to supply chains, services delivery, the output of goods, and labor market activity, rebuilding efforts can reverse some of the detrimental effects on GDP. Construction spending is a large contributor to the overall economy. Total construction spending surpassed $2 trillion in 2024, a 5-percent increase over 2023.
Although rebuilding will help mitigate the economic effects of these disasters, insurance losses from Hurricane Helene may have exceeded $48 billion, and Hurricane Milton and the tornadoes it brought may have caused losses between $50 billion and $100 billion.
Although consumers were still spending in 2024, a decrease in activity is likely in 2025. Real income growth has not kept up with real spending growth since mid-2023. Household savings were at a two-year low in the third quarter, the delinquency rates for credit cards and auto loans were reaching worrisome levels, and the labor market showed evidence of slowing down.
Business investment growth remained unbalanced in 2024 as the cost of capital stayed high and businesses were concerned with the prospect of declining consumer demand and instability in the geopolitical scene. Investment rose in the first quarter as businesses invested in intellectual property such as digital transformation and AI. They also spent on hiring talent. However, investment was low in capital equipment and structures, with the exception of factories.
In the third quarter, equipment spending increased by 11.1 percent quarter over quarter and nonresidential investment continued to rise, with firms purchasing tech, industrial, and transportation equipment. Investment in structures declined by 4.0 percent quarter over quarter. The collapse of commercial real estate prices, primarily driven by a problematic office space market, contributed to this decline.
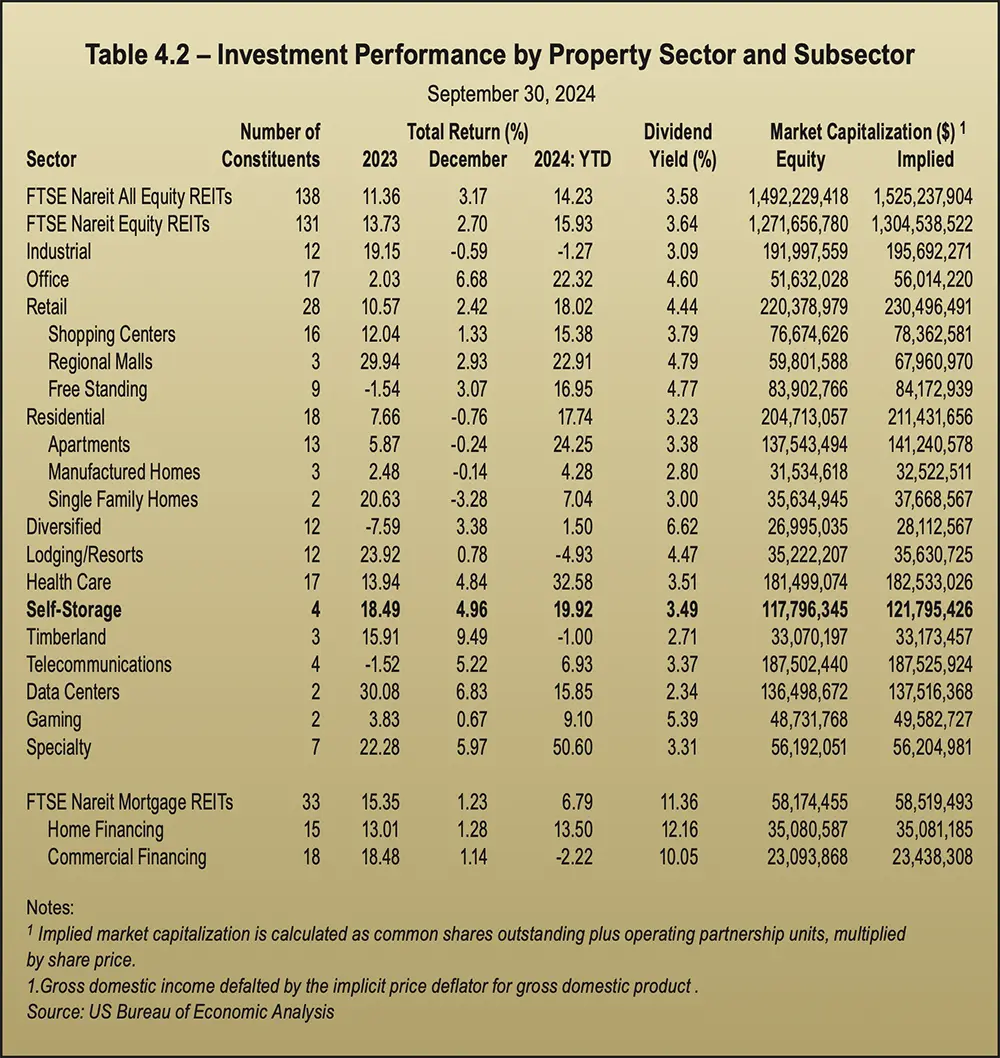
An easing of interest rates helped REIT total returns reach 16.8 percent in the third quarter. The lower rates helped push the FTSE Nareit All Equity REITs Index up 3.2 percent in October, as REITs continued on a positive track that had seen the index up 39.1 percent since October 2023. See Table 4.2, Investment Performance by Property Sector.
The self-storage REIT sector was solid in the third quarter, boasting a 13.3 percent return in August 2024 that made it the best performing of the 13 public equity REIT property sectors for the month. In September, the sector posted a 5.0 percent return. Then, as the fourth quarter began in October, self-storage posted a loss of 9.7 percent.
As demand spiked to a new high during the COVID pandemic, it provided the impetus for a record 40-percent increase in move-in rents from June 2020 to March 2022, as vacancies fell below 3 percent. Post-COVID, steep home prices and rising mortgage rates sharply reduced housing activity, leading to reduced self-storage demand. By the beginning of 2024, self-storage vacancies were above 8 percent, with move-in rents down 15 percent. The new self-storage market conditions, though disappointing, were in line with a healthy self-storage market as vacancies of around 8 percent on average are consistent with the industry target. Current move-in rates are also well above the pre-pandemic average.
By October, however, self-storage REITs were seeing lower move-in rates and higher vacancies. They reported an average same-store revenue decrease of 1.48 percent compared to the same quarter in 2023, when average growth was 2.0 percent, and a significant decrease over 2022’s growth of 13.6 percent in the same quarter.
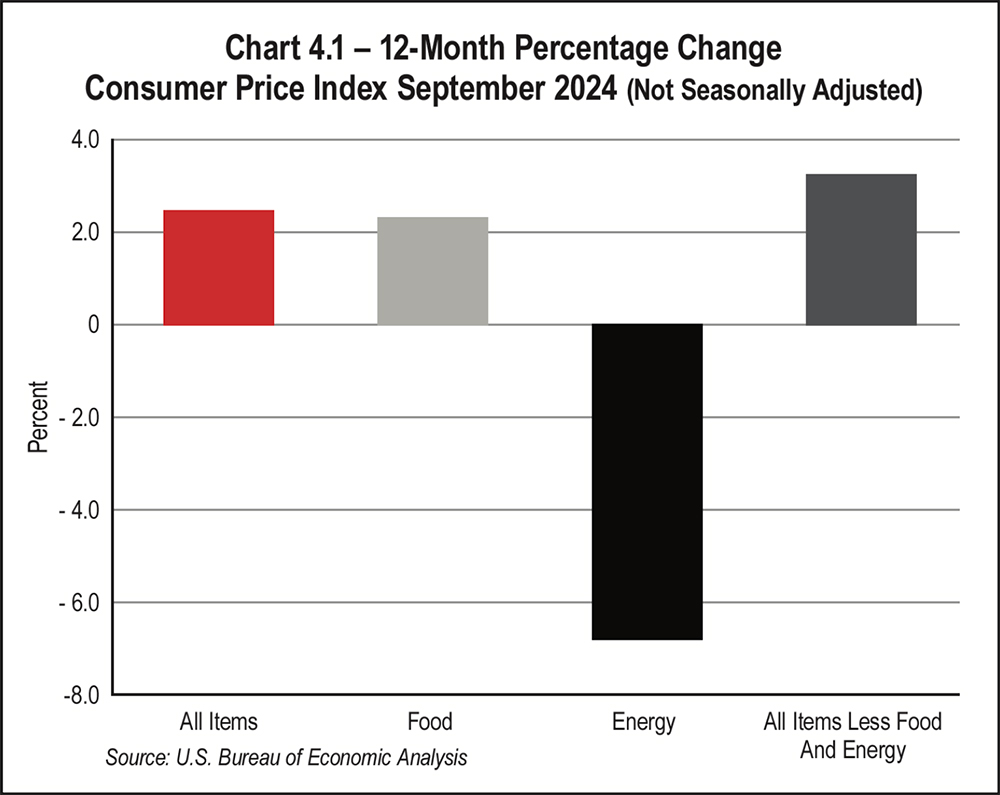
Consumer inflation, which peaked at 9.1 percent in 2022, has since fallen steadily though overall prices are still about 20 percent higher than they were in 2020. Consumer prices increased overall in October as higher food and housing costs offset lower prices for gasoline.
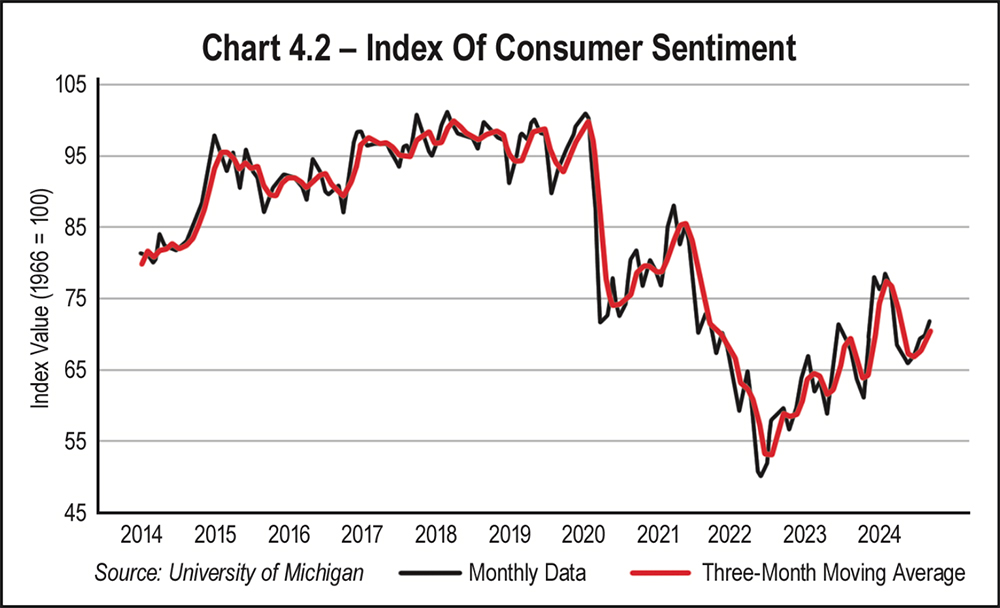
The University of Michigan consumer sentiment index for the U.S. declined five-month high of 70.1 in September. In 2024 overall, consumer sentiment fell far short of pre-pandemic numbers, which remained around 100. While consumers continued to spend, their outlook on the economy remained skeptical due to high prices and unfavorable interest rates. Although consumers’ expectations of income growth rose in October, most consumers expected inflation to exceed income gains in 2025. See Chart 4.2 on the opposite page, Index of Consumer Sentiment.
The growth in real consumer spending continued to outpace real disposable personal income growth, signifying that many households continued to finance their purchases with debt. Auto loan and credit card delinquencies are above pre-pandemic levels. Payments on debt at high interest rates combined with higher prices for goods and services may cause most consumers to rein in spending in 2025. Although higher income families will likely continue to spend, judicious spending by most consumers should help drive disinflation.
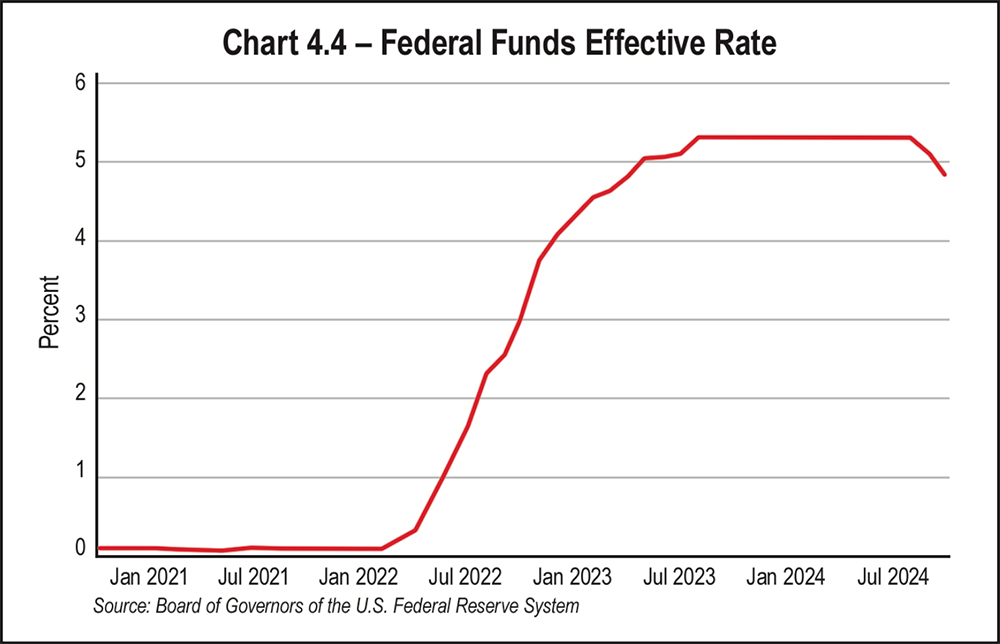
Higher interest rates typically encourage less spending and more saving, which is why the FED began its rate hike strategy to slow down spending to bring down inflation. While spending did cool somewhat, the higher costs of goods and services made saving more difficult. Both consumers and businesses continued spending in the fourth quarter, albeit more cautiously and with greater sensitivity to current costs and interest rates.
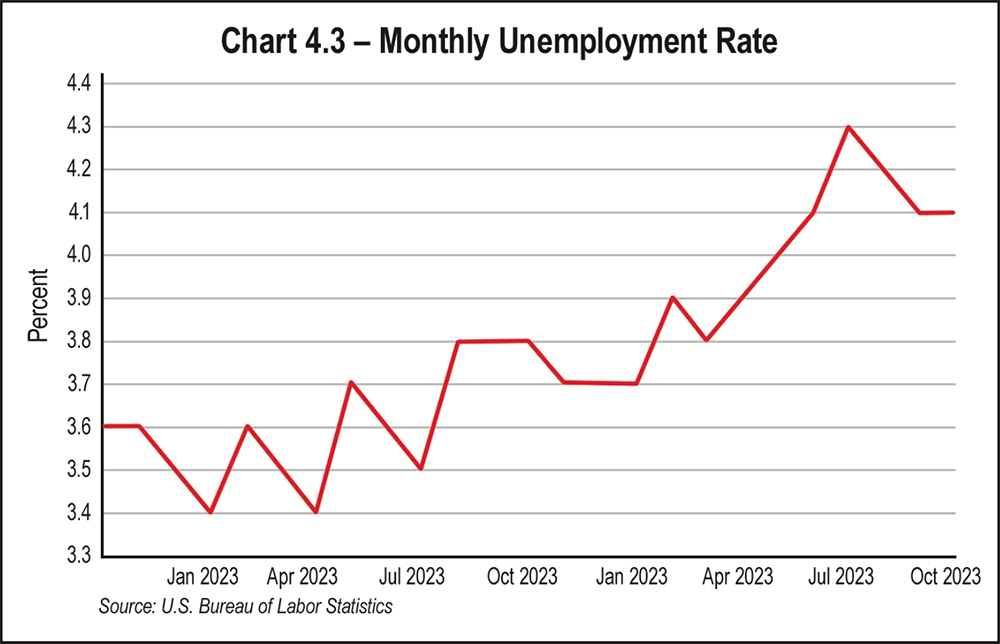
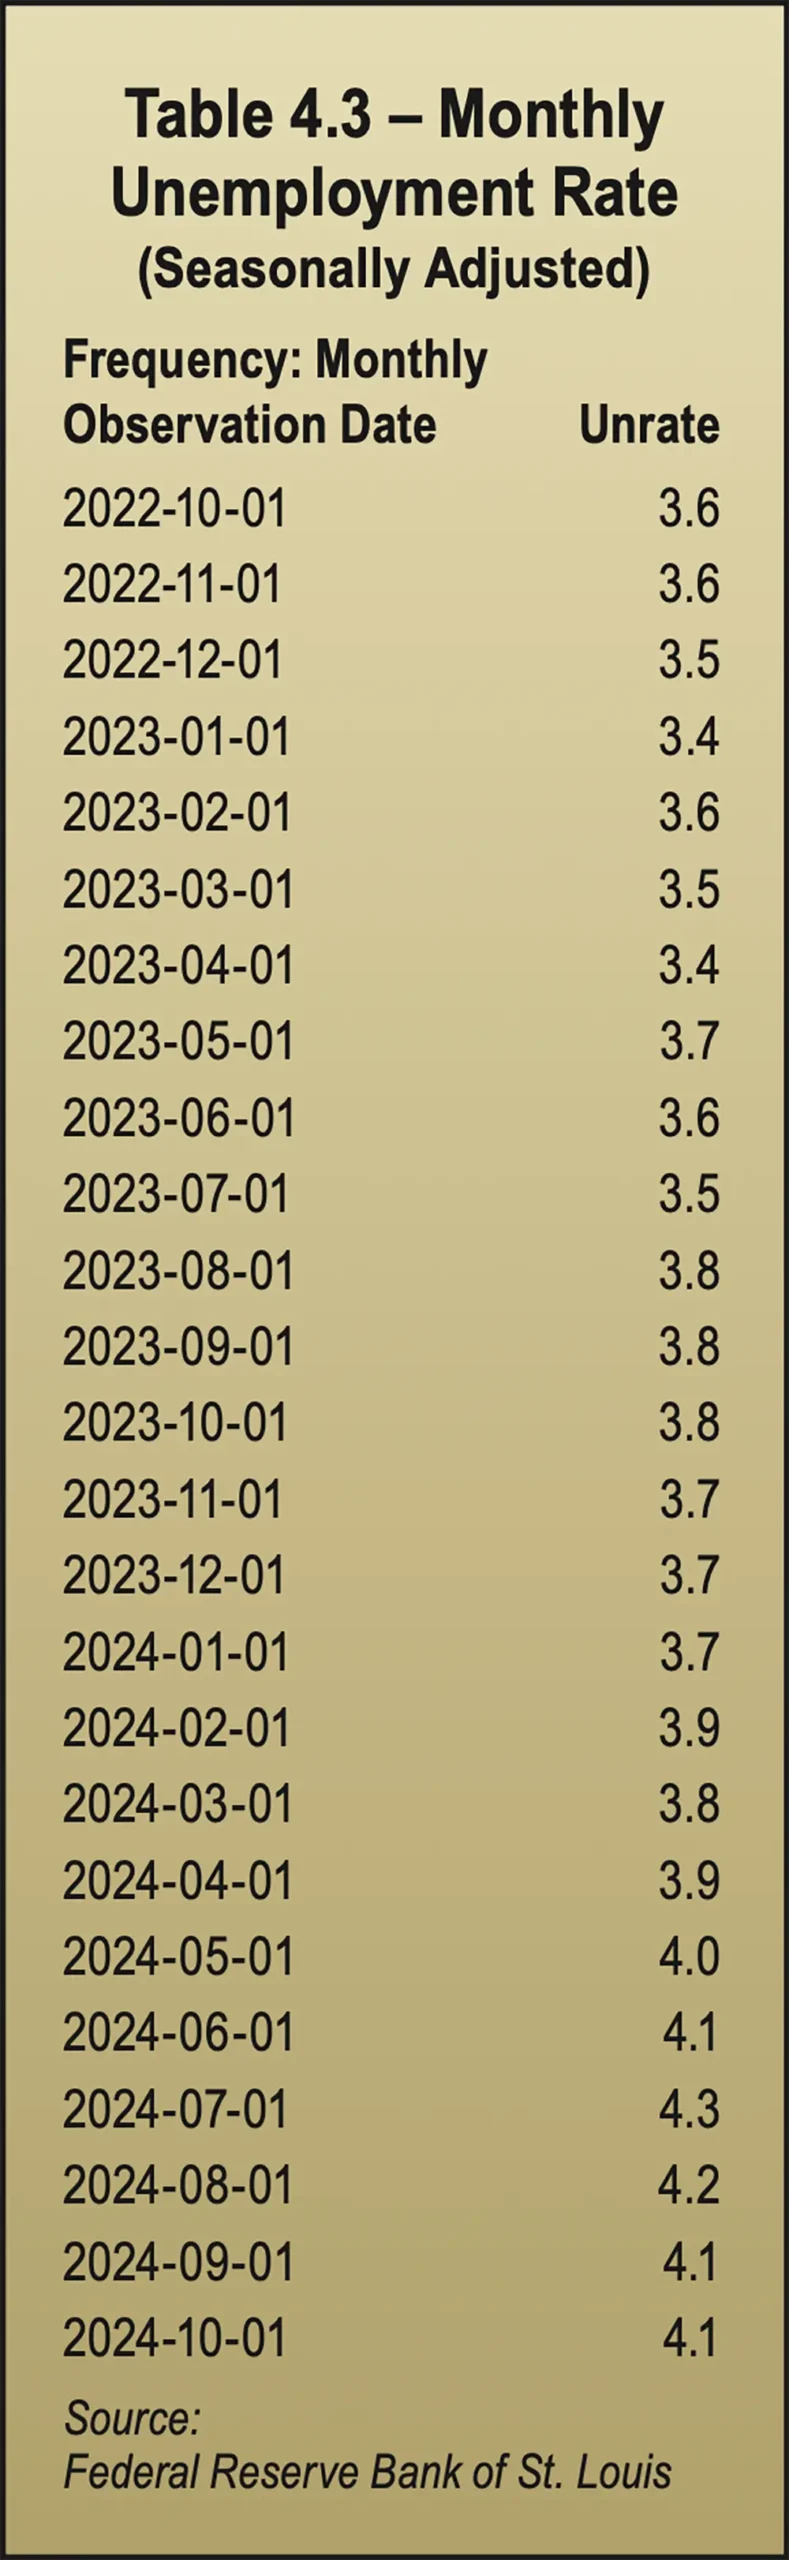
The average hours worked remain steady, as did wage growth. Labor shortages should continue to drive hiring in some industries. These shortages were driven in part by retiring baby boomers as manual labor and front-line manufacturing jobs have become increasingly difficult to fill. Many economists predict that the unemployment rate will rise to 4.5 percent by the end of 2025.
Changes in the job market are set to take place as some jobs may be displaced by automation while creating new opportunities in technology. While traditional industries may have fewer jobs to offer, growth will continue in sectors such as health care, renewable energy, and various technology fields.
By race, Caucasians are far more likely to work remotely and comprise 64.8 percent of those workers, followed by the Hispanic/Latino group at 13.3 percent, and African Americans at 9.6 percent. The largest percentage of remote workers are age 25 to 39, making up 36.5 percent; 29.8 percent are 40 to 54 years old, while 16 percent are 55 to 64 years old, and 10.7 percent are 65 or older. Only 6.9 percent of remote employees are between the ages of 18 and 24, a group that prefers more social interaction.
Overall, the U.S. labor market is showing signs of softening, with workforce participation below pre-pandemic levels. Immigration will continue to help fill jobs, and an improved economy may encourage businesses to hire more workers.
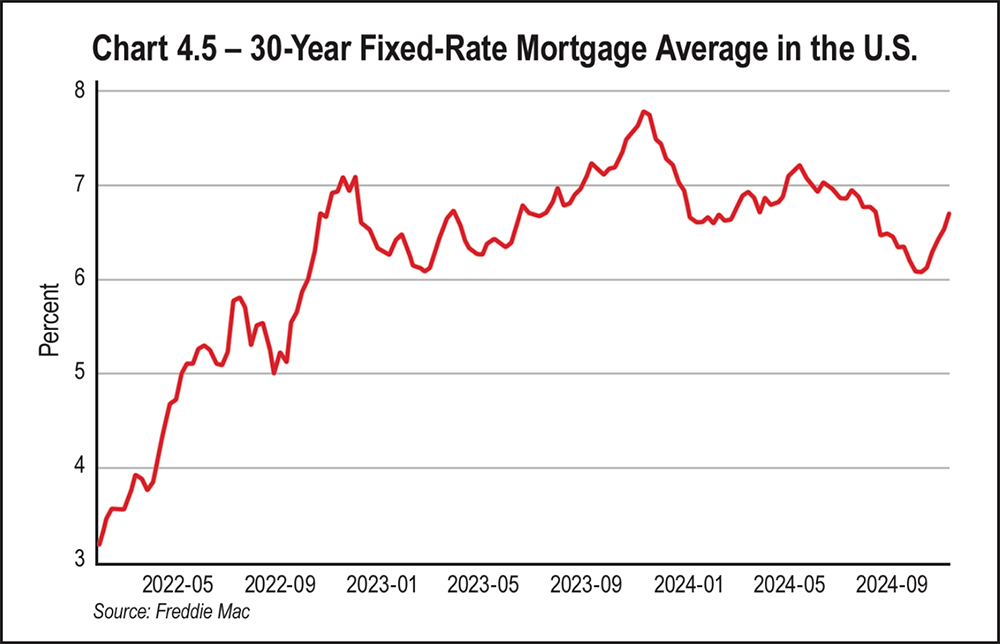
Closely tied to the Federal Funds Effective Rate are mortgage rates. As interest rates increased, mortgage rates followed, jumping from 3.2 percent in January 2022 to 7.08 percent in October of the same year. Not much relief was found in 2023, with 30-year fixed rates averaging 6.81 percent. Mortgage rates hit a high of 7.79 percent in October 2023, the highest rate reached in over two decades.
For much of 2024, the cost of a typical 30-year fixed mortgage had been in the high-6 to low-7 percent range but topped out at 7.22 in May. As of mid-November, 30-year fixed rate mortgages averaged 6.91 percent. See Chart 4.5, 30-Year Fixed Rate Mortgage in the U.S.
By the fourth quarter 2025, Fannie Mae expects the 30-year fixed mortgage rate will average out at 6.2 percent. The MBA expects 6.0 percent, while Wells Fargo forecasts 5.9 percent. At any of these rates, we will still be well above the 3.5 percent to 5.5 percent range mortgage rates that remained for a decade before the pandemic. While a dip in mortgage rates could improve affordability and bring in more buyers, the levels currently projected by these firms won’t bring affordability to the levels seen before the pandemic housing boom.
Total housing inventory registered at the end of September 2024 was 1.39 million units, up 1.5 percent from August and 23.0 percent from September 2023. Inventory hit a low in December 2023 when only 990,000 were available. Unsold inventory continued to rise in 2024. In September, it sat at a 4.3-month supply at the current sales pace, which was up from 3.4 months in September 2023.
The median price of existing homes for all housing types in September was $404,500, up 3.0 percent from September 2023 when the median price was $392,700. All four U.S. regions saw price increases. Home prices remain high in periods of low inventory, even if demand softens. The median home sale price dropped slightly from June’s all-time high but still marked the highest median on record for the month of September, according to the National Association of REALTORS®.
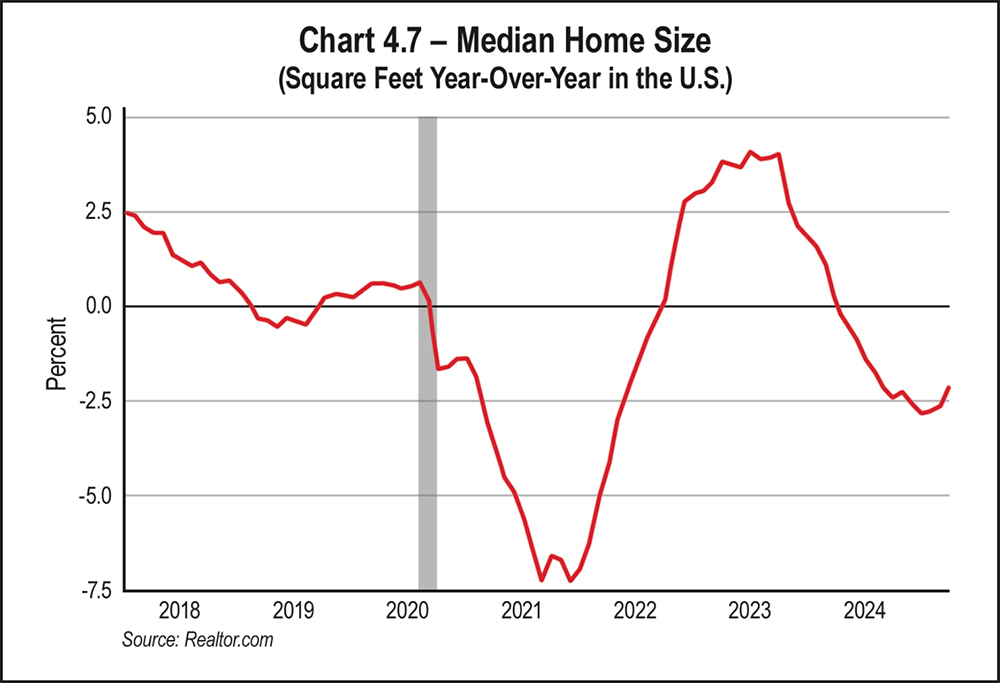
The median home size peaked in 2015 at 2,467 square feet and has slowly declined over the past decade in general, although it has fluctuated from a low of 1,770 square feet in January 2022. In October 2024, median home size was 1,835 square feet. See Chart 4.7, Median Home Size.
It’s interesting to note that in 1980, the median size of a new home in the U.S. was 1,595 square feet, while in 2018, the median size of newly constructed homes was 2,386 square feet. New builds are shrinking again with median square footage at 2,140 in the first quarter of 2024, down from a median of 2,256 square feet for newly built homes in the first quarter of 2023.
Many factors can account for shrinking home sizes, such as the availability of land to build on, the high costs of construction, and smaller family size. In a tough market, builders are building smaller, more affordable homes simply to bring more buyers into the market. These lower priced new homes were a major factor in 2024’s leveling off of listing prices. In the first quarter of 2024, construction of townhouses increased by 45 percent compared to the first quarter of 2023.
per year between 2045 and 2054, based on CBO projections.
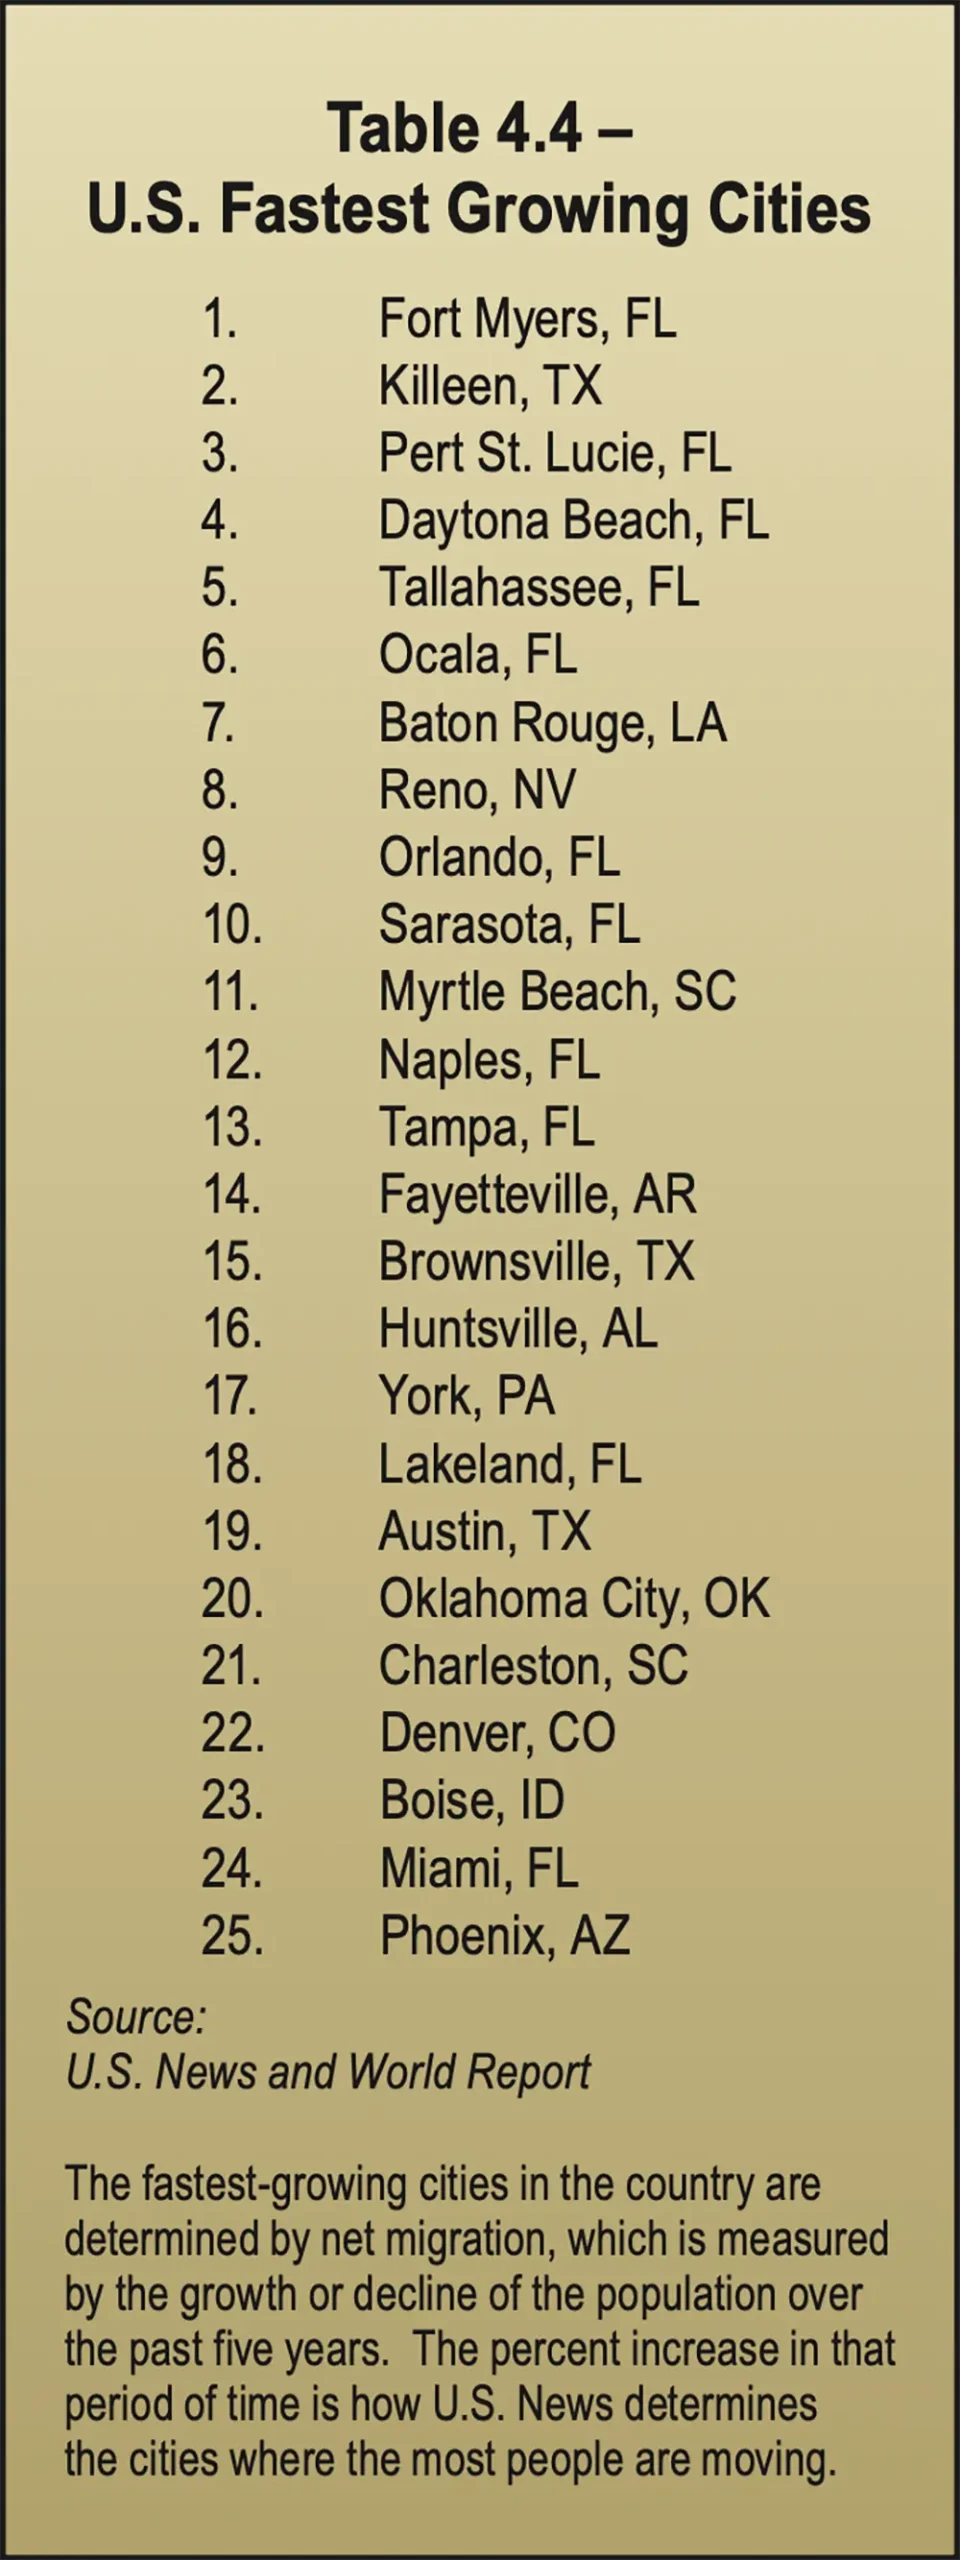
Urban areas lost population to outmigration in 2020 and 2021 as families moved to suburbs seeking more space. The trend reversed over the past few years as more people are moving from one urban area to another. However, the rising costs of housing in popular, high-growth areas has seen many potential homebuyers moving to smaller adjacent markets where housing is more affordable.
Topping U.S. News and World Report’s list of fastest-growing cities in 2024 is Fort Meyers, Fla., followed by Kileen, Texas. Eleven of the list’s top 25 cities are in Florida, while three are in Texas. Many of the fast-growing cities are in the South, continuing the trend of recent years. See Table 4.4 on the opposite page, U.S. Fastest Growing Cities.
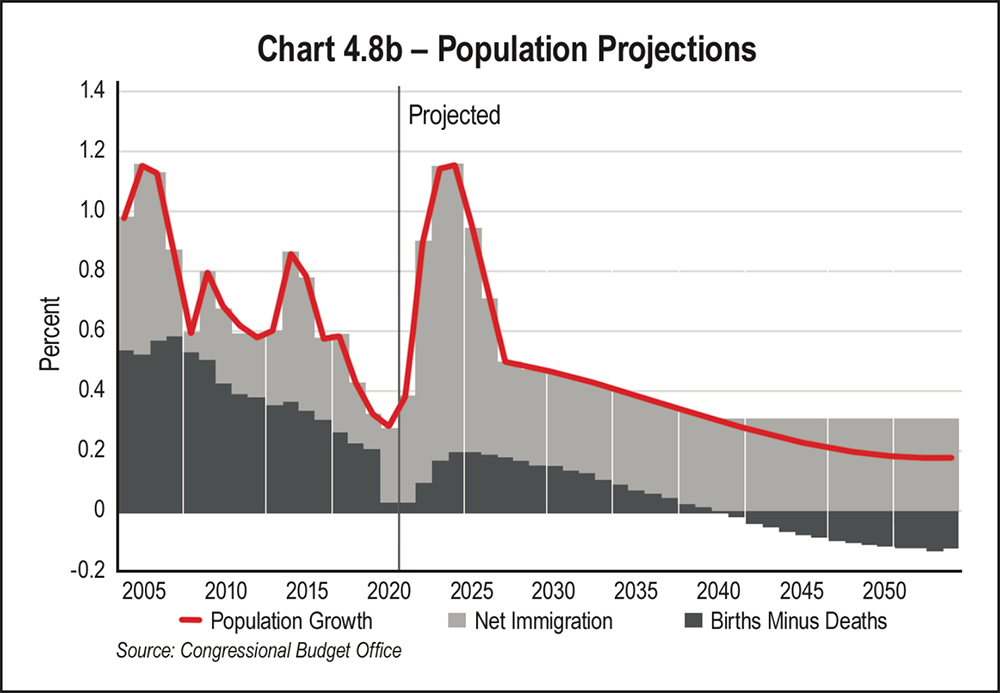
The CBO made upward revisions to its net immigration numbers from 2024 to 2026, which mostly boosted the size and growth of the working-age population (25 to 54 years old). The agency also reduced downward the projected fertility numbers from 1.75 to 1.70 births per woman. The mortality rates for people 65 or older over the first two decades of the projection period was revised downward due to fewer deaths from COVID-19 in that age group than previously projected.
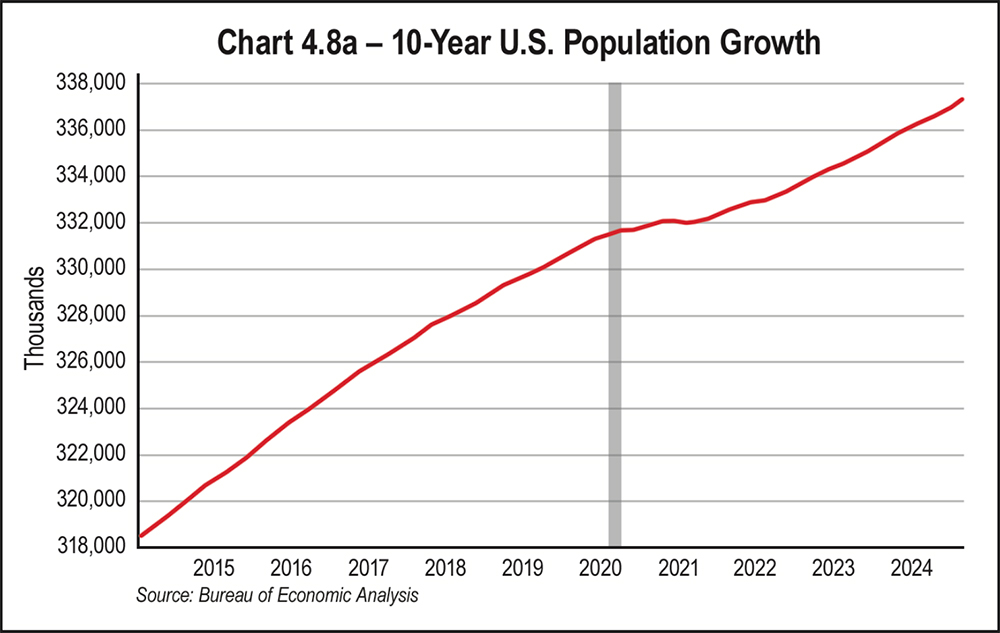
Overall population growth should slow over the next 30 years from an average of 0.6 percent per year between 2024 and 2034 to 0.2 percent per year between 2045 and 2054, based on CBO projections. In their projections, net immigration will increasingly drive population growth and, in fact, will account for all population growth beginning in 2040. Projected birth rates will not be high enough for a generation to replace itself; thus, population growth will rely on immigration from other countries.
The CBO notes that its projections of the rates of fertility, mortality, and net immigration are highly uncertain. Small differences between CBO’s projections of those rates and the actual outcomes could compound over many years and significantly change demographic outcomes.
Census Bureau data demonstrates significant growth in diversity. Non-Hispanic white individuals made up 59 percent of the population in 2024, down from 76 percent in 1990. Meanwhile, the Hispanic population grew to 19 percent, while multiracial and Asian populations experienced the fastest growth.
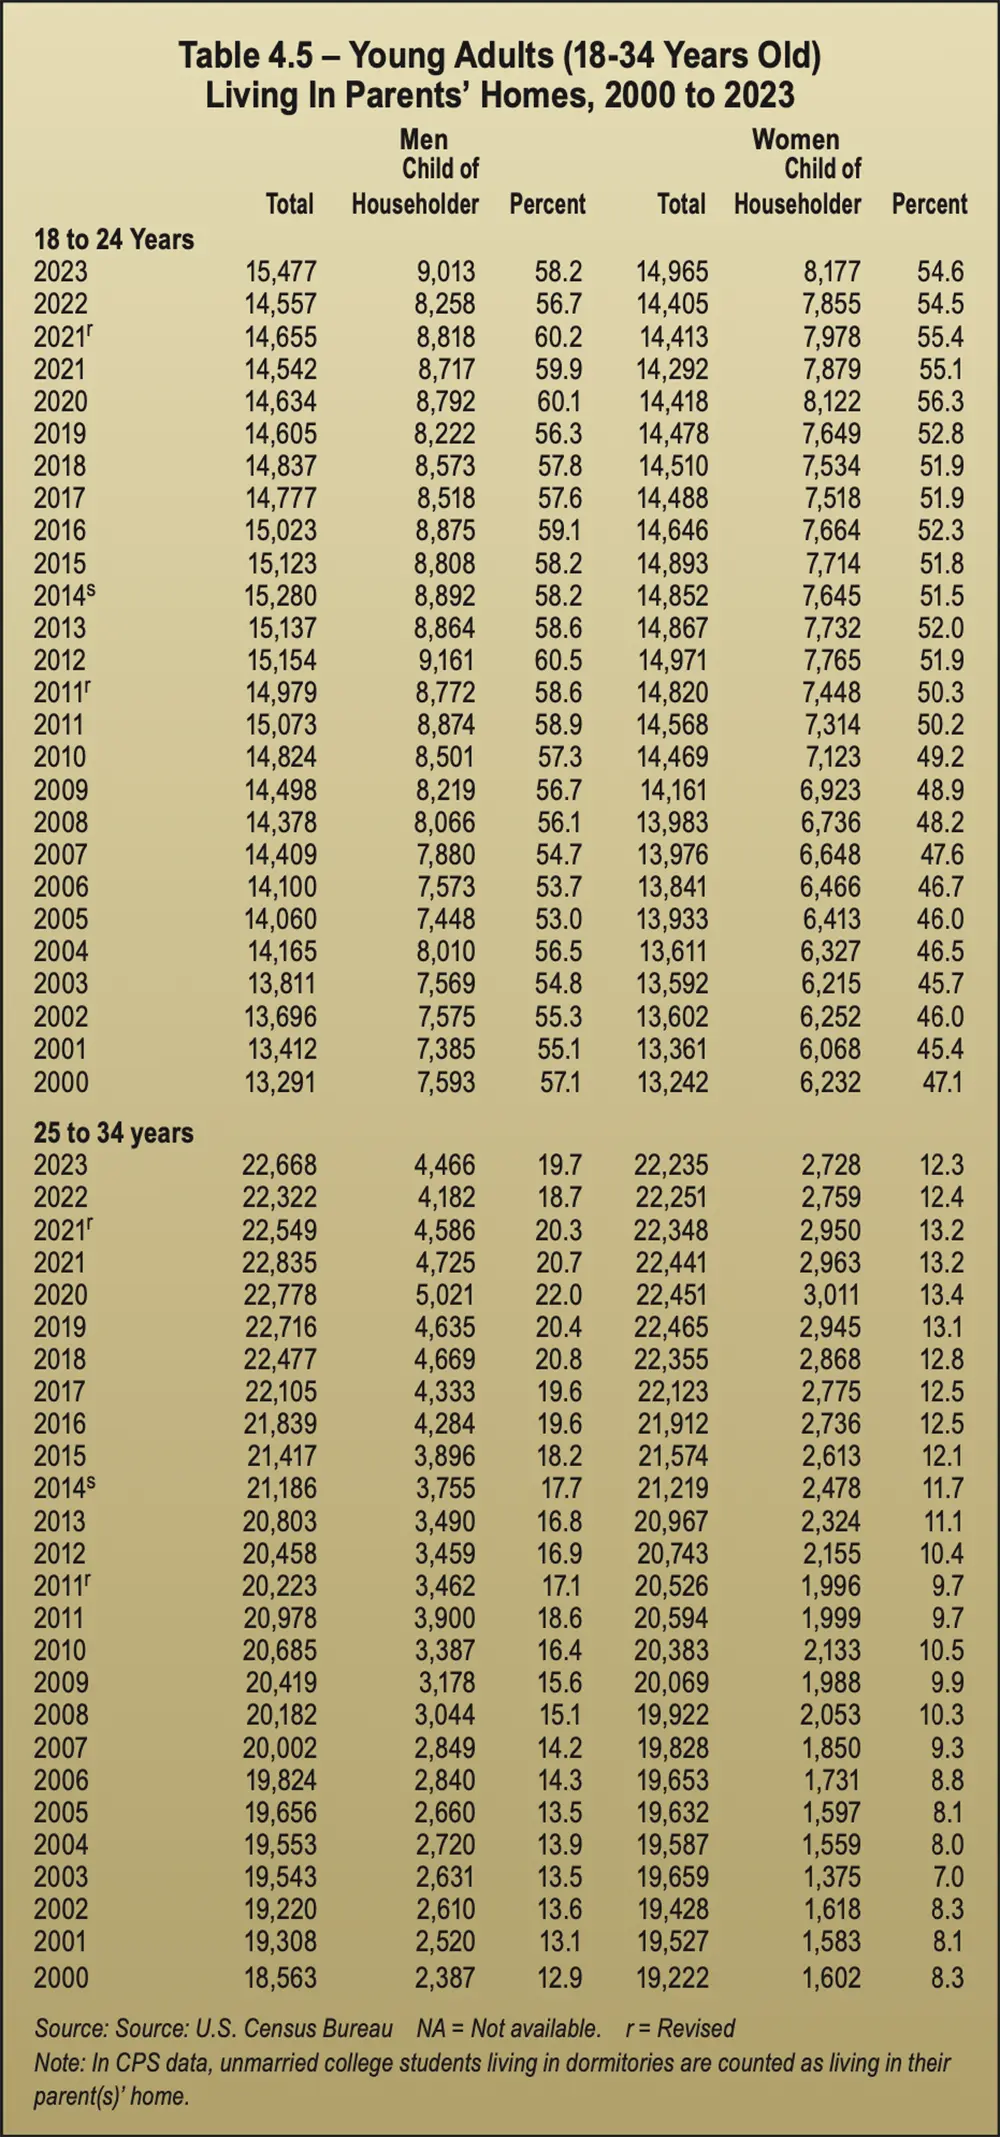
Another demographic shift that’s been on the rise is young adults living in the homes of one or both parents. There were 7.68 million Americans aged 25 to 34 living at home in 2021, representing an 87.4 percent increase over the past two decades. This figure does not account for children living in their parental home with a spouse or child, but it does count college students living in dormitories. See Table 4.5, Young Adults Living In Parents’ Homes.
The numbers rose during the pandemic years as work was halted and young adults were displaced. The trend slacked off somewhat in 2022, but the numbers began rising again in 2023 as inflation and lack of affordable housing drove many young Americans back to their parents’ homes. This displacement may create the need to store items from a previous household and should affect self-storage demand.
The number of men living with parents has outpaced the number of women each year. Surprisingly, the numbers of both men and women aged 25 to 34 who live with parents has been consistently higher than those age 18 to 24 years.
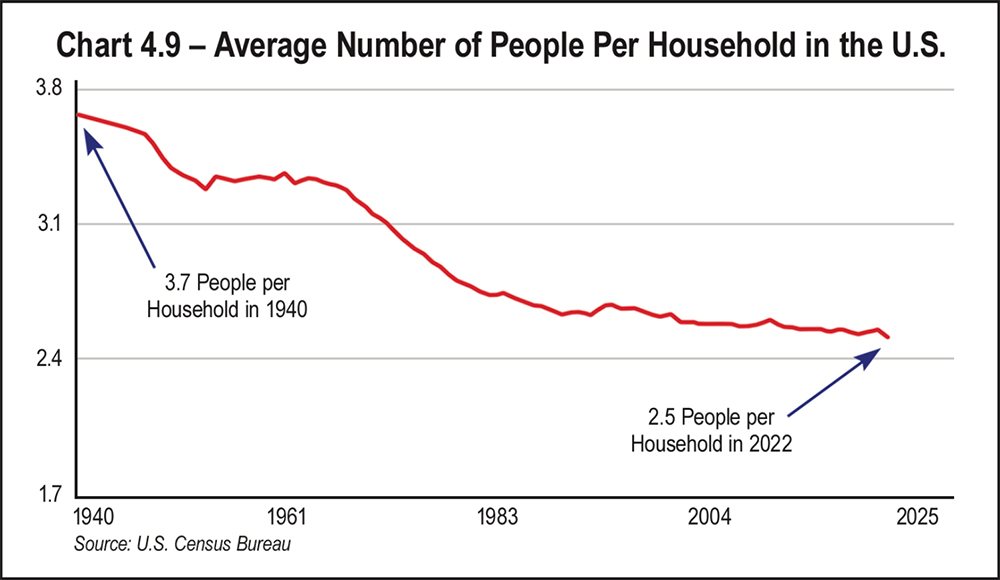
Even with adult children more likely to live at home, the average number of people per household has declined steadily. In 2022, the average household size was 2.5 people compared to 3.7 people in 1940. This could contribute to the trend toward a shrinking median home size in square feet. See Chart 4.9, Average Number of People Per Household in the U.S.
Decreasing household size can be attributed to lower birth rates and people waiting longer to get married and/or to have children. However, with migrants becoming an increasingly higher percentage of our population, this trend could reverse as housing shortages may necessitate more people sharing a home. In addition, some migrant cultures that are adding to the U.S. population traditionally enjoy having larger families.
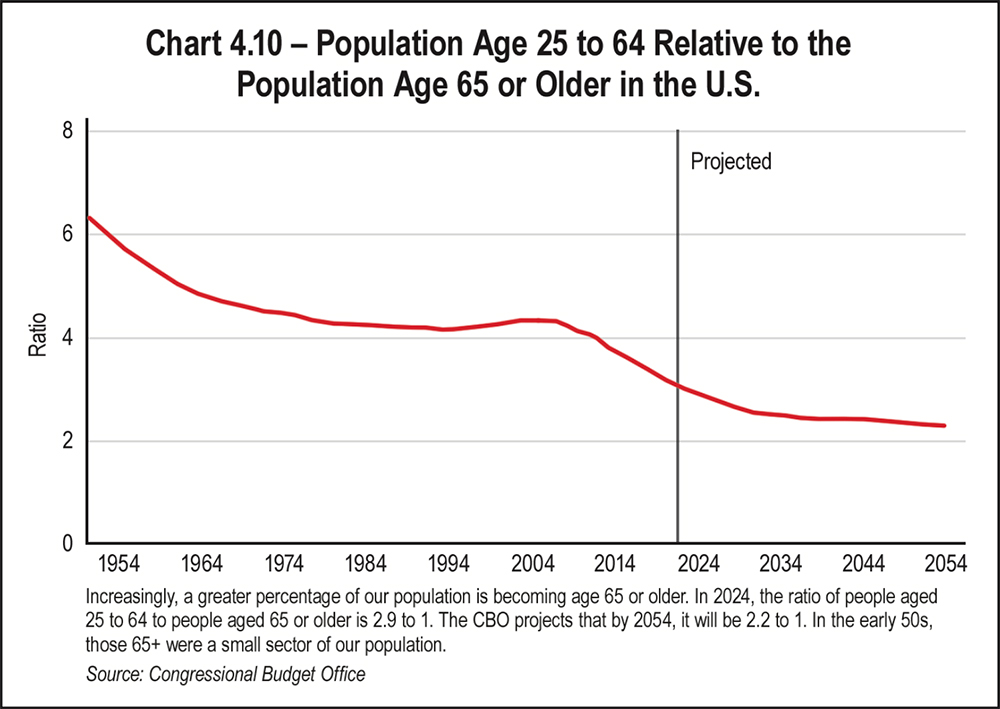
In 2024, Census data showed that the population continues to age, with 18 percent of people now aged 65 or older. This trend affects health care, housing, and labor markets. The percentage of children younger than 18 has declined to 22 percent of the population.
In 2024, the ratio of people ages 25 to 64 to people 65 and older was 2.9 to 1, but the CBO projects that by 2054, it will be 2.2 to 1. This is significant because most of our workforce falls in the 25 to 64 age range. See Chart 4.10.
In the 1950s, people 65 or older were a small segment of the population. Families included more children, and the life expectancy for older Americans was lower. Both trends have reversed. In 1950, life expectancy in the U.S. was 68 years. In 2024, the life expectancy for Americans was between 78.7 and 82.2 years, depending on which agency made the projections.
If the Fed reaches its goal and inflation abates, real GDP growth should rise slightly above 2 percent on a quarterly annualized basis by the end of 2025. Although the CBO’s projections call for a growth rate of 2.1, economic surprises such as the many we’ve experienced over the past five years could affect that forecast.
The Conference Board Leading Economic Index® (LEI), a composite index that looks at early indicators of where the economy is heading, reported declines of key indicators in the third quarter of 2024. This signals uncertainty for 2025. Therefore, the board predicts only moderate growth in early 2025.
Consumer spending should cool as families become increasingly constrained by debt. Consumers will spend more cautiously and with more price sensitivity. Unemployment is projected to reach 4.5 percent this year, which may also affect spending. The good news is that most agencies are forecasting relief on inflated prices and high interest rates. Relief in either of these areas could put more money in the pockets of consumers, and given recent trends, they are more likely to spend it than to save it.
Economic and demographic trends will have an immense impact on self-storage demand in 2025 and beyond. An aging population can mean more seniors moving to care facilities or moving in with their adult children. The trend to move to urban areas where living space is smaller will increase demand in these cities. And the availability of remote work may see more people moving to Sun Belt states if earning a living is not dependent on location.
Lastly, the anticipated soft landing of the economy will affect demand as consumers get relief from financial pressures, allowing them to buy a new home or to begin remodeling projects. In addition, a lower cost of capital may reignite plans for development, facility expansions, or improvements that have been on the back burner.


very self-storage customer and every self-storage owner-operator have one thing in common: space. They want it; we rent it.
Units are so similar from one facility to the next that customers tend to differentiate them based on price alone. That’s why price is the most important factor when customers rent space, as highlighted in Chart 5.1 below.
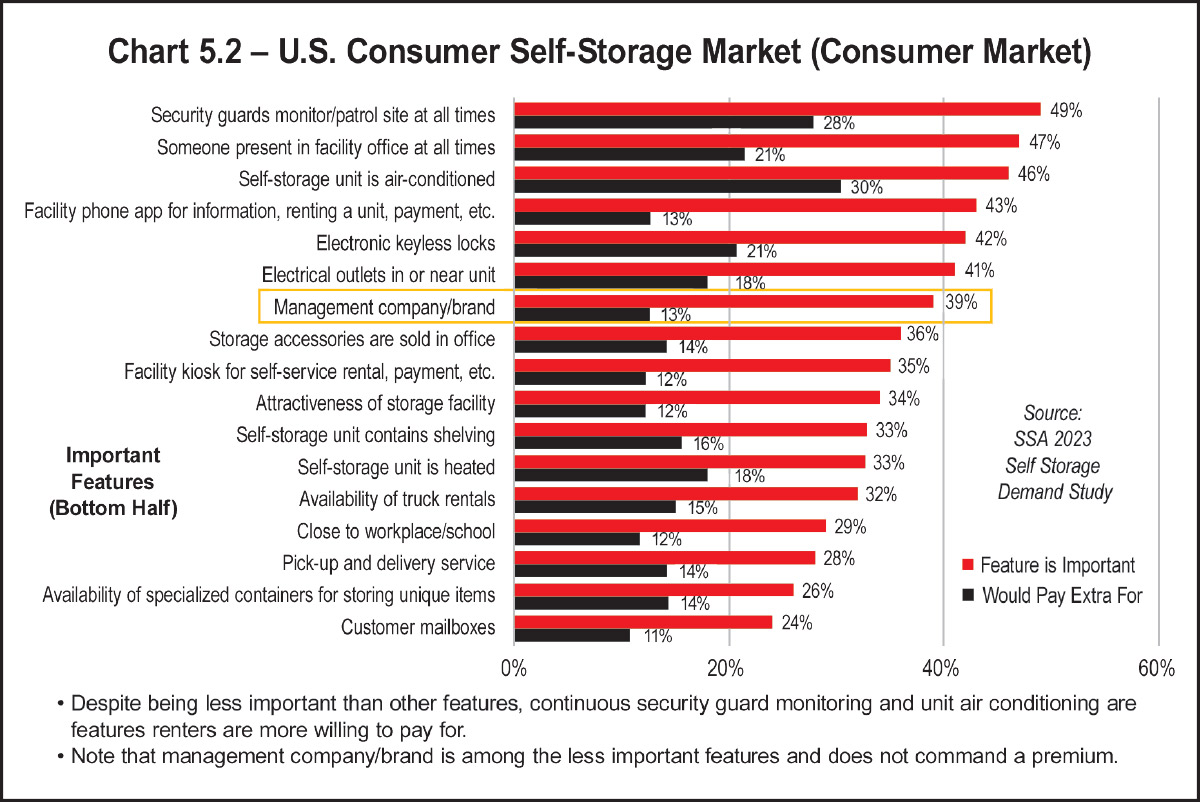
Further emphasizing the point that one space seems like every other, in the consumer’s eye, is the poor showing of “brand” as a reason to rent, as shown in Chart 5.2.
One customer trait made clear by the data is that the self-storage renter is very price sensitive. REIT and large operators’ pricing strategies have likely increased consumer price sensitivity. In the last two years, many consumers have rented at a low move-in rate, only to see their rent increased significantly soon thereafter. As described in Section 8 on rental rates, this practice led to an increase in consumer complaints, focusing more attention than ever on self-storage rental rates.
“We can expect rate increases to be much more competitive than in the last decade,” said Brett Copper, president of Copper Storage Management. In other words, it will be harder to raise rates because the consumer is less likely to tolerate it. Therefore, revenue management may not be as significant a source of increased revenue as it has been in the past.
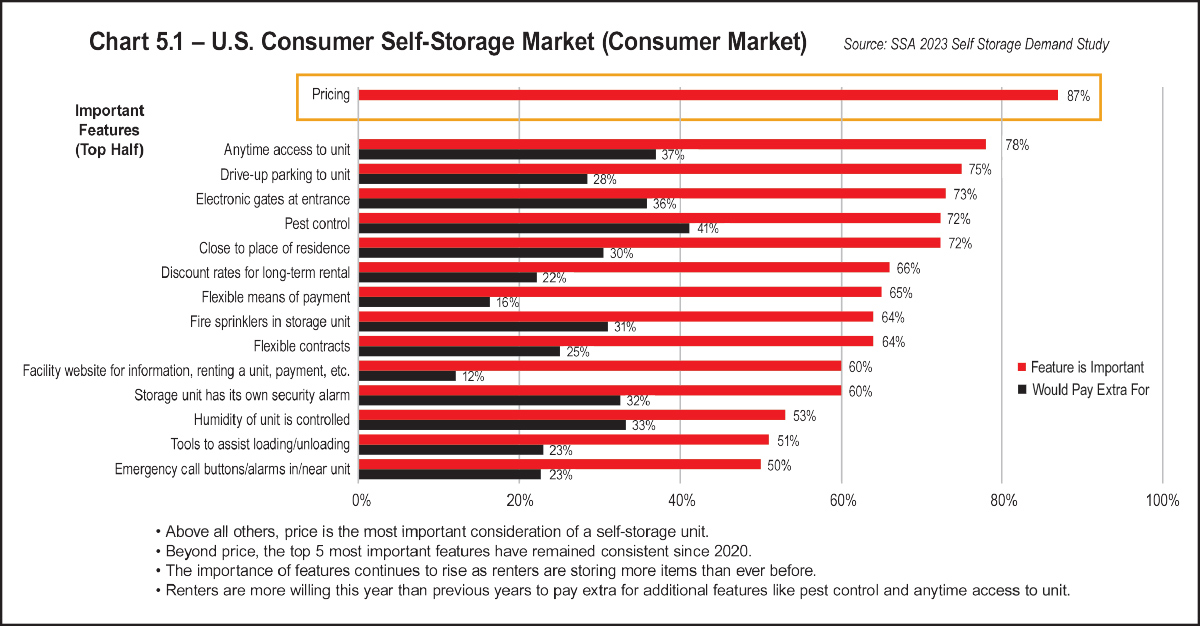
Today’s Amazon-trained consumer is more demanding than self-storage tenants of the past. Price has long been the leading factor when prospective tenants make a rental decision. However, today’s consumer is more concerned than yesterday’s, with the service and features that go with the price, including the convenience of up-to-date technology.
Therefore, you need a customer experience strategy that goes beyond price. You have to go far above bare bones expectations to attract and keep today’s consumer.
For many tenants and prospects, self-storage is more than a convenience. It is part of how they manage their lives, especially when they are in transition. This reflects growth and maturity of the industry in the eye of the American consumer. Self-storage is not just a luxury; it is a necessity and a convenient tool to manage life changes.
One source of customer data is the Self Storage Association’s 2023 Self Storage Demand Study. To produce the 2023 Self Storage Demand Study, 11,000 households were contacted and 2,371 were surveyed, along with 645 businesses.
- The economy is less predictable,
- The housing market is in a slump,
- Home prices and mortgage rates are higher than people are used to, and
- Elections and new administrations add uncertainty to the business climate and to people’s personal finances.
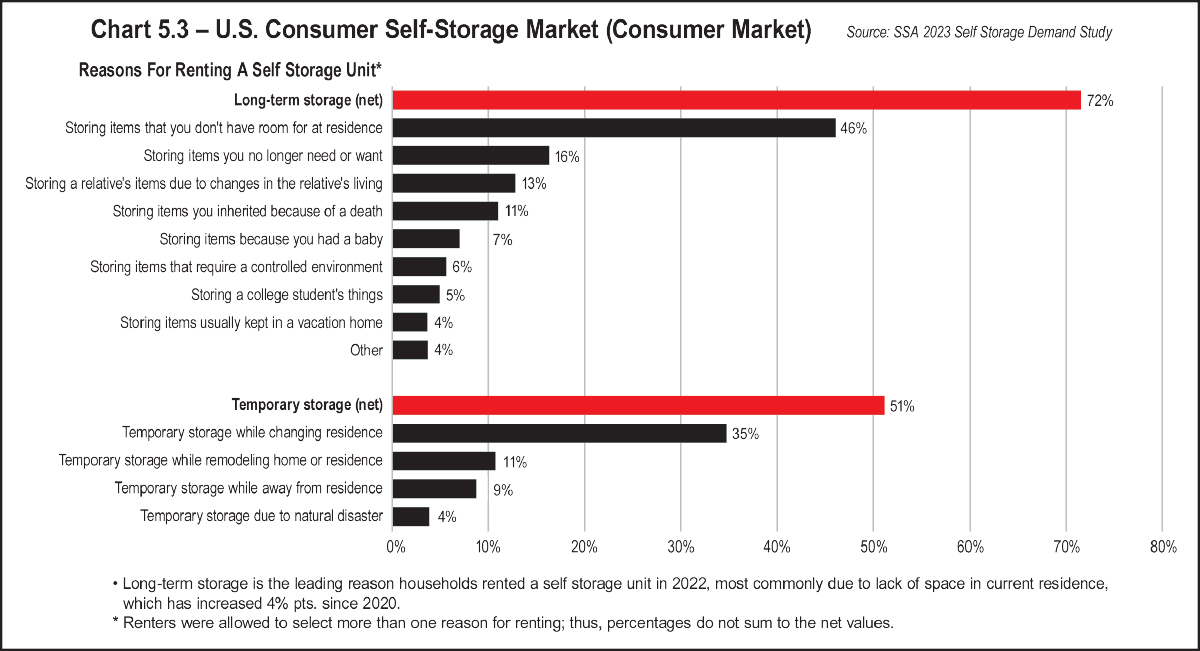
Expanding on the data, reasons to rent space are further elaborated in Chart 5.3. There is a wide variety of motivators for the American consumer renting space. Increasingly, people rent because they don’t have enough room in their homes or apartments, and they can’t move because of high mortgage rates and home prices.
People store for stressful reasons, so make it easy and pleasant to rent space, offering superior customer experience and convenience, including the technology today’s consumer is used to having at their fingertips.
Chart 5.3 parses self-storage demand differently, breaking down why people store into long-term and short-term needs. Predictably, moving is at the top of the list of short-term needs for storage. Remodeling is the reason 11 percent of customers need short-term storage rentals.
“Other” was the remnant reason for renting self-storage for 4 percent of survey respondents. This component of demand may suggest that consumers are seeking specialized storage options such as RV and boat storage.
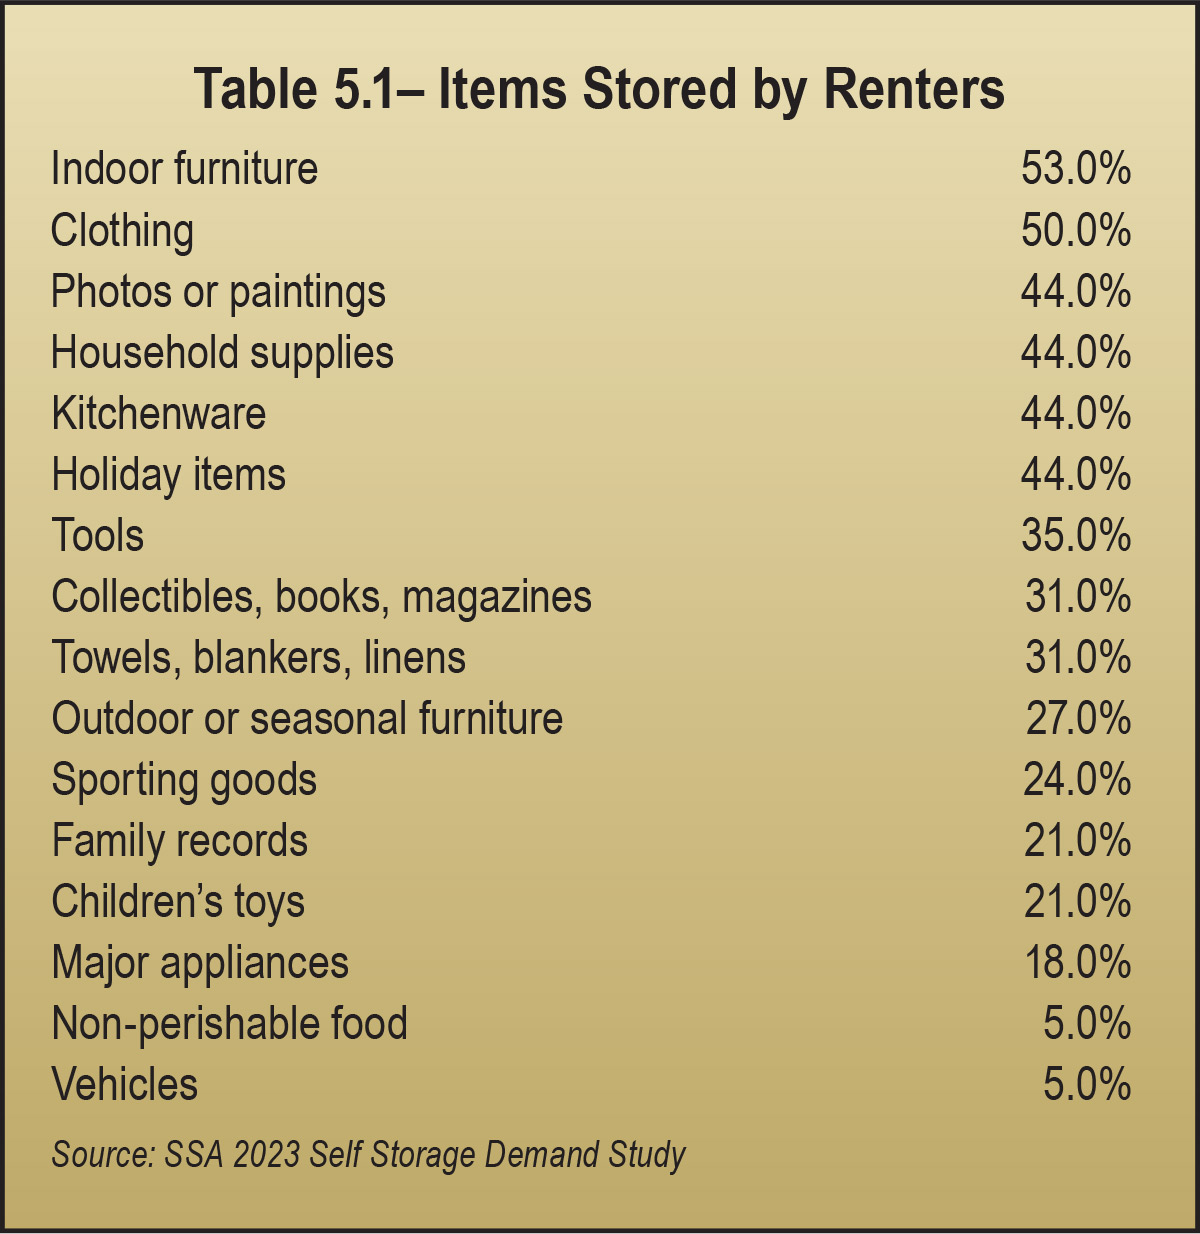
Knowing what customers store in their units can provide facilities with opportunities to make additional sales. For instance, tenants storing collectibles may appreciate a tenant protection plan to insure their investments. Alternatively, someone storing belongings in a non-climate-controlled unit may not realize that DampRid is a worthwhile expense in humid areas where excess moisture can be problematic.
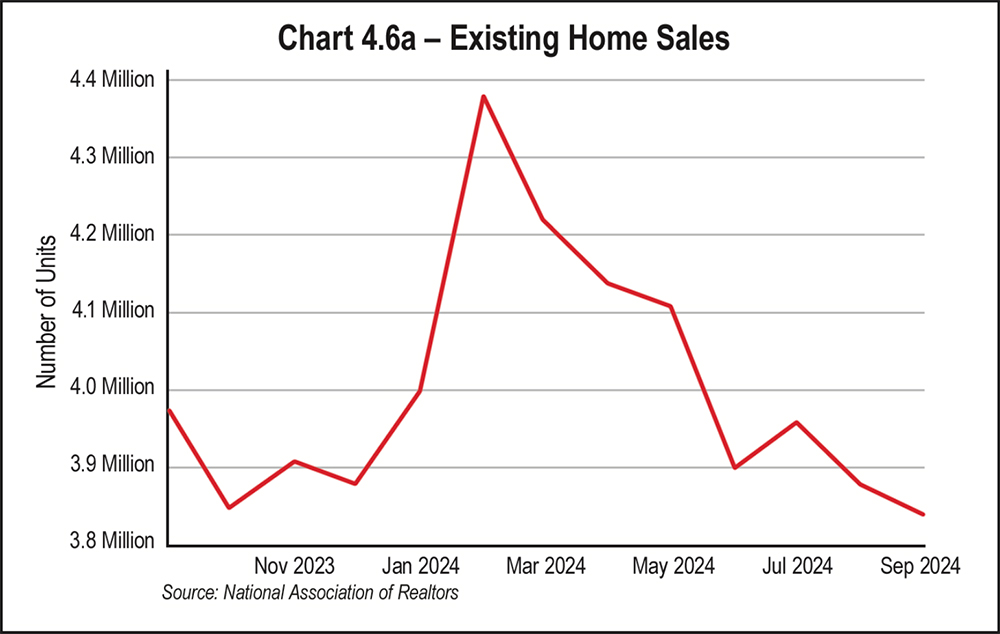
The housing market remained in a slump throughout 2024 because cuts in interest rates by the Fed were fewer and slower than hoped, according to the Yahoo! Finance article “Average rate on 30-year mortgage hits 7 percent after 5th straight increase, now highest level since May,” which was published on Jan. 16, 2025. Even though the Fed cut rates, mortgage rates continued to climb throughout 2024, ending the year north of 7 percent, after climbing for five months in a row.
In fact, 2024 was the worst year for sales of previously owned homes since 1995, according to the Yahoo! Finance, “Why a housing market ‘thaw’ never came in 2024,” which was published on Dec. 22, 2024.
Mortgage rates inching up adds hundreds to a household’s monthly payments, so the slump in national home sales that started in 2022 continues. Last year ended worse than the year before, which also broke the record for the worst year for sales of previously owned homes since 1995. That’s even worse than the Global Financial Crisis in 2008 (JVM Lending, “Worst year ever for home sales; that time I almost died,” Jay Voorhees, Dec. 30, 2024).
Why was it the worst year ever for home sales? Because of an imbalance between supply and demand, and price sensitivity:
- Home prices are high.
- Mortgage rates are high.
- Demand to buy houses is weak.
- There is limited inventory.
“A lot of people were surprised that home prices did not go down as mortgage rates went up. This showed us that the supply and demand imbalance was more powerful than the borrowing costs,” said Ali Wolf, chief economist at Zonda, the largest home construction data company.
Most people expected mortgage rates to go down when the Fed cut rates. They were sorely surprised. Wolf stated, “Historically, mortgage rates move in tandem with Fed rate changes. (Last) year, however, mortgage rates actually went up after the Fed cut rates. This is because investors ultimately drive mortgage rates, and they are taking in other economic data and policy proposals and allocating their funds accordingly.”
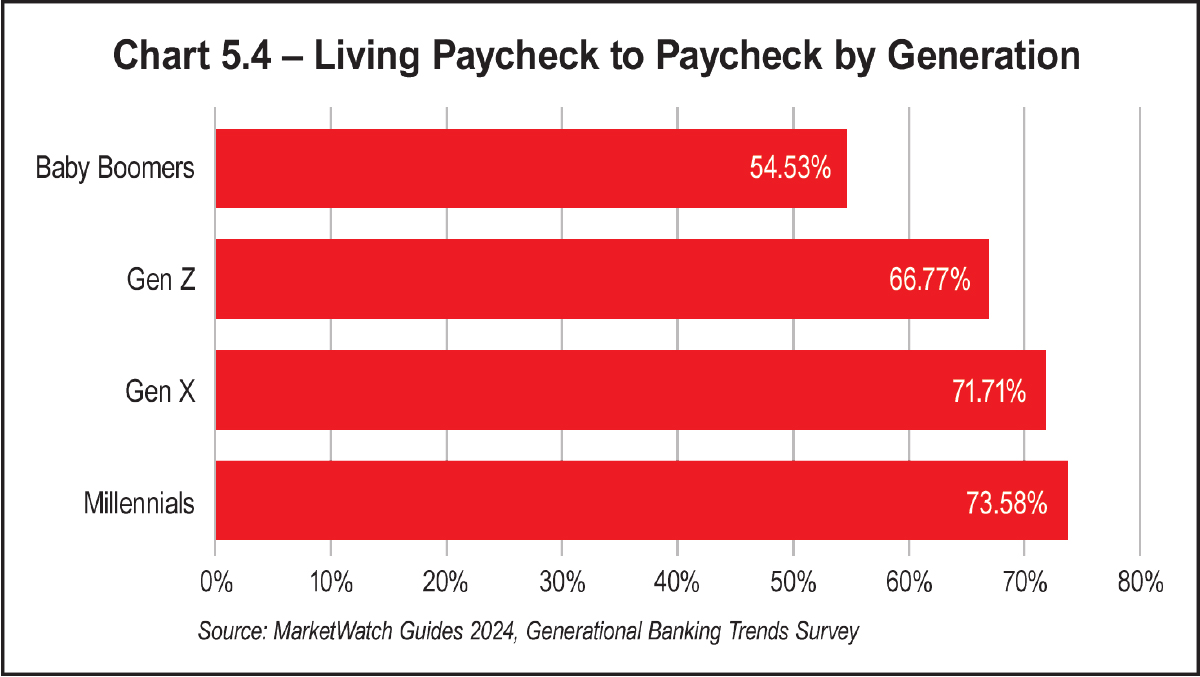
But consumers are not confused. They understand high prices, and they remain on the sidelines. In 2024, home prices reached new highs, and mortgage rates remained high, so prospective home buyers stayed put as the year drew to a close, continuing the waiting game. When it comes to buying a home, most consumers are budget-conscious, and current conditions do not entice them into the housing market. Economists, whose personal finances differ from many Americans who want to buy their first home, think consumers will accept conditions as the new norm and move ahead with home purchases. They don’t understand living paycheck to paycheck, a hand-to-mouth existence, which is how nearly two-thirds of Americans describe their personal finances, as shown in Chart 5.4.
Looking ahead, uncertainty emerges as a significant customer trait for prospective home buyers and self-storage renters. The Fed changed its “forward guidance” at the last meeting of 2024, reducing the number of rate cuts anticipated for 2025 from four to two. Both the Fed and investors continued to be concerned about inflation, and of course a new presidential administration creates its own uncertainty. The stock market does not like uncertainty, and neither do Americans who want to buy homes. In all likelihood, the housing market will remain in a slump until the future is easier to anticipate.
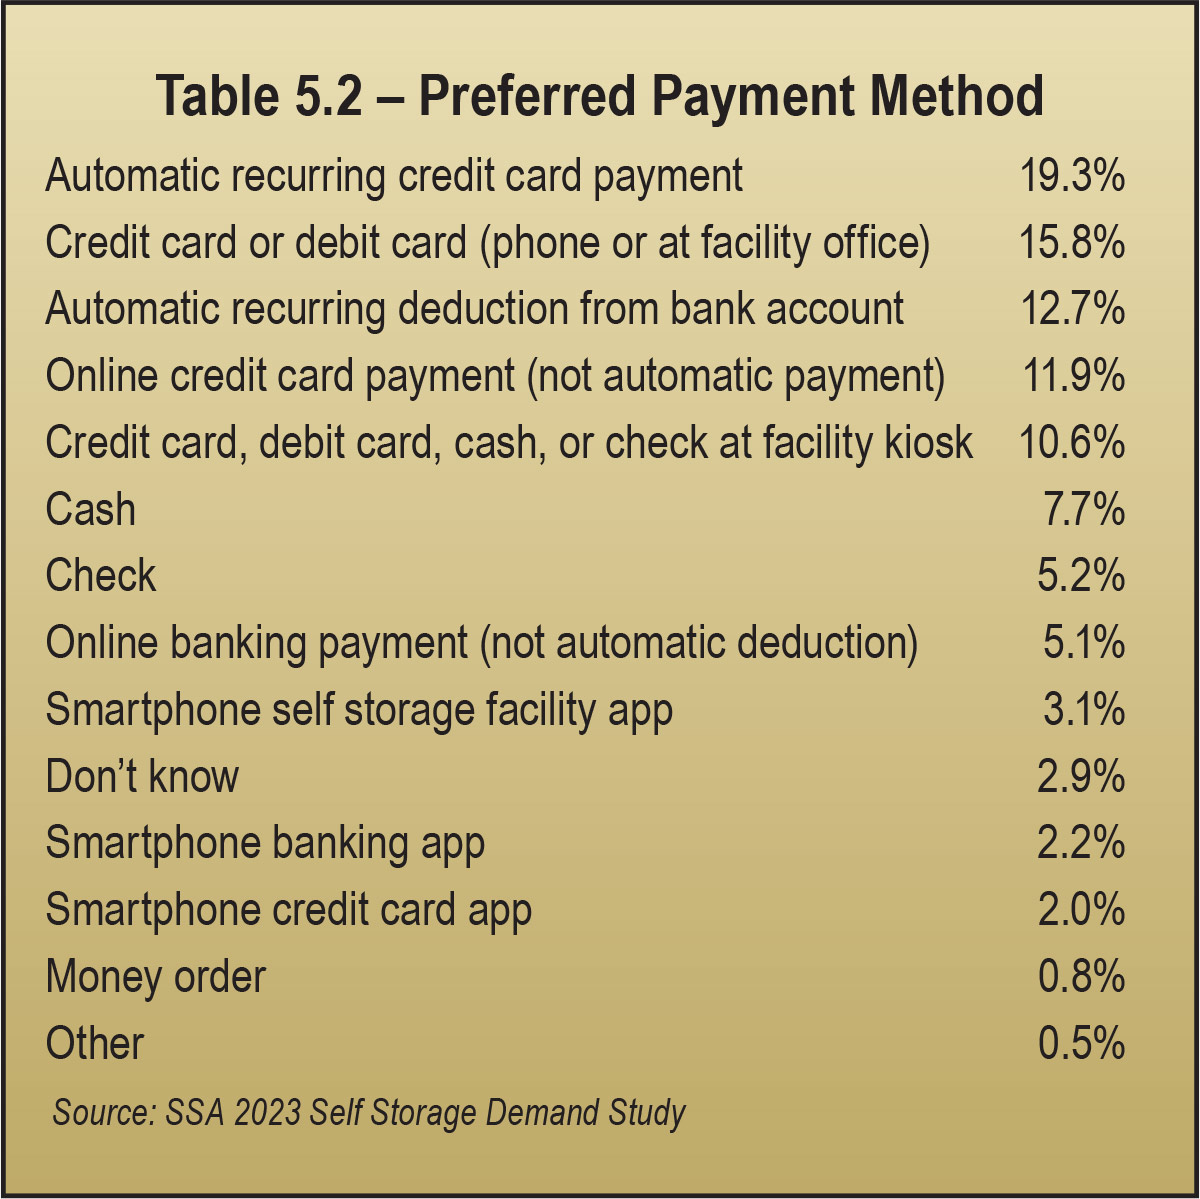
Flexibility sought by today’s self-storage customer is shown in the wide variety of features and benefits described in Charts 5.1, 5.2., and 5.3. A desire for flexibility is also evident in Table 5.2, which shows the multiple payment options tenants utilize by generation. Overall, all five generations prefer to pay rent through an automatic recurring credit card payment. Money orders are the least preferred payment option of all generations.
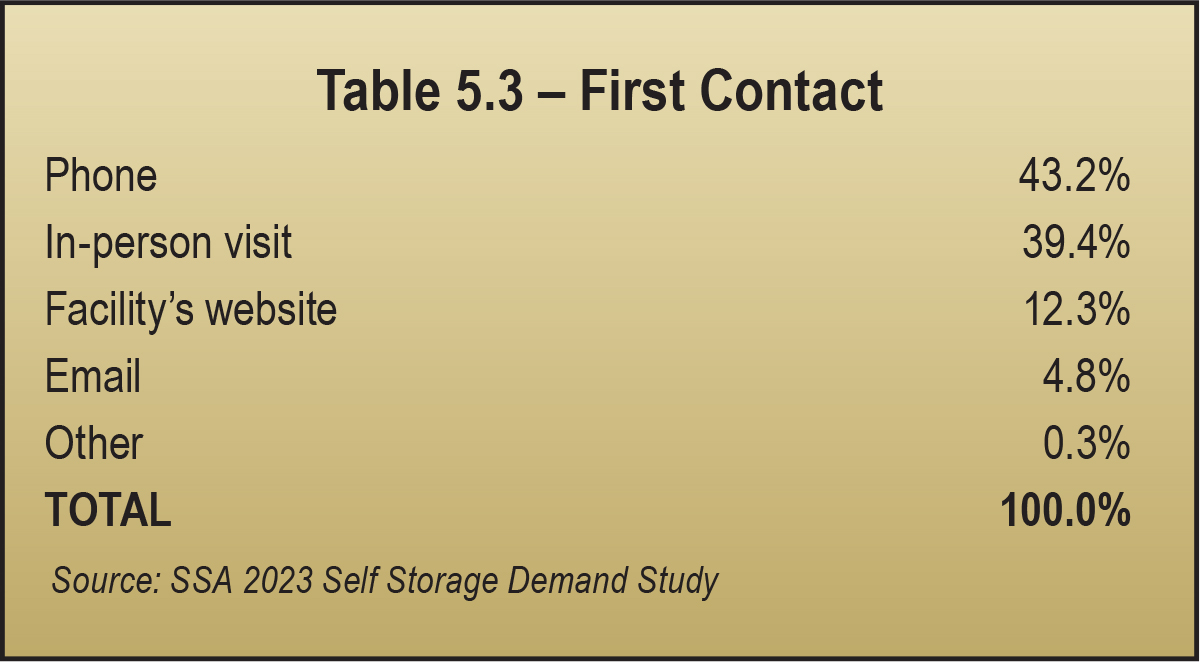
This same desire for flexibility is reflected in how customers first contact facilities. More than 43 percent still reach out via phone. Another 39.4 percent go directly to the property to obtain initial information. As for the 12.3 percent who made first contact through a facility’s website, they likely searched for “self-storage near me” beforehand. According to the SSA’s 2023 Self Storage Demand Study, 50.4 percent of customers search for self-storage on their smartphones. Furthermore, 26.2 percent search on a laptop, 18.5 percent search on a desktop PC, and 4.5 percent search on a tablet. See Table 5.3.
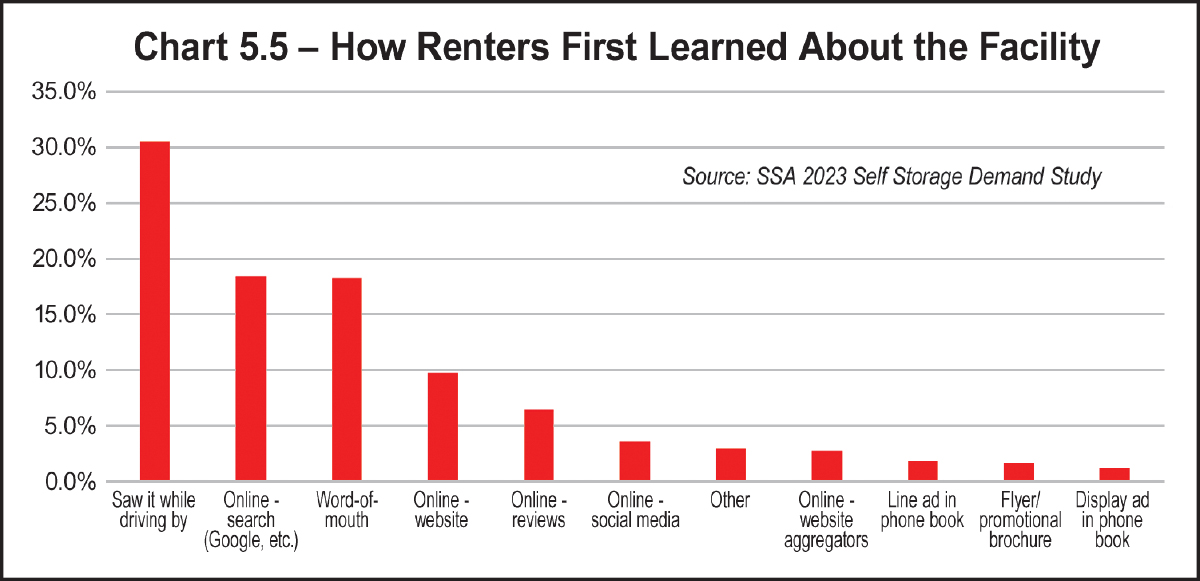
While customers may be more likely to contact you first by calling, they had to find you first. Where do they find you? While Chart 5.5 below shows that a strong online presence is critical, and positive word-of-mouth advertising is valuable, drive-by traffic still accounts for more than 30 percent of a facility’s leads. In addition to being visible online, online reputation is important. Prospects check out customer reviews and ratings when making rental decisions.
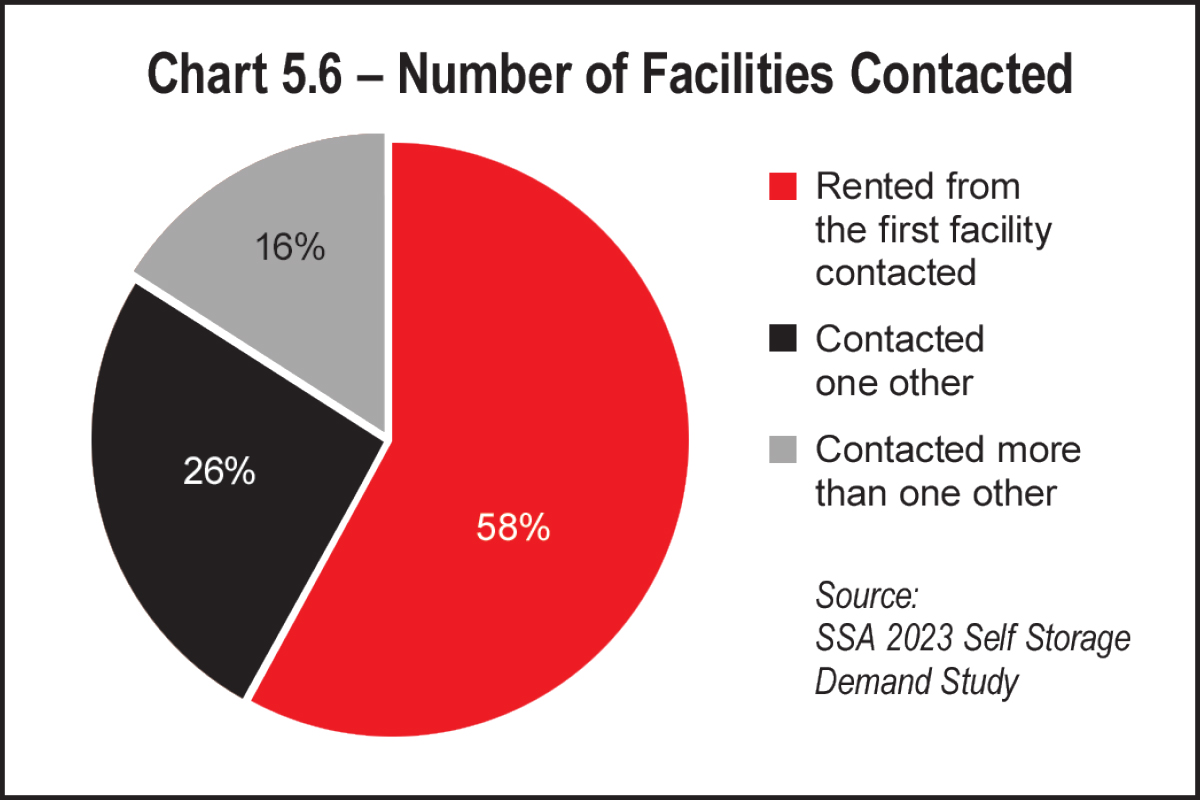
Reflecting further on first contact, there is another customer trait we can’t deny: Self-storage tenants are lazy shoppers, with 58 percent of them renting from the first facility they contact (See Chart 5.6). This statistic lends further credence to the argument that the consumer sees self-storage as a commodity: One space is the same as any other, so why not rent from the facility that answers your phone call. So, answer the phone!
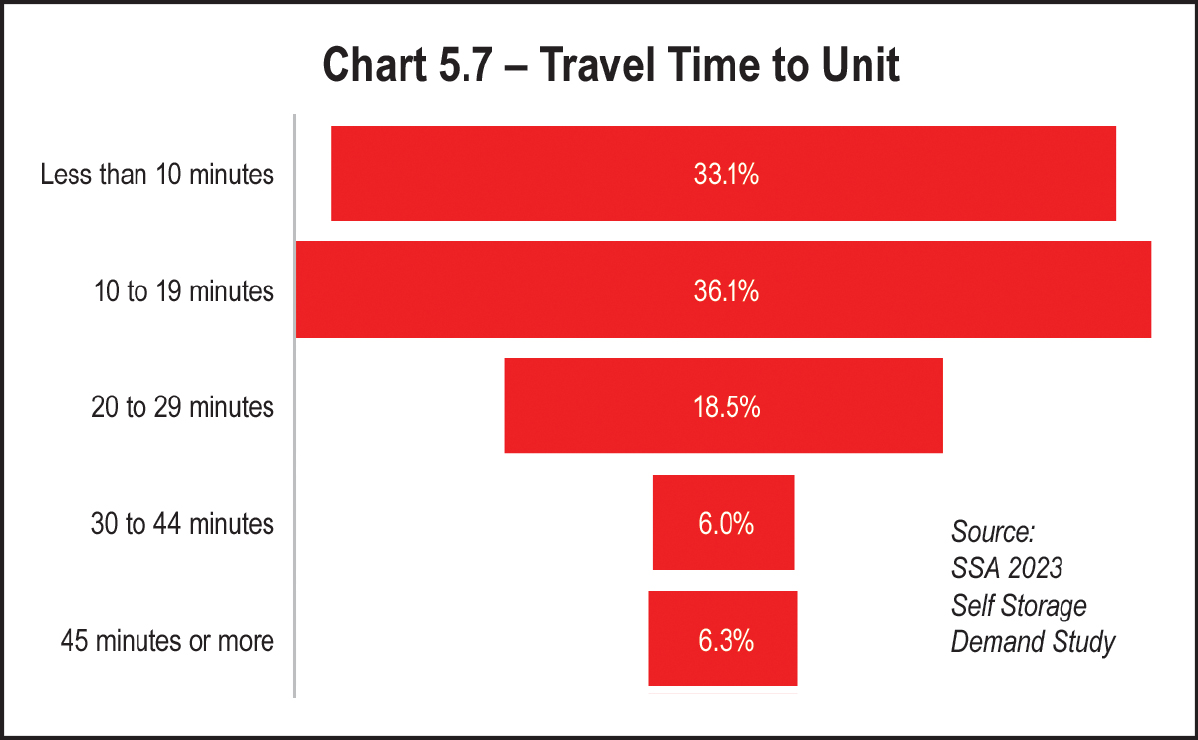
About 36 percent of customers are willing to drive 10 to 19 minutes. While 18.5 percent of customers would drive 20 to 29 minutes, 33.1 percent are only willing to drive less than 10 minutes. A total of 12.3 percent is willing to travel 30 minutes or longer to a storage facility.
As Copper puts it, “We have to completely re-think how we calculate demand and compare rental rates to competitors.” Clearly, people are more willing to drive farther to find a facility that meets their needs.
How do you attract prospective renters who are willing to drive farther? Copper says, “Accommodate these groups (especially younger renters) with competitive pricing, access to units, a strong website ‘storefront,’ and the ability to contact you or a call center within minutes.”
As an owner-operator, your challenge is to meet the Amazon-trained consumer’s demand for convenience while also providing personal touch and superior customer experience. As Copper puts it, “We need to be able to give the ‘on-site’ experience on our websites … (which are) our new retail store front!”
While they may be renting more per number of households than urban renters, rural renters pay lower self-storage rent. Also, facilities tend to be smaller. This means it is all the more important to keep expenses low while serving these customers, so your business is still profitable.
- They only “remember” you when they need space, even though they may have driven by your facility thousands of times.
- They put it on autopay and forget about it, grateful that they don’t have to clean out their garage.
- They have a hard time catching up on payments when they get behind, so maybe it’s better to cut a deal and get them to move out rather than auction their stuff.
- They don’t always leave reliable indicators that they are active-duty military, so be careful.
Our industry continues to be in the midst of a paradigm change regarding how to manage facilities. The traditional on-site staff management model is under ongoing scrutiny. Management is one of the expenses owner-operators can influence, and many are experimenting with remote and hybrid options. Any owner-operator who continues to invest in on-site staff is right to make high demands that their managers and assistant managers provide excellent customer service and pound the pavement to generate leads and referrals from local marketing efforts. (For more on local marketing, see Section 10.)
both worlds
INSIDE OR OUT.
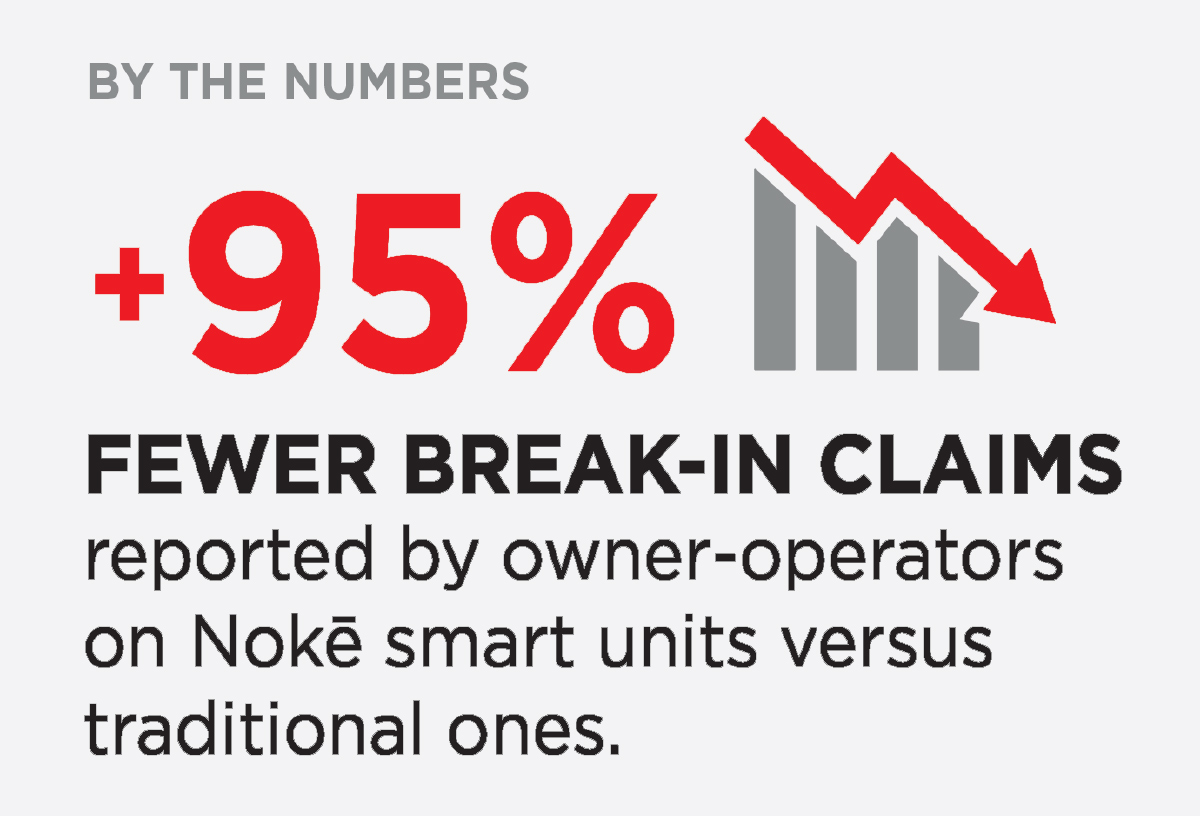
he self-storage industry is evolving rapidly. For years, smart security technologies were limited or unavailable, but now cutting-edge solutions are redefining how facilities operate. These advancements are raising the bar for security, offering real-time remote monitoring, automated access management, and streamlined operations. Integrating these tools into your storage facilities ensures a stronger security posture, improved tenant trust, and a significant boost in operational efficiency.
This section explores the security challenges facing self-storage owner-operators today, as well innovative technologies driving the future of self-storage and how smart technology improves and enhances security. From the latest generation doors, to smart locks for unit security, to advanced smart entry solutions, discover how modern systems are reshaping the industry and helping to dramatically mitigate security concerns. What follows highlights the state of self-storage security in 2024, as well as the future of self-storage, where technology and security converge to create smarter, safer, and more efficient storage environments.
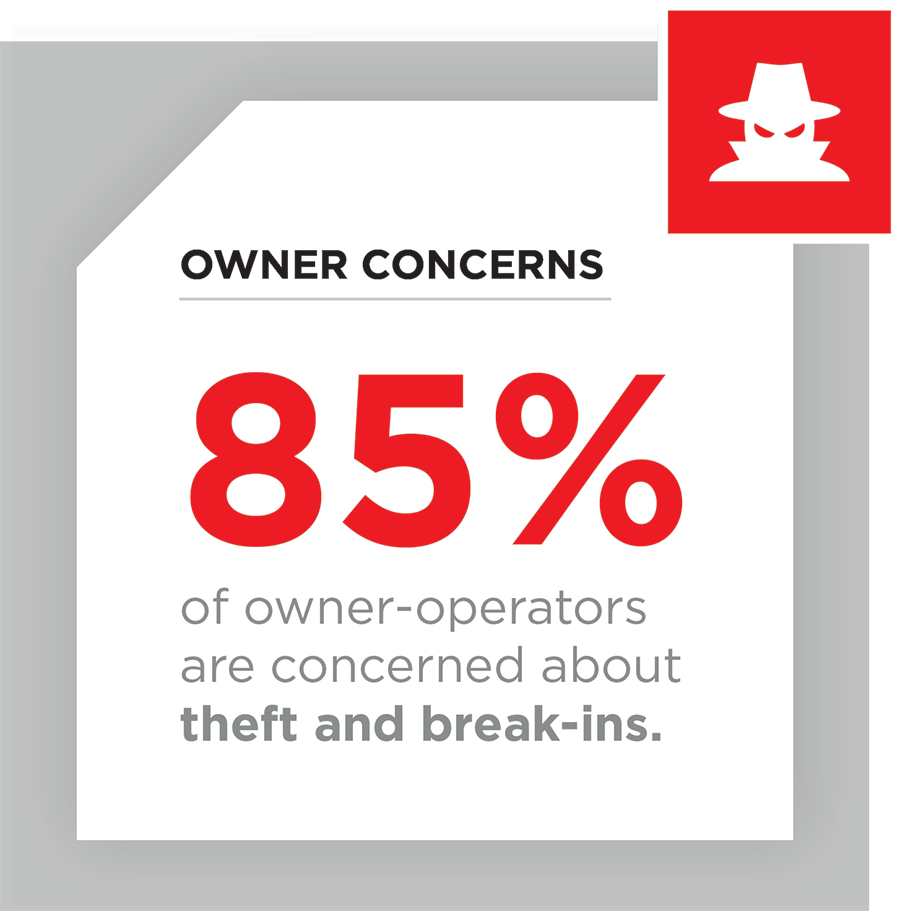
According to a recent self-storage industry survey conducted for MSM and Janus International, 85 percent of respondents felt that theft and break-ins were a primary concern in 2024.
What are the primary security challenges facing owner-operators today?
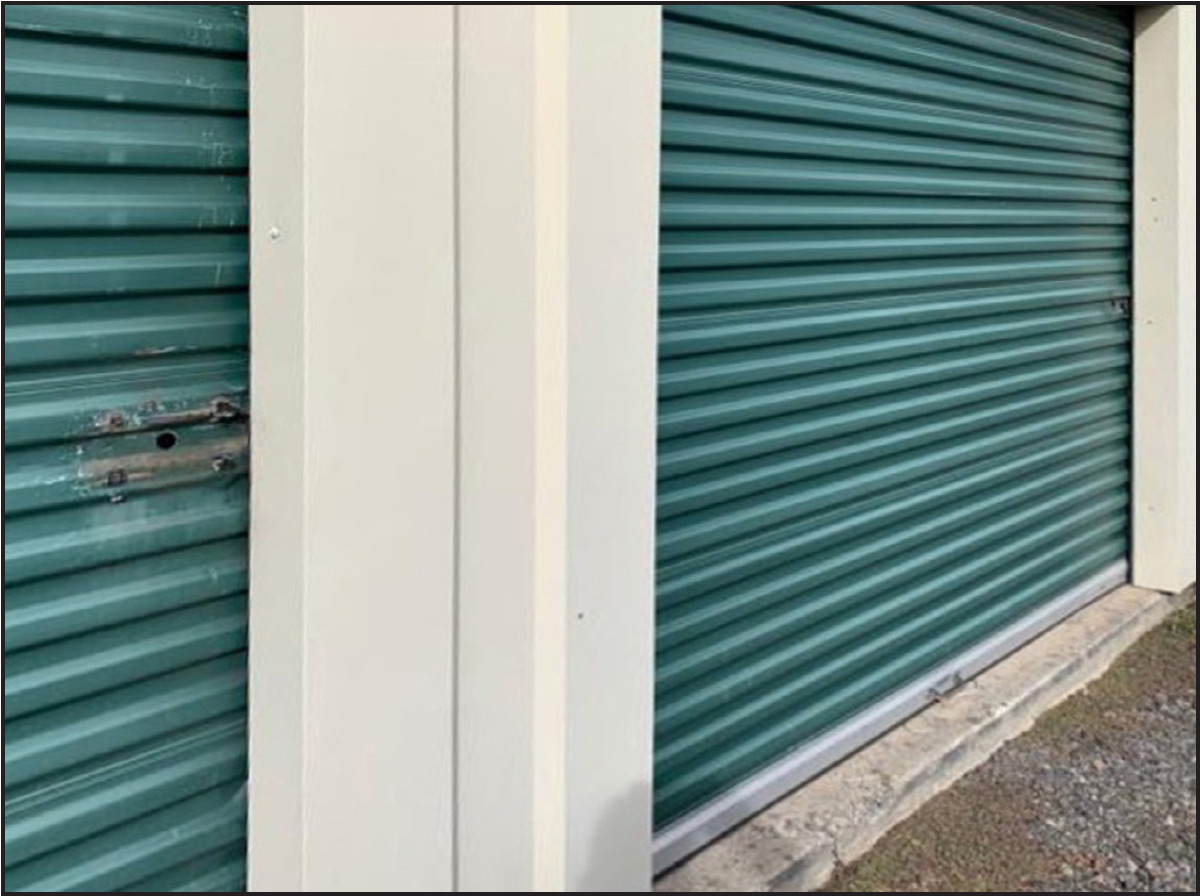
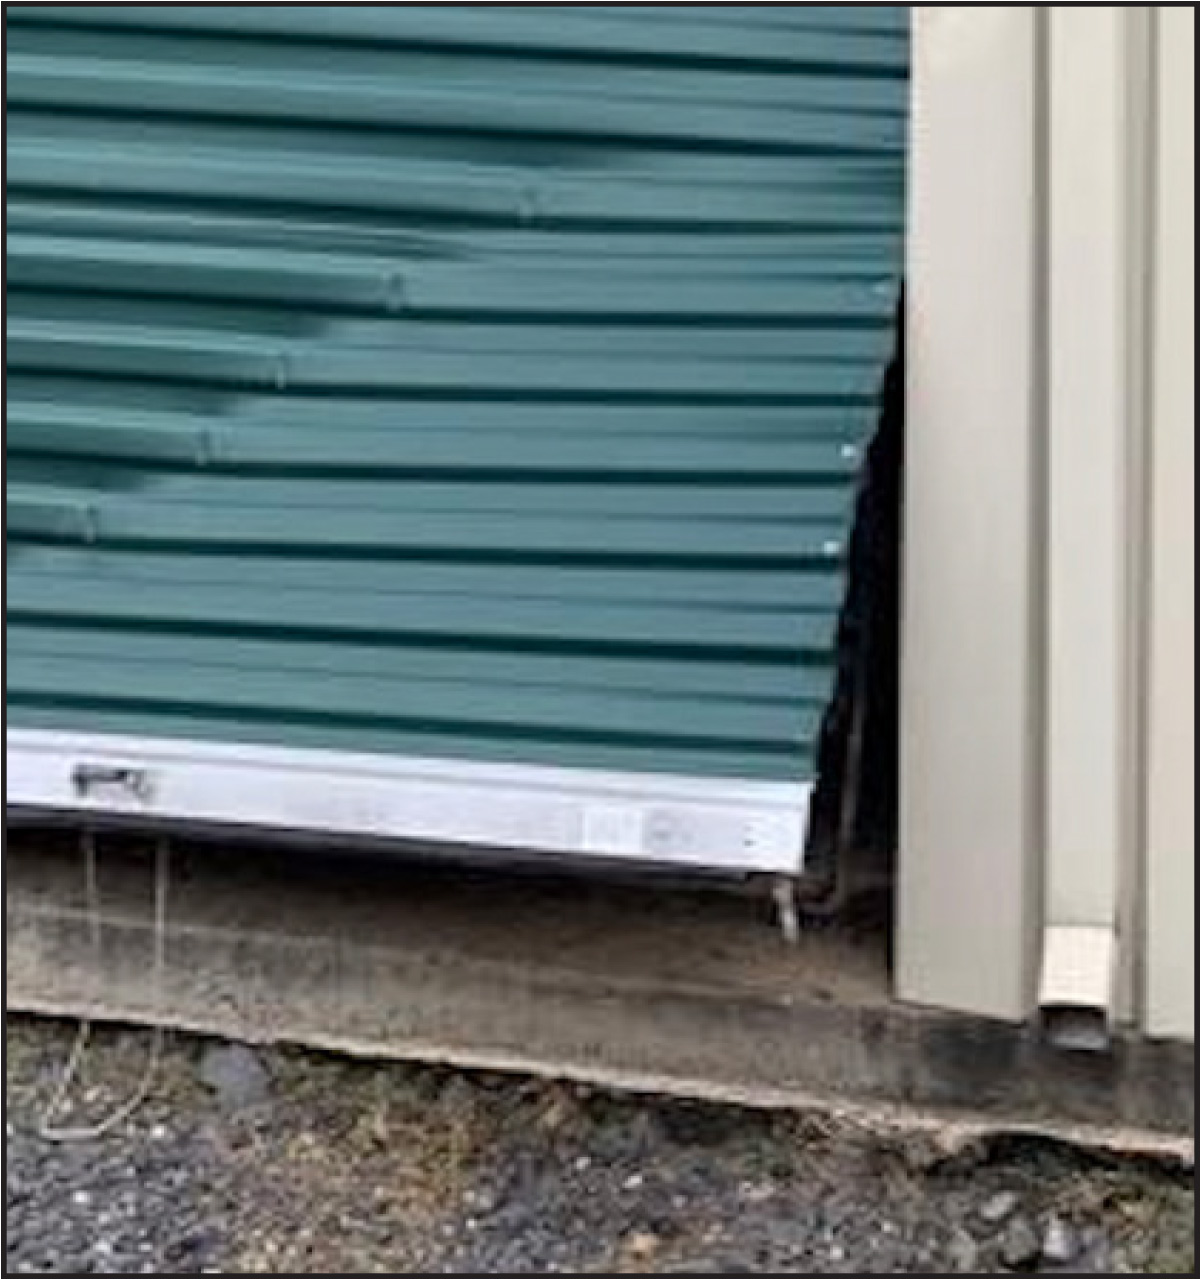
There are two camps of criminals presenting modern-day security challenges to self-storage. The first are thieves who use quick and simple tactics that require minimal skill. These typically include:
- Cutting latches and padlocks,
- Prying off latches,
- Unscrewing metal paneling on locks, and
- Climbing over unit walls and cutting through wire to access adjacent units.

- When managers are on site,
- Where cameras are located, and
- Where expensive items are stored.
They can use bolt cutters to quickly clean out a unit that is housing cars, motorcycles, or ATVs and then quickly attach a replacement padlock before anyone notices.
With each of these types of break-ins, the traditional security equipment we’ve grown accustomed to in self-storage (padlocks, security cameras, gates, and keypads) is no longer enough to deter the crime.
What makes self-storage properties so vulnerable?
There are five common reasons why some facilities are targeted for break-ins and other crimes.
- Trouble spots – Some states have higher rates of self-storage theft, with Colorado, Tennessee, Kentucky, Texas, and California ranking at the top.
- Soft targets – Many self-storage facilities are in industrial areas or on the outskirts of town, which make them easy targets for criminals who want to operate in locations where they won’t be noticed.
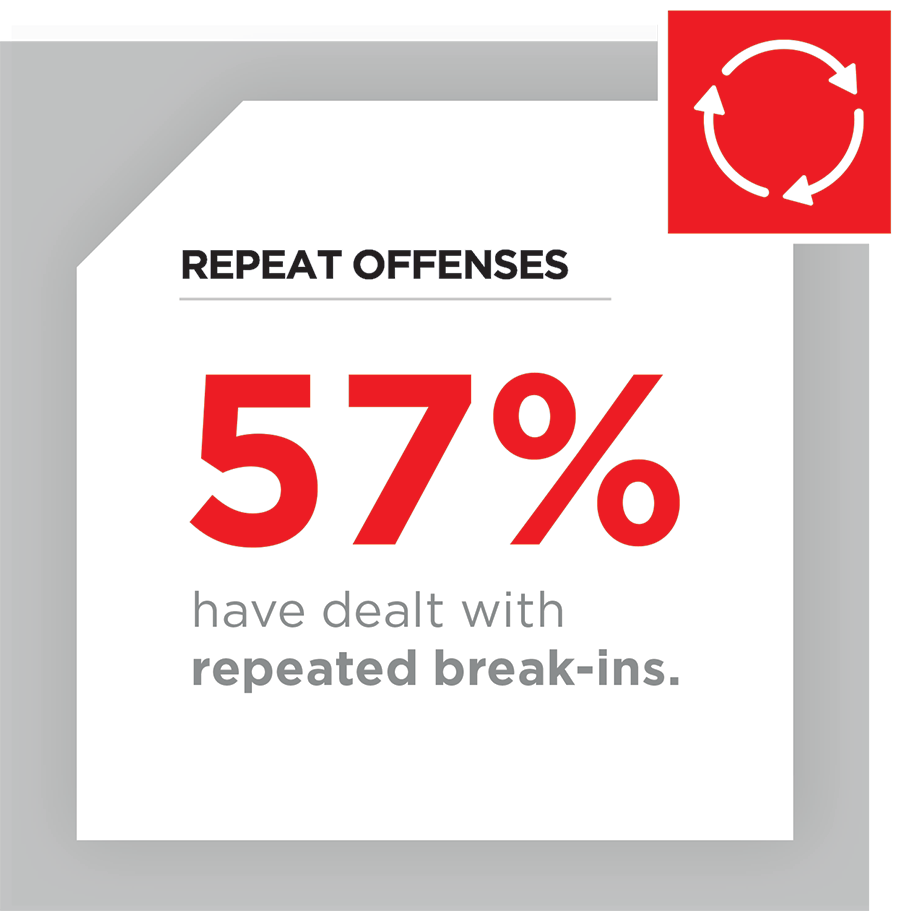
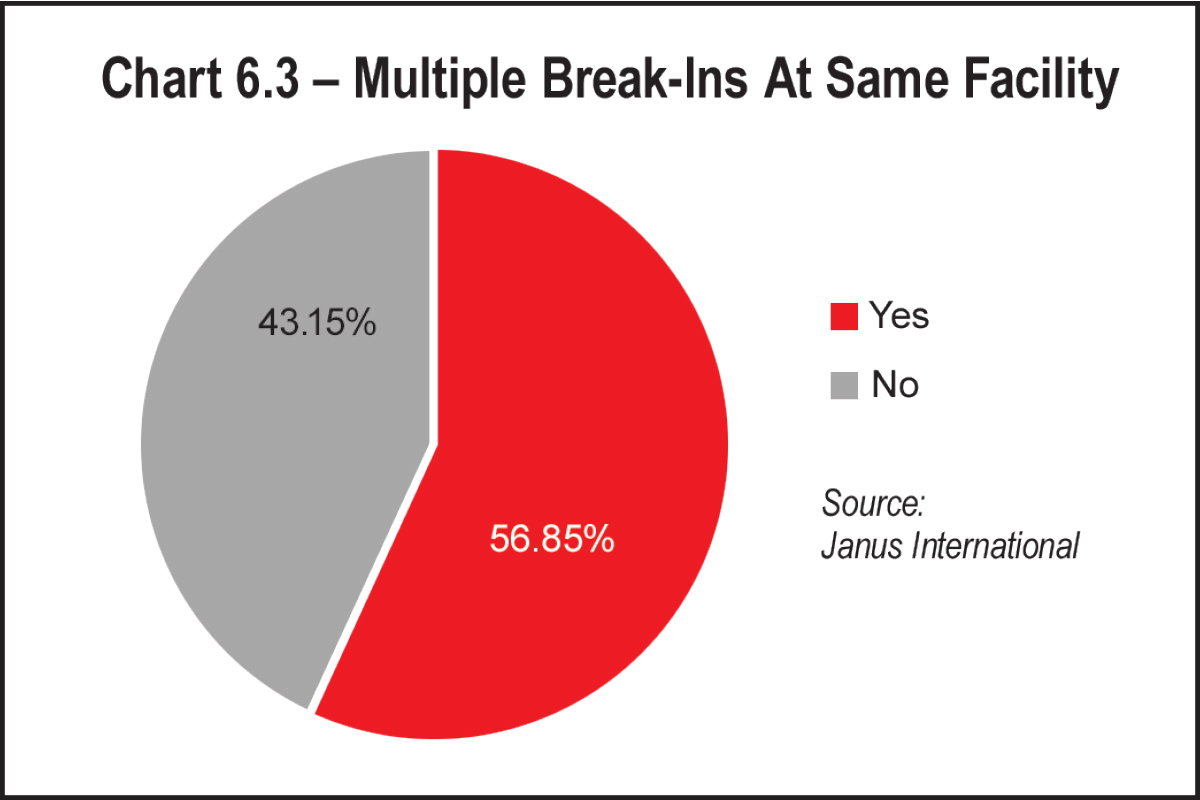
- Windows of opportunity – Many facilities provide 24-hour access to their tenants, which gives criminals more opportunities to case facilities during off hours. One trend that has been reported is criminals renting a unit so they can check out the facility to determine any security lapses on the property. Once they identify a weakness, they hit it hard multiple times, which is why many facilities (57 percent) report multiple break-ins.
- Lack of deterrent – In the big scheme of crime, theft is a lower priority for law enforcement, especially in larger urban areas dealing with a shortage of officers. This leads to many criminals not being arrested or sentences being light. When criminals aren’t afraid of prosecution, there’s no deterrent to stop.
- Lack of sophistication – The safety and security measures at many self-storage facilities haven’t kept up with the criminals in terms of sophistication; many owner-operators who opted to invest their capital in improvements like landscaping and office remodels have come to realize that it’s time to catch up on security as well.
An integrated smart technology solution—in particular, an integrated technology solution that includes industry leading smart locks on all unit doors—enables self-storage owner operators to mitigate the risk of theft and break-ins while also improving visibility to on-site activity.
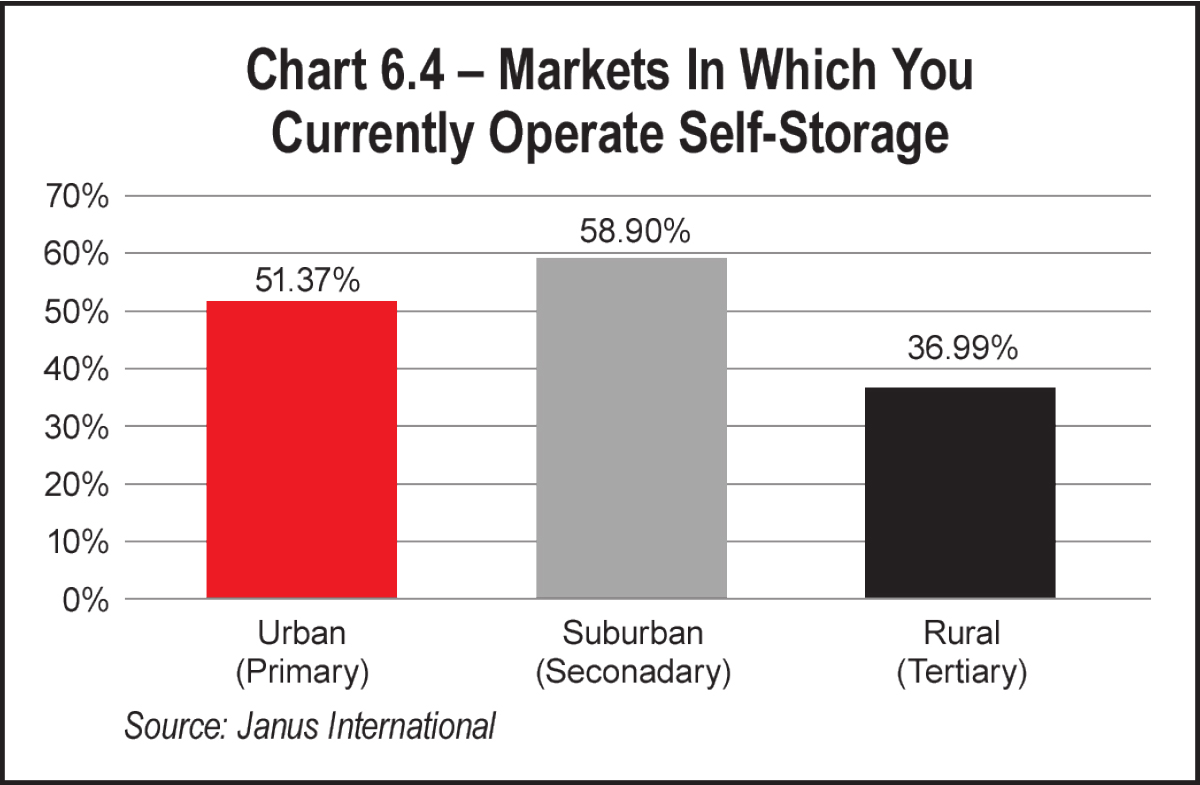
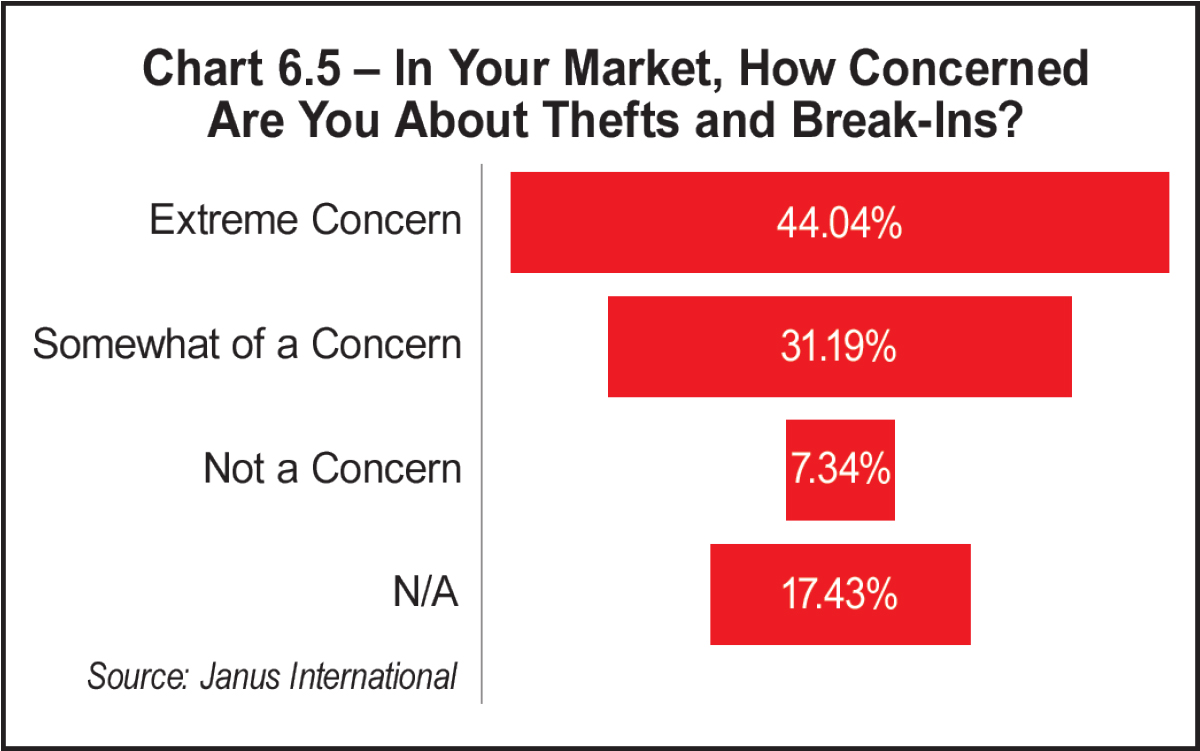
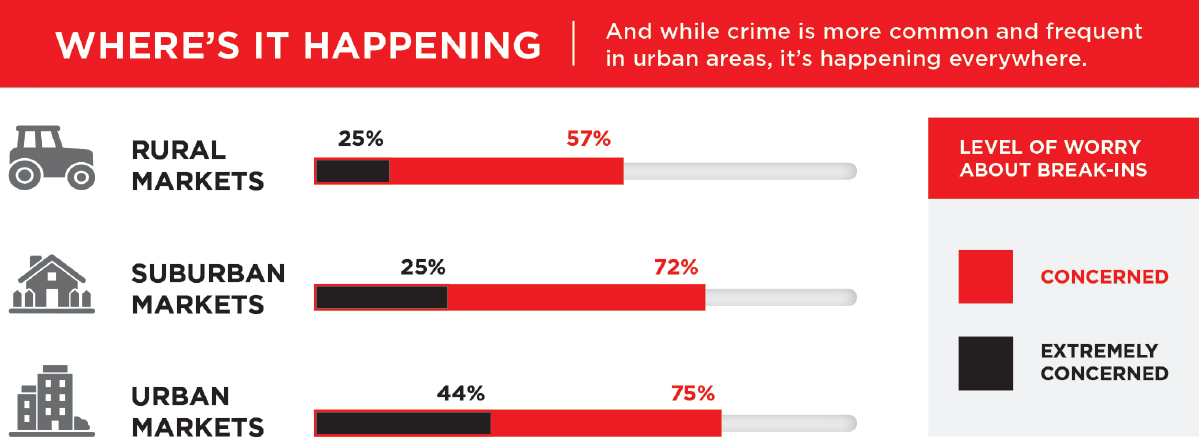
And while crime is more common and frequent in urban areas, it’s happening everywhere.
- 75 percent of owner-operators in urban areas are concerned (44 percent are extremely concerned).
- 72 percent in suburban areas are concerned (25 percent are extremely concerned).
- 57 percent in rural markets are concerned (25 percent are extremely concerned).
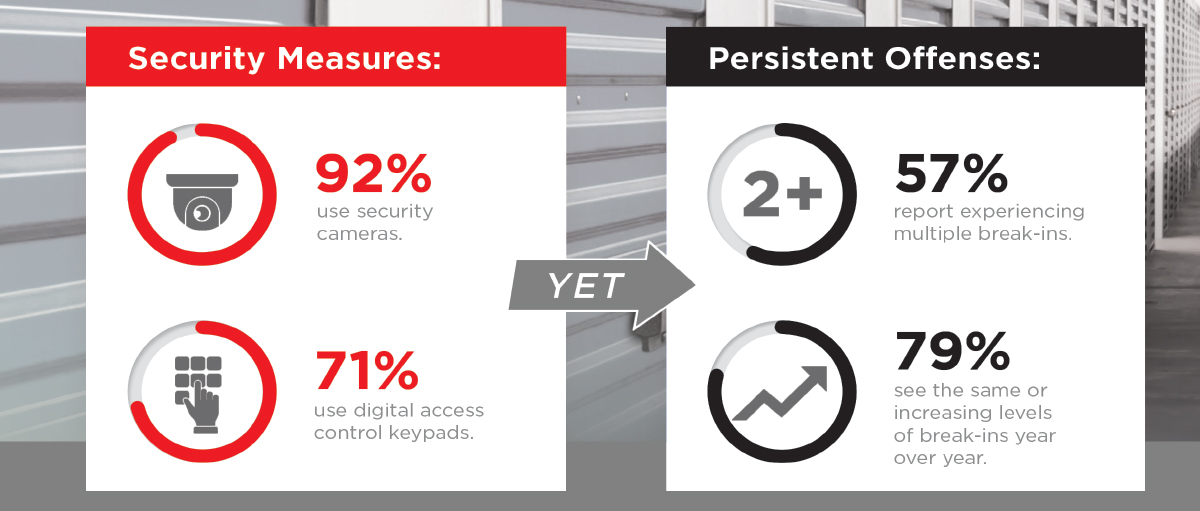
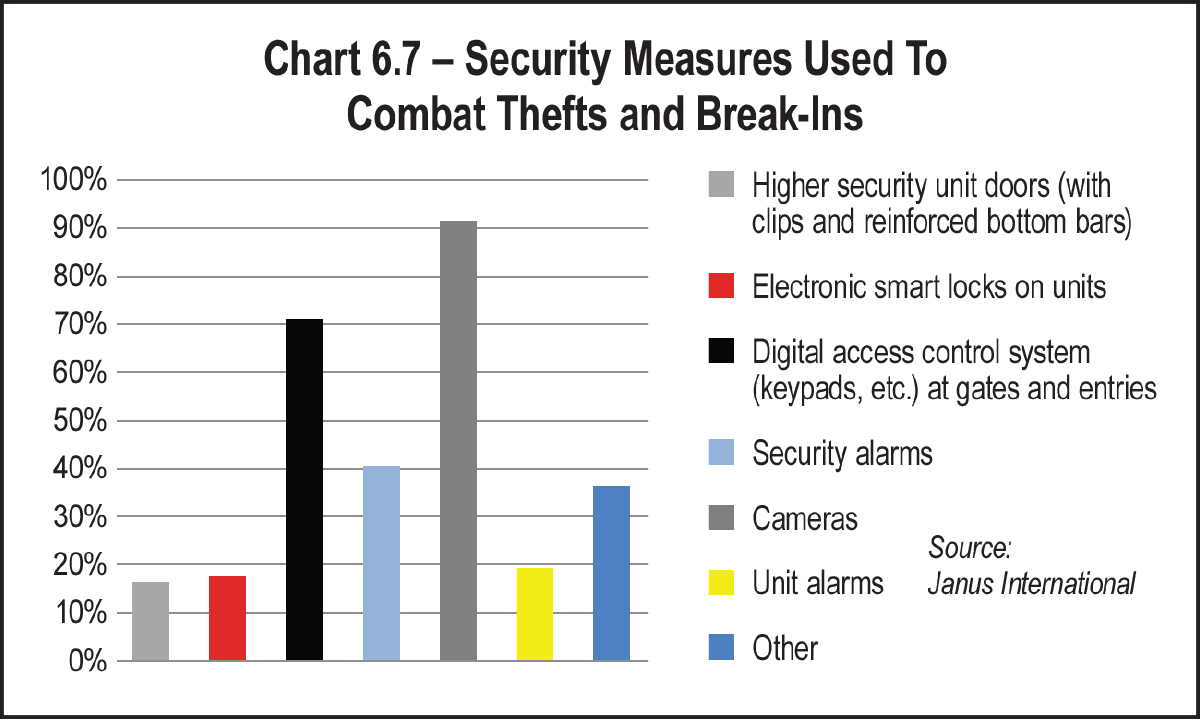
If you look at the statistics, nearly all owner-operators report using security cameras (92 percent), and many use digital access control keypads for entry points (71 percent). However, as criminals become savvier, these methods alone aren’t the deterrents they used to be, especially since 79 percent of facilities report the same high level of break-ins year after year.
So, what security improvements on the market should you chose when planning for new project construction or upgrading existing facilities?
- Upgrading Current Systems – Traditional tools like cameras and keypad systems at points of ingress and egress are not enough of a deterrent to prevent/decrease unit level break-ins.
- Smart Locking Technology – Unit-level smart locks have proven much more effective against unit-level break-ins.
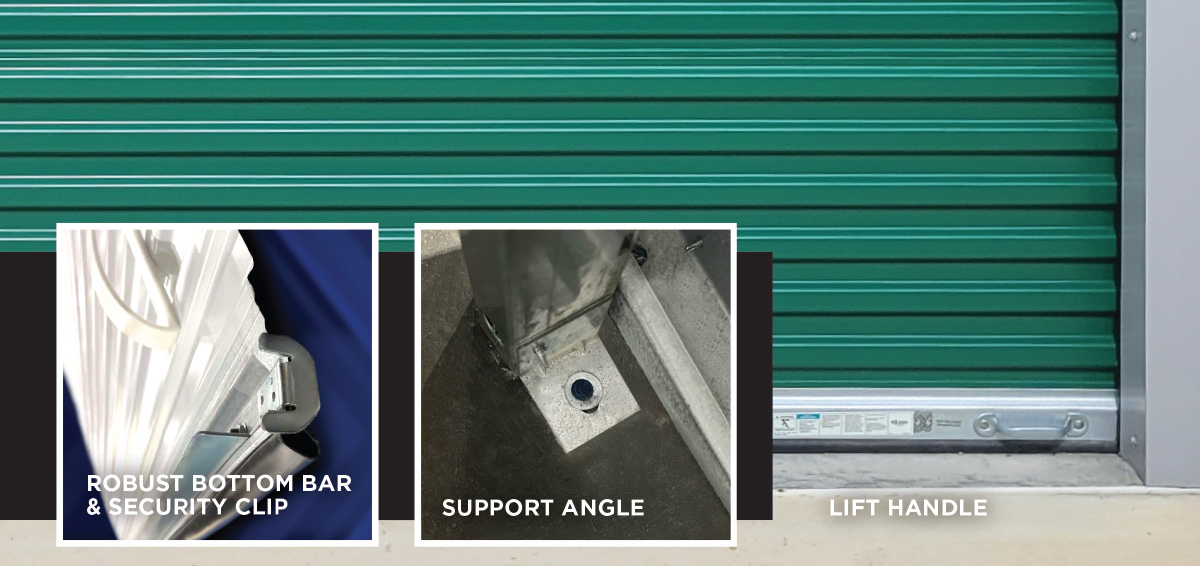
- Better Physical Barriers At The Unit Level – Higher security roll-up doors are now available that are designed to combat the most frequent types of break-in attempts.
Integrated smart locking technology allows your tenants to rent a unit online or from their mobile phone and access the facility and their unit using their mobile device; it also provides real-time visibility into unit status and suspicious activity to owner-operators. Tenants can also leverage this integrated mobile technology to monitor their unit and grant and revoke digital access to family members, employees, or movers.
Industry-leading smart locks also have security-grade motion sensing capabilities built in to further deter theft and break-in attempts and provide meaningful, real-time alerts when there is a motion event occurring inside a unit.


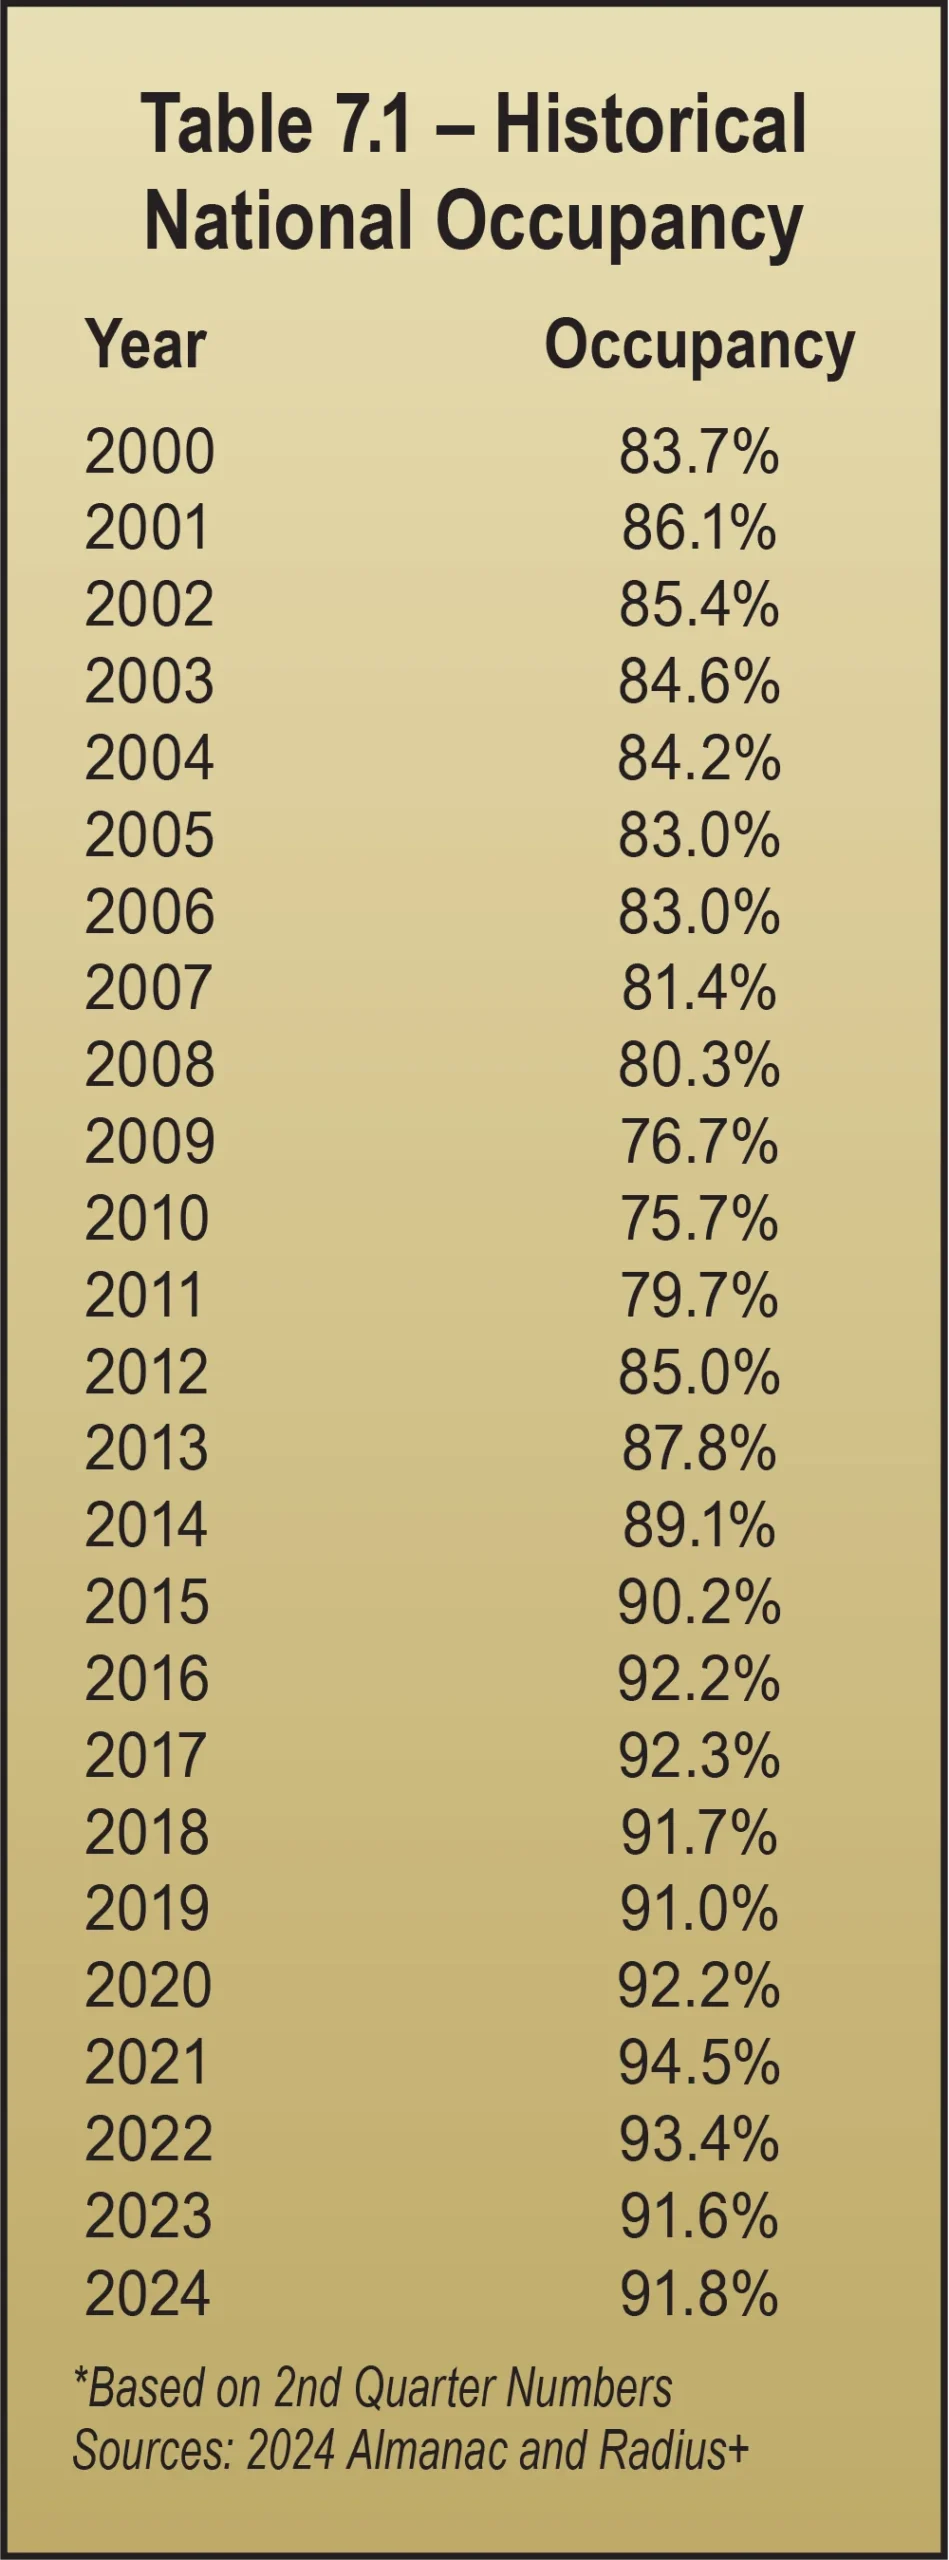
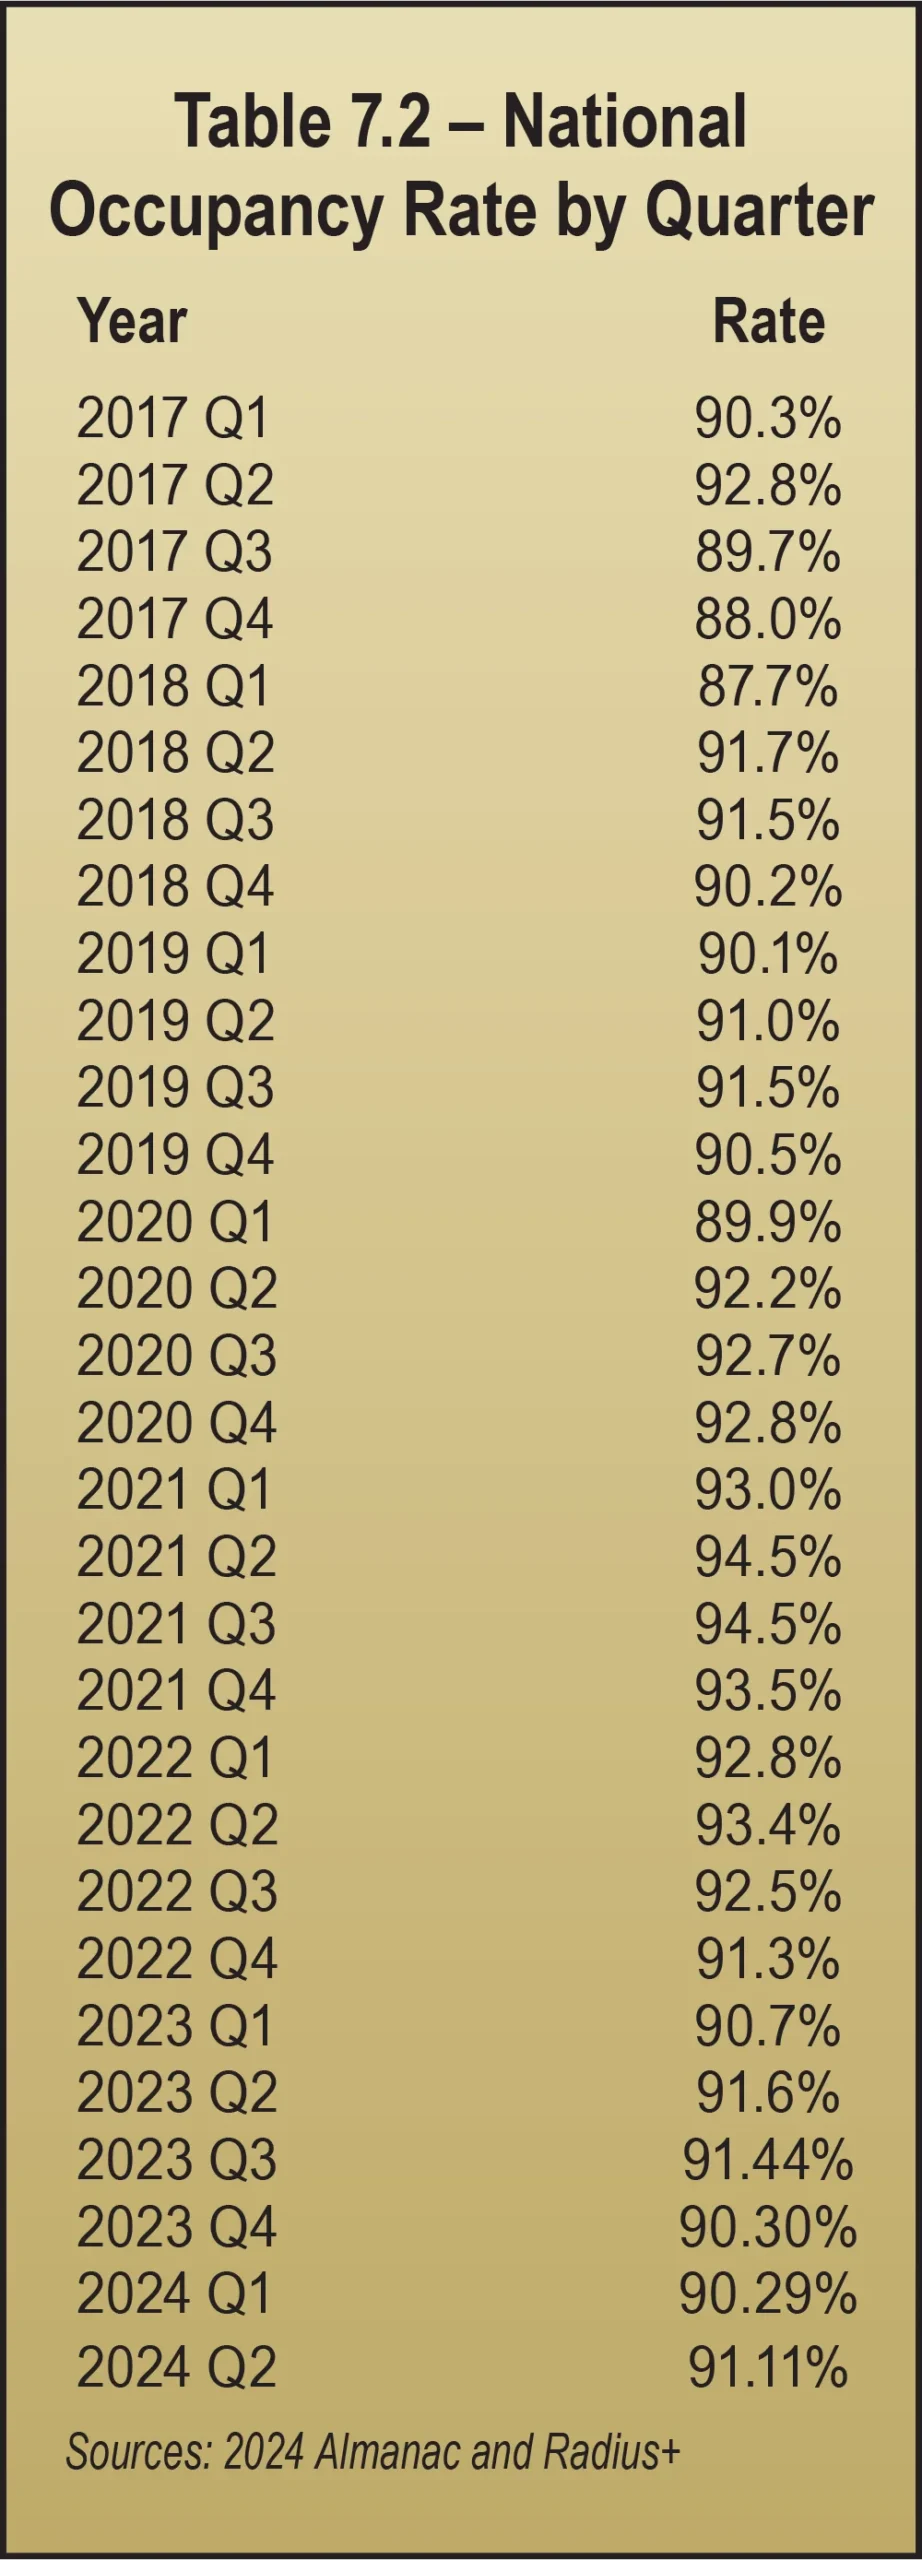
any self-storage professionals evaluate themselves and their business success by occupancy, both physical and economic. The data shown in Tables 7.1 and 7.2, along with Charts 7.1 and 7.2, tells a story of relatively stable occupancy over the past 10 years. During that time, national occupancy hovered near 90 percent to 93 percent, according to Radius+, the main data provider for MSM’s Self-Storage Almanac for the past five years.
Physical occupancy measures how many units are rented. Economic occupancy measures how much revenue they are bringing in. There is often a gap between them. The goal is to have a high percentage of units rented at rates that are as close as possible to your street rates (your target rent), while still having inventory to sell (space to rent), so that when you have leads you can rent units to them at the street rate instead of turning them away. Gross potential revenue (from rent) is what you would receive if you rented every unit at your street rate without any concessions, discounts, or promotions.
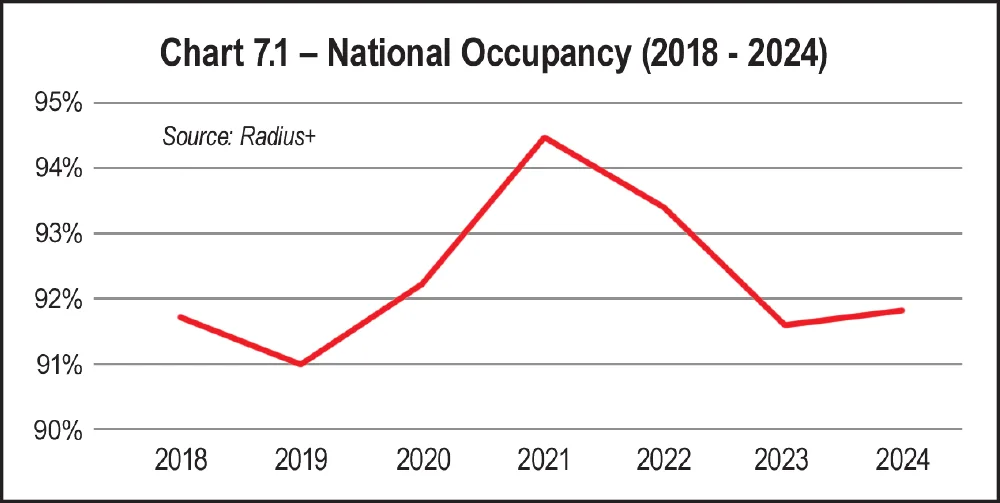
Occupancy hit an all-time high in 2021, climbing to 94.5 percent, and it continued to be quite high in 2022, when the national average was 93.4 percent. Chart 7.1, with data just from 2018 to 2024, clearly shows the spike in occupancy.
- Work at home,
- Population migration from urban centers to locations with lower cost of living,
- Remodeling, which surged while people were house-bound and bored during COVID shutdowns, and
- Fewer move-outs than average, due to shutdowns, with more move-ins than average.
The COVID years are over, and occupancy is returning to normal. In 2024, occupancy reverted to the 90 percent to 93 percent range, at 91.6 percent, and remained there in 2024, at 91.8 percent.
Before COVID, the old norm considered 85 percent occupancy to be a good, solid number, but a lot of things have changed. Even the way the industry uses the term “stabilized occupancy” has changed. It used to mean when expenses were covered, so every additional rental went straight to the bottom line with no increase in expenses. It has come to mean when facilities are achieving other internal goals, such as those shown on the proforma upon which the investments were made.
Investment proformas developed when rates and occupancy were climbing during COVID may call for more rapid lease-ups than are currently being realized at higher rent per square foot. A COVID-era proforma calling for lease-up to 90 percent in three years at a rental rate of $1.70 per square foot may have been achievable between 2020 and 2022, but it’s not feasible in today’s lower occupancy environment with reduced rents of closer to $1.23 per square foot. If such deals were largely financed with debt at a variable interest rate that unexpectedly increased significantly, those projects are in trouble.
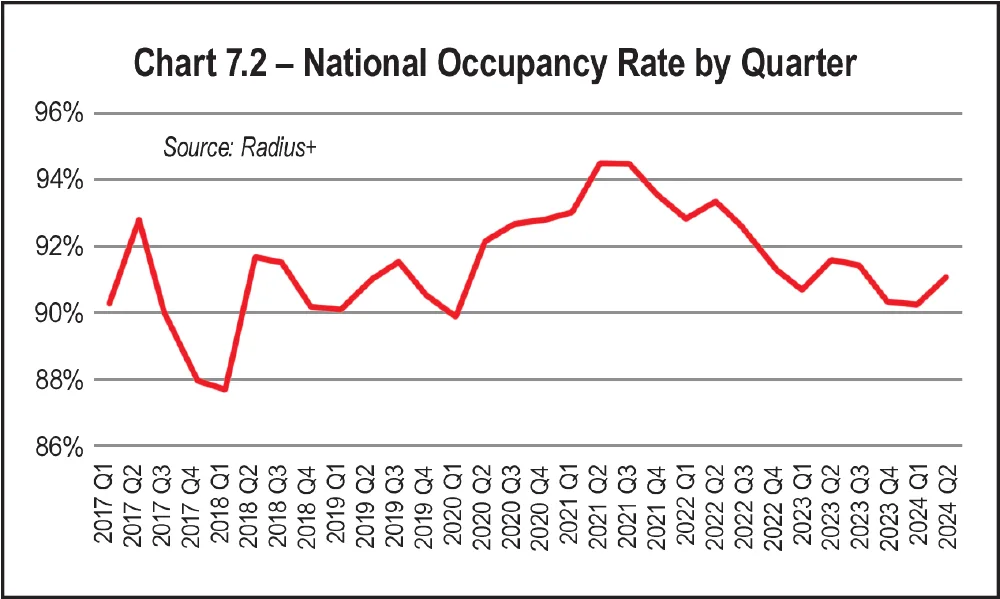
Annual occupancy figures aside, occupancy does vary from month to month throughout the year. Even if a facility fits within this 90 percent to 93 percent occupancy range as an annual average, the monthly averages within that year may vary by as much as 20 percent points or more, meaning an annual average looks quite different from the day-to-day experience.
Several factors explain occupancy fluctuation.
- Seasonality – More rentals occur during the spring and summer than during the fall and winter because people typically move when the weather is warmer and/or students are not in school. Other local market factors also contribute to seasonal occupancy changes. For instance, a facility near a university typically has an even higher volume of summer rentals; that alone can account for a 20 percent surge in occupancy during the summer months, while occupancy in the winter months hovers between 70 percent and 80 percent.
- New supply in the local market – If a new facility opened in your market, or a competitor finished an addition with more units to rent, their lease-up could pull your occupancy down for as much as three years or more, depending on how much new supply is delivered. If your competition is professionally managed by a REIT with a vast digital footprint and marketing reach, the negative affect on your occupancy could be even greater.
- Population mobility – If your self-storage business is in a local market experiencing population growth, there will be more demand. If people are moving out of your local market, they are taking their demand with them, and your occupancy will decline.
- Changes in the housing market – Moving is a major driver for self-storage demand. If transaction volume is down in the housing market and fewer people are buying and selling homes, as was the case in 2023 and 2024, that aspect of self-storage demand declines. People need to rent self-storage when they are moving. If they are not moving, that type of demand goes away.
- General economic conditions – When consumers feel the pinch of higher prices, caused by inflation in 2023 and 2024, some of them change their view of storage from a “need” to a “want,” and they move out.
On a positive note, reflecting on Chart 7.1, occupancy levels in 2018 and 2024 are comparable, but there’s more storage. That means more square feet of rented space. So, demand grew as supply grew. It is encouraging that overall occupancy did not decline below 2018 rates as supply increased.
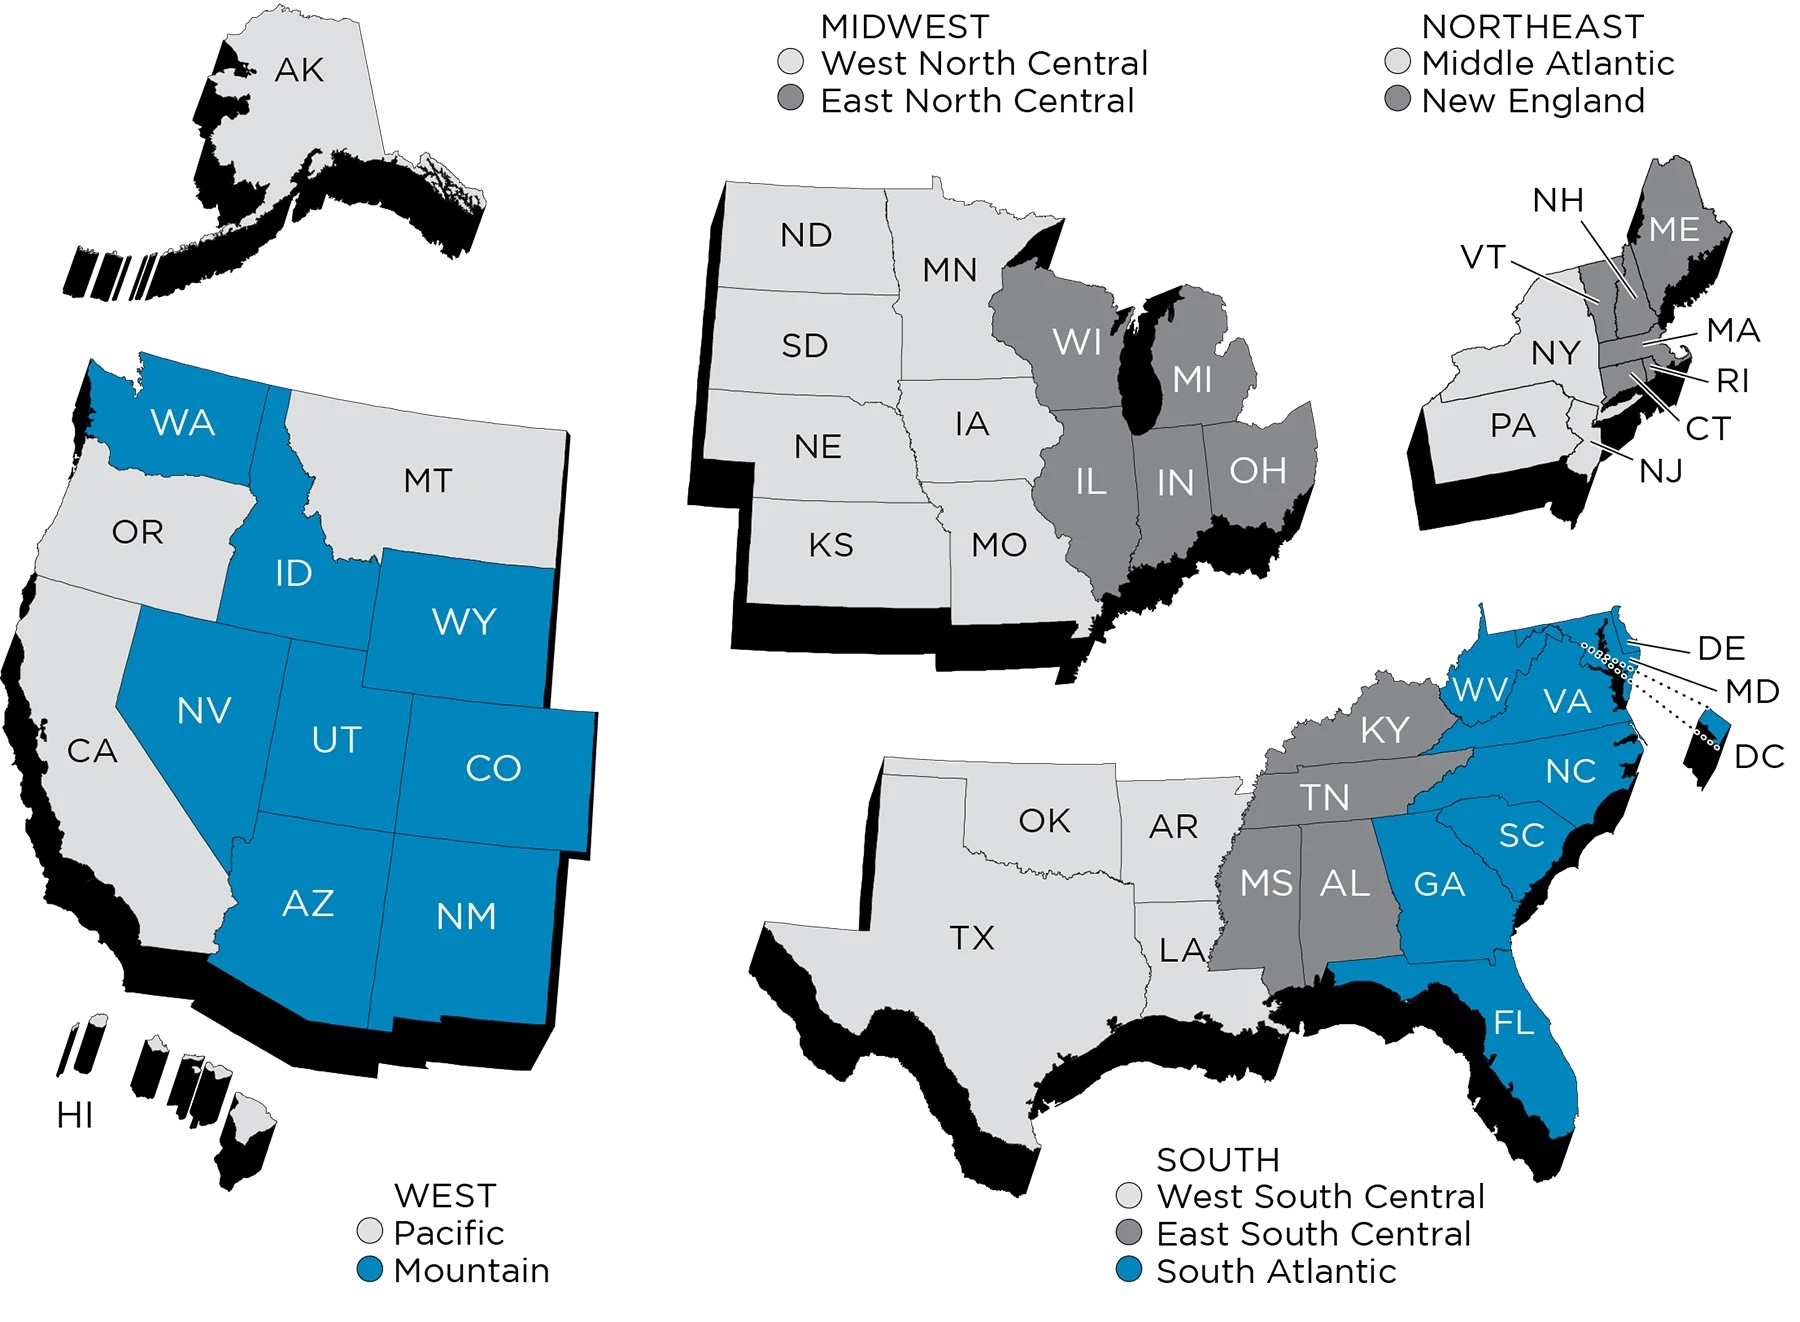
As shown in Table 7.3 and Chart 7.3, average occupancy was up in six regions and down in three regions. The six regions experiencing slight increases in occupancy included:
- West (Pacific) – up 0.1 percent in California, Oregon, Washington, Alaska, and Hawaii
- South (East South Central) – up 0.2 percent in Alabama, Kentucky, Mississippi, and Tennessee
- West (Mountain) – up 0.4 percent in Arizona, Utah, New Mexico, Montana, Colorado, Idaho, Nevada, and Wyoming
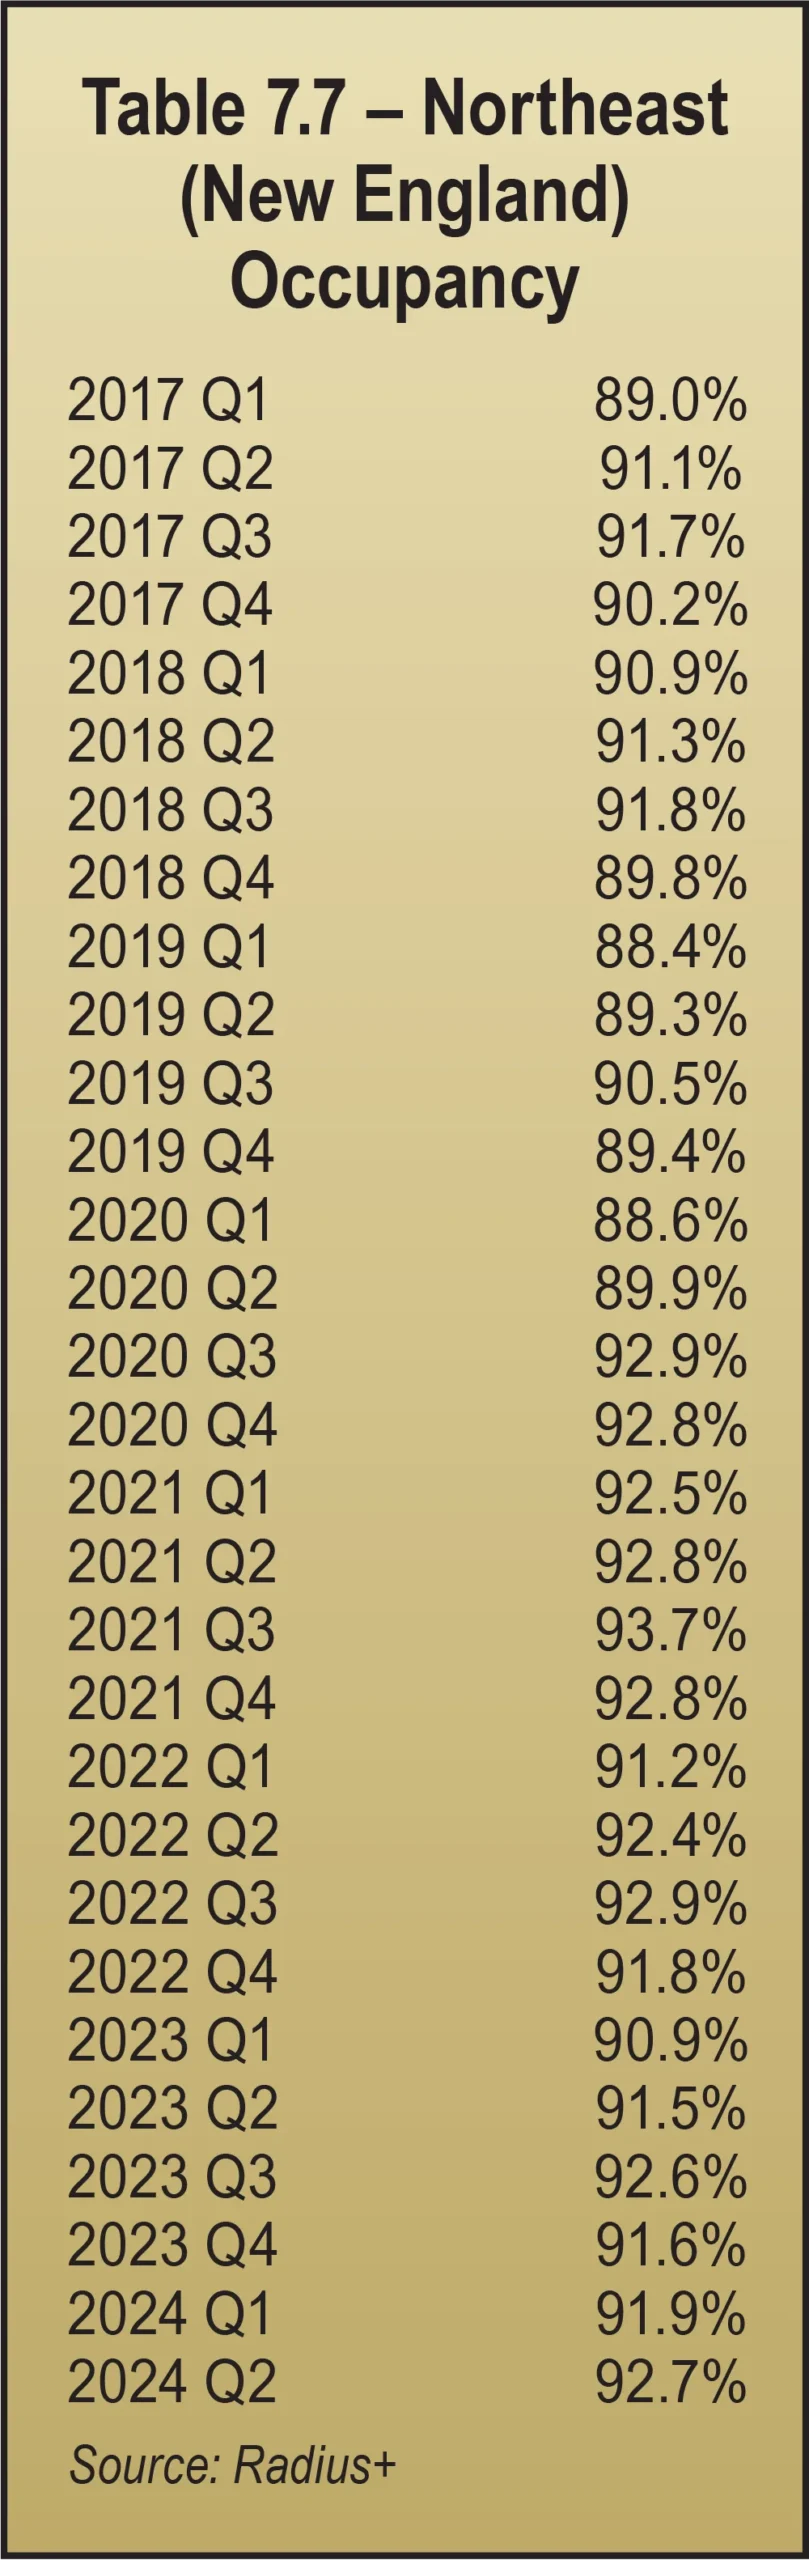
- Northeast (New England) – up 1.2 percent in Connecticut, Maine, Massachusetts, New Hampshire, Rhode Island, and Vermont
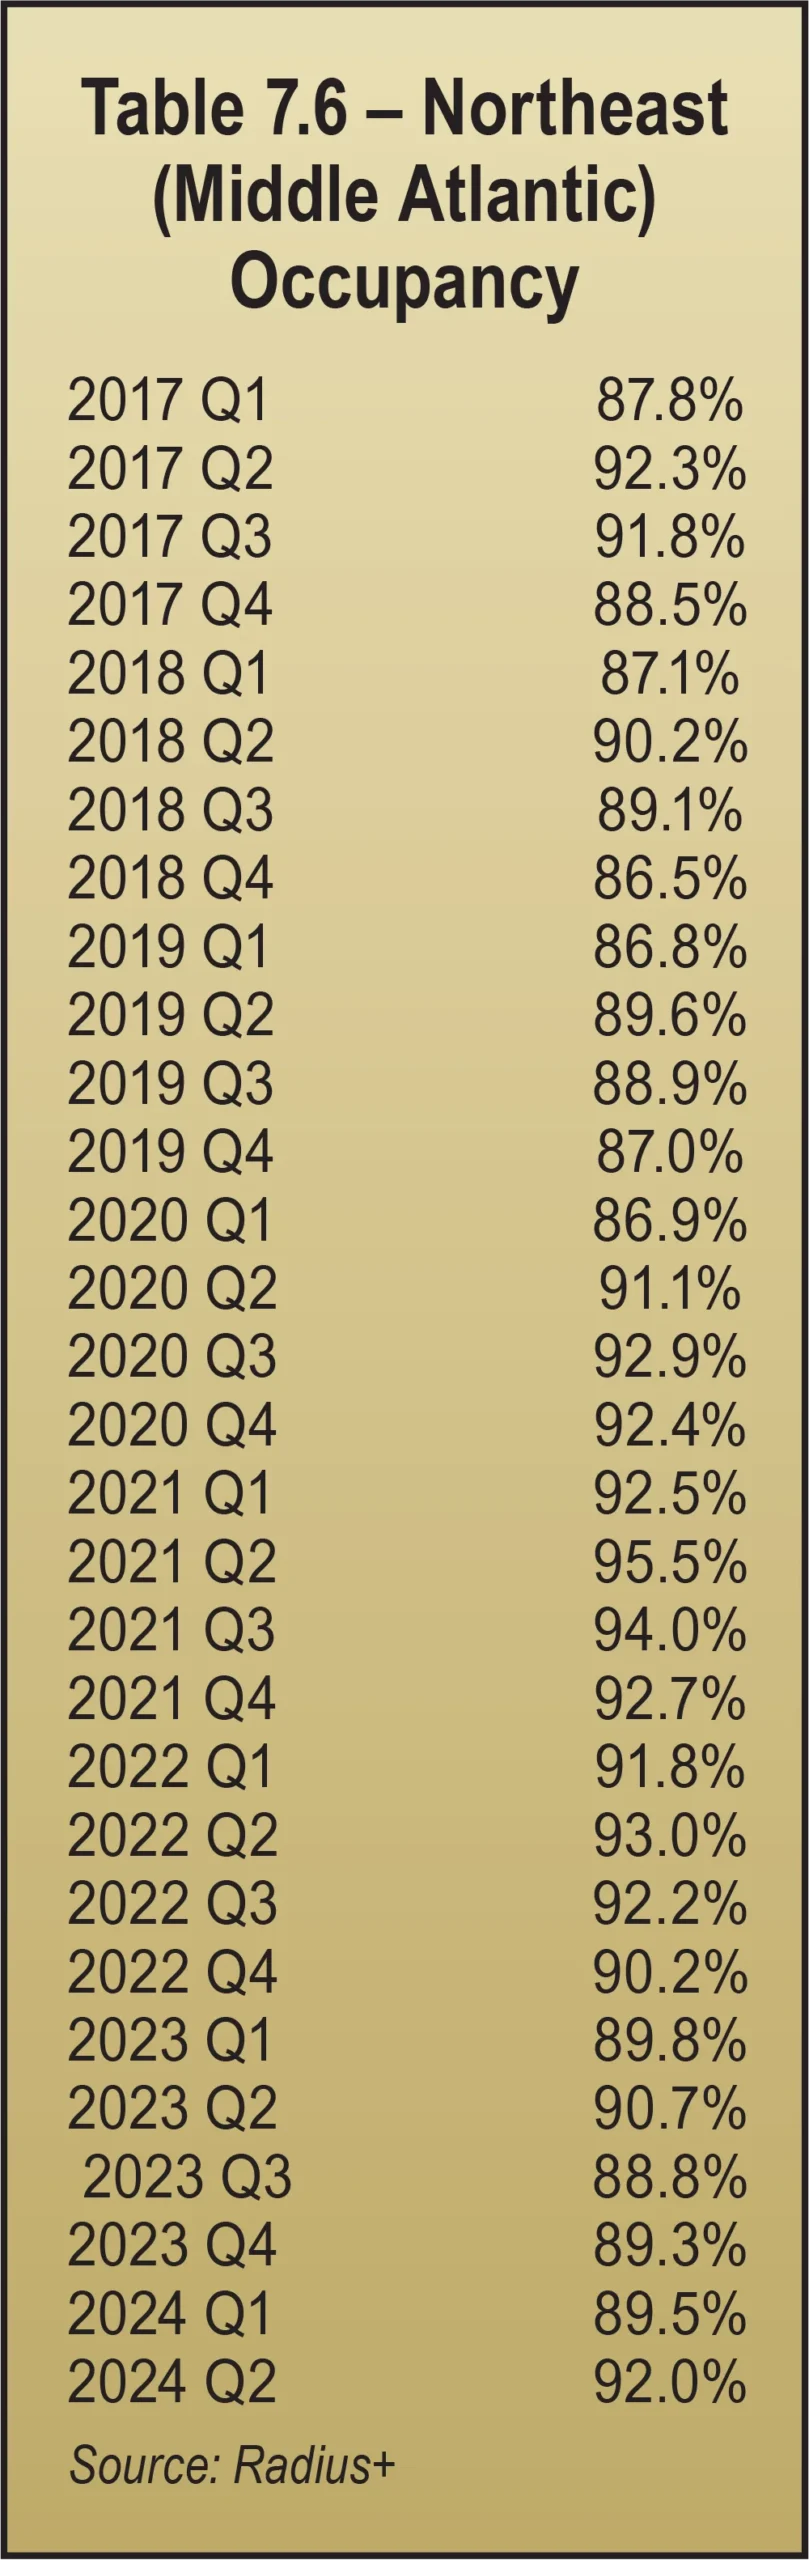
- Northeast (Middle Atlantic) – up 1.3 percent in New Jersey, New York, and Pennsylvania
- Midwest (West North Central) – up 1.3 percent in Iowa, Kansas, Minnesota, Missouri, Nebraska, North Dakota, and South Dakota (west of the Mississippi River)
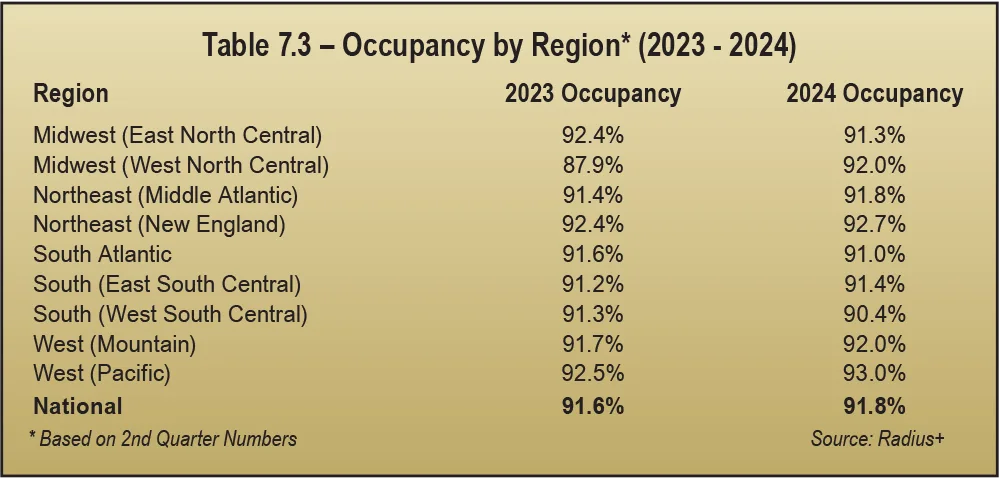
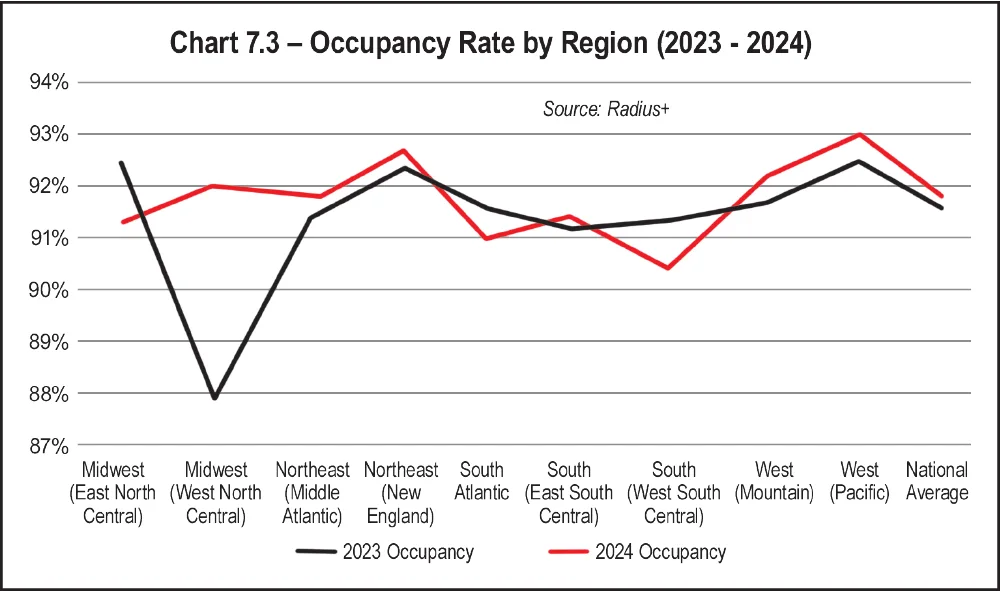
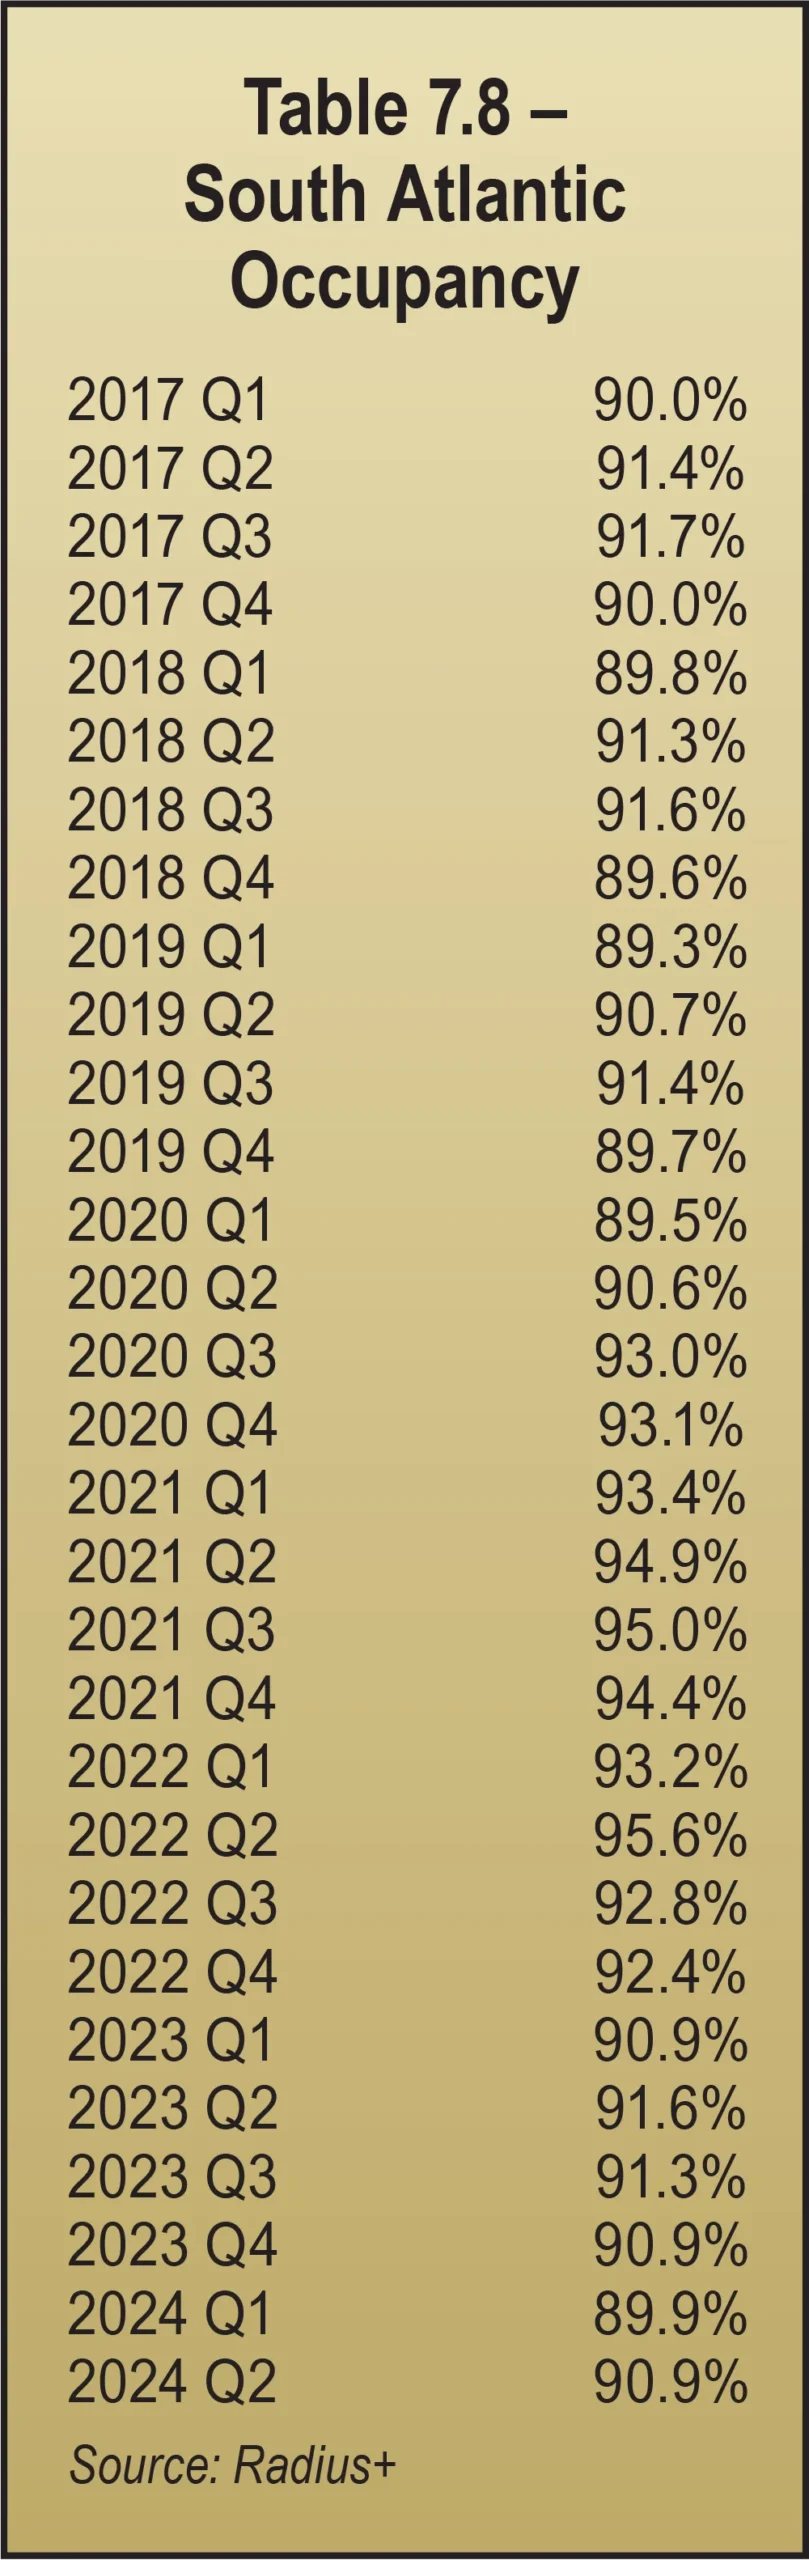
- South Atlantic – down 0.7 percent in Delaware, Florida, Georgia, Maryland, North Carolina, South Carolina, Virginia, West Virginia, and Washington D.C.
- South (West South Central) – down 0.9 percent in Arkansas, Louisiana, Oklahoma, and Texas
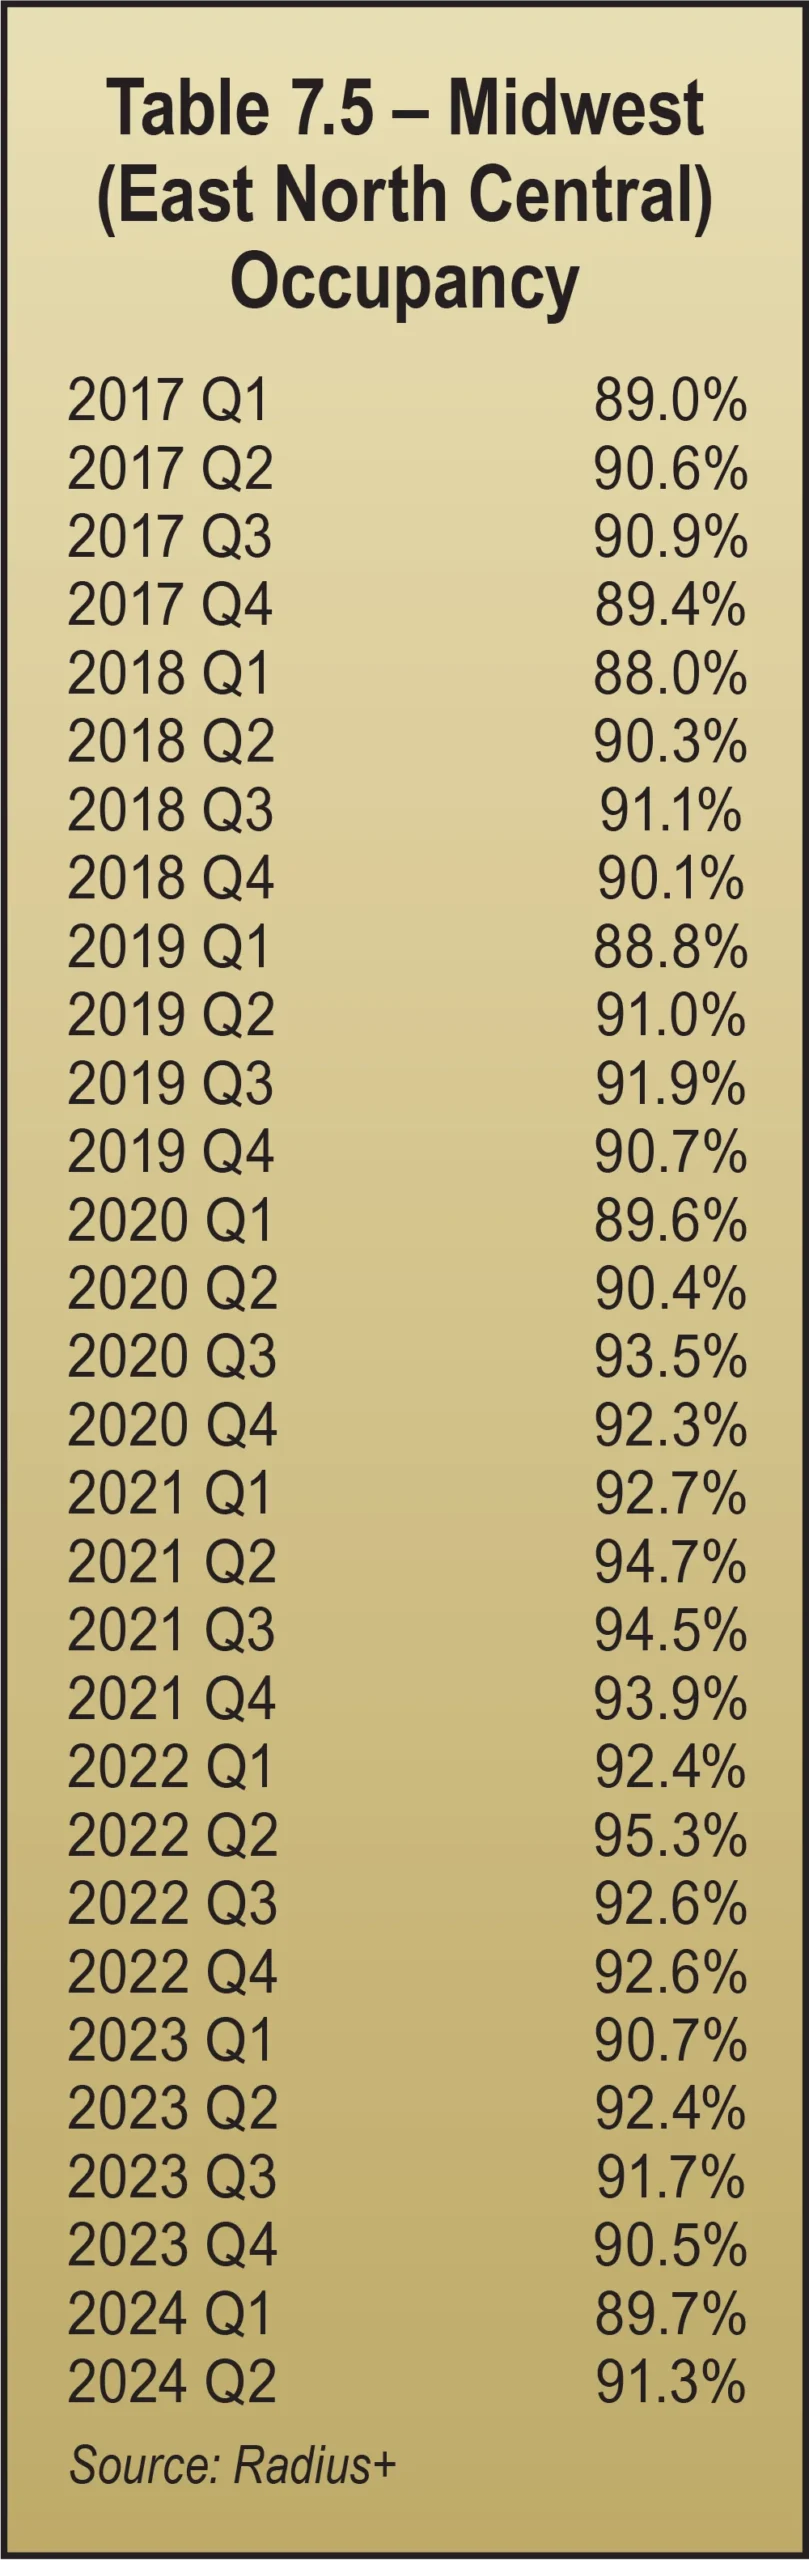
- Midwest (East North Central) – down 1.1 percent in Illinois, Indiana, Michigan, Ohio, and Wisconsin (east of the Mississippi River)
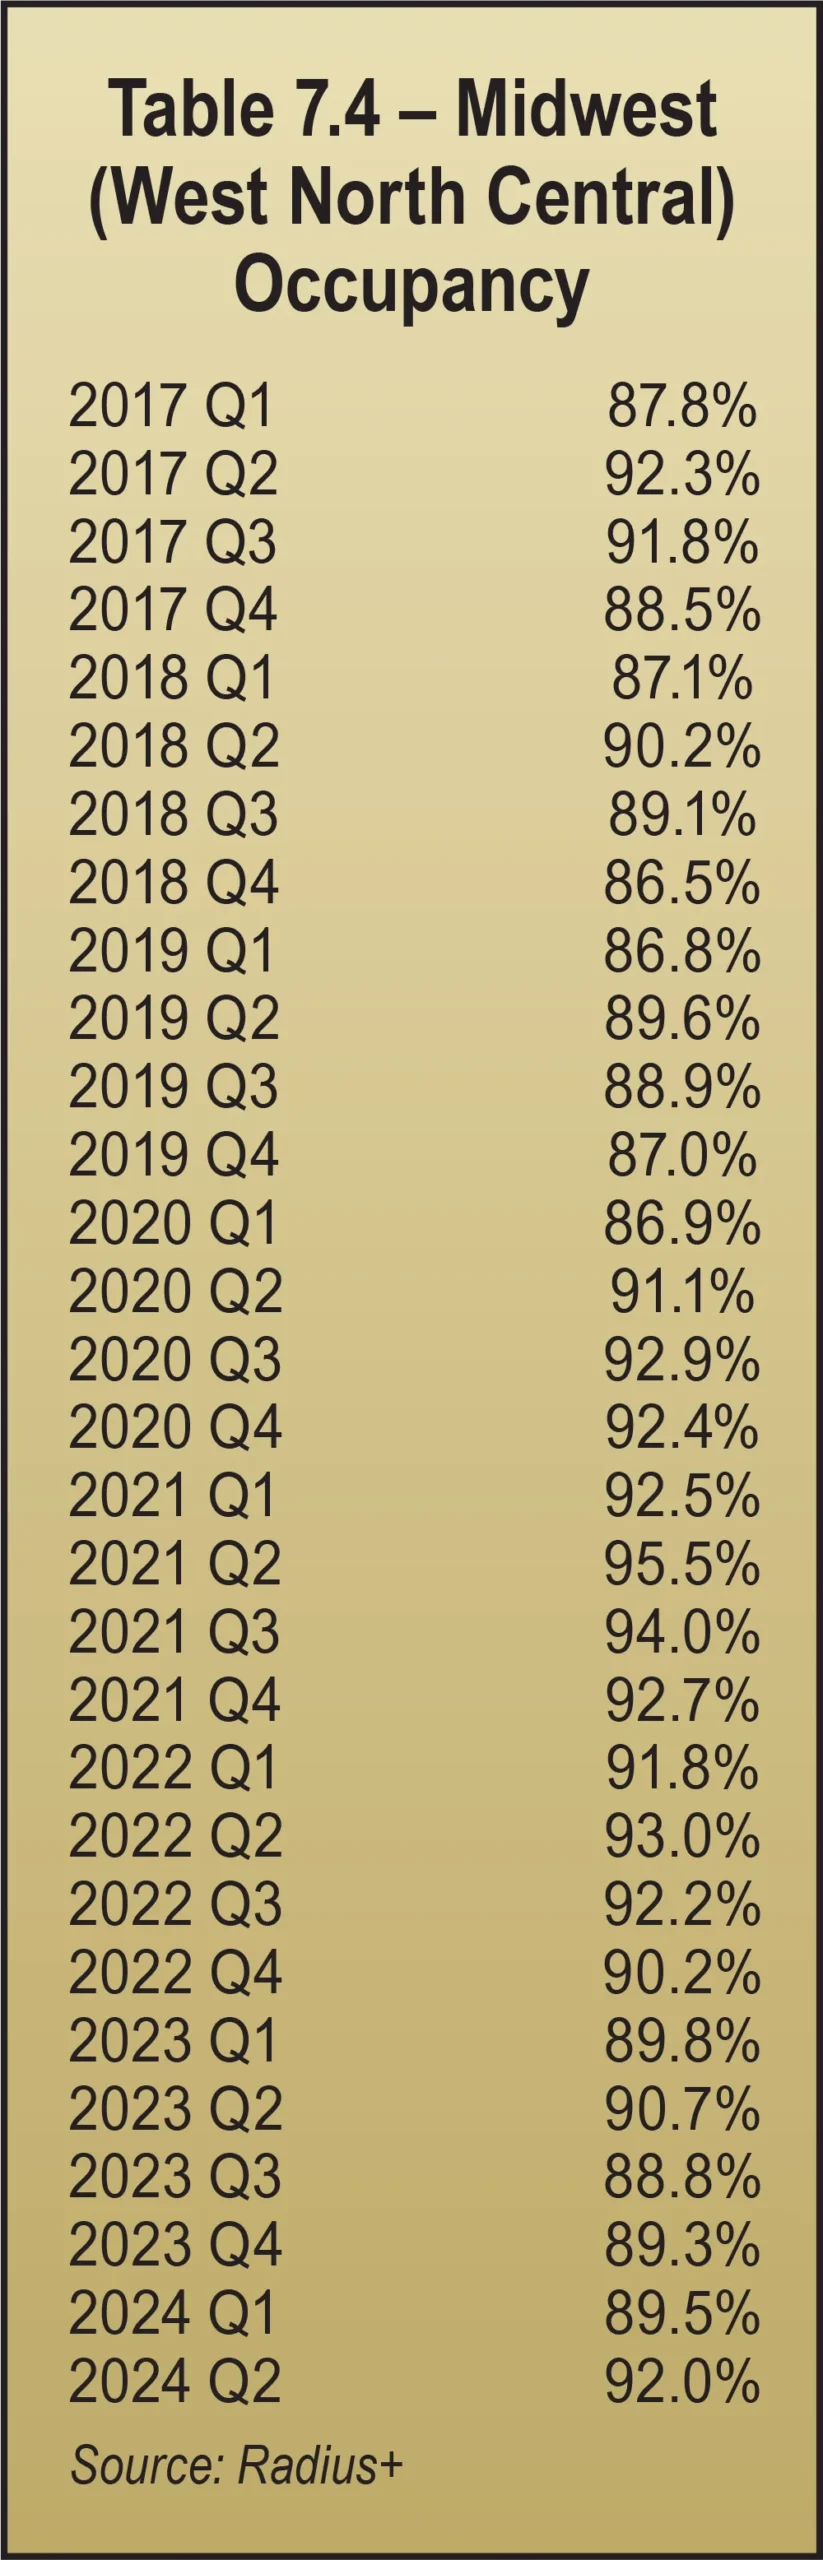
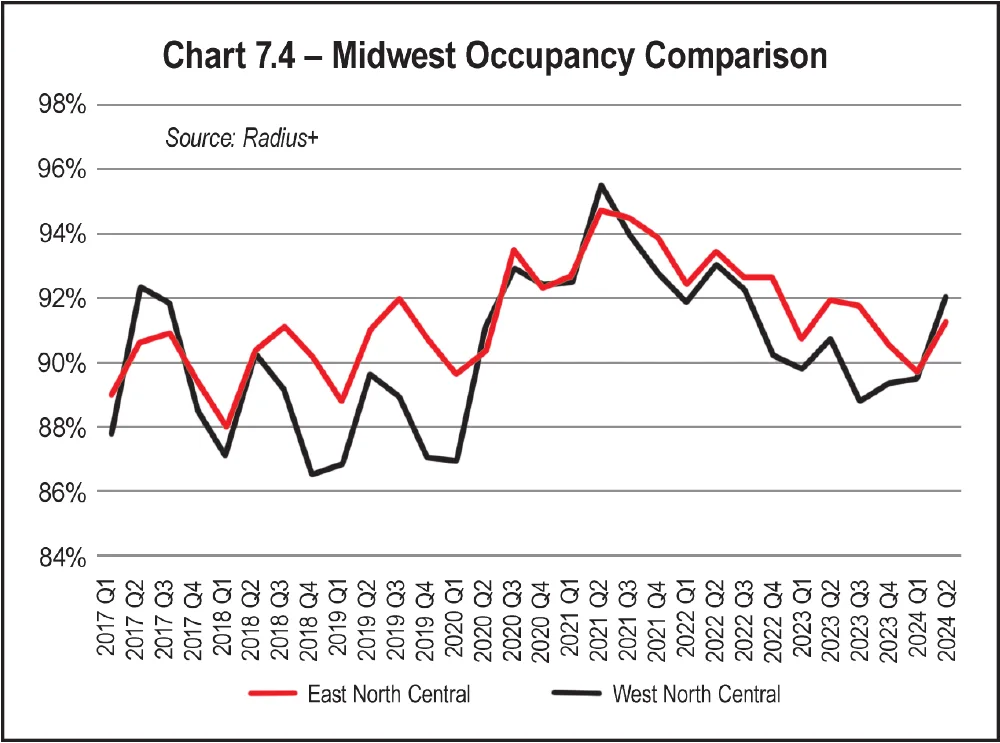
In the 30 quarters reported, the biggest variance is in the Midwest (West North Central), as demonstrated in Table 7.4 and Chart 7.4. Over the past seven years, this region experienced the greatest fluctuation in occupancy, ranging from a high of 95 percent in the second quarter of 2022 to a low of 86.5 percent in the fourth quarter of 2018, which is a 9-point variance.
Chart 7.4 compares the two Midwest regions. The two regions take turns leading in occupancy. Since the middle of 2021, occupancy in the Midwest (East North Central) region edged out occupancy in the Midwest (West North Central) region, but Midwest (West North Central) inched above Midwest (East North Central) in the middle of 2024.
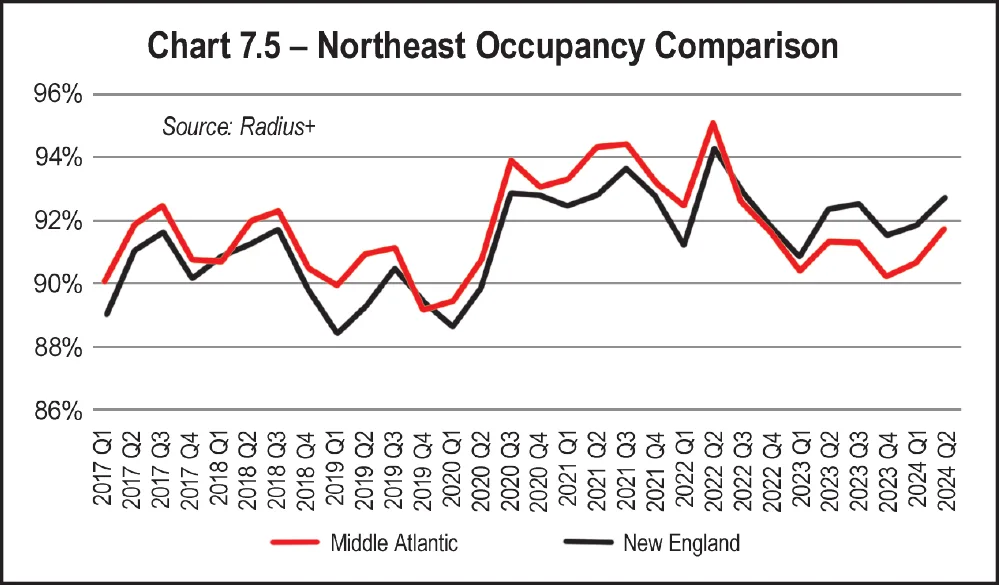
The other region in that area, Northeast (New England), shows a similar gain of 1.2 percent year over year, as Table 7.7 demonstrates.
Chart 7.5 shows occupancy trends over each for these regions, showing the Middle Atlantic generally leading in occupancy.
In Q2 2024, the South Atlantic region experienced a decline of 0.7 percent in occupancy year over year, as seen in Table 7.8.
In the third southern region, the South (East South Central) region inched up 0.2 percent in occupancy (see Table 7.10).
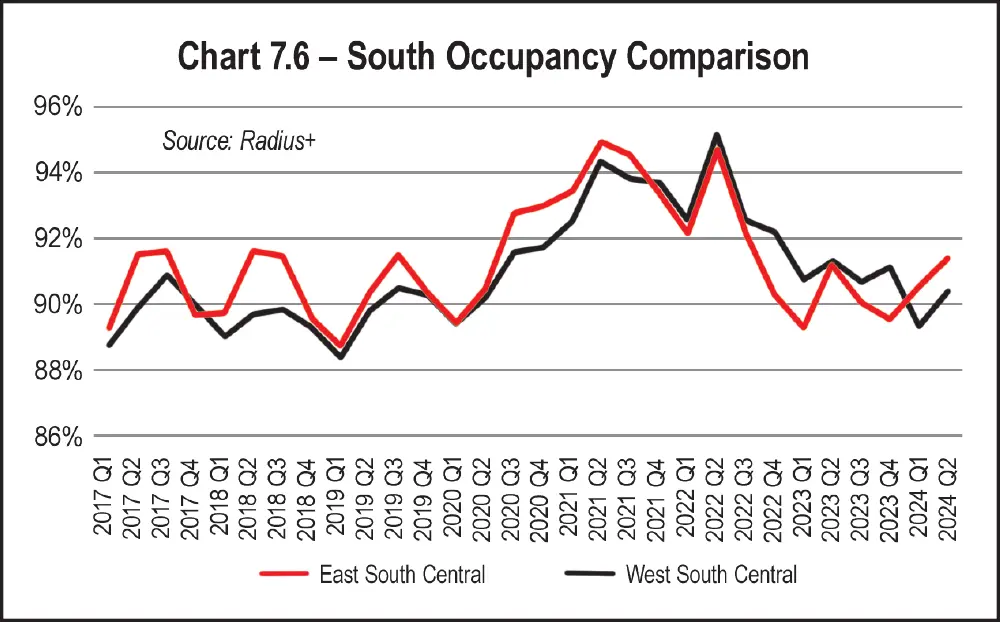
The comparison of occupancy in South (West South Central) to South (East South Central) is shown in Chart 7.6. The South (West South Central) lags behind the South (East South Central). That is, until 2021, when the South (West South Central) caught up with the South (East South Central). Occupancy in the South (West South Central) stayed above the South (East South Central) from Q4 in 2021 until Q1 in 2024, when it dropped below the South (East South Central) once again.
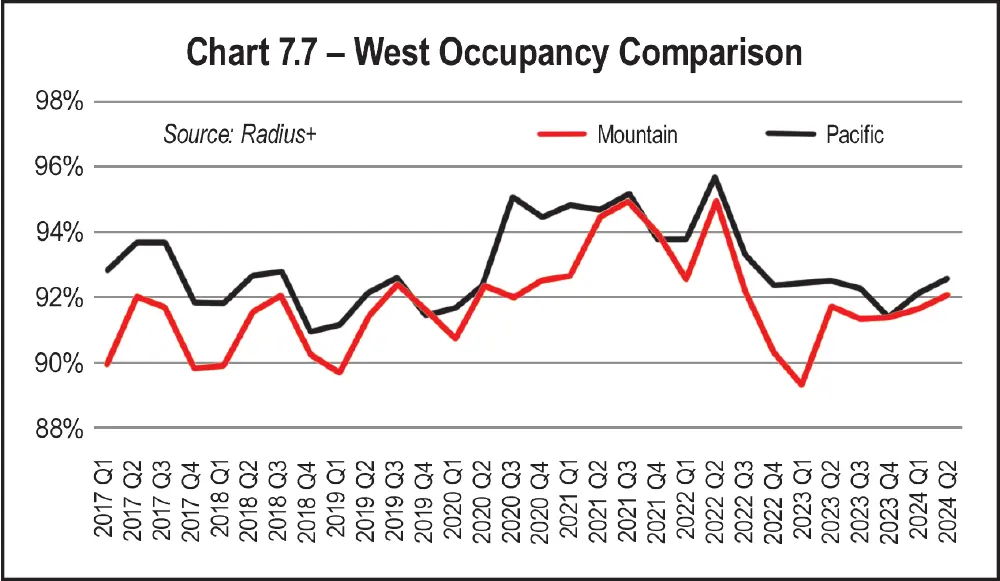
On the other side of the country, in the West, occupancies in both regions are slightly up. The Mountain states saw occupancy increase 0.4 percent (Table 7.11), while the Pacific states saw a smaller gain of 0.1 percent in 2024 (Table 7.12).
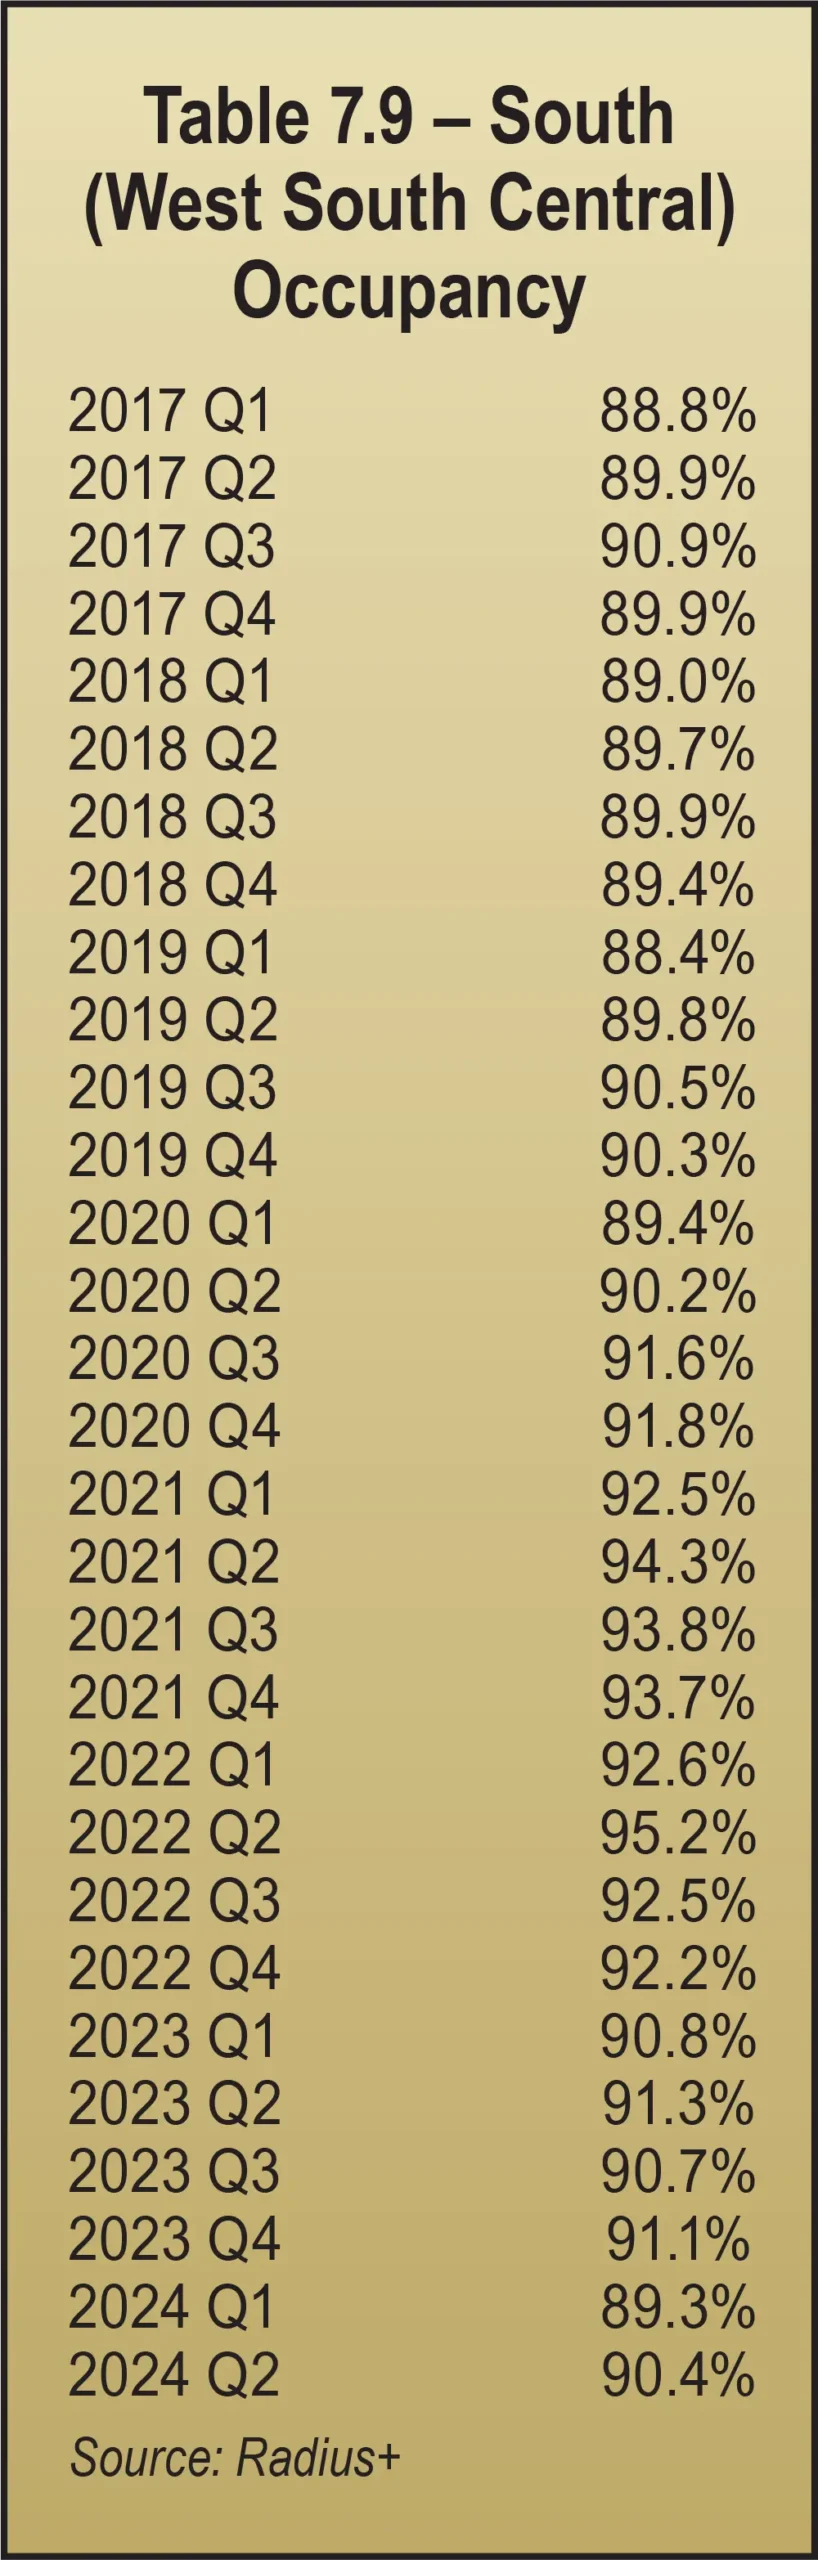
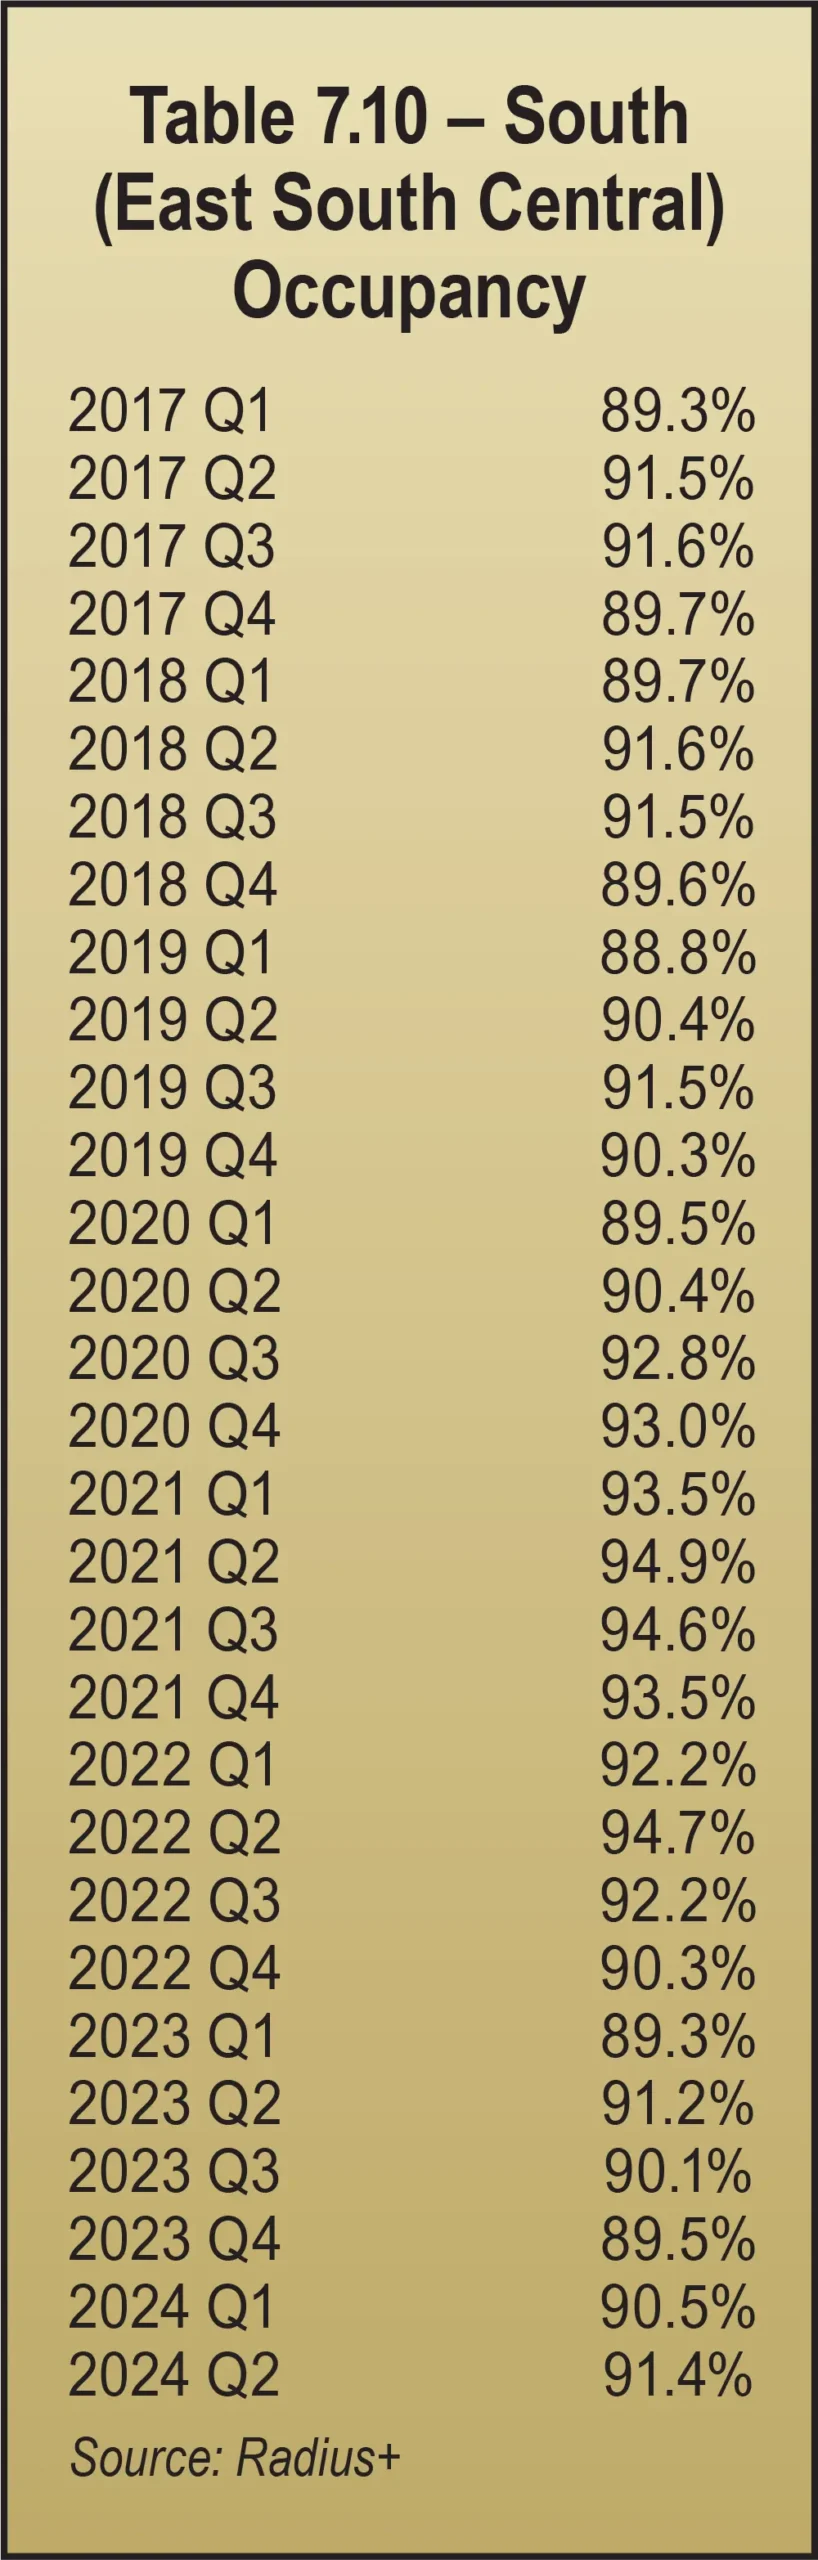
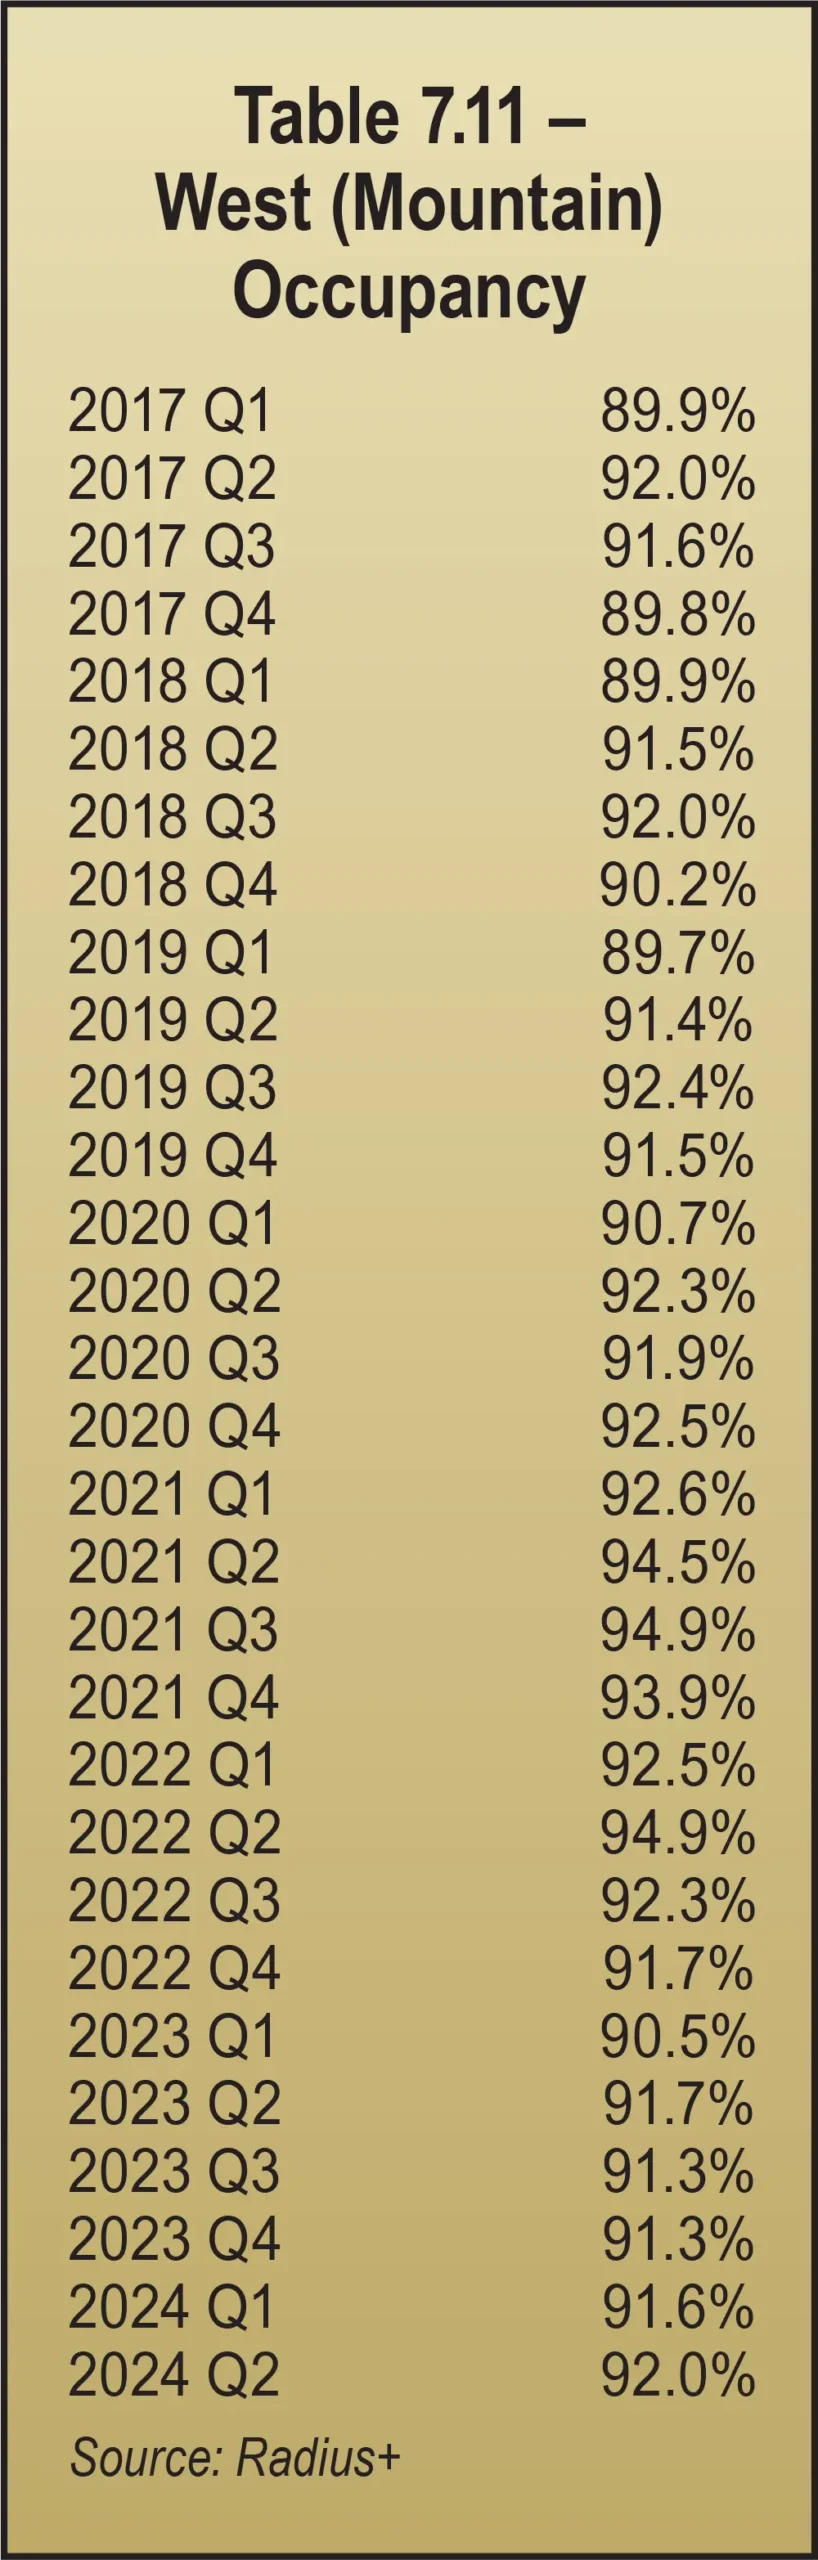
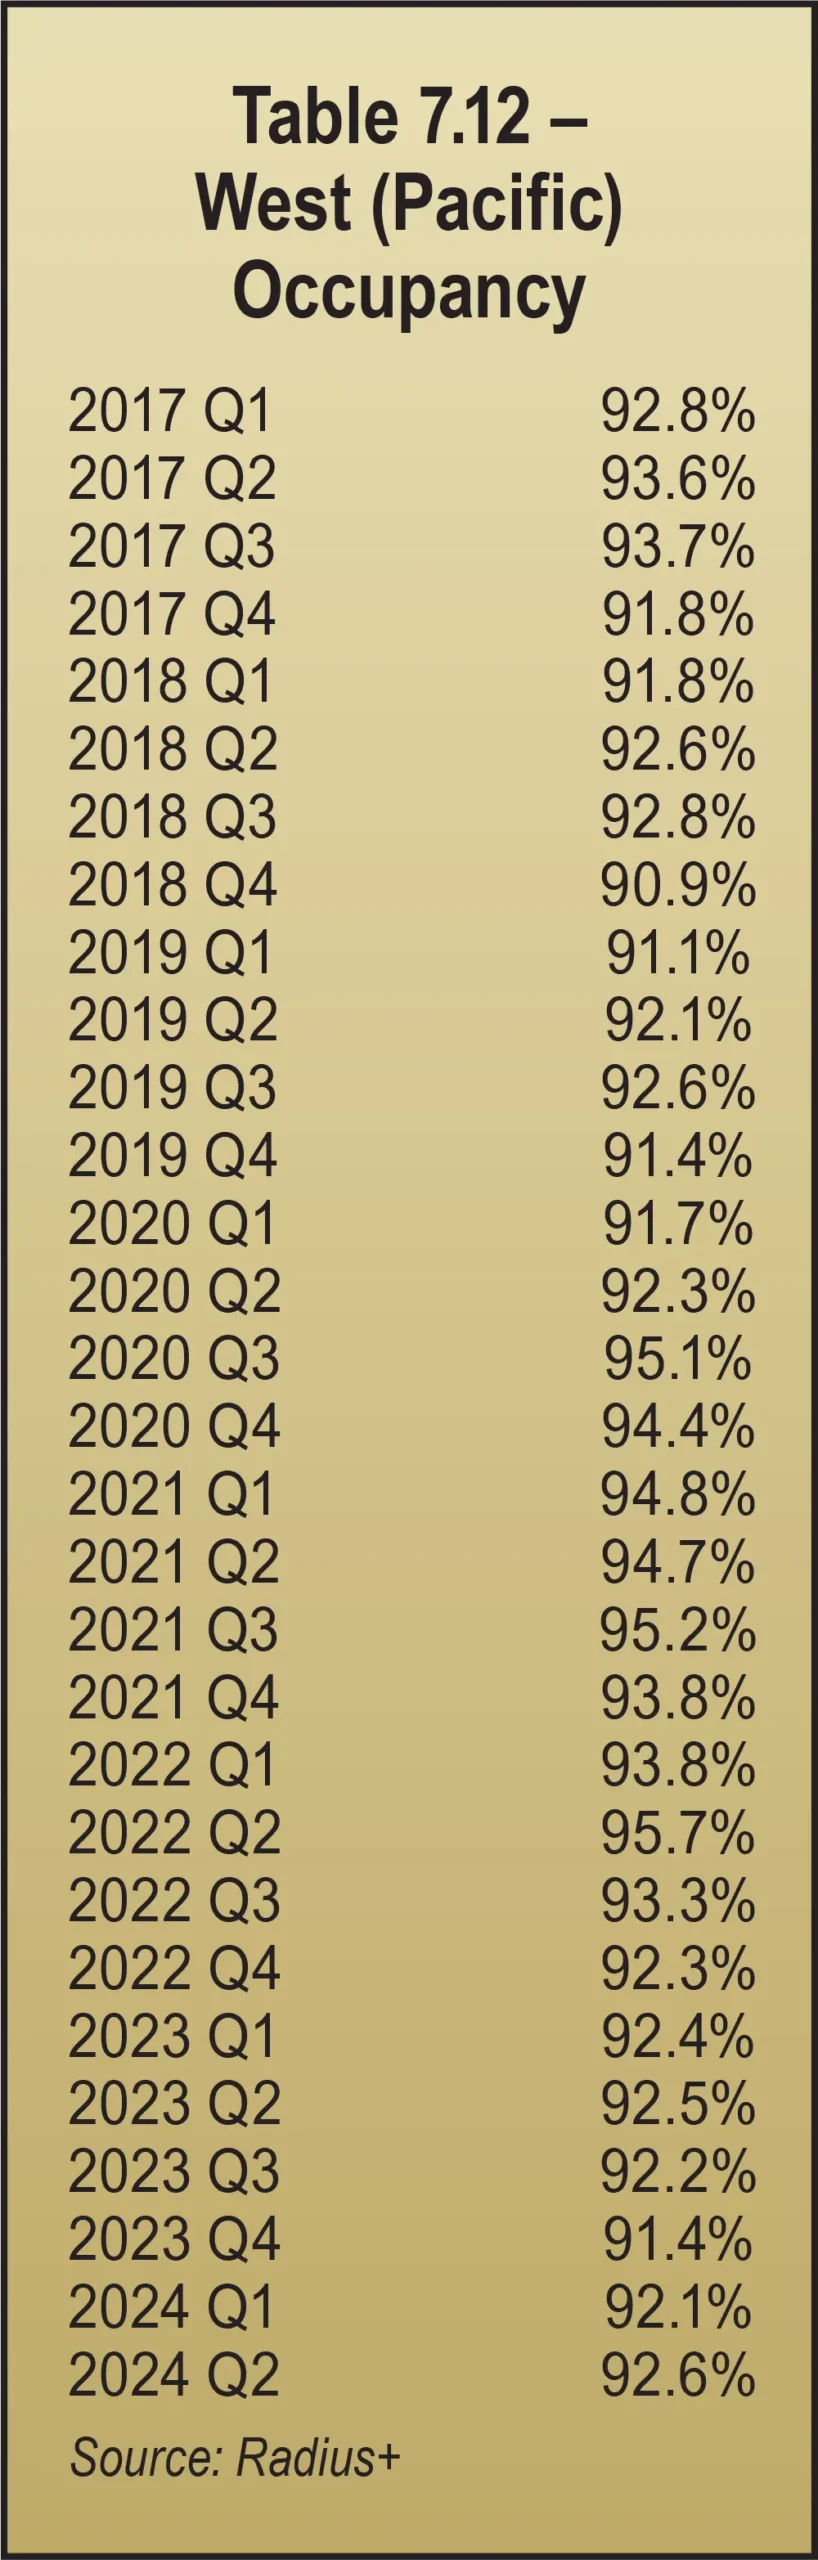
In the short term, however, there is speculation that both occupancy and rates could go down from 2024 levels, especially if the housing market does not recover quickly. Moving is only one of the five Ds of demand. Even if it declines, the other Ds are still occurring (divorce, death, disease, and disaster), all of which can cause dislocation. Those are the pools to be fishing in for storage demand, leads, and conversions, using every “channel” consumers use (text, live chat, online rentals, walk-ins, two-way video, etc.). And be sure you are optimizing your chances by using a marketing firm that specializes in self-storage and can offer you high-quality search engine optimization (SEO) services. Technical SEO and fully utilizing your Google Business Profile (GBP) and other Google options is more important than ever.
With the presidential election behind us and interest rates on the decline, improvement in the housing market and taming inflation both seem more likely than they did in 2024. Even though housing prices are still at all-time highs, there is certainly pent-up demand to move, and more affordable mortgage rates will tap into that demand. All of this suggests that the worst is behind us and 2023 will stand alone as the year with the worst rate drops and lowest occupancy rates.
As always, we intend to provide the best data available to the self-storage industry. Over the next year, we will continue to monitor changes in data provided by various industry sources to continually present the most accurate data available.

ast year was certainly unique in regard to self-storage rental rates. Continued aggressive use of algorithms and AI-driven revenue management tools by REITs and many other self-storage owner-operators changed the landscape significantly. REITs led the charge by continuing to reduce street rates, buy market share, rent space, increase occupancy, then steadily drive up rates three months after move-in and beyond. Sometimes tenant rates double or even triple within a year’s time.
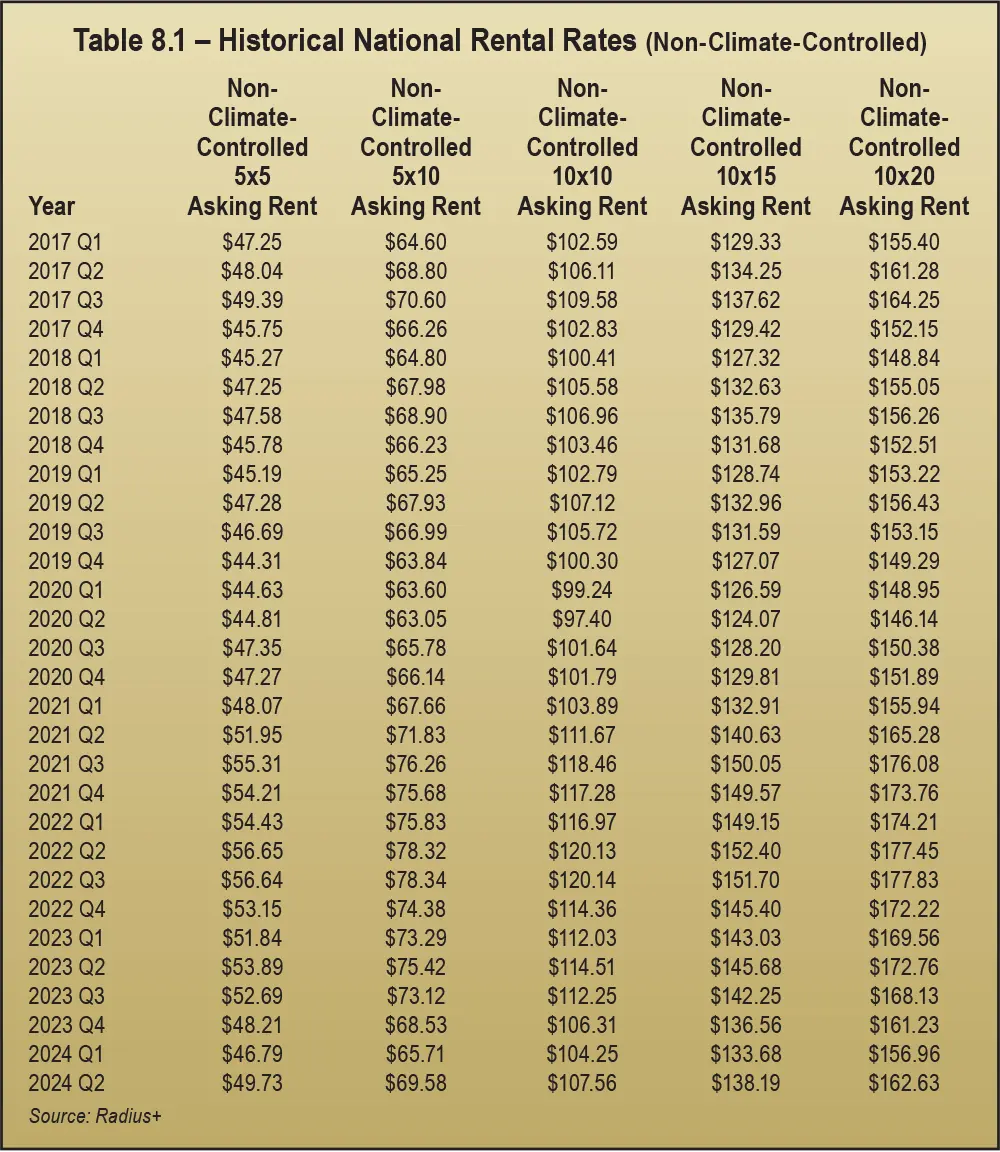
Several self-storage associations, including the California Self Storage Association and Arizona Self-Storage Association, reported a noticeable increase in complaints from tenants, which were quite infrequent in the past. This increase tracks with attempts in different parts of the country to introduce rent control measures to the self-storage sector at the municipal and state levels.
All in all, the results of aggressive measures to increase in-place rents were diverse.
How to increase revenue in this environment is the question of the year. As Self Storage Association Hall of Fame member Bob Schoff, chairman of National Self Storage, has been saying for years, “You raise rates on an empty space.” So first, you must rent the space. But raising rates for existing tenants is an important way to sustain revenue growth.
An overall review of rental rates over time at the national and regional level is provided by data from Radius+ and past editions of MSM’s annual Self-Storage Almanac. This data shows that today’s prices are quite close to the rental rates in 2017. They are also close to the mid-way point between the high-low COVID price swing.
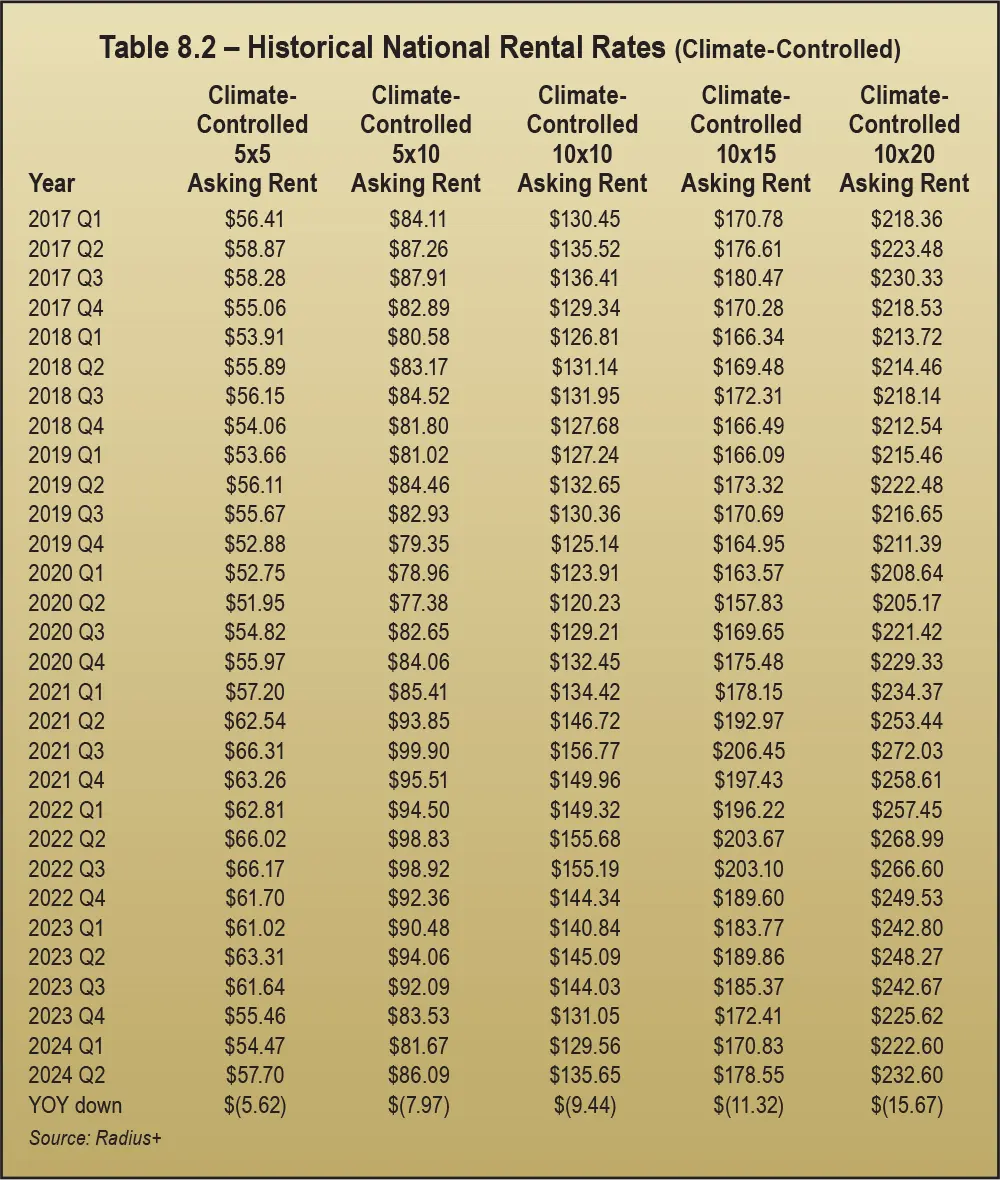
For non-climate-controlled units, Table 8.1 indicates that rental rates were down year over year (YOY) for all five sizes surveyed. Prices dropped by 8 percent for the smaller units and by 6 percent for the largest units; the price for 10-by-20s declined more than $10 from Q2 2023 to Q2 2024.
For the seven-year time frame reported (Q1 2017 to Q2 2024), the lowest rental rates for non-climate-controlled units were seen in Q2 2020, as the COVID pandemic hit full swing, based on both a blended average of all unit sizes and on 10-by-10 units.
Rental rates rapidly rose the following eight quarters until Q2 2022, to a high that was almost $22 higher for non-climate-controlled units than the Q2 2020 low. The biggest quarter-over-quarter jumps were in Q1 and Q2 of 2021.
In Q2 2023, one year after the Q2 2022 high, rental rates were an average of $4.50 lower than the year before. Advance the time frame one more year to Q2 2024, and there is another $7 price drop year over year, leaving current prices about $11.50 below the Q2 2022 high.
However, current rental rates in Q2 2024 are about $10.50 higher than the bottom of the early COVID low in Q2 2020.
At a little over $11.50 below the high and $10 above the low, that puts current rental rates in the middle of the COVID high-low swing. Current rental rates overall are quite close to the Q2 2019 rates before COVID altered the trajectory. At $107.56, the current price of a non-climate-controlled 10-by-10 unit is just $0.44 higher than the Q2 2019 price of $107.12.
Climate-controlled units, shown in Table 8.2, saw a somewhat larger drop in rental rates than non-climate-controlled units. Comparing Table 8.1 to 8.2, the YOY price drop was more substantial for climate-controlled units (down on average about $10) than non-climate-controlled units (down on average a little less than $7).
As measured by rental rates per unit, the climate-controlled low occurred in the same quarter as the non-climate-controlled units: Q2 2020. However, the high was a little earlier, in Q3 2021. As measured by a blended average, the gap between the high and the low was almost $38. Current rental rates are over $12 off the high, but they are over $25.50 above the low. Climate-controlled unit rental rates reached the mid-way point between the high and low last year in Q1 2023, earlier than the current mid-way point for non-climate-controlled units. So, climate-controlled unit rental rates peaked and fell off the COVID high earlier than non-climate-controlled units.
As for non-climate-controlled units, on average, current rental rates of climate-controlled units are very close to rates in Q3 2017 (about $0.50 lower than the blended average).
Tables 8.3 and 8.4 share rental rate data on a square-foot basis, as opposed to unit-based measures in Tables 8.1 and 8.2.
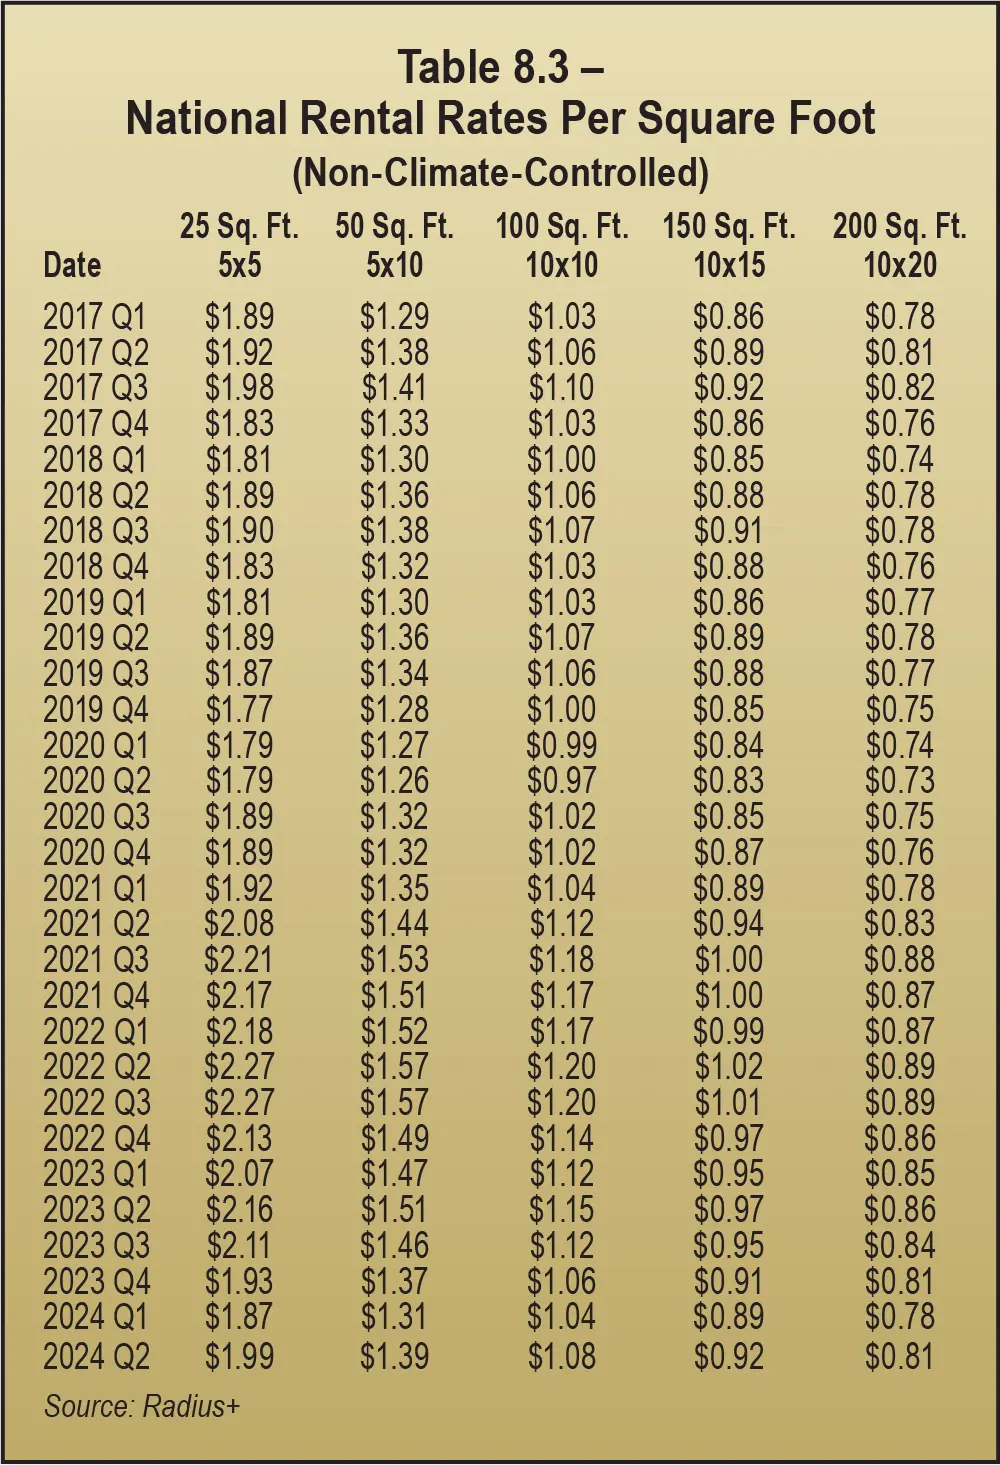
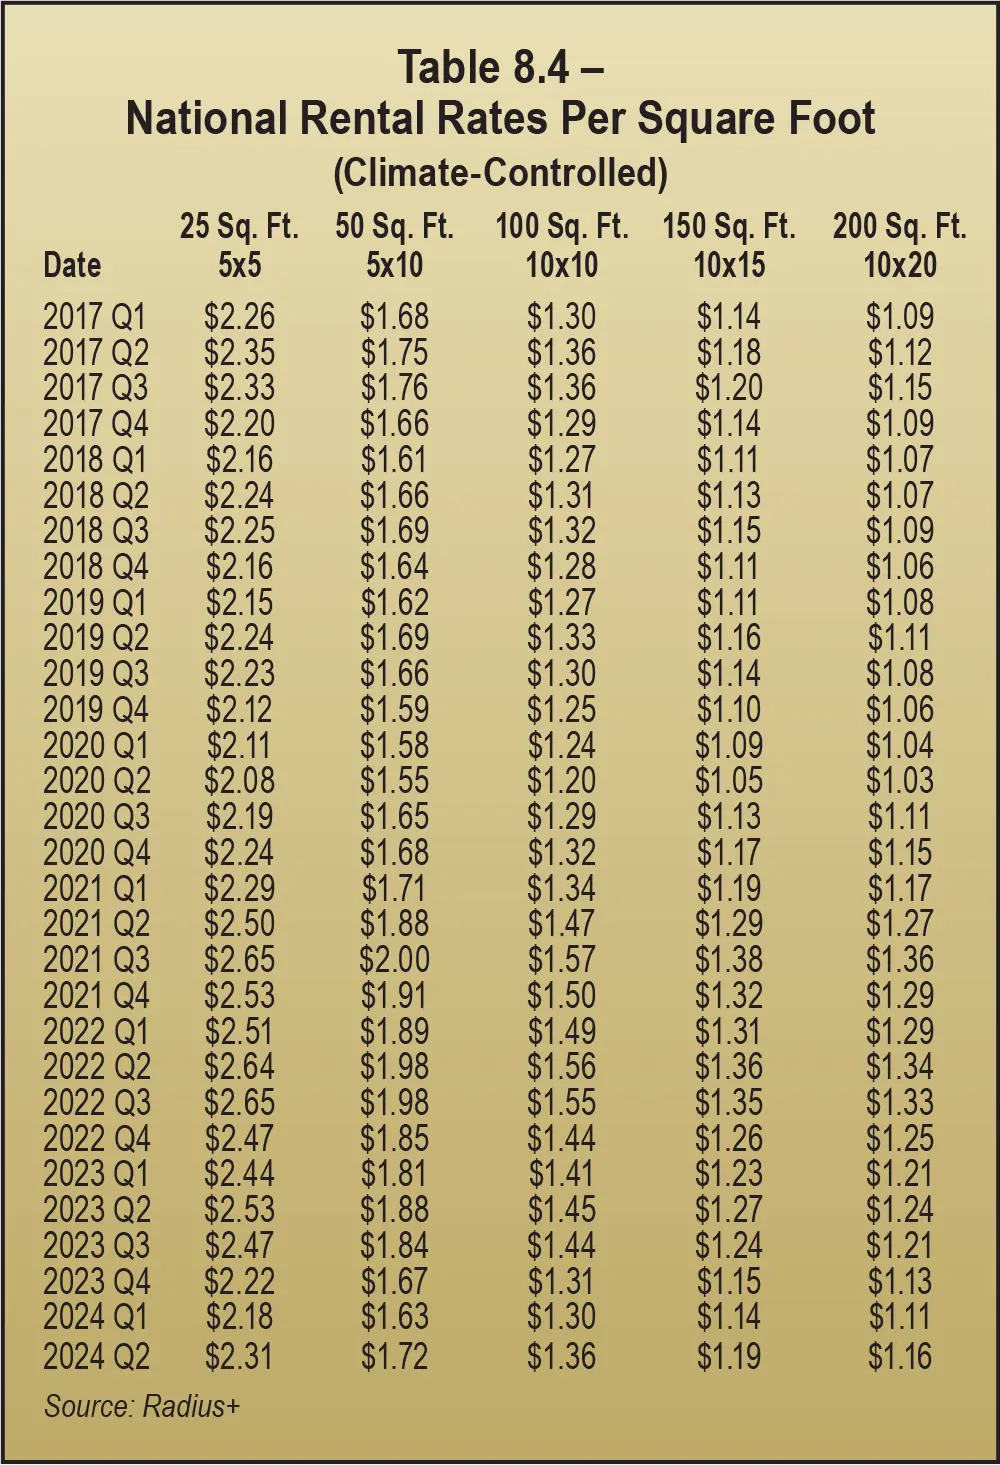
The COVID high-low swing’s average rental rate on a square-foot basis for non-climate-controlled space was $0.27. The Q2 2020 low blended average rental rate per square foot was about $1.12, while the high was $1.39 in Q3 2021.
YOY rental rates per square foot for climate-controlled space are down about $0.13 as a blended average. Prices are down about 9 percent per square foot for the smallest spaces and 6 percent for the largest spaces, for an average decline of about 8 percent.
The average price swing on a square-foot basis for non-climate-controlled space was $0.41 between the COVID high and low. The Q2 2020 low blended average rental rate per square foot was about $1.38, while the high was $1.79 in Q3 2021.
Analyzing the high and low of 10-by-10 non-climate-controlled rental rates shows a $0.37 range, from a low of $1.20 in Q2 2020 to a high of $1.57 in Q3 2021.
The mid-way point between the COVID high and low occurred in about Q1 2023, as measured by rental rates per square foot for non-climate-controlled space.
Current rates are $0.17 higher than the COVID low and $0.24 lower than the COVID high.
Charts 8.1 through 8.5 show normal bands of rental rates for five different unit sizes for both non-climate-controlled and climate-controlled space over time. Bands of normal pricing are visible for every size unit, with abnormally high pricing for every unit size clearly visible during the 10 quarters from Q2 2021 to Q3 2023.
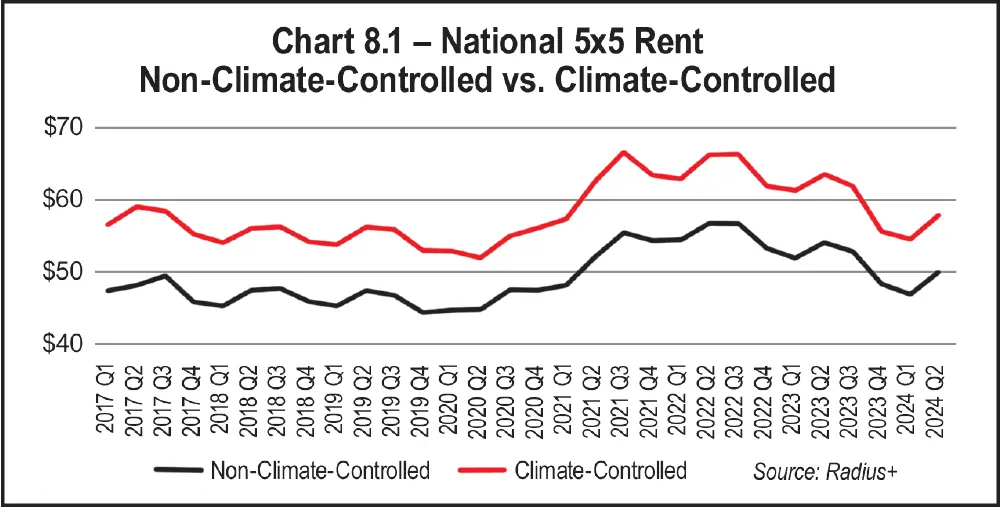
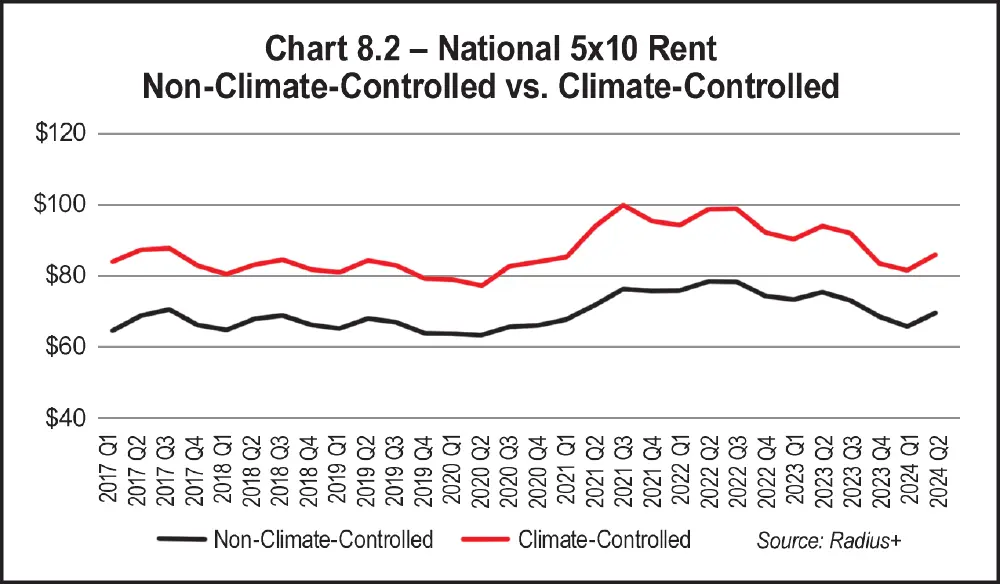
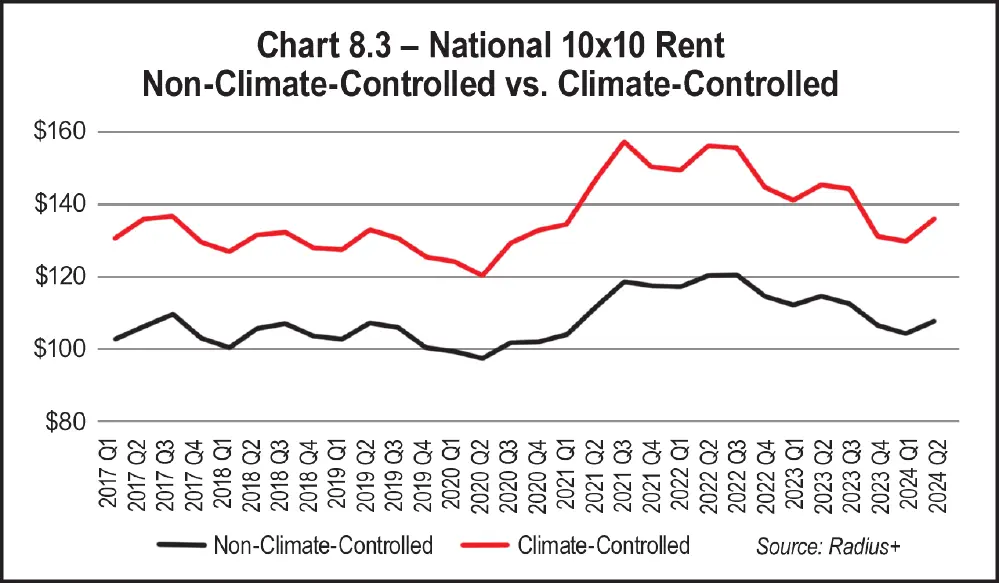
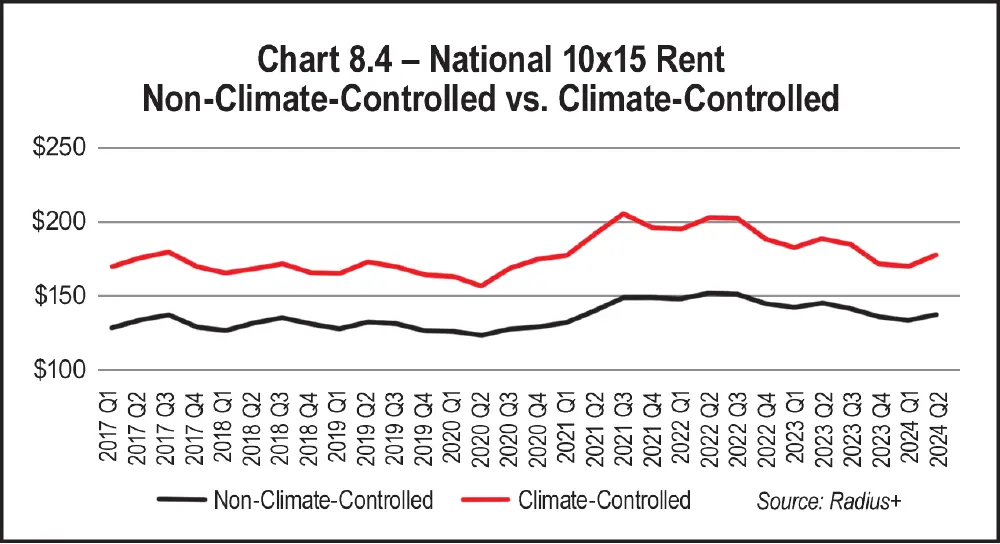
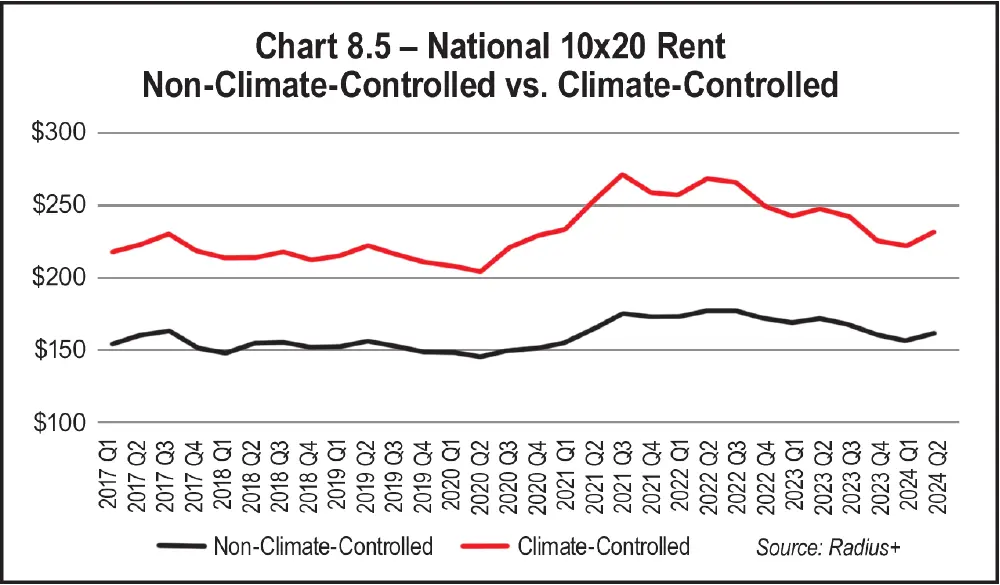
Continuing in like form, Chart 8.3 for 10-by-10s shows the same pattern at $40 higher. Non-climate-controlled 10-by-10s broke the $110 level and climate-controlled 10-by-10s broke the $140 level in Q2 2021. Rental rates remained above the $110 and $140 levels for the following 10 quarters, until Q4 2023, when rental rates went back into the normal range. They continued down until Q1 2024. While they were headed back up again in Q2 2024, they will likely hover below the $110 and $140 range.
And so, it continues with 10-by-15 units. Chart 8.4 for 10-by-15s repeats the same pattern at $30 higher. Non-climate-controlled 10-by-15s broke the $140 level and climate-controlled 10-by-15s broke the $180 level in Q2 2021. Rental rates remained above the $140 and $180 levels for the following 10 quarters, until Q4 2023, when rental rates returned to the normal range. They continued down until Q1 2024. Although they were once again moving upward in Q2 2024, they will likely remain under the $140 and $180 range.
Rates only dropped 2 percent in the West (Pacific) region but were down 12 percent in the South Atlantic, followed closely by the Midwest (East North Central) and Northeast (Middle Atlantic), both with rate decreases of 11 percent. The rest of the regions experienced rate drops from 5 percent to 7 percent.
States are divided among nine regions:
- Midwest (East North Central) – Illinois, Indiana, Michigan, Ohio, and Wisconsin (east of the Mississippi River)
- Midwest (West North Central) – Iowa, Kansas, Minnesota, Missouri, Nebraska, North Dakota, and South Dakota (west of the Mississippi River)
- Northeast (Middle Atlantic) – New Jersey, New York, and Pennsylvania
- Northeast (New England) – Connecticut, Maine, Massachusetts, New Hampshire, Rhode Island, and Vermont
- South Atlantic – Delaware, Florida, Georgia, Maryland, North Carolina, South Carolina, Virginia, West Virginia, and Washington, D.C.
- South (East South Central) – Alabama, Kentucky, Mississippi, and Tennessee
- South (West South Central) – Arkansas, Louisiana, Oklahoma, and Texas
- West (Mountain) – Arizona, Utah, New Mexico, Montana, Colorado, Idaho, Nevada, and Wyoming
- West (Pacific) – California, Oregon, Washington, Alaska, and Hawaii
As always, larger units continue to deliver more revenue, because the rent is higher, but smaller units command a higher price per square foot. In 2024, for both unit pricing and square foot pricing, climate-controlled 5-by-5s achieved the highest rent of all unit sizes and types. The regions with the highest 5-by-5 rental rates are the West (Pacific) and the Northeast (New England). See Table 8.5 and Table 8.6.
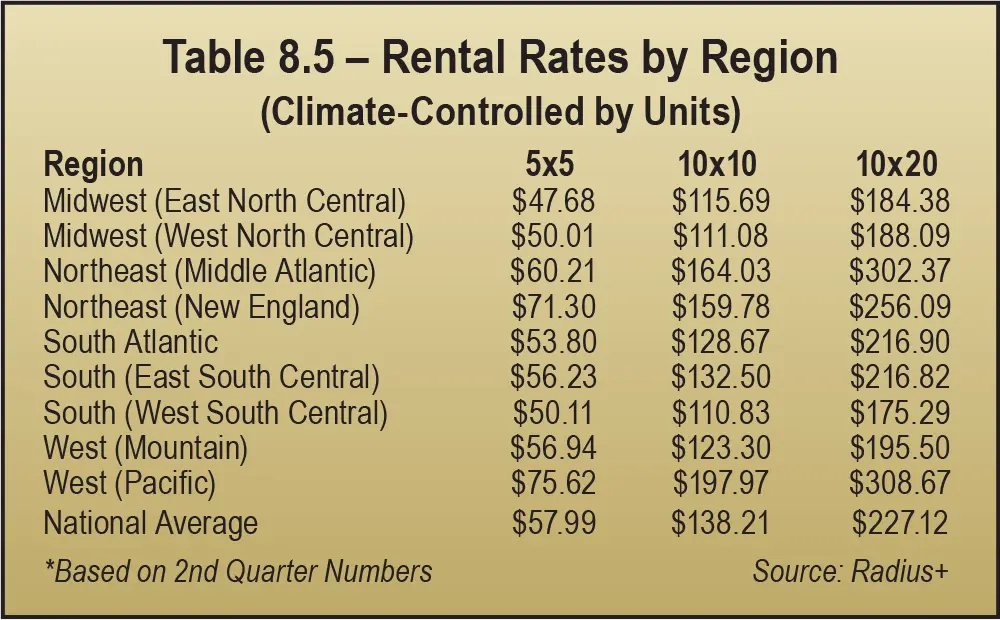
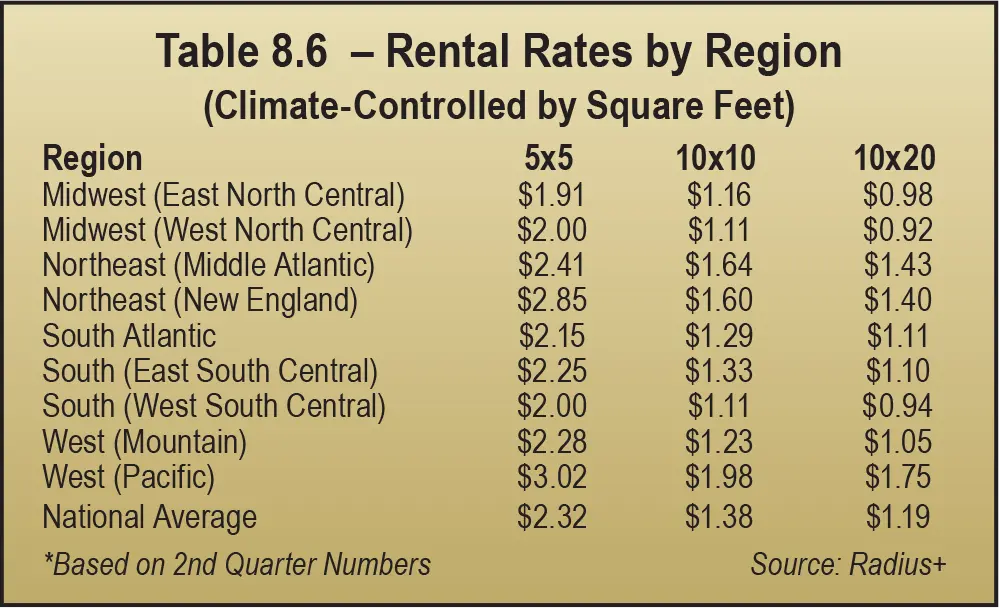
Several regions cluster around the lowest unit pricing for all sizes in 2024: the two Midwest regions (East North Central and West North Central) and South (West South Central).
Based on a blended average of unit pricing, the South (West South Central) region has the lowest rates, whereas the West (Pacific) has the highest. In fact, the West (Pacific) has the highest rates in every size.
The South (West South Central) region has the lowest rates for all unit sizes except 10-by-10s. The Midwest (East North Central) has the lowest rates for 10-by-10s.
Comparing 5-by-5s across the regions in 2024, the Midwest (East North Central) region has the lowest rates. But for medium-sized units (10-by-10) and large units (10-by-20), the South (West South Central) region has the lowest rates. See Table 8.6 and Chart 8.7.
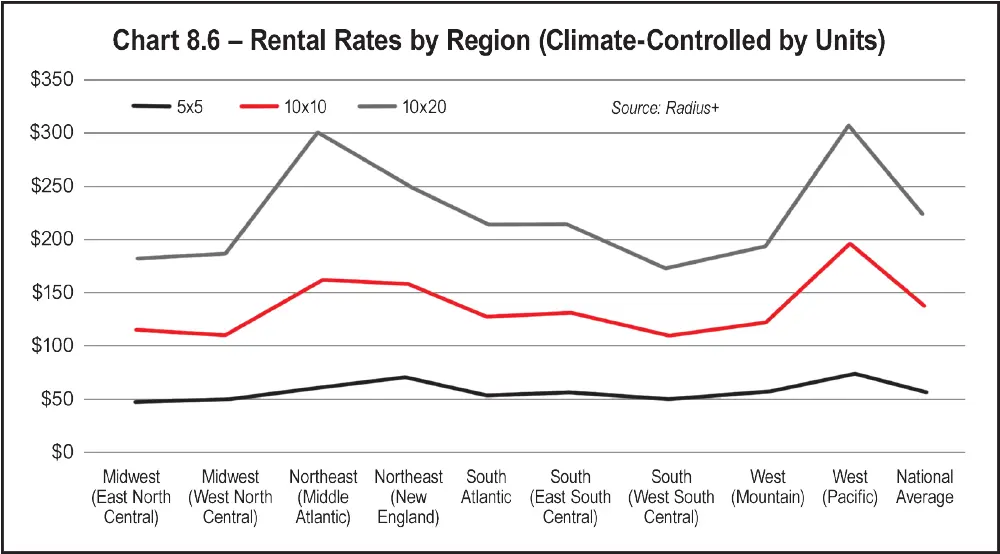
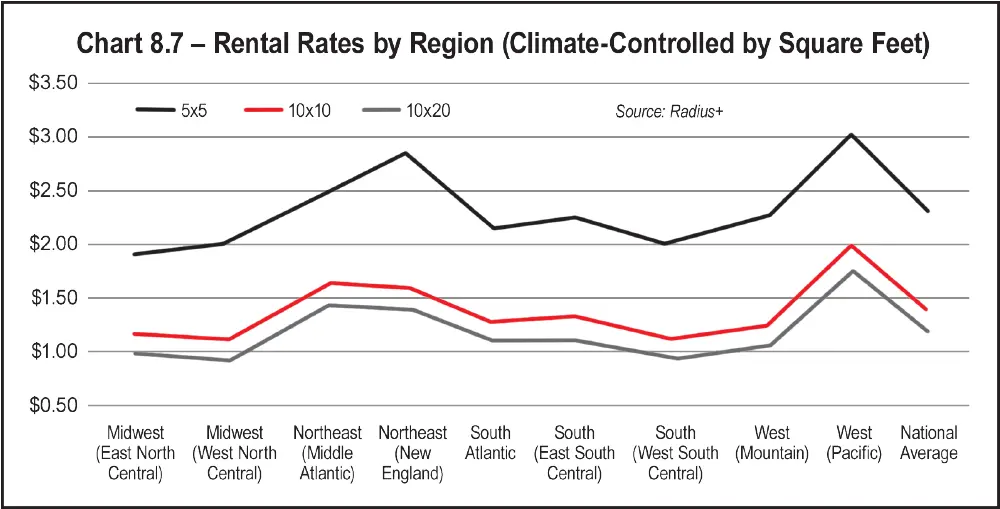
As for unit pricing, the same three regions cluster around the lowest square-foot pricing for all sizes: the two Midwest regions (East North Central and West North Central) and South (West South Central).
Based on price per square foot, the blended average rental rates in the Midwest (West North Central) region were at the bottom in 2024.
Rental rate per square foot for 5-by-5s is lowest in the Midwest (East North Central) region.
Rental rates per square foot for 10-by-10s and 10-by-20s are lowest in the Midwest (West North Central) and South (West South Central) regions.
Measured in unit pricing, YOY rental rates (from Q3 of 2023 to Q2 of 2024) for climate-controlled units were down an average of 11 percent in the Midwest (East North Central) region. Rent for 5-by-5s declined the most at 14 percent. See Table 8.7.
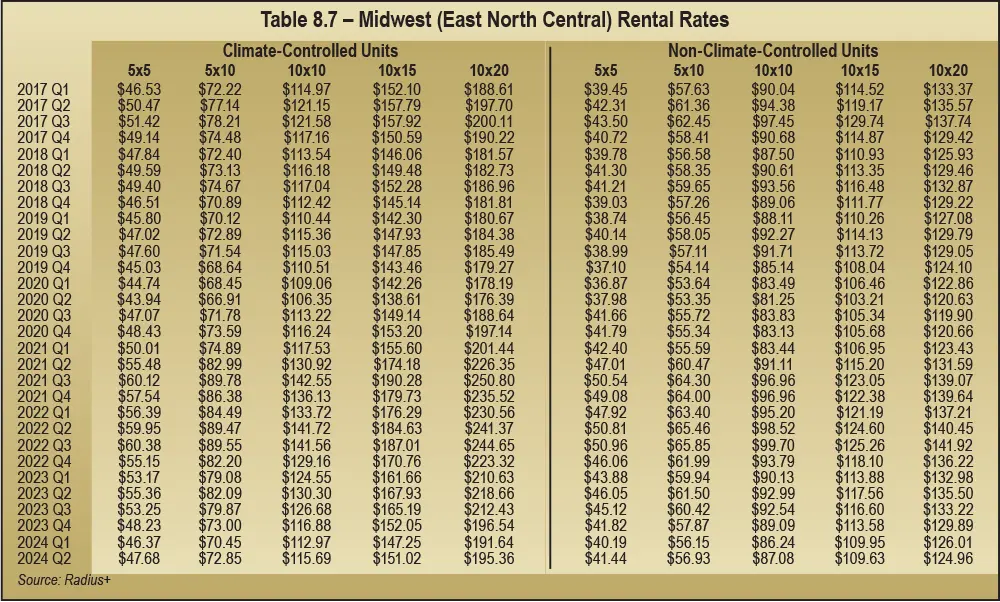
Measured in price per square foot, climate-controlled rental rates in 2024 were down an average of 12 percent YOY in the Midwest (East North Central) region. Rent for 5-by-5s (measured by both units and square feet) declined the most at 14 percent down. See Table 8.8 and Table 8.9.
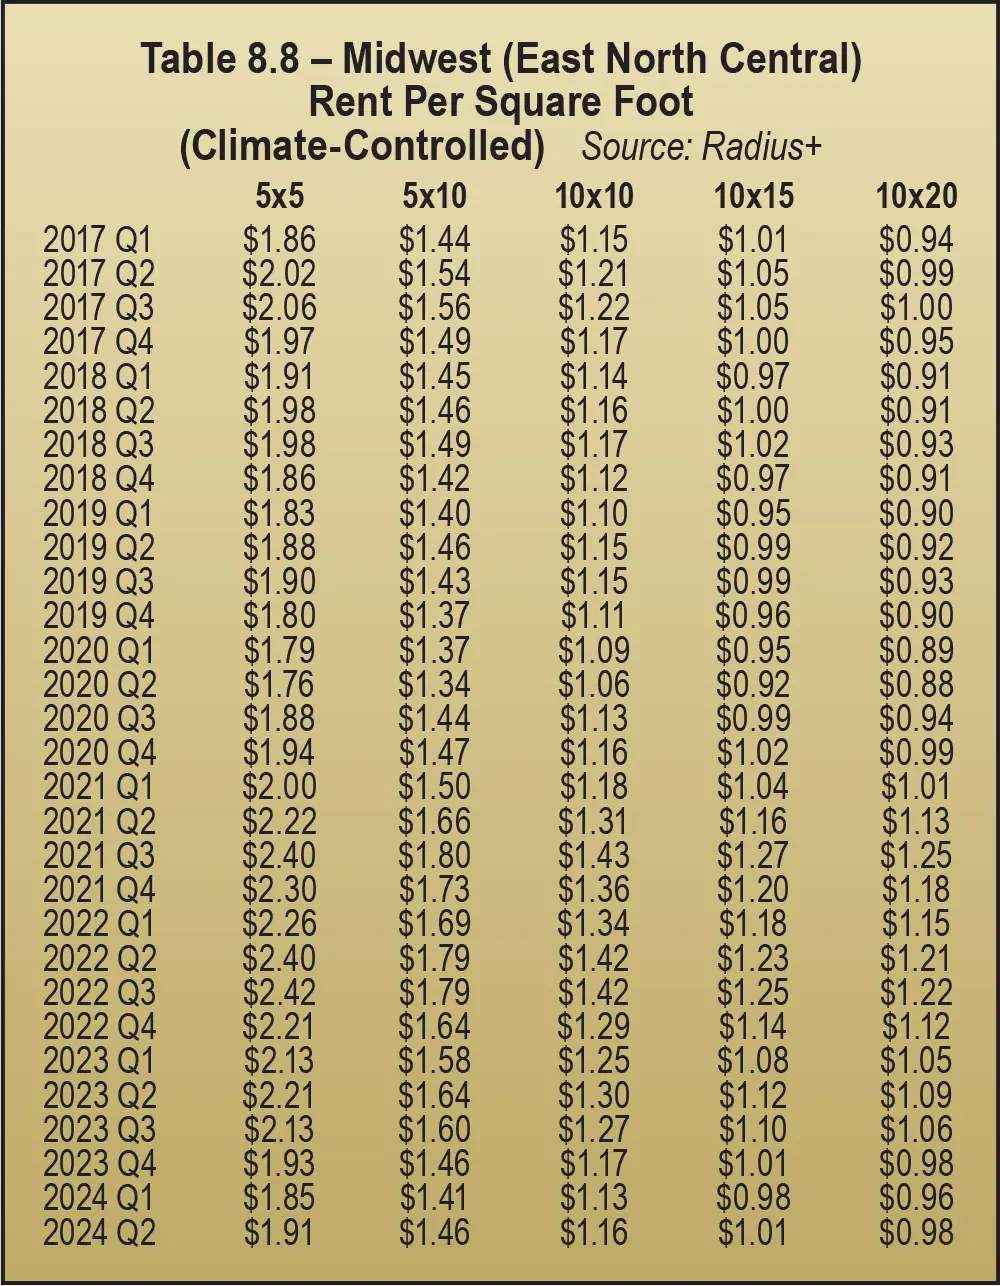
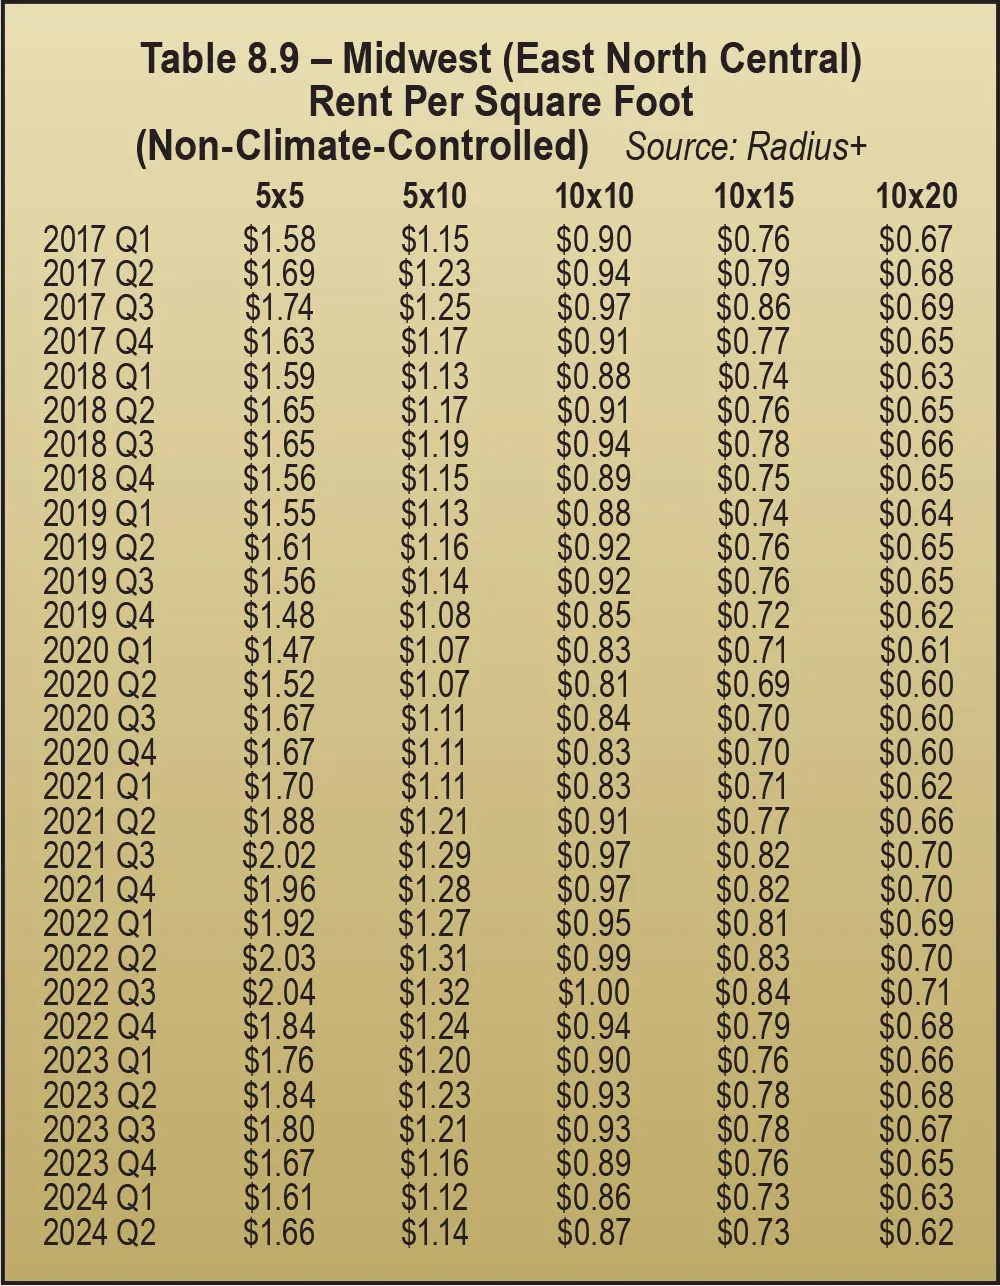
Rental rates in the Midwest (West North Central) region dropped half as much as the Midwest (East North Central) region. See Table 8.10.
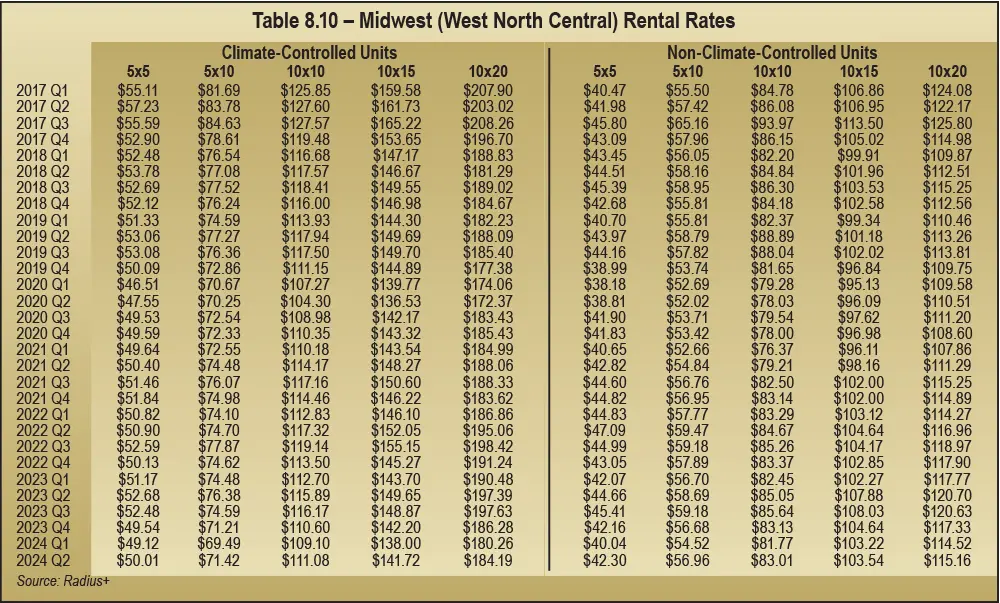
Non-climate-controlled rates fared a little better but were still down. YOY rental rates declined an average of 4 percent. The smallest units (5-by-5s) and largest units (10-by-20s) were down the most at 5 percent, but the medium-sized units (10-by-10s) were down the least at 2 percent.
In the Midwest (West North Central) region, prices measured by square foot for climate-controlled space were down an average of 6 percent YOY in 2024. Square foot rent for 10-by-10s dropped less (4 percent); larger units’ rents dropped more (7 percent down for 10-by-20s). See Table 8.11 and Table 8.12.
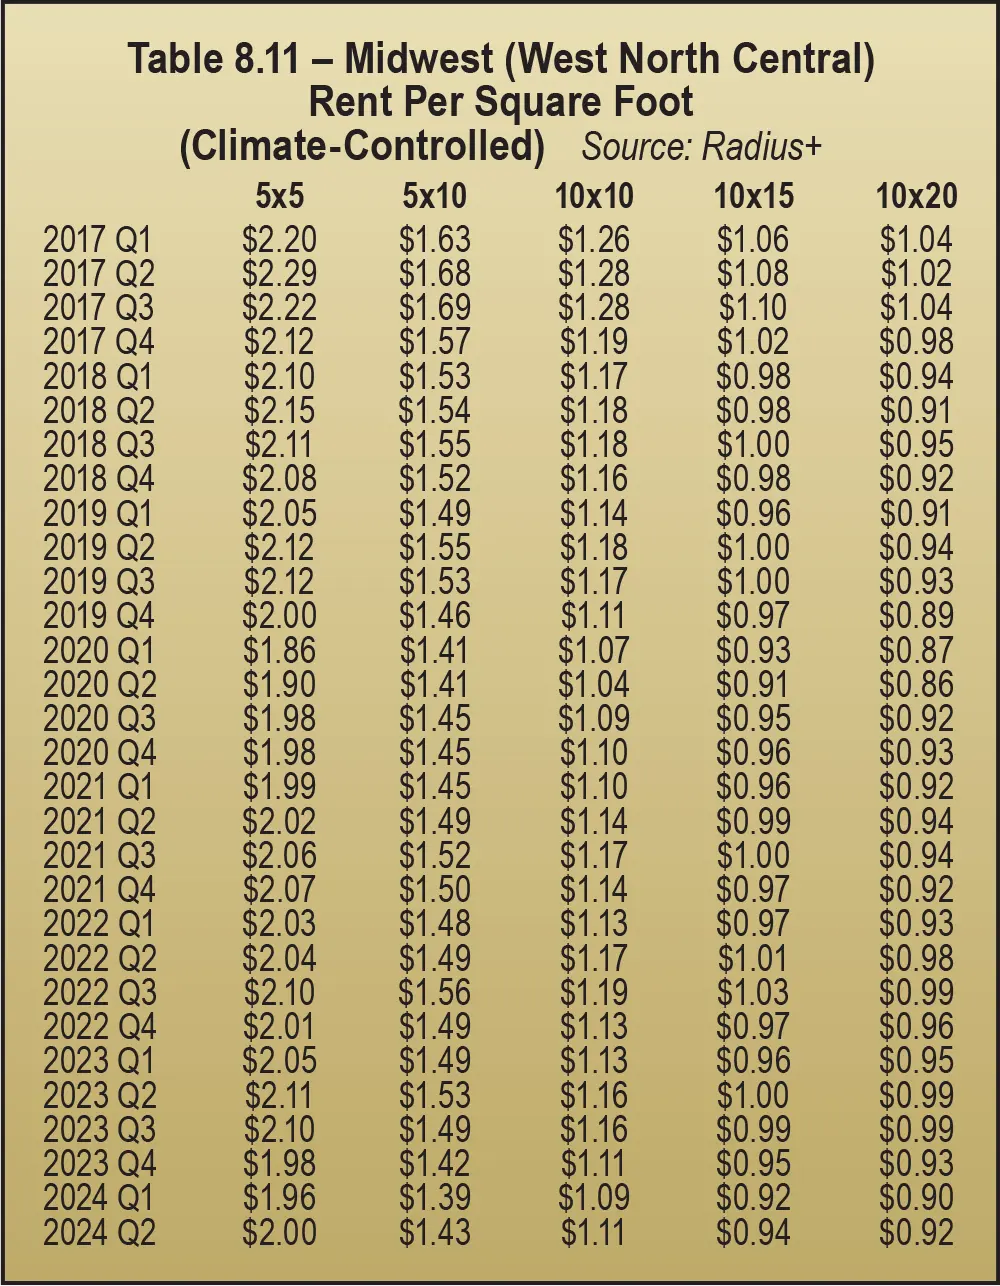
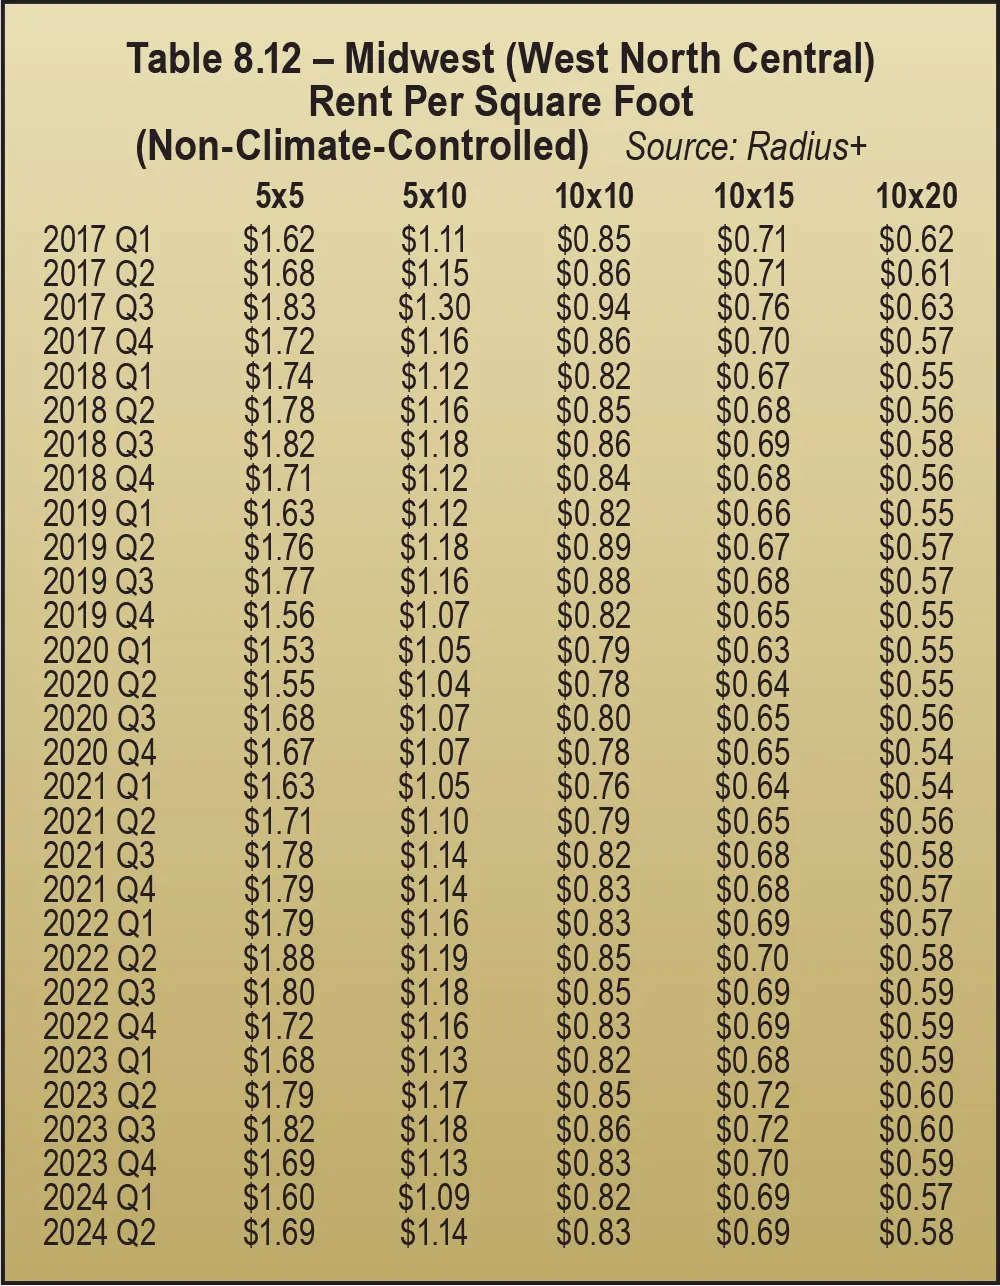
In 2024, measured in unit pricing, YOY rental rates for climate-controlled units were down an average of 11 percent in the Northeast (Middle Atlantic) region. The smallest units (5-by-5s) were down the most at 15 percent. See Table 8.13.
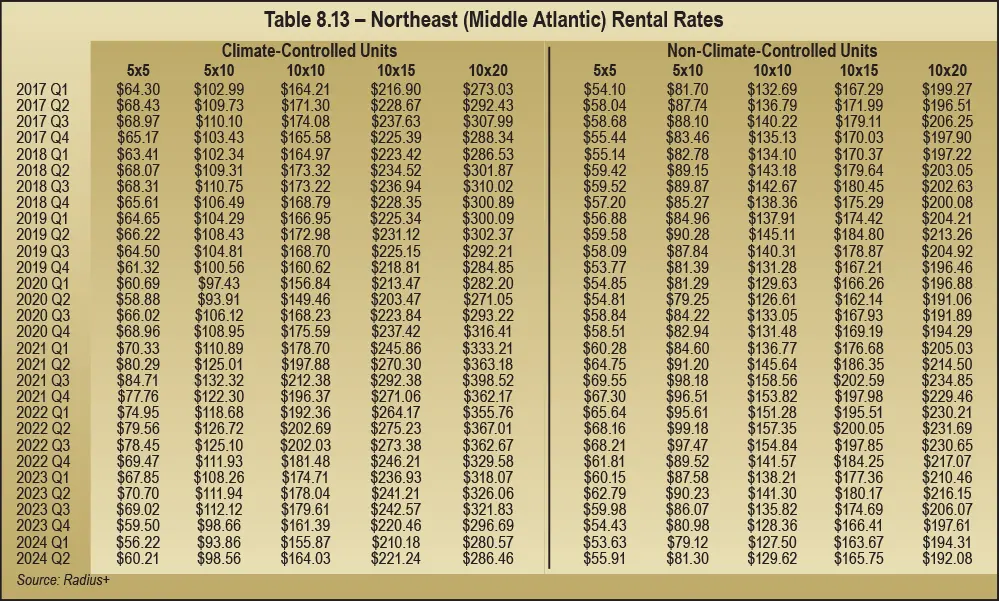
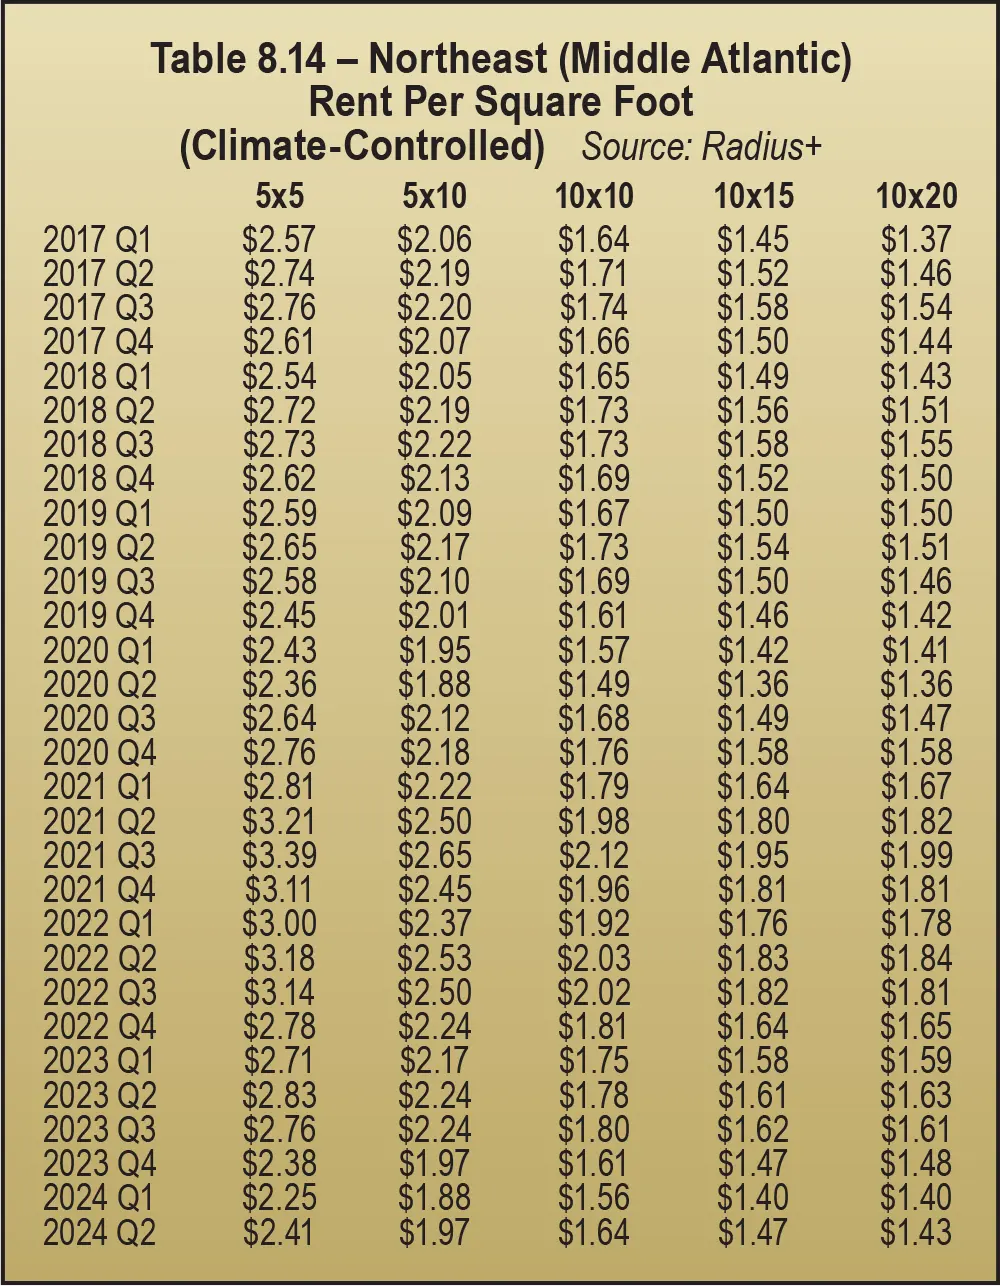
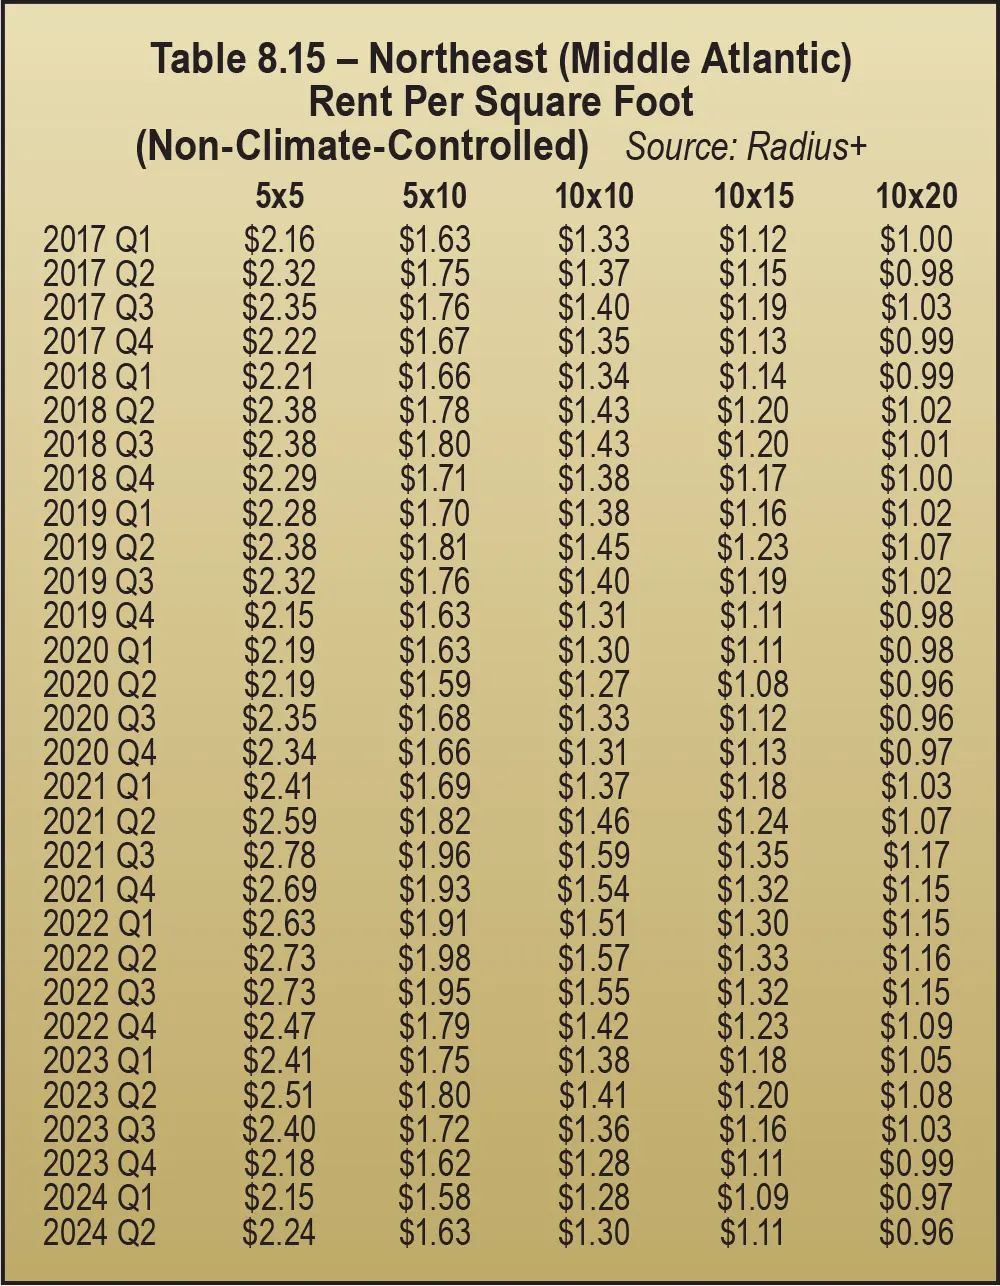
Climate-controlled rental rates in the Northeast (New England) region dropped half as much as rates in the Northeast (Middle Atlantic). Measured in unit pricing, YOY rental rates for climate-controlled units were down on average only 5 percent, and the smallest units (5-by-5s) were down the least (4 percent). See Table 8.16.
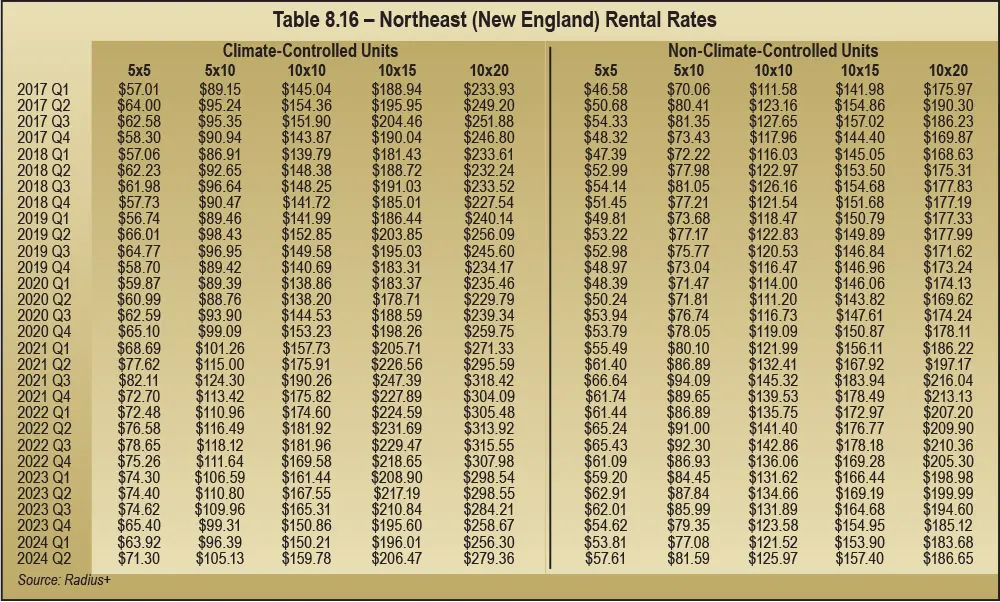
Rental rates in the Northeast (New England) region, measured by square feet for climate-controlled space, also declined an average of 5 percent YOY, fairly evenly down for all unit sizes. See Table 8.17 and Table 8.18.
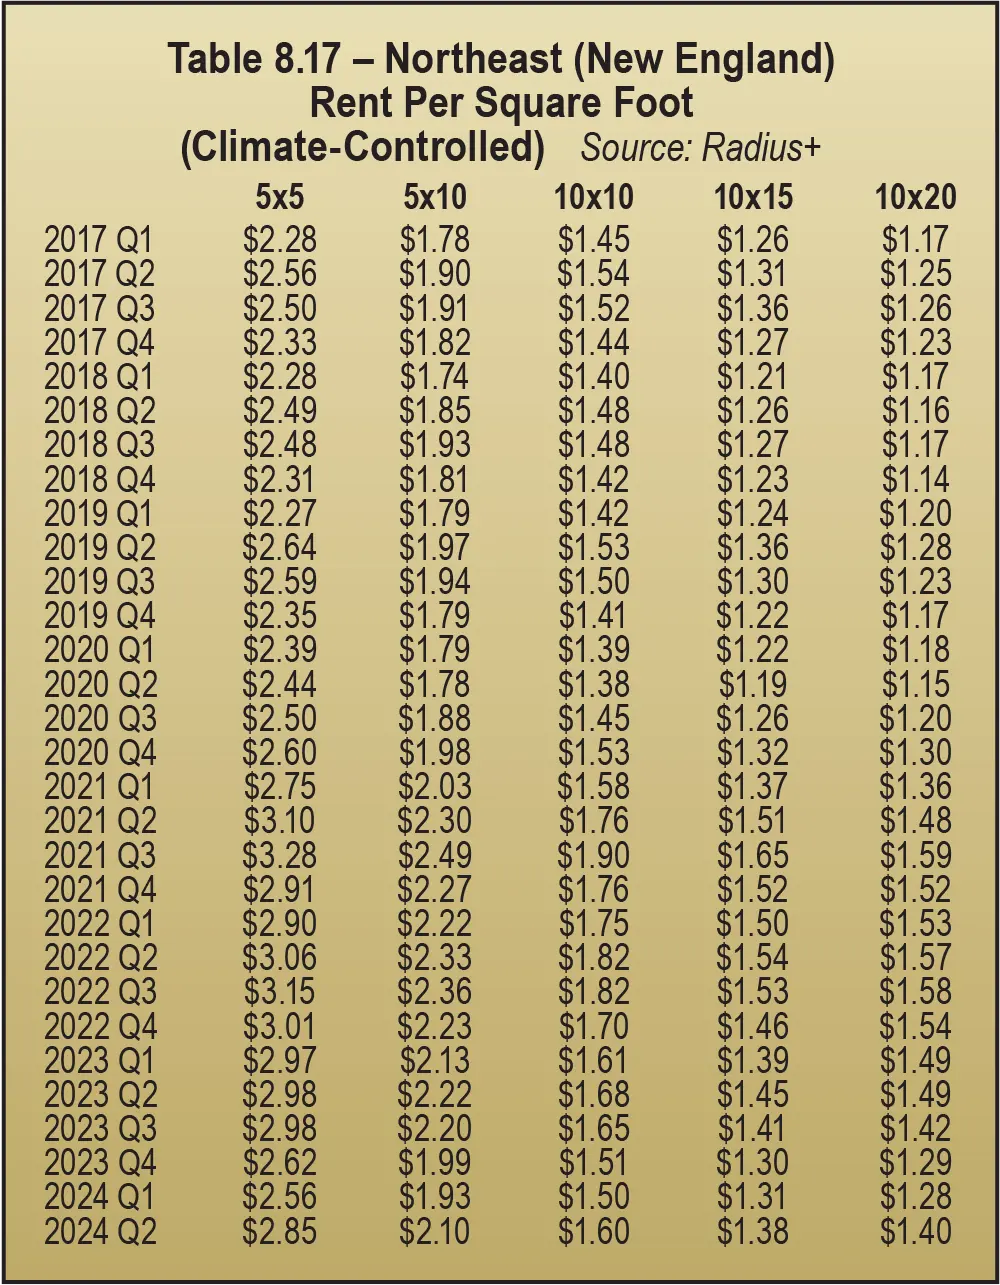
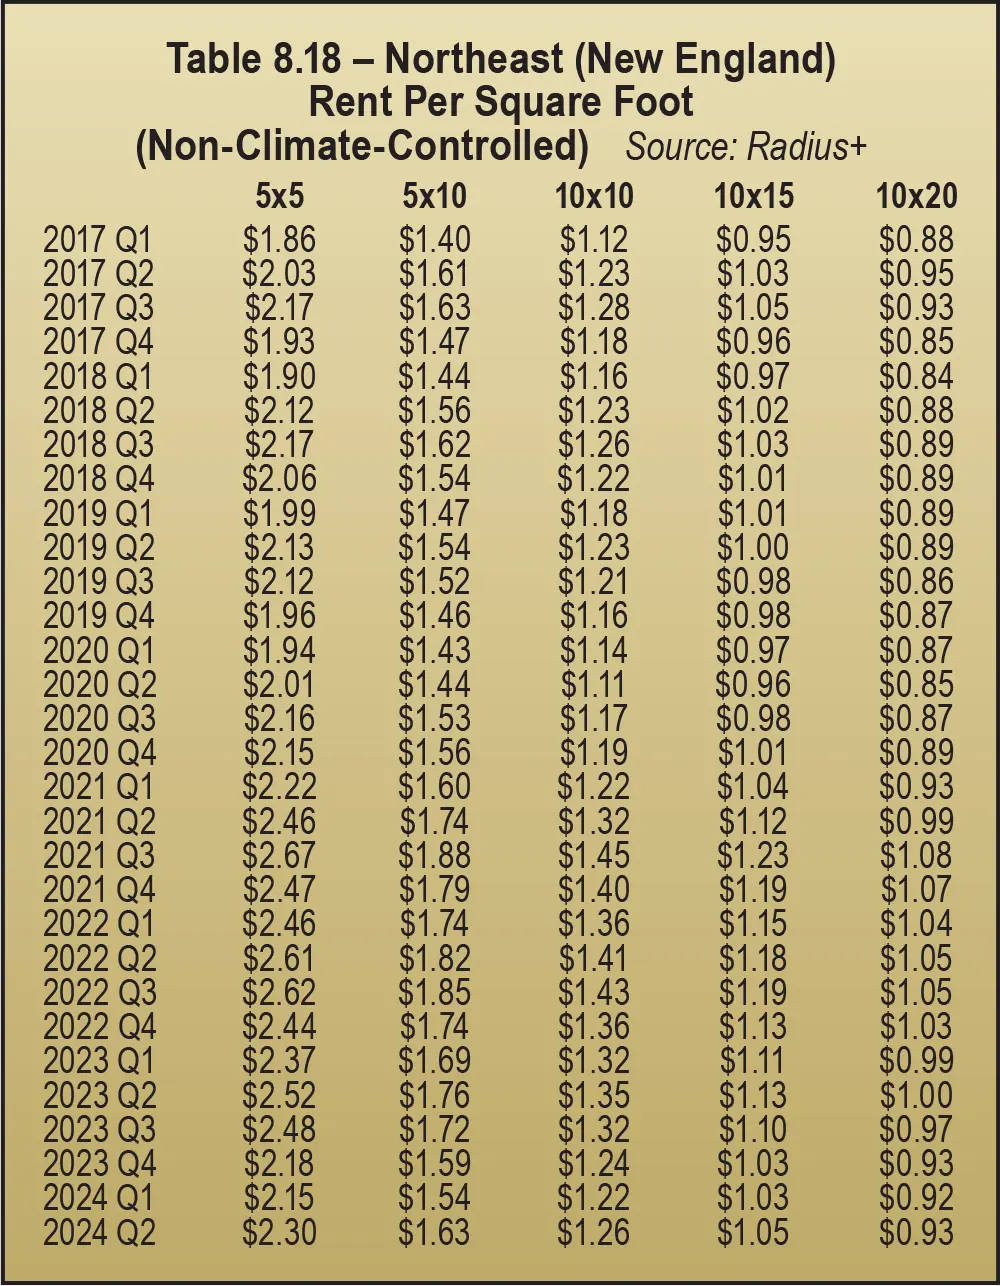
Measured in unit pricing, YOY rental rates for climate-controlled units were down 12 percent on average, the largest regional decline. The smaller units (5-by-5s and 5-by-10s) experienced the most substantial rate drops (15 percent and 14 percent, respectively).
Non-climate-controlled rates dropped a little less (10 percent). Oddly, rates for 10-by-15s were only down 7 percent.
In this region, rental rates measured by square feet for climate-controlled space were down a little more than rental rates by unit. The average decline was 13 percent YOY. Small units (5-by-5s) were down 15 percent and 10-by-15s were down only 10 percent in the South Atlantic region. See Table 8.19.
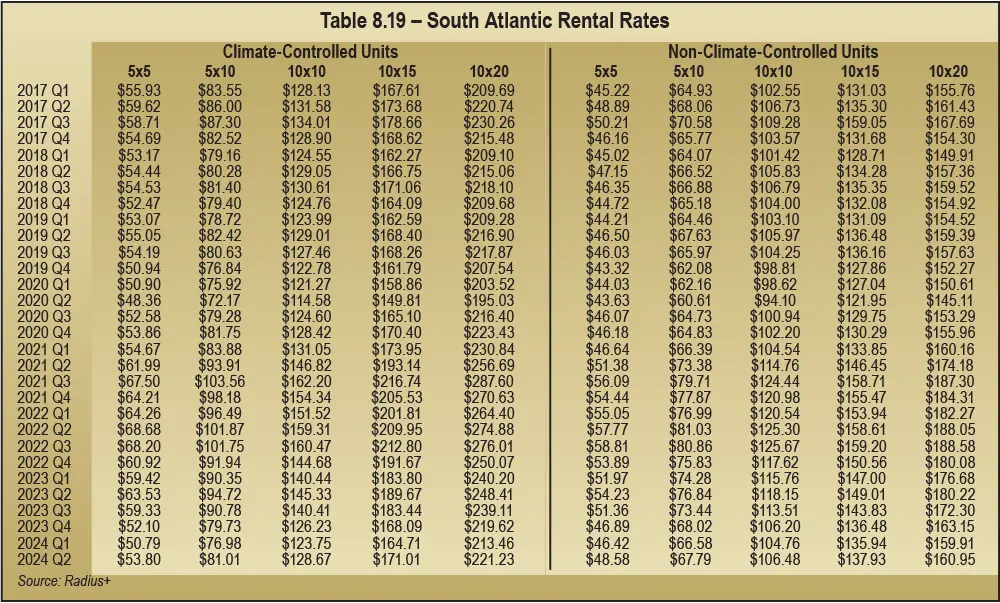
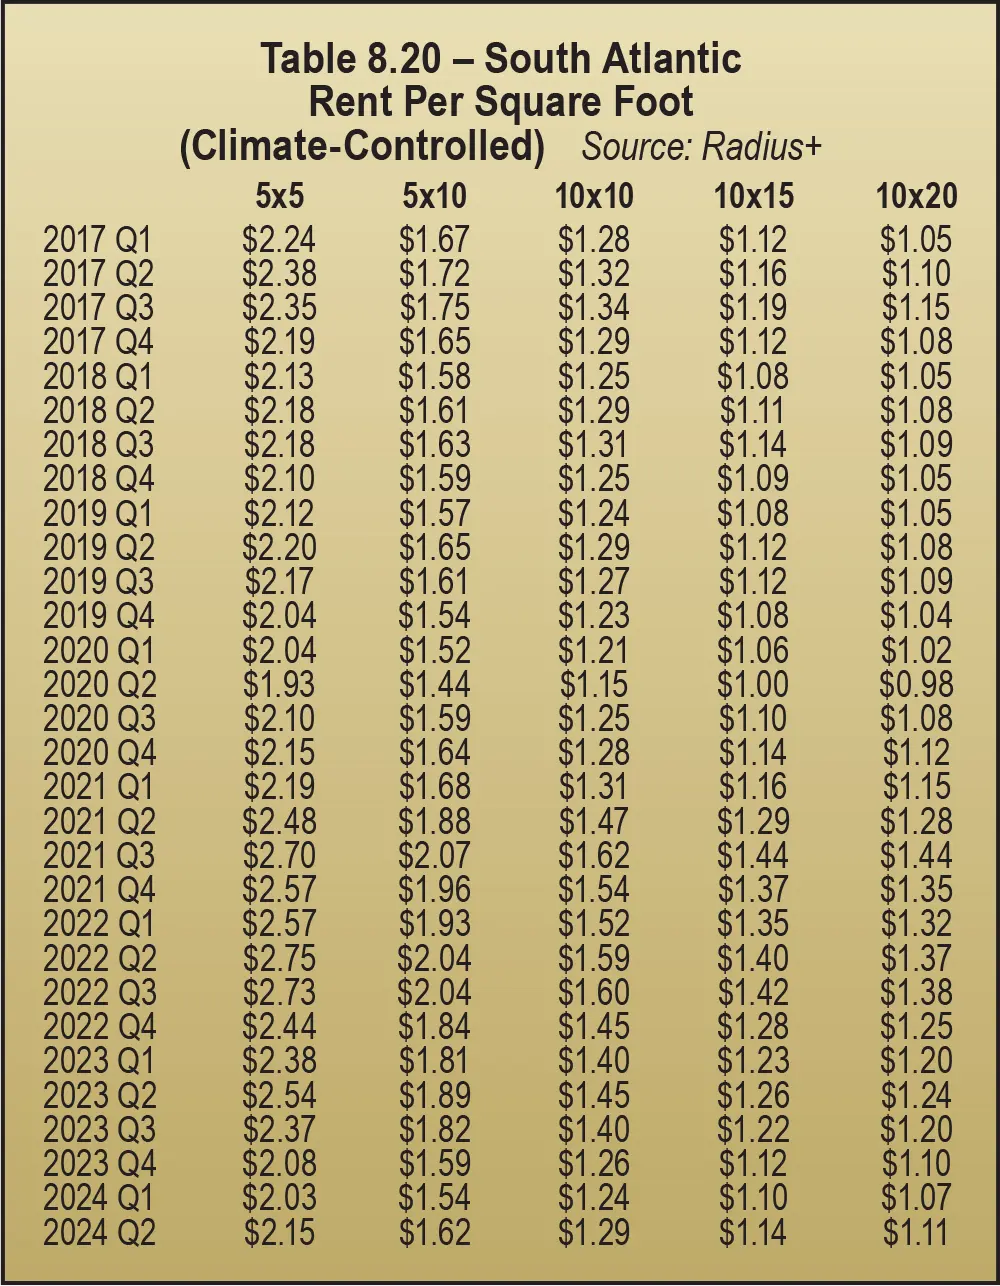
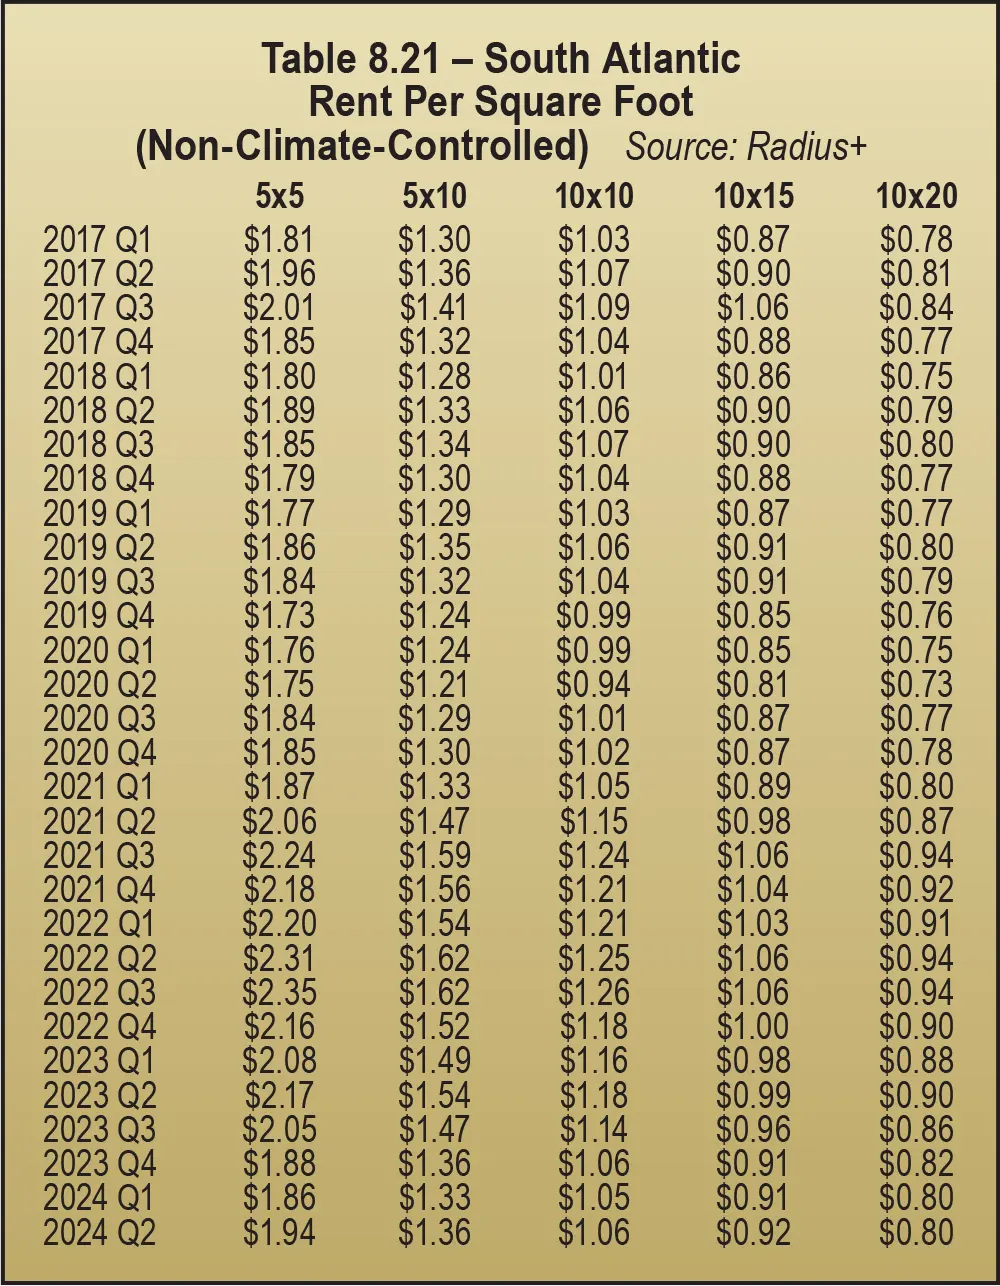
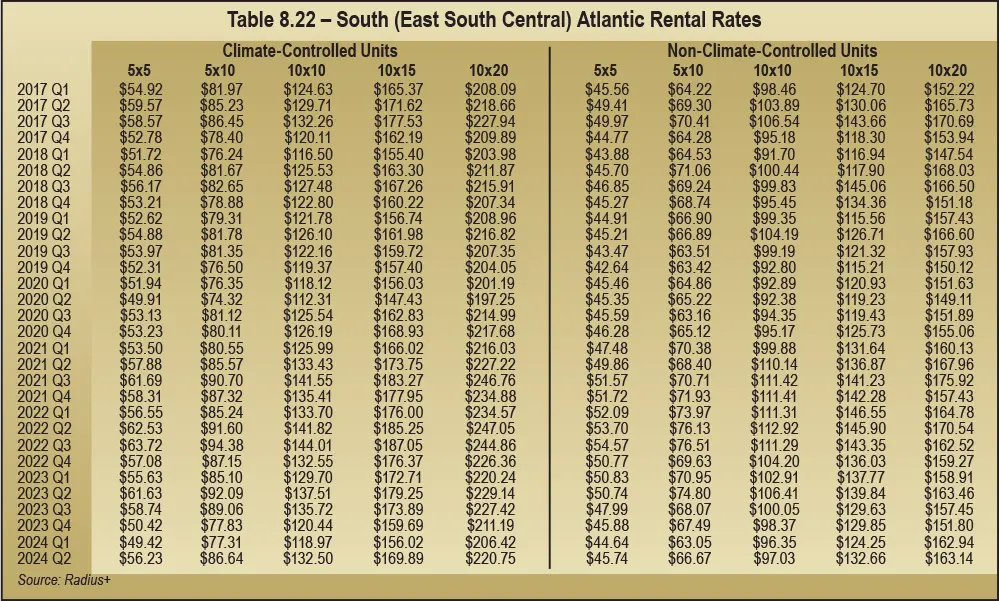
In 2024, in the South (East South Central) region, measured by square feet for climate-controlled space, rates were down 6 percent YOY, with rent for 5-by-5s down 9 percent. See Table 8.23 and Table 8.24.
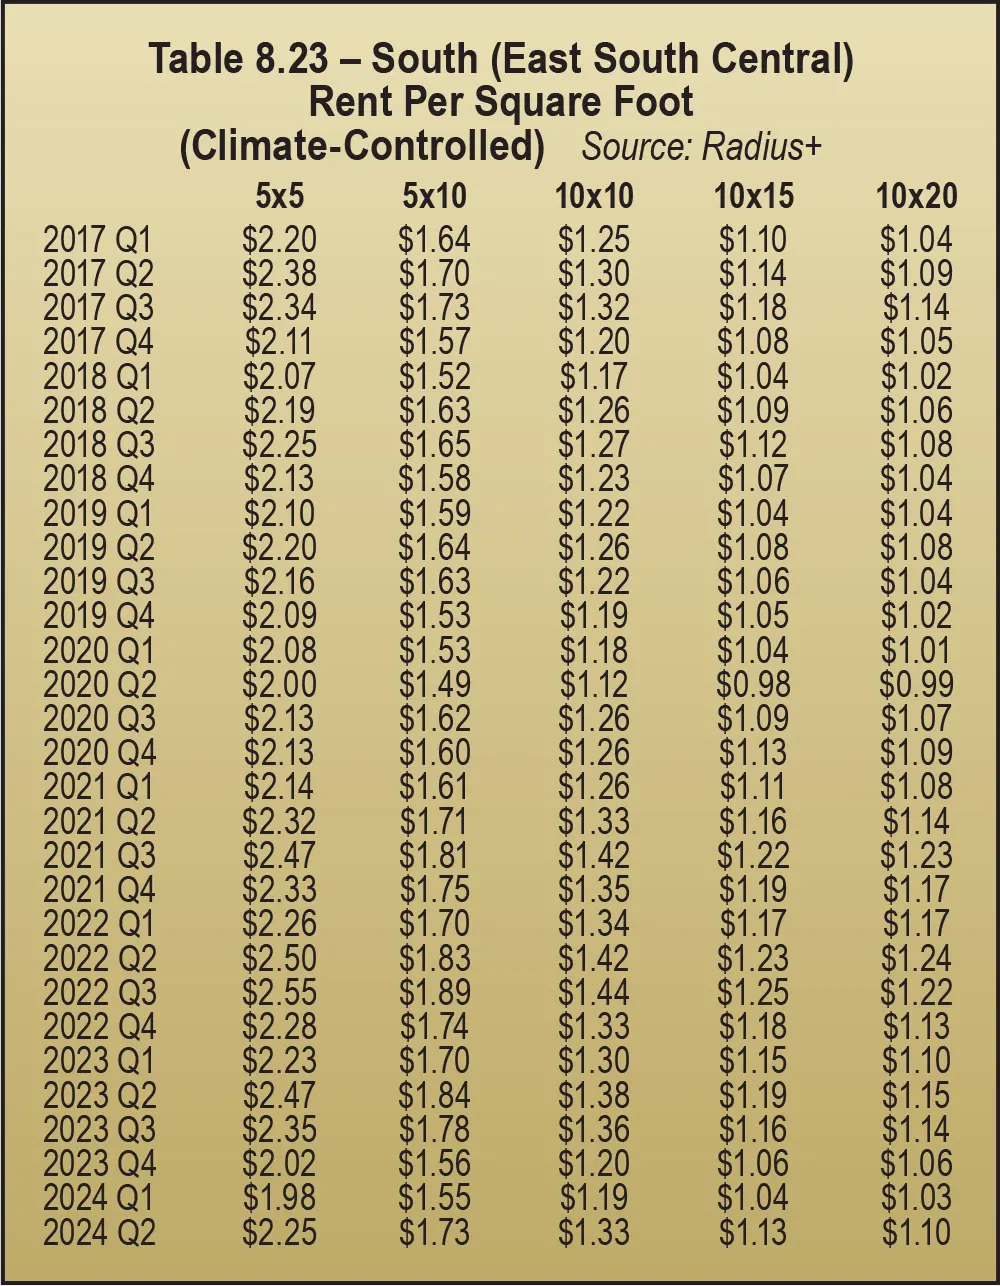
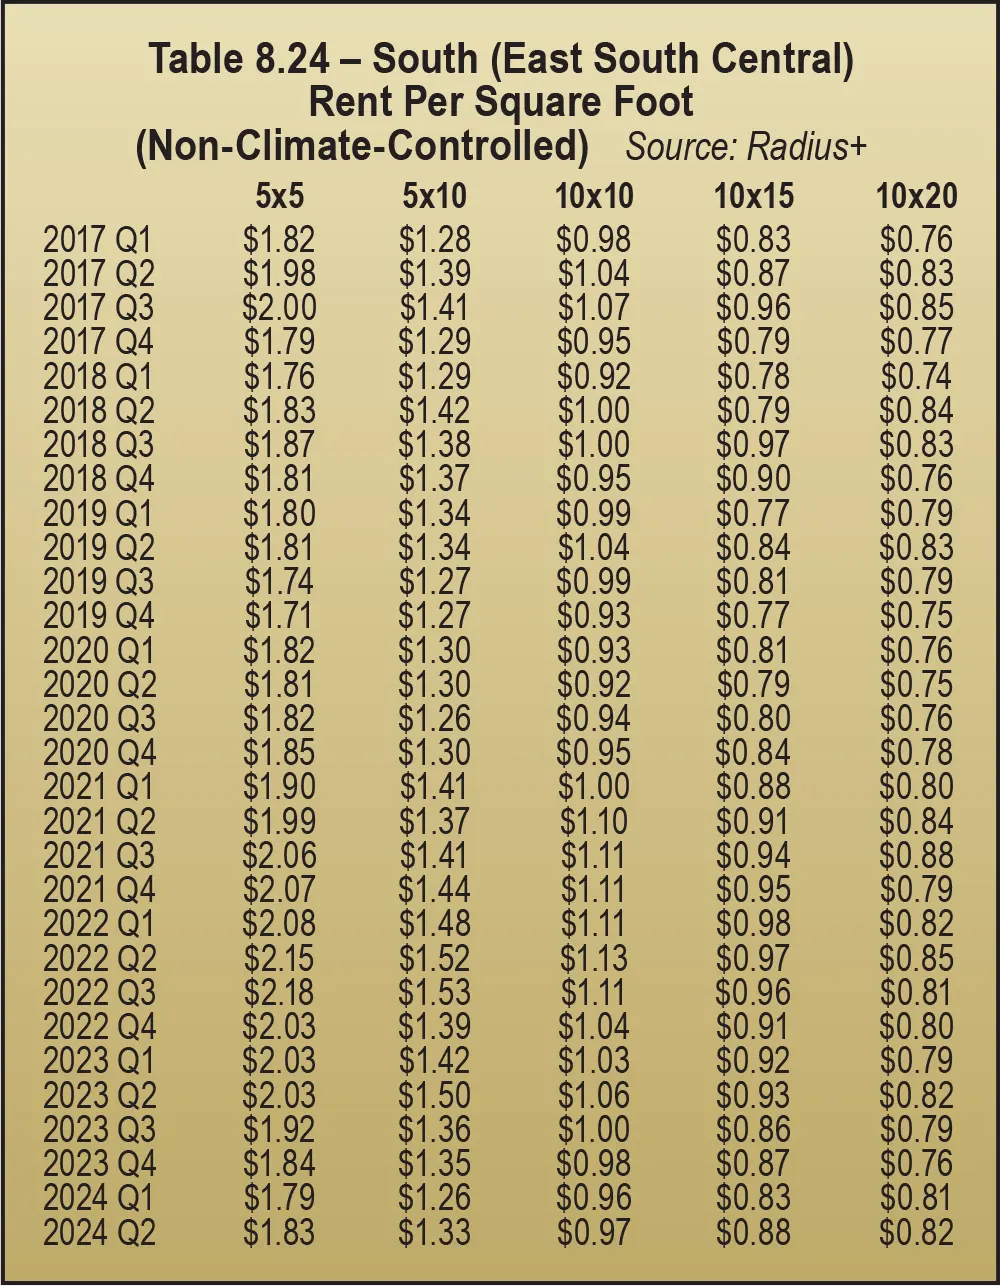
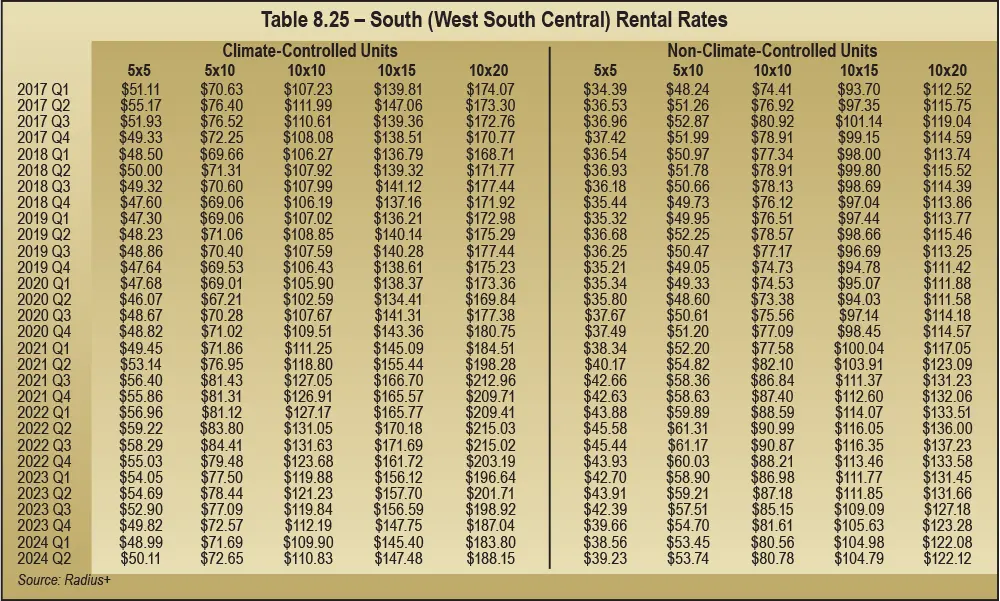
Rental rates in the South (West South Central) region, measured by square feet for climate-controlled space, were down 8 percent YOY, but rates for 10-by-15s decreased the least (6 percent).
Non-climate-controlled rates measured by square foot dropped a bit more, at 9 percent down. As for climate-controlled space, the smallest units (5-by-5s) saw the largest rental rate decline (11 percent). See Table 8.26 and Table 8.27.
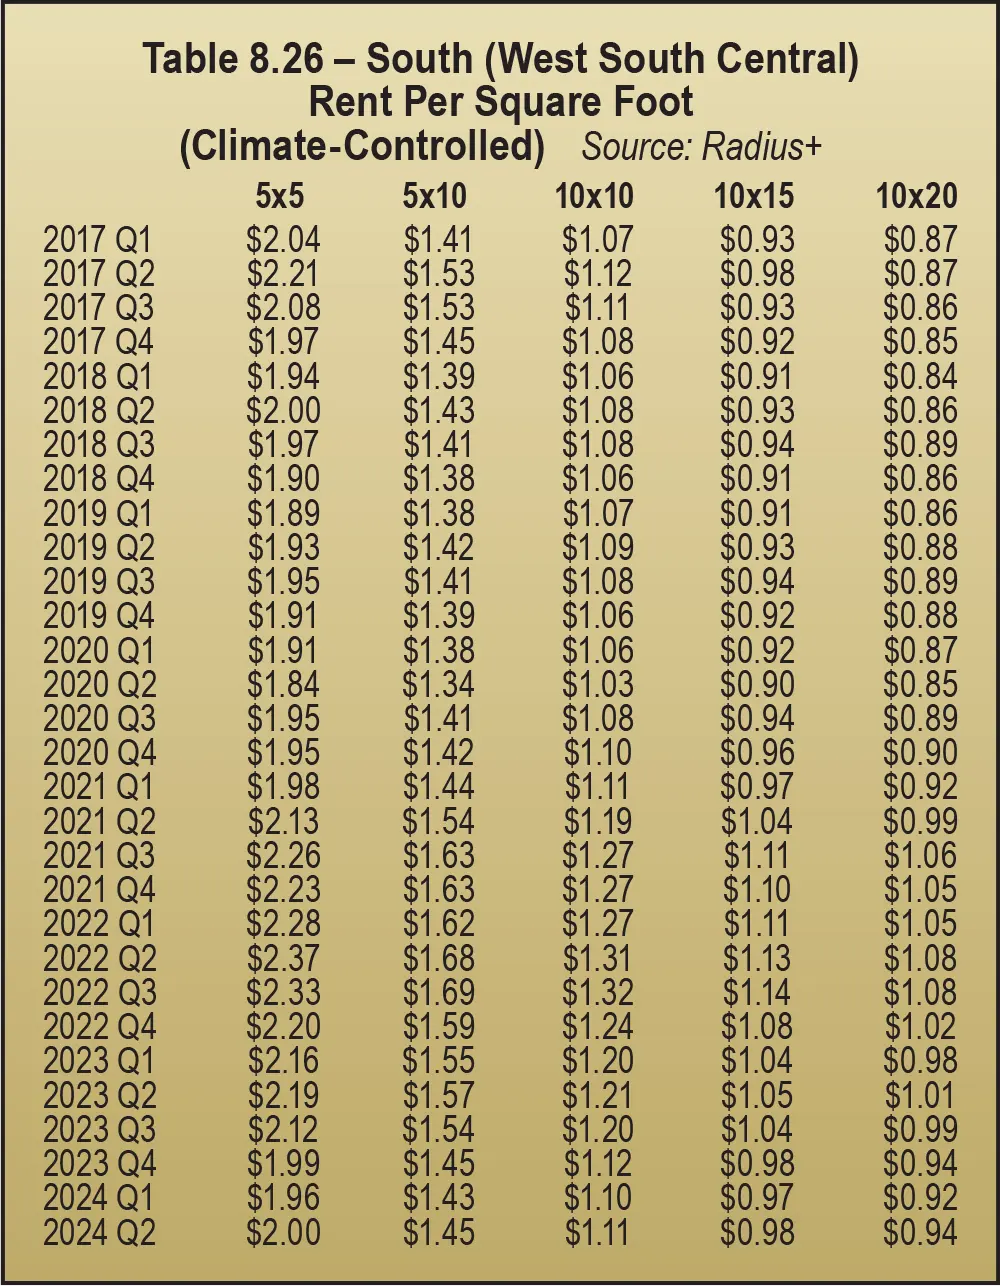
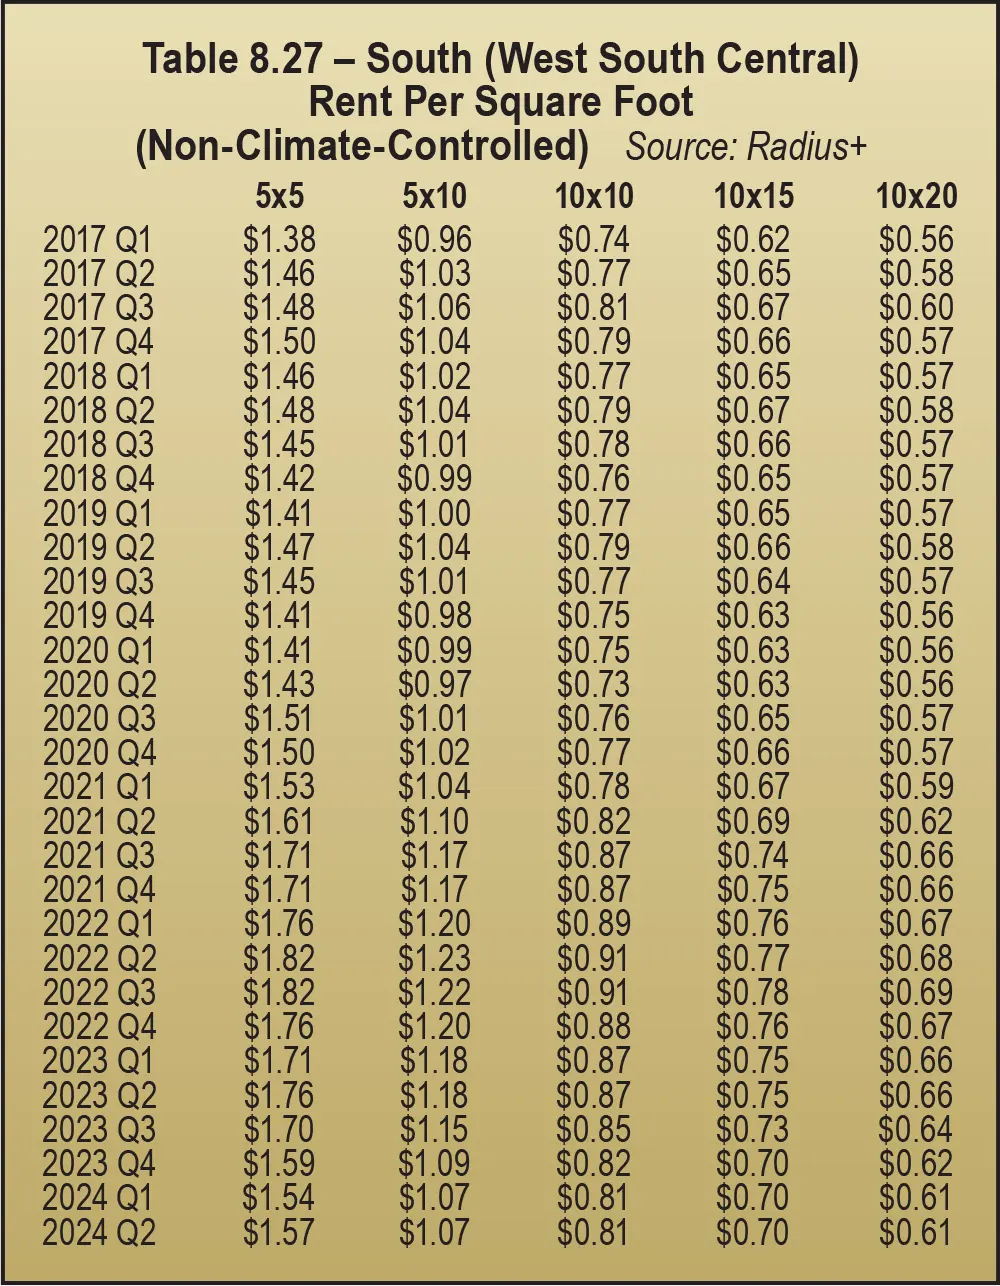
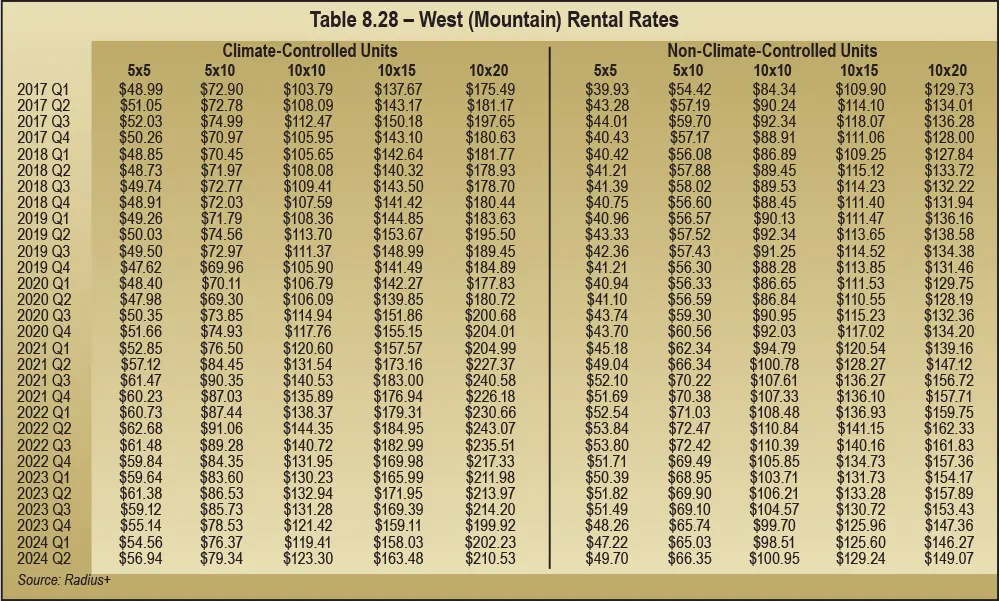
Rental rates in the West (Mountain) region, measured by square feet for climate-controlled space, were down 6 percent YOY, but again 10-by-20s were only down 2 percent. See Table 8.29 and Table 8.30.
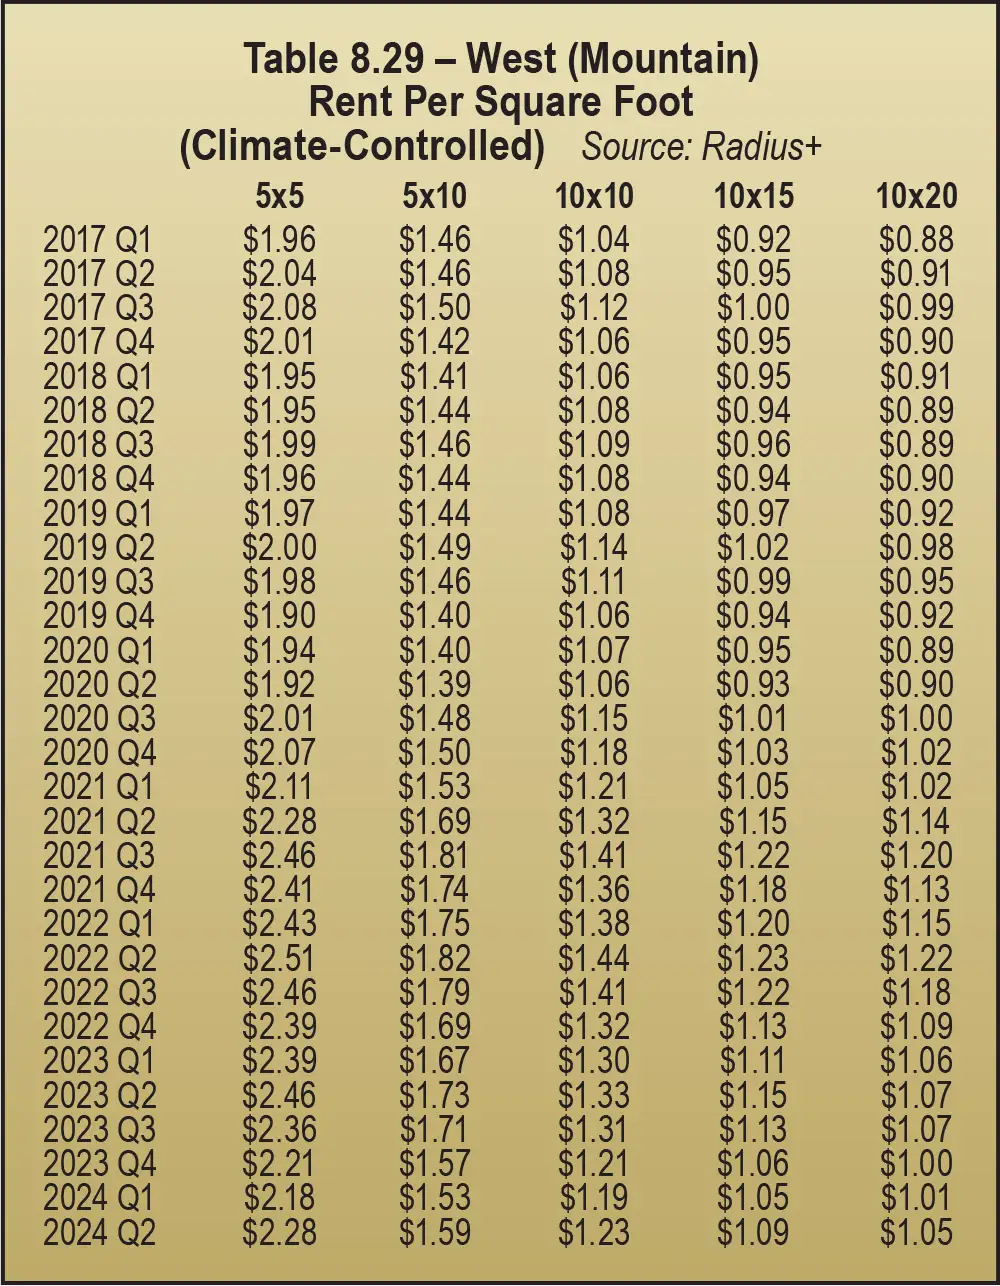
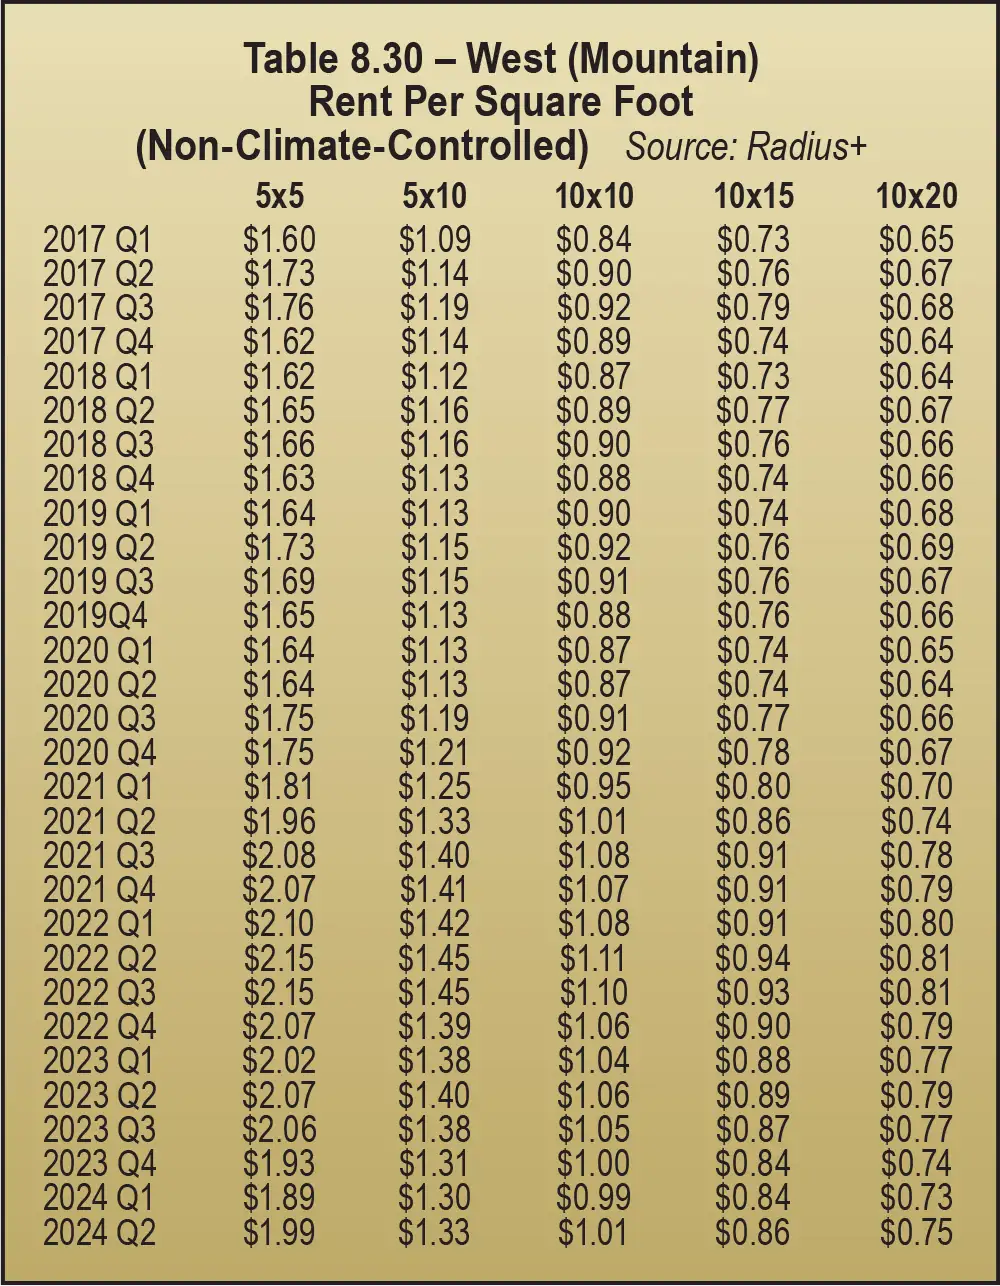
Rates fared best in the West (Pacific) region. Measured in unit pricing, YOY rental rates for climate-controlled units were down only 2 percent on average. Larger units were down little to none: 10-by-10s and 10-by-20s were down 1 percent and 10-by-15s were on par with the previous year with no change in price. See Table 8.31.
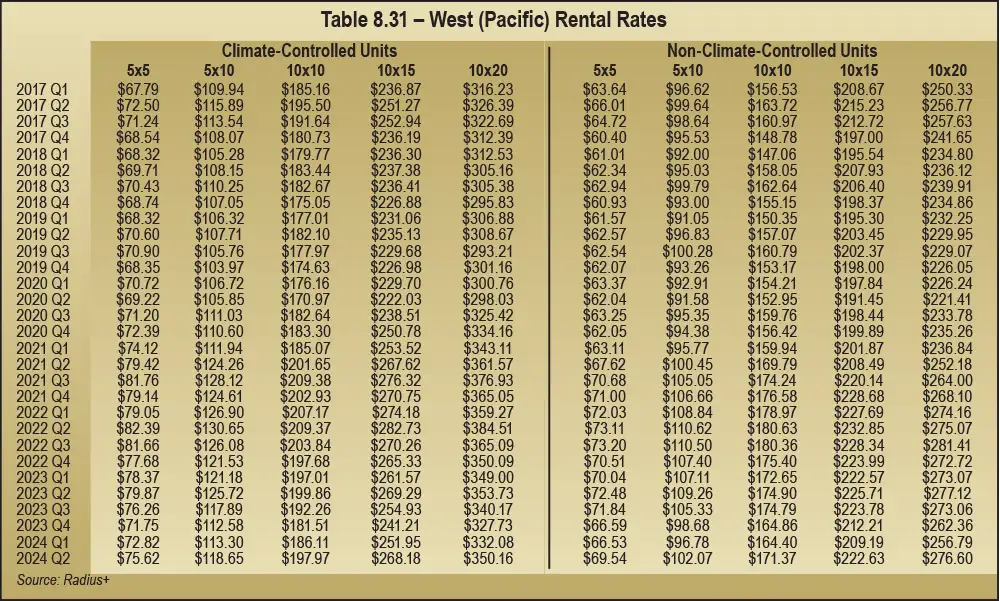
Regions in the West fared the best as far as rental rates go. As a matter of fact, some of the larger unit sizes experienced no price drops at all.
Rental rates in the West (Pacific) region, measured by square feet for climate-controlled space, were down only 3 percent YOY on average, but 10-by-20s were on par with 2023.
Non-climate-controlled rates measured by square foot were also down 3 percent on average, with 10-by-20s on par with 2023. See Table 8.32 and Table 8.33.
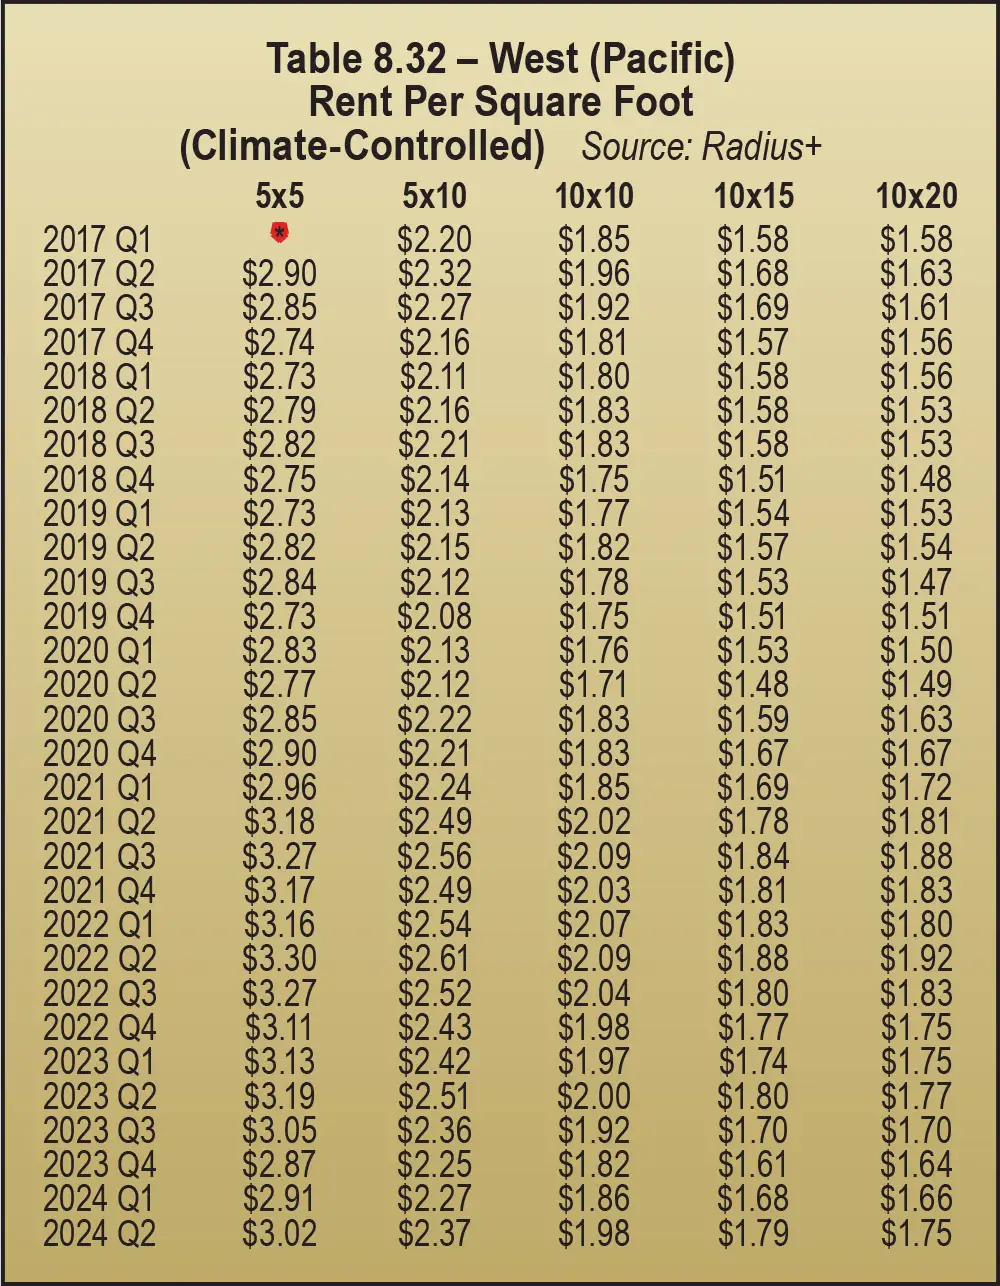
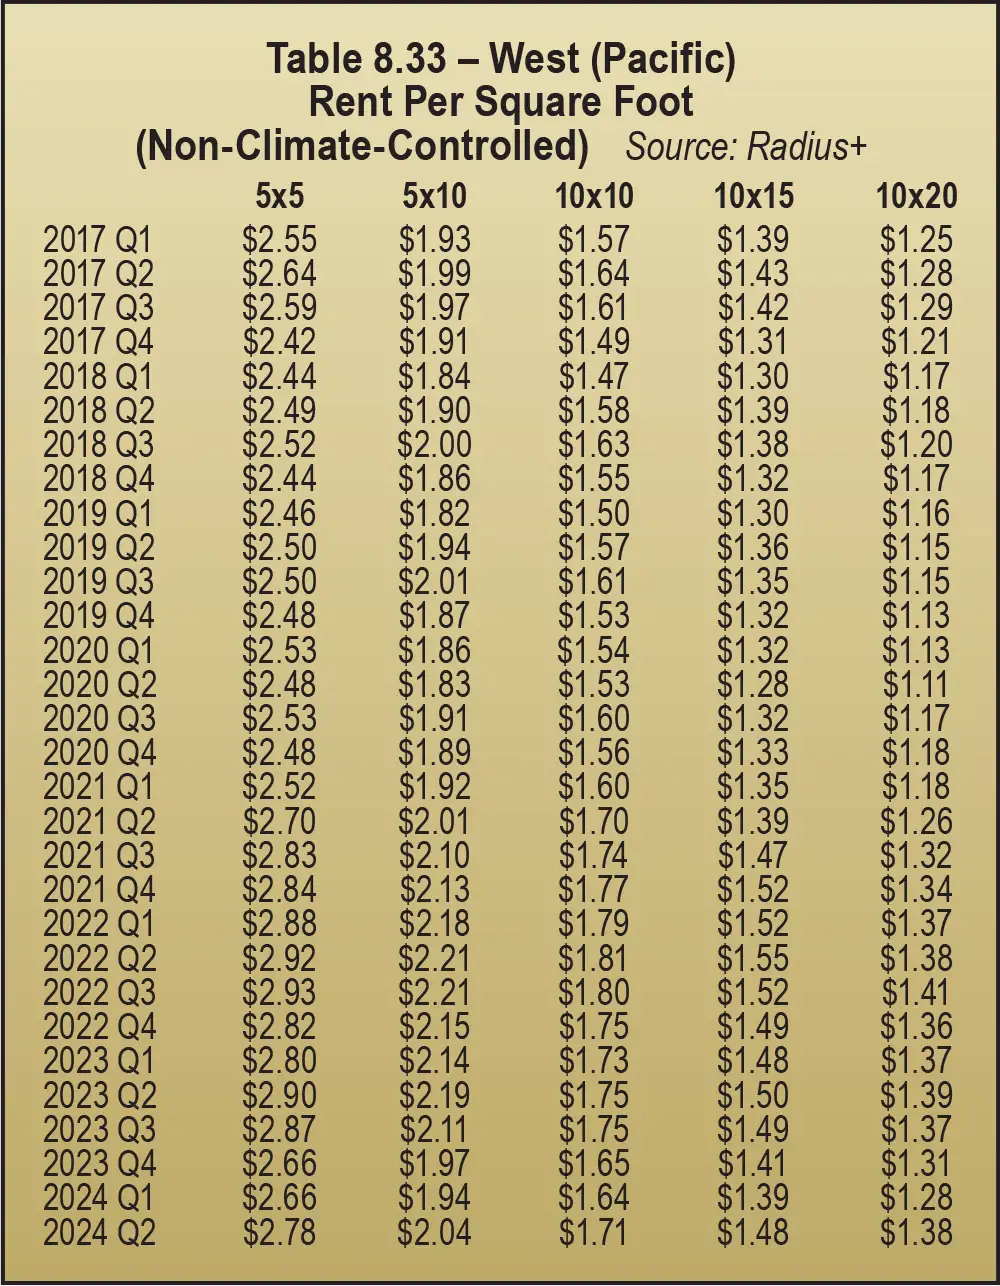

 tbs@trachte.com


- Self-Storage Buildings
- Door & Hallway Systems
- Conversions
- Boat/RV Buildings
- Micro Units

about recent price discounts!
IDEAL FOR SELF-STORAGE & RESIDENTIAL USE
IDEAL FOR SELF-STORAGE & RESIDENTIAL USE

IDEAL FOR LIGHT COMMERCIAL USE & BOAT/RV
IDEAL FOR LIGHT COMMERCIAL USE & BOAT/RV


Self-Storage Relic
he self-storage industry offers a range of management strategies, allowing property owners to tailor their approach based on their goals, resources, and desired level of involvement. Whether you choose to self-manage, hire a third-party company for remote management, or engage a third party with on-site management, understanding the nuances of each option is critical to making the right decision for your property. For new owners entering the industry, these choices can feel overwhelming. Knowing what type of management aligns best with your site’s unique needs and your personal goals is essential for long-term success.
For entrepreneurial owners who thrive on active involvement, self-management provides a hands-on approach to running their facilities. This allows owners to control daily operations, interact directly with customers, and oversee financial decisions. However, even highly engaged owners often face challenges such as understanding state laws, keeping operational costs in check, and ensuring compliance with industry regulations. Professional third-party management can alleviate these burdens by leveraging expertise and resources to fill gaps, optimize performance, and support growth.
Choosing between remote or on-site third-party management depends largely on the property’s needs and your level of involvement. Remote management often leverages advanced technology to monitor operations, track finances, and provide customer support without a constant physical presence. This approach can be cost-effective and efficient for owners watching every dollar. On-site management, however, provides a more hands-on approach, with dedicated personnel to manage day-to-day tasks, maintain the property, and ensure consistent customer service. This is particularly beneficial for larger or more complex facilities.
For new owners, it’s common to focus heavily on cutting costs in the beginning. While this is crucial, it’s equally important to prioritize filling your property in a timely manner, keeping expenses under control, following state laws, and obtaining as much professional and accurate education as possible. A slow lease-up phase or missteps in operational management can lead to long-term financial strain, overshadowing any short-term savings.
Third-party management companies often offer valuable services that go beyond operations, such as owner training programs and access to industry expertise. These resources empower owners to remain involved in the business while benefiting from professional guidance. Such training can help you understand your property’s financial performance, navigate operating software, and interpret reports, ensuring you make informed decisions.
This section will explore the key considerations for self-storage management, including the pros and cons of self-management, remote third-party management, and on-site management. It will also emphasize the importance of clear communication, robust training, comprehensive budgeting, and strategic supervision. Whether you’re new to the industry or looking to optimize your existing operations, understanding these options and their implications is crucial to building a thriving self-storage business.
- Delinquency Management – Streamlining the process of handling overdue accounts to reduce losses and maintain consistent cash flow.
- Revenue Management – Implementing dynamic pricing models to optimize rental rates, monitor occupancy by unit type, and adjust rates based on tenant behavior and market trends. This includes regular rate increases, managing online rate strategies, and phasing out discounts to improve profitability.
- Sales, Marketing, and Advertising – Crafting and executing targeted marketing strategies to attract new tenants and retain existing ones.
- Websites and Technology – Collaborating with trusted partners to create intuitive websites, mobile platforms, and apps designed to improve customer convenience and engagement.
- Financial Oversight – Managing profit and loss statements, cash flow analysis, debt servicing, bank reconciliations, and preparing comprehensive financial reports.
- Bill Payment – Handling vendor payments and operational expenses efficiently.
- Human Resources – Hiring, overseeing staffing, payroll, benefits administration, and personnel management.
- Maintenance – Ensuring facilities remain clean, safe, and well-maintained, with proactive scheduling of repairs and upgrades.
- IT Services and Technology Deployment – Implementing cutting-edge software and technology to streamline operations.
- Education and Training – Providing ongoing training for staff to enhance their skills and ensure compliance with best practices.
- Call Centers and Kiosks – Managing customer interactions and offering support through advanced customer service solutions.
- Audits and Compliance – Regularly evaluating operations to ensure adherence to industry standards and internal policies.
- Operating Software and Payment Processing – Managing the deployment of software and systems for efficient operations, including credit card processing.
- Annual Budgeting and Performance Analysis – Preparing budgets, monitoring monthly results, planning for capital expenditures, and maintaining maintenance reserves.
- Special Services – Supporting startups, facility rehabs, and disaster recovery efforts. These special services often involve additional agreements or fees.
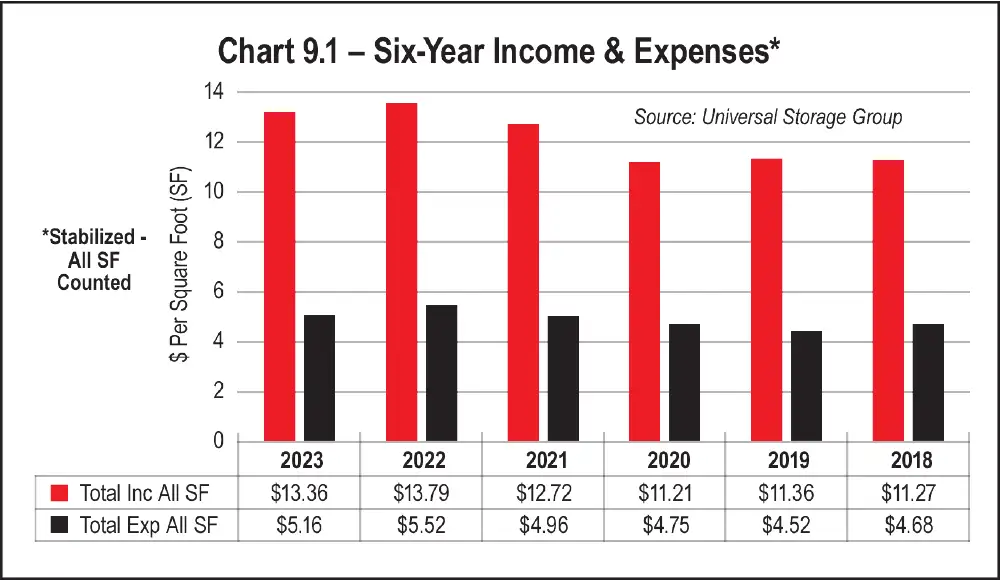
This downward trend reflects the effectiveness of professional management companies in leveraging technology and streamlined processes to maximize income while controlling operational expenses. Owners benefit from a strategic approach that combines expertise, resources, and innovative oversight, ensuring both operational efficiency and profitability.
Whether self-managing or partnering with a third-party provider, owners must remain focused on operational excellence and strategic growth to thrive in the ever-changing world of self-storage.
- Minimum Monthly Fees – For facilities in lease-up phases, when occupancy is building, or for smaller locations, management fees typically range between $2,500 to $3,000 per month.
- Percentage-Based Fees – For single-store operations, management fees usually fall around 6 percent of the adjusted gross income per month. These fees are calculated and paid monthly in arrears. For instance, services rendered in January will be reflected in January’s financial statements, which are delivered in February. Payment typically occurs after month-end reconciliations, often around the 10th of the following month.
- Multiple-Store Discounts – For clients managing multiple properties, discounts may apply. In such cases, management fees can drop to as low as 5 percent of gross income.
- Start-Up Fees – Assimilating a new property requires significant upfront effort, including business setup, operating system configuration, accounting preparation (e.g., budgets and projections), and manager training. Start-up fees generally range between $5,000 and $10,000.
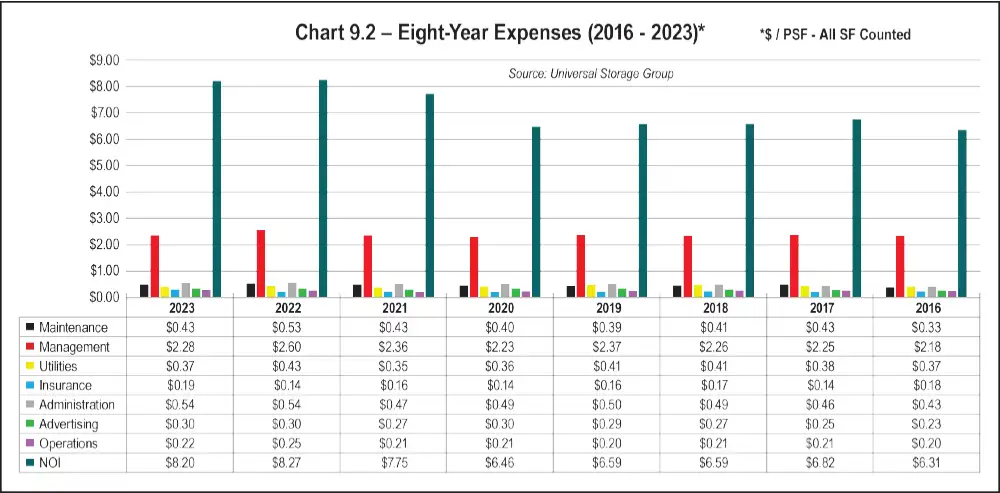
- Advertising Costs – By transitioning from traditional print media to digital marketing channels, operators can reduce advertising expenses while maintaining a community-focused, high-touch marketing presence. Advertising spend is closely tied to digital strategies like pay-per-click (PPC) campaigns, which must be optimized for maximum return. While it’s challenging to compete with Real Estate Investment Trusts (REITs) online, focusing on targeted, smart spending is key.
- Expense Trends at Universal Storage Group (USG) – Over the past four years, USG’s expenses as a percentage of income reflect careful cost management.
- 2020: 36.8 percent of income
- 2021: 33.3 percent of income
- 2022: 32.0 percent of income
- 2023: 32.78 percent of income
Advertising costs specifically accounted for 2.2 percent of income in 2023, showcasing the importance of lean, effective marketing strategies.
While REITs may dominate online visibility with larger budgets, independent operators can still thrive by leveraging local expertise, smart marketing, and efficient management practices.
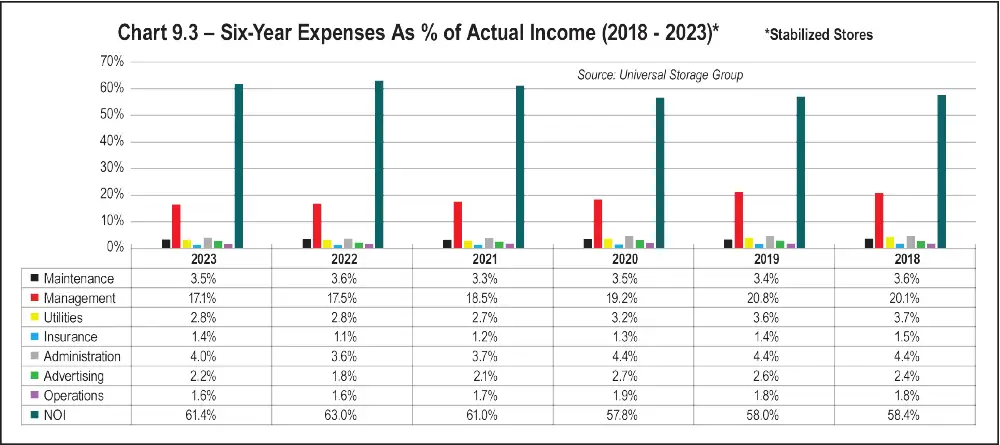
- Bill Payment and Financial Oversight – Management companies handle all store-related expenses, including tax contributions required by law and debt servicing or loan payments as directed by the property owner. Owners may opt to manage tax payments and debt servicing themselves, but they must provide all relevant documentation, including proof of payment and associated records, to the management company. This ensures accurate financial reporting, prevents discrepancies, and supports compliance with budgeting and reconciliation processes.
- Monthly Financial Statements provide a comprehensive overview of a facility’s performance, typically including reconciled bank account statements, budget comparisons to evaluate how actual results align with projections, and year-over-year analyses to track performance trends and identify areas for improvement.
- Annual Budget Preparation is a collaborative process essential for setting income targets, projecting revenue, and estimating monthly expenses categorized for easy tracking. This budget serves as a framework for comparison throughout the year, helping to identify variances and implement necessary adjustments to stay aligned with financial goals.
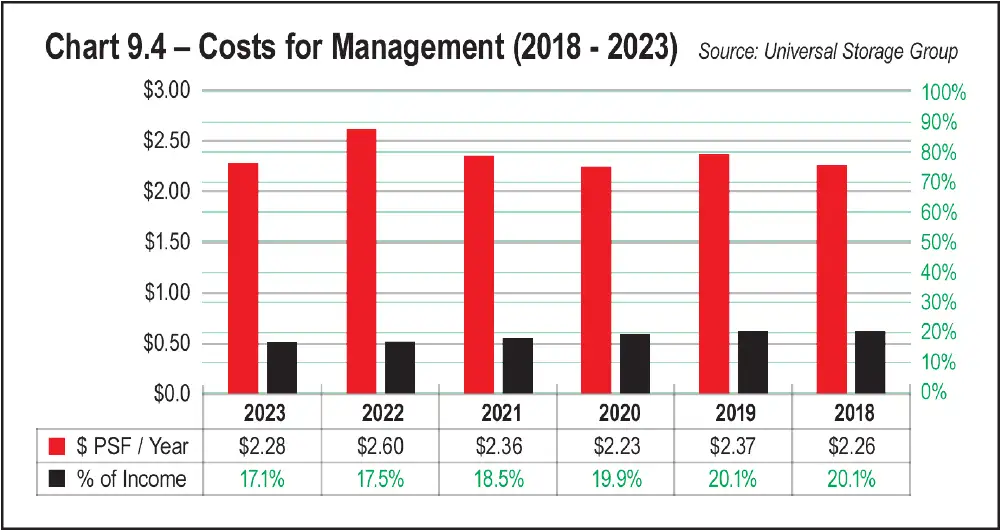
- Structured Programs – Effective training begins with structured programs that include comprehensive onboarding and extend to ongoing professional development. For instance, Universal Storage Group (USG) utilizes a four-phase training program. Phases One and Two provide a two-week initiation covering operational basics. Phase Three focuses on marketing and social media training to build awareness and engagement; Phase Four trains managers in auction procedures to handle delinquency management effectively.
Ongoing education and recognition are also vital components of a successful training strategy. According to the 2024 LinkedIn Workplace Learning Report, 70 percent of workers believe learning improves their connection to the organization, 80 percent feel it enhances their sense of purpose, and 94 percent say they would stay longer with a company that invests in their careers. Training programs that include awards and recognition further boost morale and retention, fostering a more motivated and capable workforce.
Comprehensive skill development is another critical element of manager training. This includes training in sales techniques for both phone and in-person interactions, marketing strategies that leverage digital platforms and community engagement, and proficiency in reporting and administrative tasks to ensure accuracy and efficiency. Delinquency management is also a focus, with training on effective phone skills for recovering late payments professionally, empathetically, and persuasively. Additionally, managers are trained in technology and software use, including property management systems, and learn the importance of curb appeal and facility auditing to maintain compliance with operational standards.
To further enhance learning and team cohesion, many companies host annual training and recognition events. These events can range from two-day intensive sessions to multiday retreats providing opportunities for skill-building, motivation, and team bonding.
By prioritizing training as an ongoing, multifaceted process, self-storage companies can empower their managers to lead effectively, drive success, and build lasting connections within their teams and communities.
Another significant benefit is improved performance. Managers who are educated and motivated are better equipped to boost occupancy rates, effectively manage delinquencies, and enhance customer satisfaction. These improvements directly contribute to a healthier bottom line, reinforcing the value of investing in comprehensive training programs.
Additionally, training prepares managers for emergency situations by equipping them with the knowledge and tools to handle unexpected challenges. Advanced technologies, such as remote access tools, video doorbells, and cloud-based management systems, enhance their ability to respond quickly to emergencies or operate remotely when necessary, ensuring continuity and security in critical moments.
By focusing on these areas, self-storage operations can harness the full potential of well-trained managers to drive success and maintain resilience in a competitive industry.

Hiring and training practices are more than operational necessities; they are strategic investments in the success of a self-storage facility. A well-hired and properly trained manager can transform operations, creating a welcoming and efficient environment that attracts and retains customers. By prioritizing comprehensive training and leveraging modern tools, self-storage owners can build strong, resilient teams that drive long-term profitability.
- Billing and Invoicing – Email invoicing for customers is often included as a cost-effective and environmentally friendly solution. However, physical invoicing via traditional mail may come with additional fees, with the costs often passed on to the customer.
- Auctions and Lien Sales – Most management companies handle auctions through online storage auction platforms; they have become the industry standard and are typically included in your management fees. However, any fees charged by the auction platform are typically billed back to the owner.
- Marketing and Branding – Comprehensive marketing plans aimed at maximizing visibility and customer engagement are typically included. However, branding-related updates, such as customized signage, color schemes, or painting, may incur extra charges. If the management company operates sites under their own flagship brand, additional costs like licensing or franchise fees might also apply.
- Pre-Opening and Development Support – Standard services include initial guidance on marketing plans, operational systems, and staff hiring for new sites, as well as “Coming Soon” banners with reservation capabilities and pre-leasing strategies. Additional involvement in site planning and design, such as unit mix optimization, office layout planning, QR code integration to reduce signage costs, custom five-year budgets, furniture procurement, and promotional materials, may result in extra fees.
- Construction Oversight and Rehabilitation – During construction or renovation, low monthly minimum fees are often included to help offset initial expenses while maintaining professional oversight. More comprehensive oversight of construction projects or major rehabilitation work, ensuring projects remain on schedule and meet quality standards, may come at an additional cost.
- Technology Integration – Assistance with integrating operational systems, such as access control and property management software, is typically included. However, custom configurations or additional technology solutions tailored to specific owner needs may involve extra charges.
- Annual and Ongoing Operations – Services such as manager hiring, ongoing training programs, and standardized operations across all sites are usually included to ensure efficiency and consistency. Additional costs may apply for initial training programs for new managers, covering comprehensive onboarding and specialized training sessions. Enhanced services like annual retreats, specialized training events, or team recognition programs designed to motivate and retain staff may also incur extra fees.
By understanding the scope of included services and potential additional costs, self-storage owners can make informed decisions and align their expectations with their management company’s offerings.
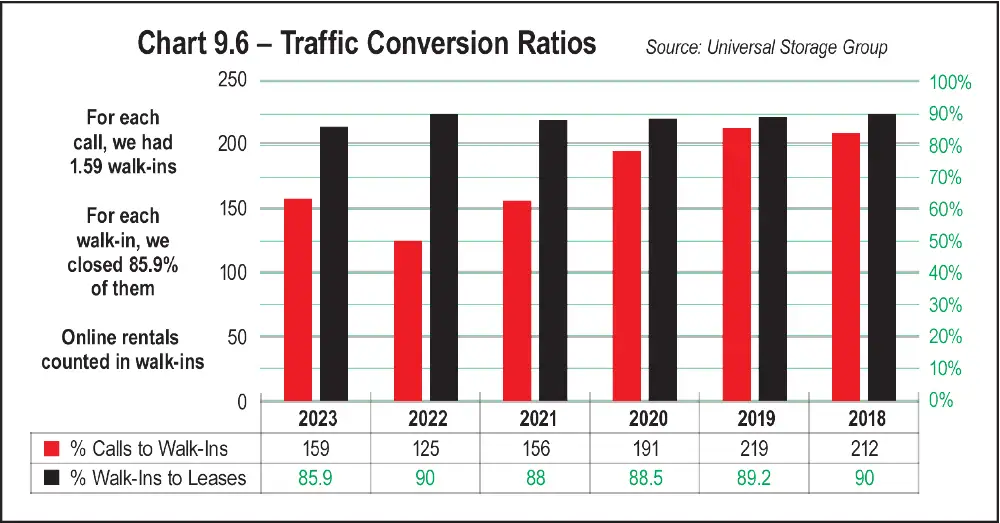
Whether the services are included or require additional fees, professional management is a strategic investment in the success of your self-storage business. A clear understanding of what is provided allows owners and management companies to budget effectively and focus on the services that will bring the most value. By collaborating closely with an experienced management team, self-storage owners can achieve operational excellence, streamline processes, and maximize profitability.
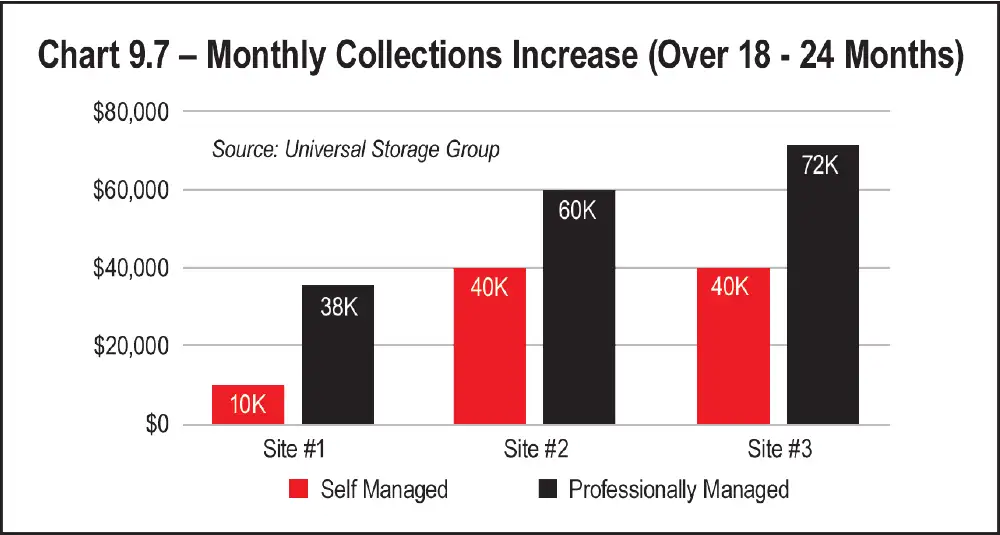
- Start-Up Contracts are tailored for new self-storage developments, ensuring the management company oversees all aspects of opening the facility. This includes manager hiring and training, creating and implementing marketing and promotional plans, developing budgets, integrating operational systems such as access control and property management software, and pre-leasing strategies to build occupancy before opening day. These contracts typically cover the pre-opening phase and the first few months of operations, providing a seamless transition to steady operations.
- Due Diligence Contracts are designed for prospective buyers evaluating the purchase of an existing facility. Management companies offering these short-term contracts conduct in-depth analyses of the facility’s financial performance and operational health, identify improvement opportunities or risks, and provide a comprehensive report to guide the buyer’s decision. Fees for these services generally range from $5,000 to $15,000, depending on the property’s size, age, and complexity.
- Feasibility Studies are a crucial step for self-storage owners considering the development of a new facility. These studies provide a comprehensive evaluation of market demand, competition, and other key factors to determine whether a project is viable and financially sound. The cost of a feasibility study generally aligns with that of due diligence contracts, with pricing varying based on the scope of the project and the complexity of the target market. It’s important to understand the distinction between a feasibility study and a market study. While both provide valuable insights, feasibility studies offer a more detailed analysis of overall project viability, which is often required by banks and lenders as part of the financing process. For any owner exploring new opportunities, a thorough feasibility study can lay the groundwork for a successful and profitable development.
- REO and Bank Management Contracts address the specific needs of managing facilities for banks or real estate owned (REO) properties. These contracts often involve higher fees due to the flexibility and unique operational requirements, focusing on maximizing value for lenders while maintaining operational stability.
To accommodate unique circumstances, many management companies offer tailored terms for custom agreements. These could include shorter initial terms with the option to extend after an evaluation period, contracts designed for significant renovations or expansions, or flexible agreements for owners uncertain about long-term management needs. These tailored options often come at a premium due to the added complexity or reduced contract length.
When considering management agreements, it’s crucial to thoroughly review your options, discuss terms with the management company, and ensure the agreement aligns with your specific goals. Whether you’re opening a new facility, acquiring an existing one, or managing a property under unique circumstances, the right management partner can significantly impact your success.
While monthly on-site visits are the industry standard for most management companies, advancements in remote supervision and customized oversight options have introduced greater flexibility. These innovations allow owners to adapt management strategies to meet the unique demands of their properties while balancing cost efficiency.
On-site visits typically include essential tasks such as auditing financial records, daily deposit logs, and operational reports to ensure accuracy and compliance. They also involve thorough site inspections to maintain curb appeal, identify maintenance issues, and assess the property’s overall condition. Monthly performance reviews are another critical aspect, focusing on analyzing income and expense reports to evaluate success and identify areas for improvement.
- Weekly supervision is ideal for owners who require more frequent oversight, such as during lease-up periods or for underperforming properties. Weekly visits involve detailed and consistent monitoring, offering a higher level of involvement to address challenges proactively. However, this option often comes with higher management fees to account for the increased time and travel expenses.
- Quarterly supervision is a cost-effective alternative offered by some management companies. This option reduces on-site presence by scheduling inspections every three months, appealing to owners seeking to minimize expenses. However, the reduced frequency may result in slower response times to potential issues and fewer opportunities for hands-on training with managers, which can impact overall performance.
- Daily oversight through technology provides a modern approach to maintaining control without frequent physical visits. Most management companies perform daily audits of income and deposits remotely, ensuring financial accuracy and security. Managers play a key role in this process by closing, balancing, and depositing funds daily to streamline accounting and reduce risks. Additionally, they use online tools and software to provide real-time reporting to the home office, ensuring continuous oversight and operational efficiency.
These flexible supervision options allow owners to choose the level of involvement that aligns with their property’s needs, operational goals, and budget, ensuring a tailored approach to effective management.
Striking the right balance between hands-on management and remote oversight is essential for ensuring self-storage properties operate efficiently and profitably. By understanding the benefits of tailored supervision and the available options, owners can align their operational goals with their budget, ensuring long-term success.
- Online manager training allows companies to conduct remote sessions where managers and home office staff interact face to face using existing store hardware, such as webcams and audio systems. This approach provides immediate feedback and support while significantly reducing travel costs.
- Instant communication tools such as video conferencing, cloud-based property management software, and remote monitoring systems ensure that home office staff stay connected with on-site managers. These tools allow real-time issue resolution, improving efficiency and responsiveness to operational challenges.
- Automated oversight takes monitoring to the next level with systems for access control, security cameras, and software notifications that track daily operations remotely. These systems can send alerts for unusual access activity, automate tracking of delinquent accounts, and issue payment reminders, ensuring smooth and secure operations without constant physical oversight.
These technological advancements not only reduce costs but also enhance the effectiveness and responsiveness of management practices, offering owners and managers the tools needed to maintain operational excellence.
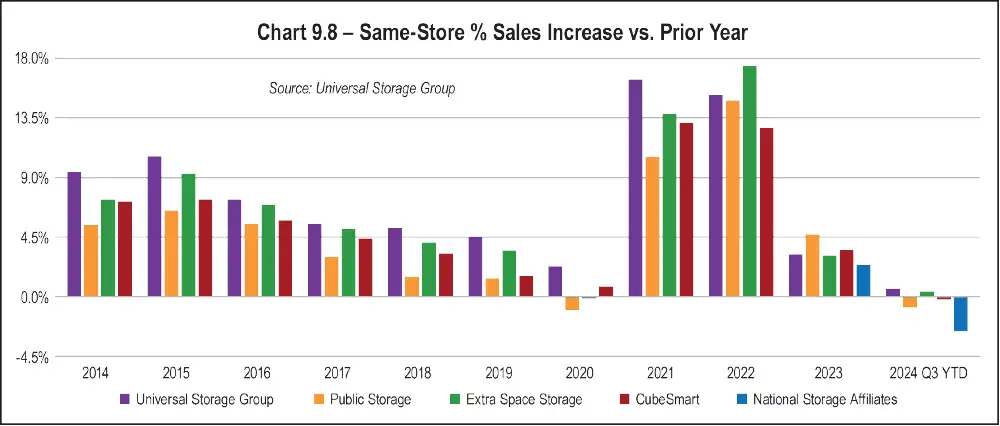
- Notice requirements are a fundamental element of most agreements, with the standard being a 60-day notice for termination without cause by either party. Some contracts offer greater flexibility with a 30-day notice period. Confirming the notice requirements in your contract and understanding any associated conditions is essential for clarity and preparation.
- Termination for cause is another critical provision included in many contracts. This allows for immediate termination in cases such as a breach of contract or gross mismanagement, typically giving the offending party an opportunity to resolve the issue before termination takes effect. Ensuring these terms are clearly defined and equitable is vital when reviewing the agreement.
- Early termination penalties may also come into play, with some contracts requiring payment of at least 12 months of management fees, even if the termination occurs earlier. Owners must be aware of these potential financial obligations to make informed decisions.
Not all agreements allow for termination without cause; some require a justifiable reason, which can complicate ending the relationship if problems arise. Reviewing this clause carefully can help avoid unexpected challenges down the road.
Finally, access to software and data is a crucial consideration when transitioning to a new management company. Ensuring you are the licensed user of the software will facilitate a seamless conversion to a new system. Retaining ownership of your data and access to the platform is critical for maintaining operational continuity during the transition.
By thoroughly understanding these termination considerations, owners can better safeguard their interests and navigate transitions effectively. Proper preparation and clarity not only ensure a smoother process in the event of termination but also foster a stronger, more transparent relationship between owners and management companies.
Protecting your data is another critical aspect. Ensure the agreement explicitly states that you retain ownership of all operational data and have full access to it upon termination. This provision safeguards against disruptions during the transition to a new management company, preserving the continuity of your operations.
Additionally, confirm the details of the time-to-cure provisions for cause-based termination. These terms should allow fair treatment for both parties by providing reasonable time for the offending party to address and resolve any issues before termination takes effect.
Understanding the conditions for termination is a vital component of any management agreement. By thoroughly reviewing and negotiating these terms upfront, owners can protect their interests and ensure a smooth transition if the partnership ends. Like any important relationship, clarity and preparation are essential to minimizing potential conflicts and safeguarding your self-storage investment.
When evaluating disputes and governance in management agreements, there are several key points to consider. First, dispute resolution clauses should be reviewed to ensure they include clear language about how disputes will be resolved. Common options include mediation, arbitration, or litigation. It is essential to understand where the contract is governed, as this specifies the jurisdiction and laws applicable in case of disputes. Additionally, preferred methods for resolution, such as mediation or arbitration, are often favored due to their efficiency and cost-effectiveness compared to court proceedings.
Second, spending limits and emergency situations must be clearly defined. Management contracts typically outline spending thresholds, specifying what management can spend without the owner’s direct approval. For example, routine expenses may have a predefined limit, such as $1,000. In contrast, emergency expenditures related to repairs or safety concerns might allow for greater flexibility to protect the property and its operations. Clear definitions of what constitutes an emergency and the associated spending caps are crucial for preventing future conflicts.
Lastly, the alignment with business goals is vital. A third-party management company should function as a true operating partner and an extension of the owner’s business. This relationship thrives when the management company has a clear understanding of the owner’s objectives and tailors its approach to achieve or exceed these goals. Owners should explicitly communicate their long-term plans, such as whether the property is intended to generate income or be sold after increasing its value. Exit strategies, such as plans to develop and sell the property within a specific timeframe (e.g., five years), should also be shared to ensure alignment between both parties.
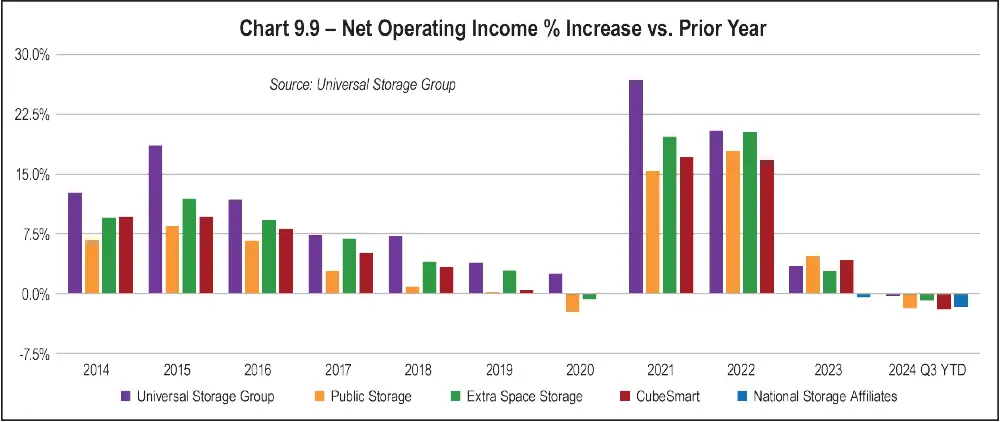
This approach works effectively for several reasons. First, it avoids manager overload by preventing store managers from feeling overwhelmed by directives from multiple “bosses,” which can lead to frustration or disengagement. A unified communication channel ensures that managers receive clear, actionable instructions from a single source—the management company. Second, it streamlines decision-making by filtering all decisions through the management company, which can assess feasibility, communicate effectively, and maintain alignment with operational goals. Lastly, it allows managers to stay focused on their primary responsibilities, such as operating the store and serving customers, without being distracted by conflicting requests or administrative confusion. This structure not only enhances operational efficiency but also contributes to a positive working environment for all involved.
The annual budget is a critical tool for the success of a self-storage business, providing clear targets and a structured approach to financial planning. It outlines agreed-upon objectives for revenue generation, operational costs, and leasing activity, serving as a roadmap for the year. By establishing these targets upfront, the budget eliminates the need for frequent adjustments throughout the year, ensuring focus and consistency.
At Universal Storage Group (USG), the budget preparation process is thorough and begins well in advance, with budgets typically ready by November for the upcoming year. This process involves several key steps to ensure accuracy and alignment. First, budgets are reviewed internally by the area manager, COO, and CEO to ensure they are comprehensive and realistic. Once finalized, the budgets are presented to owners and reviewed in detail. This collaborative approach ensures that owners fully understand and agree with every dollar allocated, fostering transparency and trust. USG avoids vague or undefined categories in its budgets; there are no “miscellaneous” or ambiguous line items. Every expense is clearly accounted for, reflecting a meticulous and professional approach.
An often overlooked but essential step in the budgeting process is sharing the budget with on-site managers. Managers play a pivotal role in controlling expenses, achieving revenue targets, and staying within budgetary limits. Without a clear understanding of the year’s goals, they cannot effectively contribute to the business’ success. Simply instructing managers to “do good this month” or “try hard this year” is insufficient. Providing managers with specific, measurable goals aligns them with the broader strategy and empowers them to perform effectively. A well-communicated budget ensures that everyone is working toward the same objectives, creating a unified and productive team.
Open communication is equally vital in ensuring collaboration. Owners should follow the agreed-upon flow of communication to share ideas, concerns, or objectives with the management company. This approach allows for the seamless relay of both positive observations and areas needing improvement, enabling the management team to craft clear action plans and work with on-site managers to implement necessary changes. A collaborative and communicative relationship ensures a smooth flow of information, resulting in measurable operational improvements and a more successful partnership.
For collaborative owners, third-party management offers a natural partnership. This setup allows you to work closely with the management firm to achieve shared goals while they handle the operational workload, creating a productive and balanced relationship. On the other hand, if you are a micro-manager who prefers to oversee every detail personally, third-party management can be either a challenge or a blessing. While it provides relief from managing multiple operational fronts simultaneously, excessive micromanagement can strain the relationship. Being clear about your needs and expectations from the outset is essential in determining whether third-party management aligns with your approach and goals.
This honesty and objectivity can provide valuable insights, recommend actionable improvements, and give you an unbiased perspective on your operations. Consultants are especially beneficial for owners considering transitioning to third-party management or seeking ways to optimize existing systems. By partnering with a management firm, maintaining open communication, and aligning on goals, you can create a harmonious relationship that maximizes income and minimizes stress. Whether you’re looking for full-service management or simply seeking expert advice, the right level of involvement can lead to measurable improvements and a more successful operation.
Industry involvement is another key factor to consider. A management company that actively participates in state and national self-storage associations demonstrates a commitment to upholding industry standards and fostering professional development. Companies that contribute to the industry by writing articles, offering training, or speaking at national conventions show leadership and dedication to staying ahead of trends and technologies that can directly benefit your business.
Interviewing the company’s current clients provides firsthand insights into their performance and reliability. Speak with owners who operate facilities of similar size or scope and ask about key performance indicators, such as improvements in operations, cost reduction, increased income and occupancy rates, enhanced marketing efforts, and the consistency of reporting. Additionally, inquire about their experiences with communication, responsiveness, and problem-solving. These conversations can reveal how effectively the management company delivers on its promises and handles challenges.
By thoroughly evaluating references, you can make a well-informed decision and choose a management company that aligns with your goals, demonstrates a proven track record, and delivers meaningful results for your self-storage business.
Customization options are another important consideration. If you require specialized formats or reports, it’s crucial to discuss these needs during the negotiation phase. While many self-storage operating systems offer a variety of standard reports, customizations may come with additional fees or increase start-up costs, so clarifying these details upfront is essential.
Lastly, evaluate the accessibility of data provided by the management company. Modern web-based operating systems typically allow owners to access real-time data and generate reports from anywhere, providing transparency and convenience. Confirm whether additional reports or custom data requests are included in the service or if they incur extra costs. By thoroughly reviewing and understanding the sample exhibits, you can ensure the financial tools and reporting align with your needs, fostering a smooth and productive working relationship with your management company.
Emergency procedures should also be clearly outlined in the contract, specifying situations that require immediate notification of the owner and detailing how these communications will occur. These protocols ensure that owners are promptly informed of critical issues affecting their property.
Sample exhibits are more than just attachments; they provide a snapshot of the information and support you can expect from your management company. Reviewing these documents thoroughly, discussing unique reporting needs, and ensuring transparency in access and frequency are essential steps in establishing a productive and collaborative partnership. Clear expectations around reporting will equip you with the insights needed to make informed decisions and keep your self-storage operations running smoothly.
Owner training programs are designed to ensure property owners are well-prepared to engage actively in the management of their facilities. These programs often feature classes and workshops aimed at familiarizing owners with the tools and reports used in daily operations. Training sessions may cover essential topics such as navigating operating software, generating key reports, and identifying critical performance indicators that influence the property’s success. Additionally, owners often receive specialized reporting tailored to highlight specific aspects of their property’s performance. Training ensures that owners can interpret these reports effectively, using the insights to guide their decision-making and strategic planning.
Moreover, training strengthens communication between owners and management companies. A shared understanding of reports and data fosters clearer alignment on goals and expectations, enhancing the partnership. Finally, owner training provides enhanced operational insights, enabling owners to spot trends and potential issues that could impact their bottom line. With this knowledge, owners can implement proactive solutions rather than reactive measures, safeguarding their property’s long-term success.
By investing in owner training, self-storage owners not only gain valuable skills but also establish a stronger, more collaborative relationship with their management team, ensuring the continued growth and profitability of their business.
Owner training is a vital resource for maximizing the value of your self-storage investment. By gaining a clear understanding of the tools, reports, and data that influence your operations, you’ll be better equipped to collaborate effectively with your management company and make well-informed decisions that drive success.
Third-party managers also provide expertise in legal requirements and regulations, helping owners navigate complex compliance issues while reducing liability. They often require customer storage insurance and implement robust standard operating procedures, further protecting owners from risks. Owners gain immediate access to national-level expertise, innovative sources of ancillary income, and a fresh, independent perspective to tackle critical business decisions.
With extensive experience in human resources, legal matters, and property insurance, these companies deliver value in areas that significantly impact profitability and operations. Owners should expect third-party managers to improve property performance through strategies that contribute directly to the bottom line. Beyond operational efficiency, the best management firms bring an owner’s mindset to the table, developing customized strategies aligned with the owner’s business goals. By leveraging these benefits, self-storage owners can achieve sustainable growth, reduced risk, and increased profitability.
Achieving operational excellence requires daily attention to detail. Tracking calls, walk-ins, and conversion rates while responding promptly to web inquiries can significantly enhance customer acquisition and retention. Consistency through well-defined standard operating procedures ensures exceptional service and convenience, benefiting both owners and tenants.
Whether independently operated or managed by a professional firm, self-storage businesses that prioritize these principles will thrive. By combining customer-centric practices with a focus on operational efficiency, operators can create positive rental experiences, drive growth, and position their properties for long-term success.


This is your one-stop destination to hear the leading voices of self-storage.


Owner Brickhouse Self-Storage
Georgia

Multi-property Owner
Mississippi
arketing in the self-storage industry has evolved dramatically, transforming into a blend of science, art, and heart. Today’s operators face a rapidly shifting landscape where competition is fierce, customer expectations are higher than ever, and the digital age has created endless opportunities to connect with renters. Whether you’re a seasoned owner, a manager, or brand new to the industry, effective marketing isn’t just a business strategy—it’s a lifeline for building relationships, creating trust, and securing long-term success.
The good news: You don’t need a huge budget or a marketing degree to win. With a thoughtful, proactive approach, every operator can elevate their facility’s visibility, reputation, and occupancy.

But what exactly is marketing, and what is it for? Simply put, marketing is the bridge between your business and your potential customers. It’s how you communicate who you are, what you offer, and why you’re the best choice and value for their storage needs. Marketing helps define your brand, generate awareness, attract leads, and nurture long-term customer relationships. It’s the key to ensuring your facility isn’t just seen but remembered and chosen.
- Awareness – Making sure potential renters know your facility exists and understand your unique offerings.
- Connection – Engaging with your audience in a way that feels organic, personal, and meaningful.
- Credibility – Establishing trust and confidence in your ability to meet their needs.
- Growth – Increasing occupancy, retaining customers, and maximizing revenue.
At its core, self-storage marketing serves two key purposes:
- To ensure that when someone in your area needs storage, your facility is the first one that comes to mind.
- To make your renters feel confident they’ve chosen the best possible solution for their needs.
Remember: Marketing isn’t just a task. It’s an investment in the success of your business and your role in your community.
Digital Marketing
- Websites, SEO, and PPC campaigns
- Social media platforms for engagement and brand visibility
- Email marketing to stay connected with leads and customers
- Physical visits to local businesses
- Partnerships with local businesses and organizations
- Face-to-face interactions to build trust and relationships

- Facility appearance and signage
- Community involvement through events and sponsorships
- In-house events that bring the community to your doorstep
- Collaborations with realtors, moving companies, and local businesses
- Reciprocal referral programs, even with competitors, to maximize reach
- Analyzing traffic sources and demographics to refine strategies
- Measuring key performance indicators (KPIs) like Cost Per Lease (CPL) and occupancy trends
- Tailoring campaigns based on insights to optimize results
Each type of marketing works together to form a cohesive, powerful approach to reaching and serving your customers. Whether you’re running a single facility or a portfolio of properties, these strategies will help ensure your success in 2025 and beyond.
By the end of this section, you’ll have the tools, insights, and confidence to elevate your marketing game and your facility’s performance. Let’s dive in!

Your website is your 24/7 salesperson, and it must make a strong first impression. A professional, well-designed website provides functionality, clarity, and visual appeal, guiding visitors effortlessly from inquiry to rental.
Why use a professional? Website designers specializing in self-storage understand industry needs and customer expectations. They’ll ensure your site includes essential features such as:
- Online rentals, reservations, and payments
- Unit availability updates synced with your software
- Professional-grade photos and videos showcasing your facility’s best features
- SEO optimization so your facility ranks high in search engine results
PPC Campaigns
Pay-per-click (PPC) advertising is essential to support your website. A well-structured PPC program ensures your facility appears at the top of search results when potential renters are actively searching for storage. Combine targeted keywords (e.g., “storage near [city]”) with compelling ad copy and a clear call to action to maximize clicks and conversions.
Tip: Consulting with a professional ensures seamless integration with your operational software, optimal SEO, and a competitive PPC strategy.
Social Media
Social media is one of the most versatile tools for engaging your community and expanding your reach. However, success depends on targeting the right platform for your audience.
- Facebook is ideal for engaging with local communities and promoting events. Use it to share customer testimonials, facility updates, and photos of community involvement.
- Instagram is best for visual storytelling, appealing to younger demographics with eye-catching photos and short videos. Post images of your facility, local partnerships, and seasonal promotions.
- TikTok is perfect for fun, relatable videos showcasing your staff, quirky storage tips, or behind-the-scenes glimpses of daily operations.
- LinkedIn is useful for connecting with business professionals, including realtors, moving companies, and local contractors. Highlight features like contractor bays, climate-controlled units, and partnerships.
Tip: Stay authentic. A quick, heartfelt video about your participation in a local charity event can have more impact than a highly polished ad.
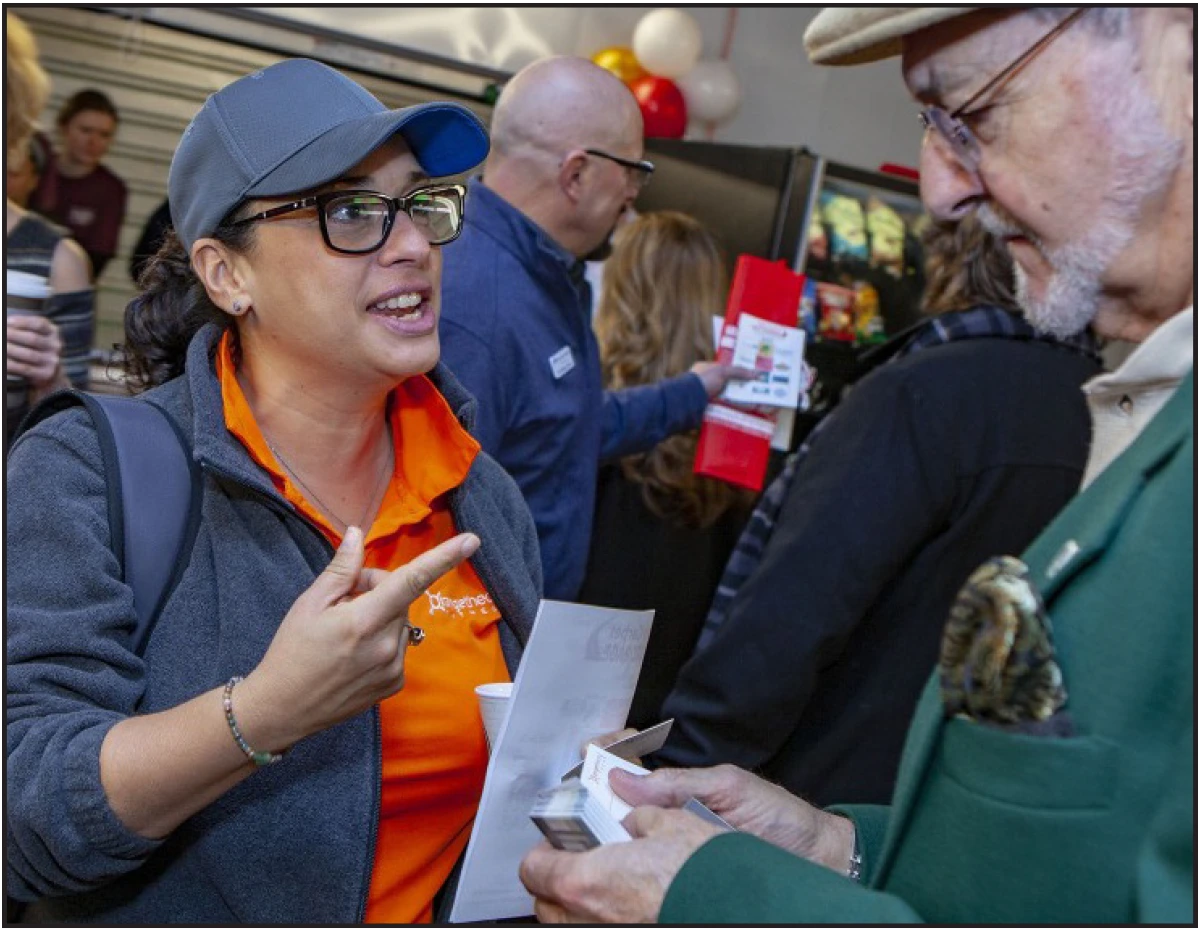
Email marketing remains one of the most cost-effective and impactful ways to consistenly and directly connect with your audience. However, its effectiveness hinges on the quality of your email distribution list and the relevance of your content.
Building organic email lists is key. Your email lists should grow naturally from the contacts you’re already making. This includes:
- Current tenants
- Past tenants who may need storage again
- People who inquire about your services
- Contacts you’ve made during physical visits to local businesses and both on-site and off-site events
Avoid purchasing email lists. Purchased email lists might seem like a shortcut, but they often include people outside your target market. These recipients may not know who you are, find your content irrelevant, or even mark your emails as spam. Building your list organically ensures your audience is familiar with your brand and genuinely interested in your services.
Create content tailored to your audience and focus your email campaigns on providing value. Examples include:
- Promotional Emails – Highlight seasonal specials, referral programs, or limited-time discounts.
- Informative Updates – Share stories from events, community involvement, or testimonials from satisfied renters.
- Retention Emails – Send reminders for payments, rental anniversaries, or suggestions for unit upgrades.
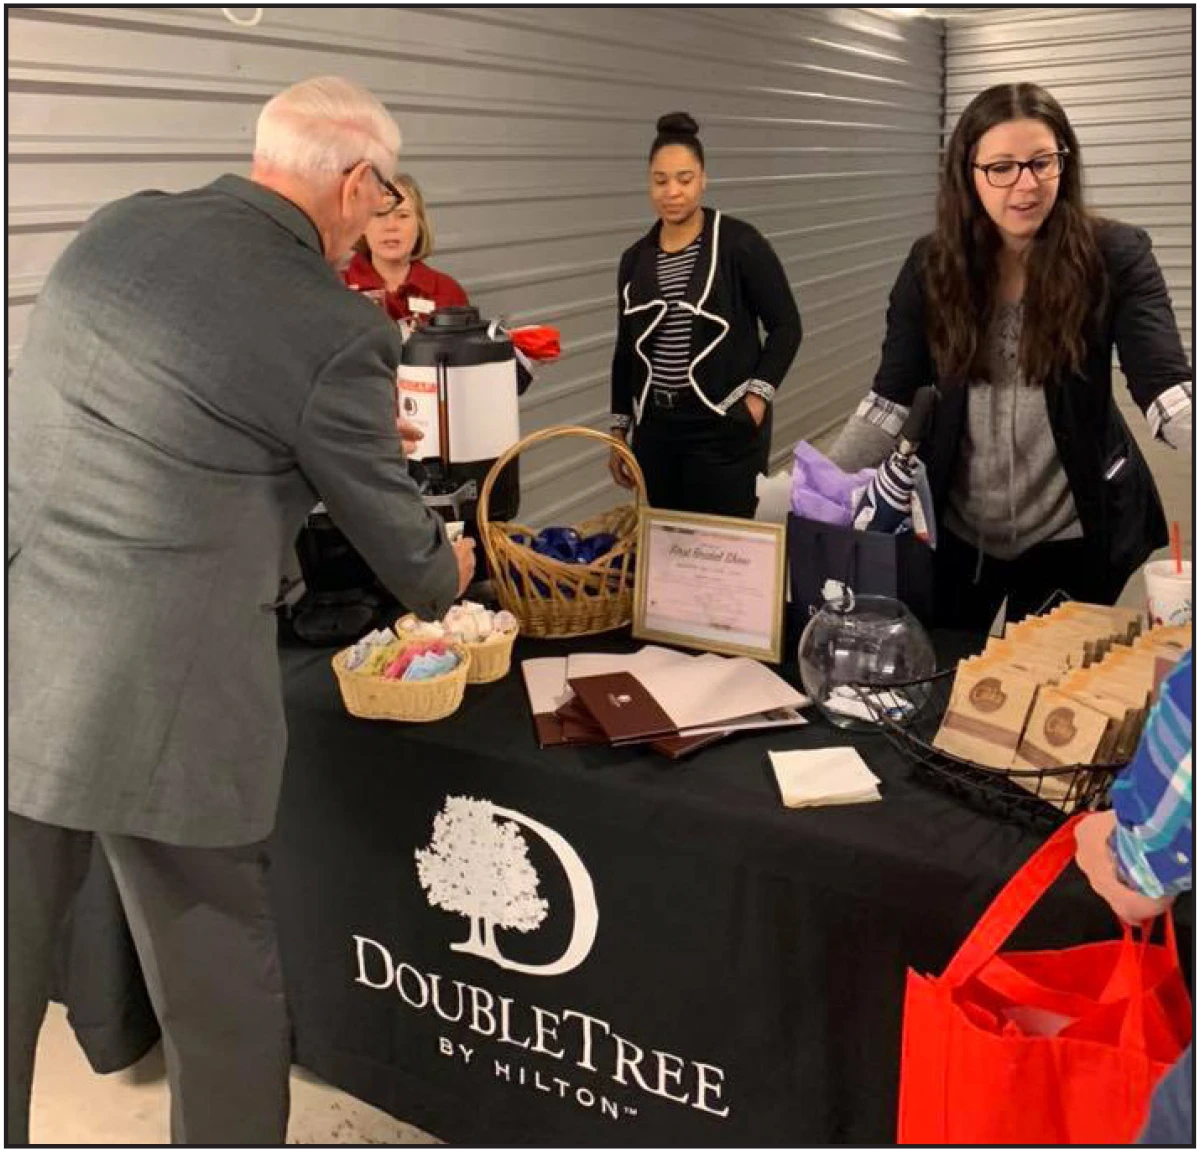
One of the most effective grassroots marketing strategies is physically visiting businesses within your 5- to 10-mile market to introduce yourself and your facility. This direct approach allows you to build personal relationships, establish trust, and invite these businesses to tour your property. Here are some tips for visits:
- Always bring something three dimensional to leave behind, such as branded promotional items, referral cards, or even small snacks with your logo.
- Collect contact information from the person you meet, such as a business card or email, so you can follow up and add them to your email list.
- Tailor your visits to businesses that align with your current unit availability. For example, visit contractors if you have large units available or offices if you have climate-controlled units that could store documents or equipment.
- If stepping out into the community feels overwhelming, start small. Visit one local business a week. Drop off a goodie, introduce yourself, and leave a card. It doesn’t have to be perfect; it just has to be consistent.
On-Site Events
Events are a fantastic way to bring traffic to your facility and create buzz. Here are some proven ideas to inspire you:
- Seasonal Celebrations – Host a pumpkin patch in the fall, an egg hunt for Easter, or photos with Santa in December.
- Charity Fundraisers – Collaborate with local nonprofits to organize events like food drives, pet adoption days, toy drives, or blood drives.
- Small Business Showcases – Invite local entrepreneurs to set up booths at your facility for a community market.
- Networking Mixers – Partner with your chamber of commerce to host business after-hours events.
Here are some tips for hosting successful events:
- Plan – Give yourself at least 90 to 120 days to organize and promote your event.
- Leverage Local Partners – Collaborate with businesses, schools, or nonprofits to share costs and broaden your reach.
- Host Throughout Your Facility – Don’t limit your event to the office. Showcase the cleanliness of your units, highlight unique features like climate control, and guide attendees through the property so they can see what you’re selling.
- Use Door Prizes and Giveaways – Encourage attendees to register for door prizes or giveaways. This not only makes your event more enticing but also helps you collect valuable contact information for ongoing marketing efforts.
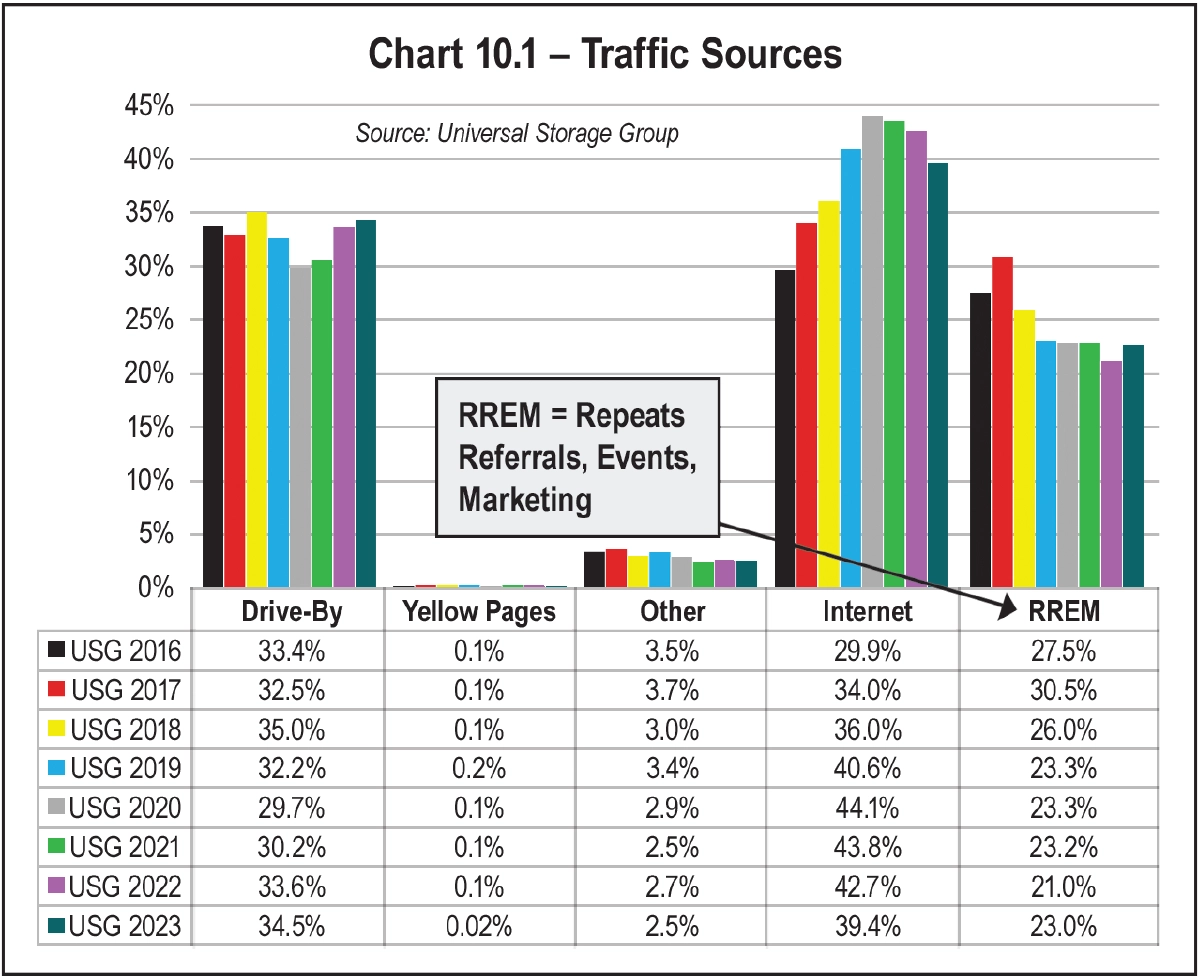
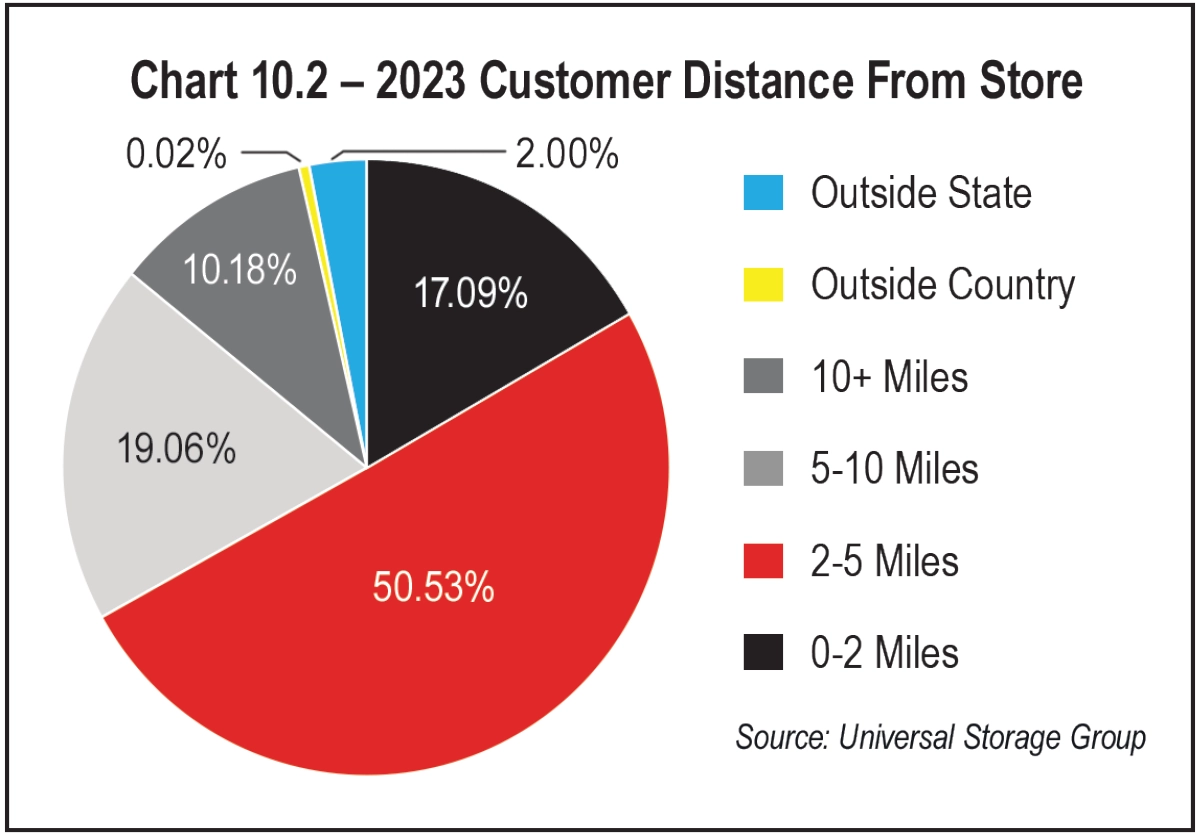
For instance, partners like realtors and moving companies should be offered a direct referral fee (cash, not rental credits). This is a clear financial incentive that motivates them to recommend your facility.
As for your competition, maintain friendly relationships with other operators. Refer customers their way when they have what you don’t (and vice versa), creating a mutually beneficial arrangement.
Tip: Make your referral program available to everyone (current customers, businesses, and even casual acquaintances). Keep it simple and easy to track.
- Demographics – Understand who your customers are (e.g., families, students, small businesses) and cater your messaging to their needs.
- Unit Availability – If you have an abundance of a certain unit size, target businesses or individuals most likely to need those units (e.g., contractors for large units and college students for smaller ones).
- KPIs – Metrics like cost per lease (CPL), lead sources, and occupancy trends help refine your marketing strategy and ensure your efforts align with your goals.
In 2023, analyzing traffic sources highlighted the critical role each marketing activity plays in driving overall results. By understanding the demographics and profiles of our customers, we can fine-tune our marketing budgets annually. This approach helps Universal Storage Group (USG) achieve the lowest possible cost per lease while maximizing the number of new renters, ensuring that every dollar spent is working as effectively as possible.
Understanding not just the sources of our traffic and renters but also their specific needs and preferences is essential. Offering specialized products and services, such as conference rooms, contractor bays, incubator offices, or enclosed and covered parking, broadens overall appeal and allows USG to attract customers from a wider geographic area. These unique offerings differentiate facilities and draw in a diverse audience with specific requirements. See Chart 10.2.
Understanding what your customers store and why they choose your location and services is the foundation of effective marketing. Without this insight, you risk investing time and money into strategies that may not resonate with your target audience or meet their needs. See Chart 10.4.
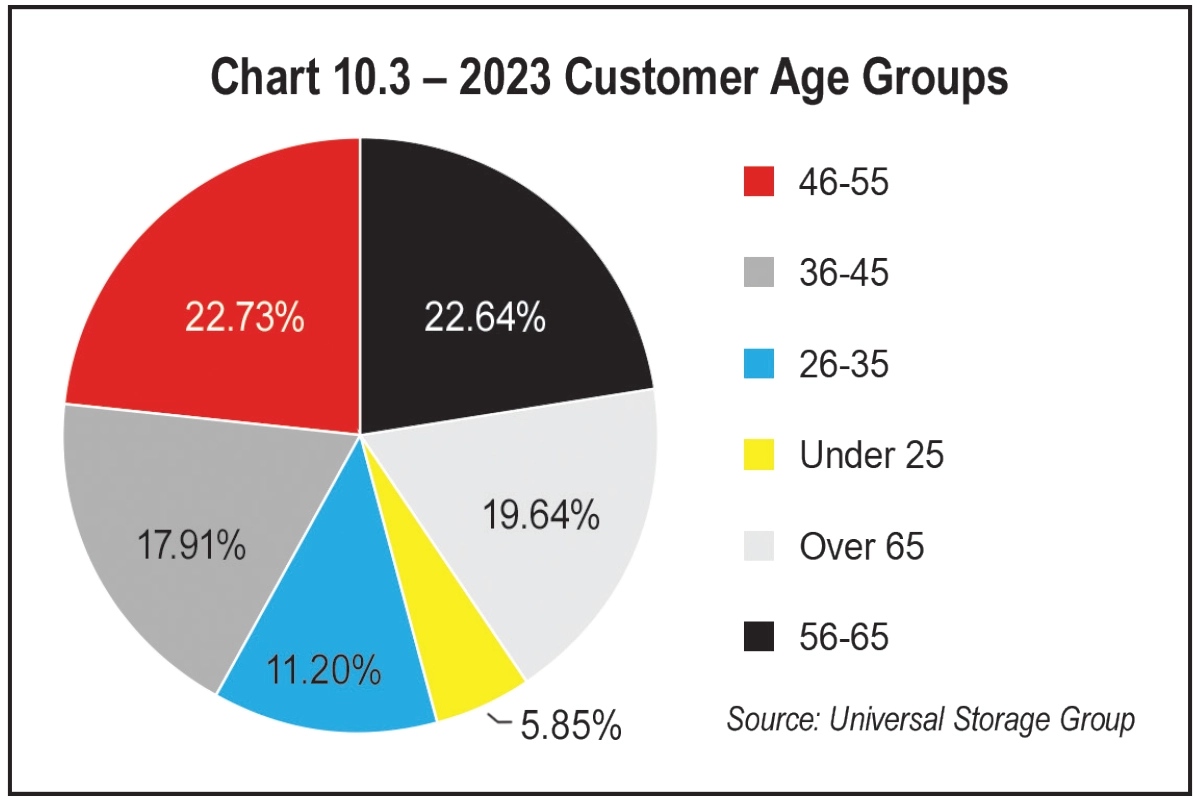
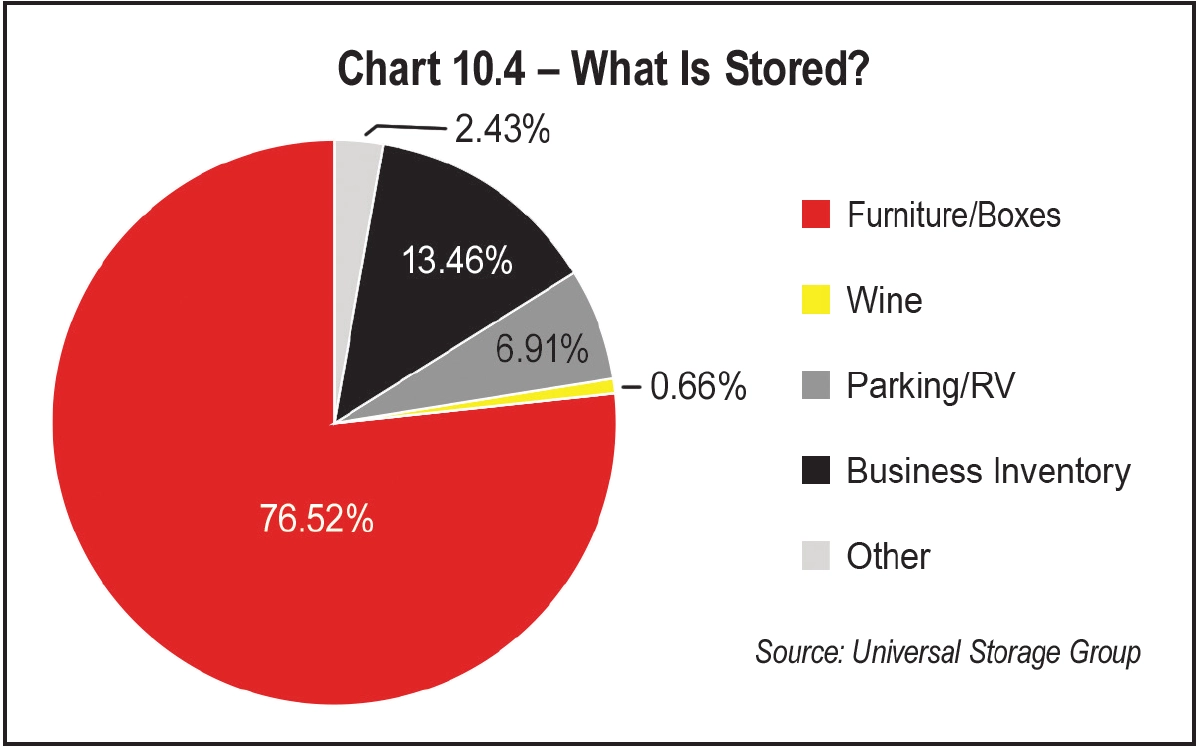
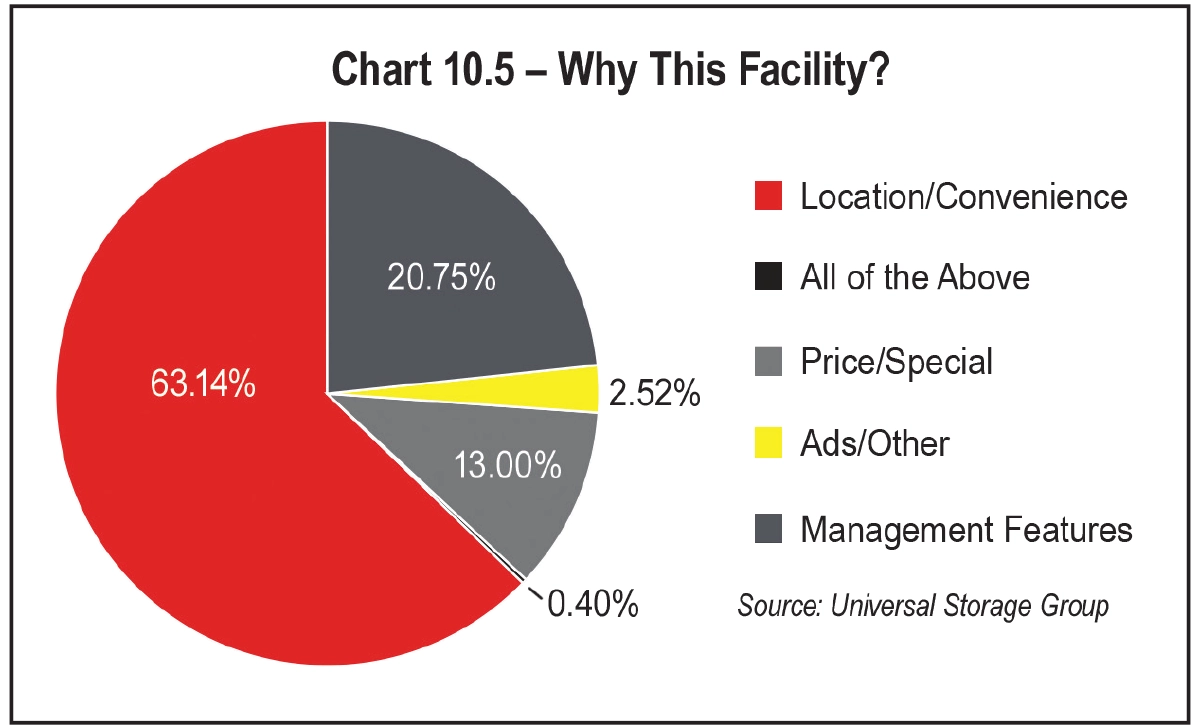
Chart 10.7, Types of Businesses, highlights the critical importance of targeting small businesses and retailers as key markets for storage solutions.
A Unified Approach
The key to successful marketing is consistency. Dedicate time each day to a mix of activities:
- Send a few emails or follow up with recent inquiries.
- Post on social media or respond to comments.
- Visit one or two local businesses, tailoring your outreach to align with your current unit availability.

- Community Involvement – Participate in local events and build relationships with key groups.
- Regular Business Visits – Dedicate two hours per week to visiting local businesses and organizations.
- Follow-ups – After each visit or event, follow up with an email or call to stay connected.
Celebrate your team’s marketing efforts. Share their successes in meetings and offer small rewards for their hard work. A motivated manager can be the face of your facility.
- Climate-controlled units,
- 24/7 access or superior security measures, and/or
- Outstanding customer service.
It’s tempting to lower prices when competition feels fierce, but remember that people choose self-storage based on value, not just cost. Show them why you’re worth it.
Your facility is more than a business—it’s a solution to someone’s problem, a partner in their journey, and a resource they can count on. Share that story boldly, consistently, and with heart.
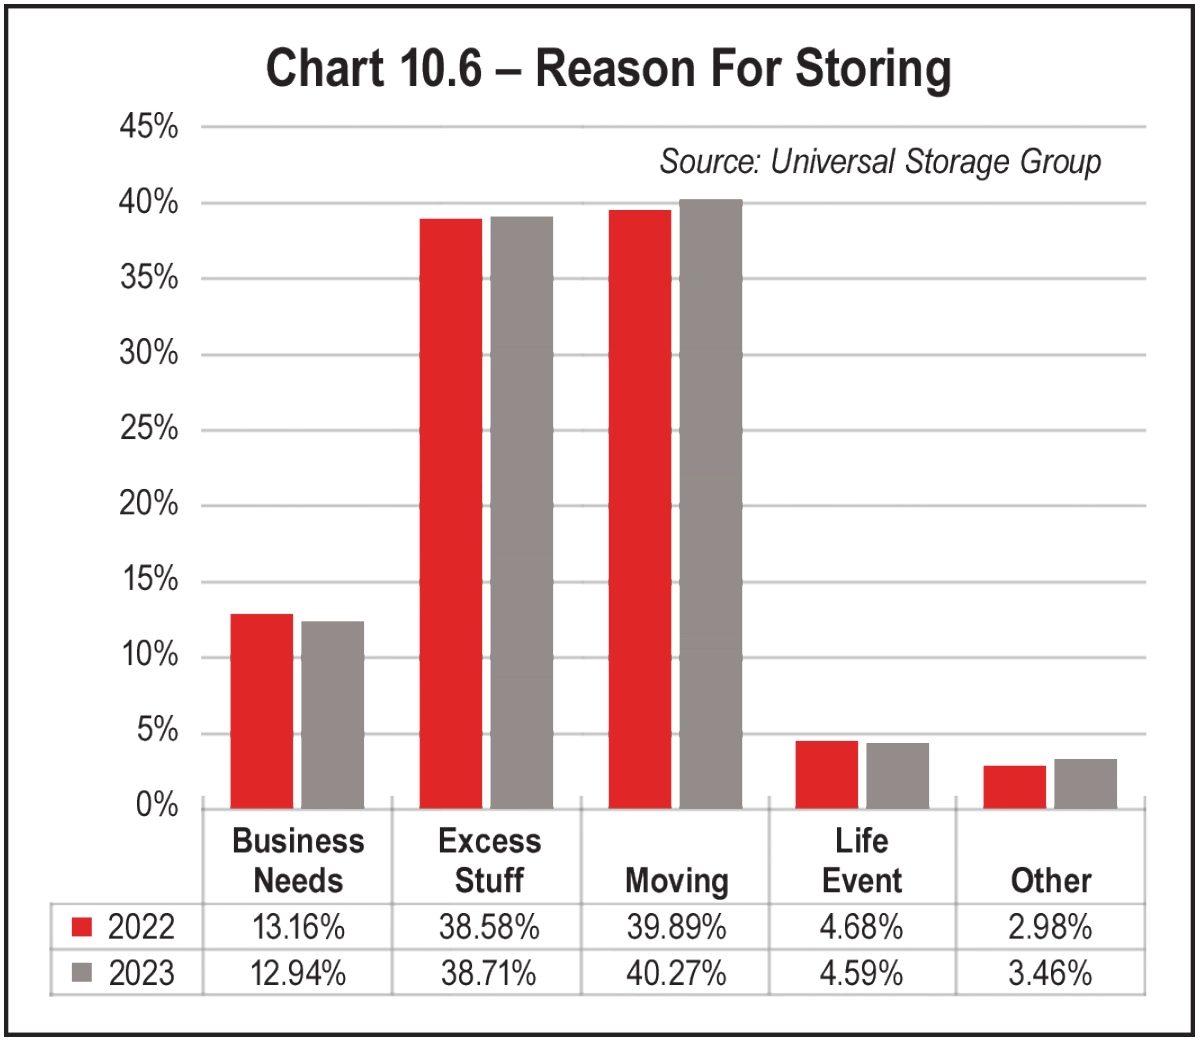
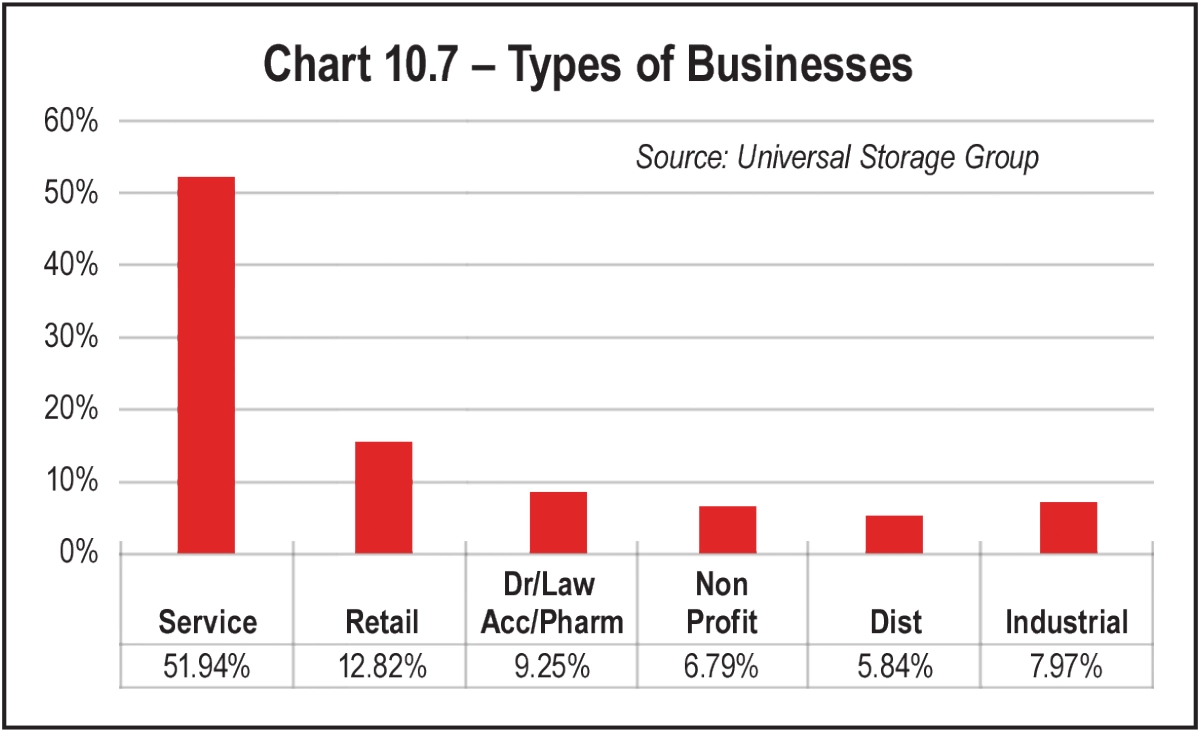
You have the tools. You have the drive. Now go out there and share your story with the world. The rewards—both personal and professional—will be well worth it!
any business, success ultimately comes down to one simple equation: the costs of providing your service versus the revenue you can generate. While many self-storage operators already run lean operations, rising customer expectations and growing competition means the need for efficiency is more critical than ever. Small adjustments in your operational processes can have a big impact on your bottom line, whether it’s reducing overhead costs or improving customer satisfaction to ensure you build tenant loyalty over time.
Self-service kiosks, while not a new technology, have proven to be a game-changer for operators looking to streamline their business further. By automating key tasks such as rentals, payments, and access, kiosks reduce the need for constant staffing, allowing you to maintain 24/7 service while keeping labor costs in check. And with recent advancements in kiosk technology that have made these systems more intuitive and customer-centric, with interactive facility maps, secure payment processing, and real-time assistance from remote agents, the self-service experience is not only comparable to human interaction but even more efficient and reliable in many cases.
Self-storage facilities used to rely heavily on on-site staff to facilitate face-to-face customer service—a trend that persisted long after many industries had leveraged self-service tools to enable consumers to complete a transaction or solve issues without human intervention. As early as 2013, Zendesk found that more than two in three customers preferred self-service over speaking to a support agent, as presented in its article “Self-Service: Do Customers Want to Help Themselves.” While the self-storage industry has historically been slower to adopt technology, self-service kiosks have been on the scene since 2003. As the pressure to operate efficiently intensifies in an increasingly competitive market, integrating technology into your facility could be the key to boosting profitability without compromising service quality. Storage kiosks have gained popularity as a critical means to both ends.
In this section, we will explore the essential considerations when integrating kiosks into a self-storage site. From timing and environmental factors to staffing needs and evaluating kiosk vendors, we’ll provide a comprehensive guide to ensure kiosks provide maximum operational value, efficiency, and tenant satisfaction.
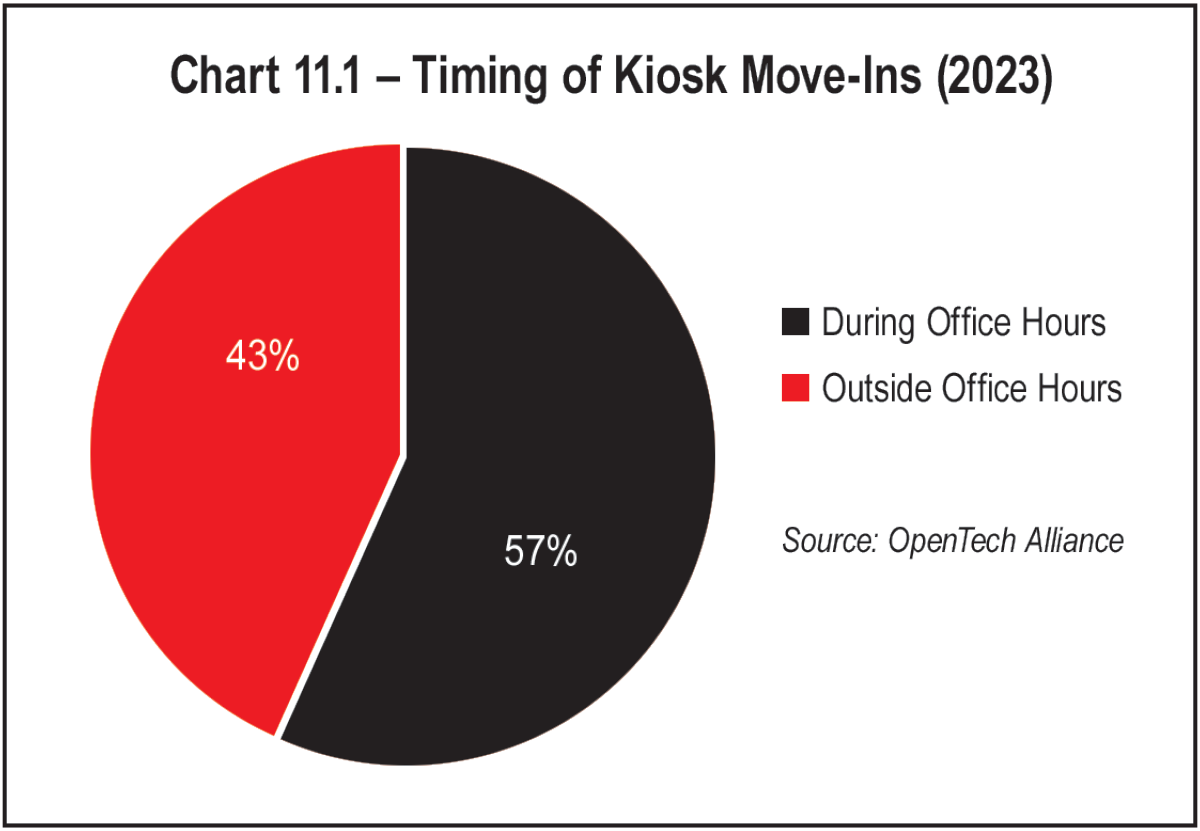
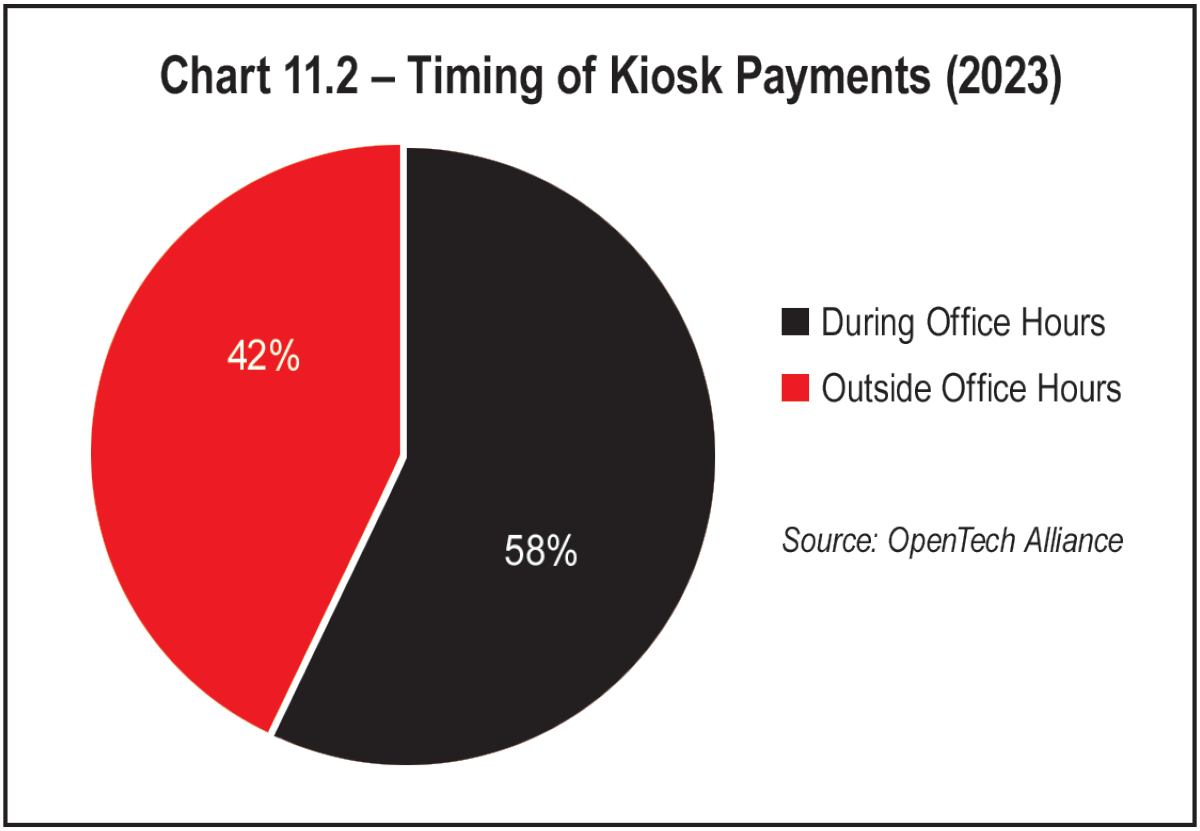
Kiosks can increase operational efficiency by automating a wide range of tasks to support new tenants and existing customers, including unit rentals, payments, ID verification, account updates, unit selection, virtual property tours, and lease signings. This automation enables facilities to generate new rentals and allows tenants to obtain service without the need for on-site staff involvement, which is particularly beneficial during off-hours or when staff are unavailable.
For operators, kiosks provide significant flexibility. Forty-two percent of payments occur outside standard office hours, and 57 percent of move-ins take place during business hours, underscoring the value of offering self-service options around the clock. This flexibility appeals to a broader range of customers, including those with non-traditional schedules, like students, factory workers, and people working long or irregular shifts. Kiosk move-ins outside standard office hours increased 24 percent year over year—a trend that could be indicative of either an increase in operators managing their facilities remotely or an increasing tenant preference for self-service technology. See Chart 11.1 and Chart 11.2.
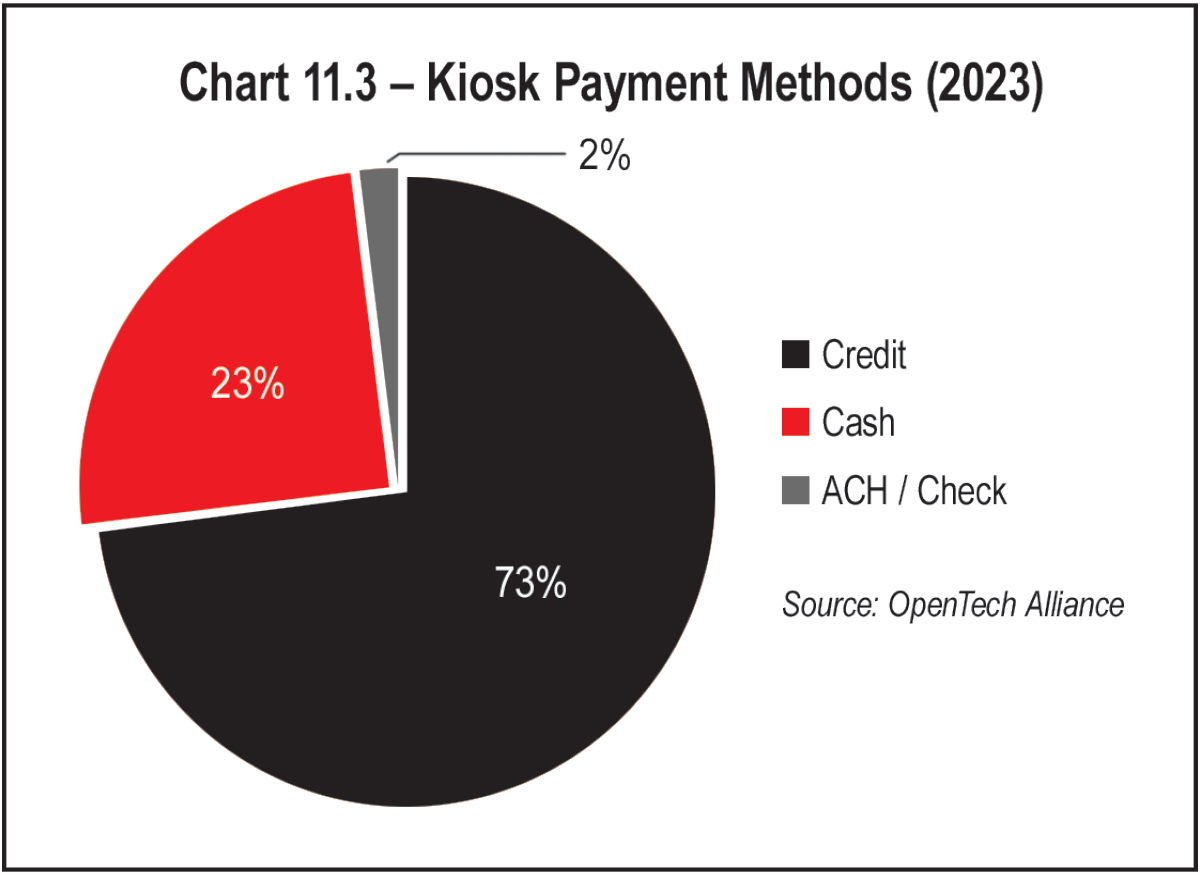
For smaller operators who may have limited staff or resources, kiosks provide a scalable solution. They reduce the need for full-time, on-site employees while still enabling the facility to serve tenants effectively. This can make managing a facility much more manageable and efficient.
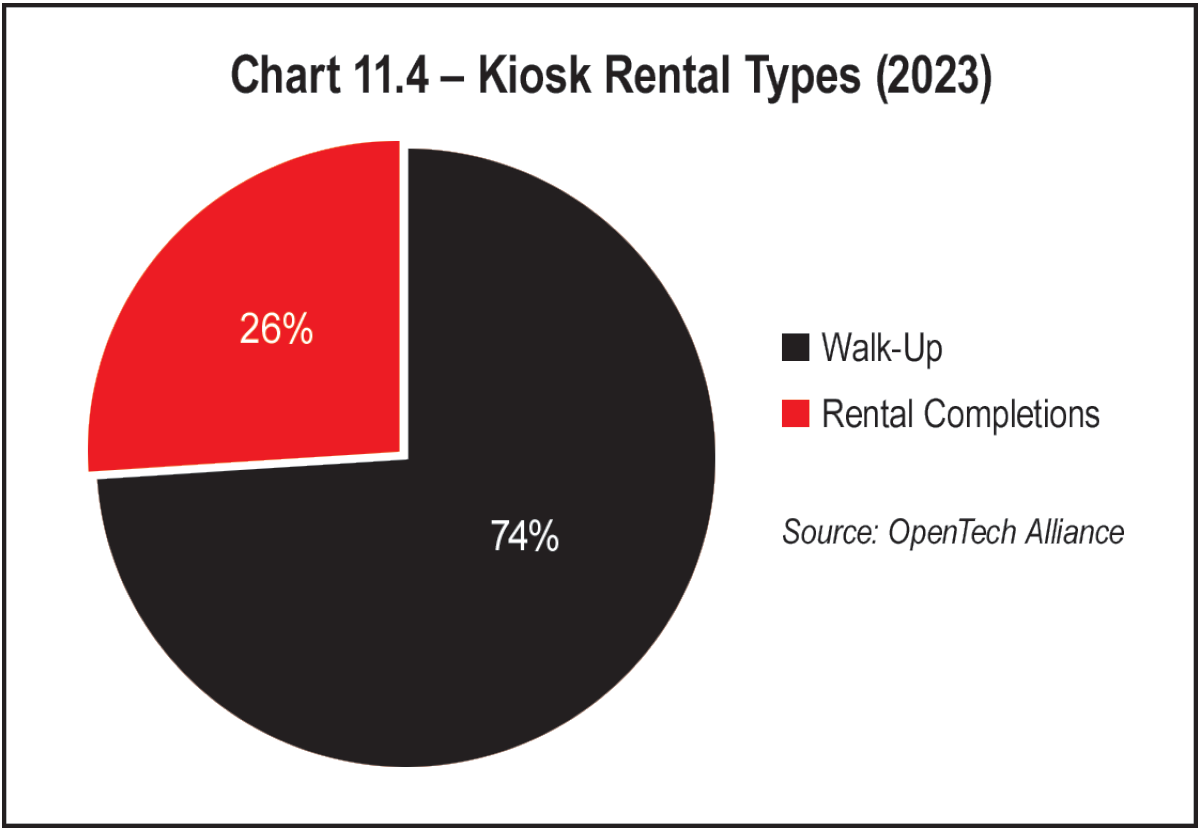
Additionally, tenants can sign leases electronically, scan identification documents, and make payments—all without the need for face-to-face contact with a staff member. This kind of autonomy can create a more positive experience for tech-savvy tenants who prefer managing their tasks independently. It also enhances security by reducing human error, ensuring that important tasks like lease signings and ID verification are properly handled, and creating a digital recording of the new tenant and on-screen transaction.
Timing Of Implementation
The decision to install kiosks should be made early in the development process for a new facility. When designing a self-storage facility, operators should ensure that proper infrastructure (such as electrical power and data connectivity) is included to accommodate kiosks. It’s important to factor the kiosks into your initial capital expenditures, as this will help streamline financing and provide a clearer overall budget.
Kiosks can be especially valuable in the early stages of facility operations, such as during lease-up or when occupancy is low. They provide a cost-effective way to increase occupancy and streamline operations without requiring a full staff presence. For high-occupancy facilities, kiosks can still provide significant benefits by automating tasks such as after-hours unit rentals and payments. A notable number of tenants choose to make their monthly payments at a kiosk outside normal office hours (42 percent in 2023)—a number that increased 7 percent YOY—taking advantage of the expanded business hours that the technology offers.
Environmental And Facility Considerations
When selecting kiosks, operators should evaluate where they will be placed within the facility. Kiosks may be installed indoors or outdoors. The environment can significantly impact the customer experience and what hardware features are required to ensure it attracts traffic and stands the test of time. Outdoor kiosks need to be weatherproof and able to withstand varying conditions. Ensure your kiosk is properly rated for the temperature extremes in your area. For facilities in colder or more remote regions, kiosks may need additional protective elements, such as a vestibule, awning, or other protection from rain or snow. Some kiosks come with built-in lighting, which not only ensures visibility at night but also reduces the need for additional installation costs.
Many operators will construct an indoor vestibule to leverage the best of both worlds. This is an indoor location that doesn’t grant unnecessary access to the building but provides protection from the elements and helps tenants feel safe.
Indoor kiosks should be placed in areas with high foot traffic and adequate lighting to attract tenants. Signage is a key consideration regardless of the location you choose for your kiosk. Signage should be placed prominently around the facility, especially near entrances and parking areas. Tenants should easily spot the kiosk and understand that they can rent or pay for units 24/7 without the need for assistance from on-site staff. If outdoors, signage visible from the street that promotes 24/7 rentals can help capture drive-by and walk-up rental traffic (which we know accounts for a significant ratio of new rentals). Leverage both directional signage throughout your property that alerts tenants to the presence of an on-site kiosk and informational signage that speaks to the services your kiosk can support. If your vendor permits, consider customizing digital signage on the kiosk itself to promote both available services as well as property amenities and specials.
Staffing And Onboarding
While kiosks can significantly reduce the need for on-site staff, they do not eliminate the need for facility staff entirely. People will be needed to conduct routine facility maintenance and essential tasks such as checking locks and performing regular property checks. If the facility operates under a roaming manager or hub-and-spoke model, kiosks can play an essential role by providing a self-service option for tenants when no manager is on site or when they are occupied on the property elsewhere. In this scenario, kiosks become a vital component of the facility’s overall operation, enabling tenants to complete their transactions without relying on the presence of an on-site manager.
Regardless of how you manage your facility, it’s important to consider the kiosk an integral element of your operating model and treat it as such. While the technology may feel “plug-and-play” from a setup standpoint, operators that see the most success from their kiosk work to intentionally integrate it into their rental and operations processes.
Marketing And Rental Integration
Just as it’s important to onboard your staff to the addition of a new rental and service tool in your arsenal, it’s essential to market your kiosk to future and existing tenants. Consider all the places within your customer journey that you should make tenants aware of the convenience provided by a self-service rental and payment machine. Add your kiosk to your on-site amenities and within your online rental flow to capture potential tenants researching online who would prefer to visit your facility before locking themselves into a storage unit. Promoting 24/7 rentals has the added bonus of increasing your presence in Google search listings when your facility may otherwise be closed. Update your voicemail listing to alert missed callers of another way to rent at your property and add a note to your auto-responses on your social channels so prospective tenants know they can still rent at your facility, even after-hours. Finally, be sure to notify new tenants in welcome emails and paperwork that the kiosk is available to take payments and provide service anytime. If you’re implementing the kiosk at an existing facility, be sure to send an announcement to your current tenants too.
Vendor And Solution Evaluation
Choosing the right kiosk vendor is one of the most critical decisions operators will make when integrating kiosks into their facilities. When evaluating kiosk vendors, operators should consider several factors:
- Cost and Financing – The upfront costs of kiosks can vary based on the features and hardware required. Operators should evaluate whether leasing or purchasing kiosks makes more financial sense in the long run. Consider also the recurring costs related to ongoing service and support and if tax incentives are available to reduce the initial burden of purchasing your kiosk. When calculating the potential return on investment, be sure to evaluate potential for increased rentals or incremental revenue, along with anticipated staff savings.
- Features and Functionality – Kiosk functionality is one of the most important considerations. Operators should choose kiosks that have a proven track record of performance and are supported by continuous updates and technology advancements. Some of the more recent advancements include interactive maps, live video help, and motion detection to trigger custom tenant engagement. Additionally, kiosks should have the necessary hardware to enable tenants to scan identification, sign leases, and complete payments in a secure and private manner that ensures that they comply with industry standards for safeguarding customer data (e.g., PCI compliance for payment processing, protection of PII, etc.).
- Remote Troubleshooting and Support – Downtime can negatively impact the customer experience and revenue. Vendors that offer remote troubleshooting support can significantly reduce downtime, ensuring kiosks remain operational. Operators should also look for vendors who provide regular software updates and ongoing system improvements to enhance the overall tenant experience.
- System Integration – Kiosks should seamlessly integrate with the facility’s property management software (PMS), gate access systems, and third-party or in-house call center teams. Ensuring that the kiosk works harmoniously with other operational systems helps create a smooth, efficient experience for tenants and staff alike.
- Robust Experience in Self-Storage – A vendor with extensive experience in the industry, coupled with a vested interest in supporting long-term customer success, can offer invaluable insight and stability, ensuring that the solution not only meets current needs but also evolves with the demands of the industry over time.
- Urban Areas – Kiosks in densely populated urban areas help capture tenants who may not otherwise interact with the facility during regular office hours. These facilities often see a high volume of drive-by and walk-up customers; kiosks provide a self-service solution for these tenants, allowing them to complete rentals or payments without needing staff assistance.
- Rural Areas and Low Occupancy Facilities – In rural areas or during the lease-up phase, kiosks help bridge the gap for facilities with limited staff or low occupancy. They offer a cost-effective solution for managing tenant interactions without requiring full-time staff.
- Hub-and-Spoke and Roaming Manager Models – For facilities managed under a hub-and-spoke or roaming manager model, kiosks provide a self-service solution that allows tenants to manage their rental process without waiting for an on-site manager. This allows operators to manage more facilities with fewer staff and ensure they don’t miss vital rental opportunities or tenant payments in the meantime.
- Factory or Shift-Based Locations – Kiosks are particularly beneficial for self-storage facilities near factories or areas with shift-based workers. Kiosks allow these workers to rent units or make payments outside regular office hours, aligning with their non-traditional work schedules.
Careful planning is essential to ensuring the successful implementation of kiosks. Operators must consider factors such as timing, placement, staffing, marketing, and vendor selection to make the most of this technology. By leveraging kiosks effectively, operators can meet the evolving needs of the self-storage market and provide exceptional service to tenants around the clock.


he RV and boat storage sector has emerged as a lucrative niche in the self-storage industry, driven by strong demand for secure and specialized parking solutions. With a growing number of RVs and boats in use nationwide, coupled with restrictions on residential parking, the need for dedicated storage facilities is on the rise. As this segment gains investor interest, understanding market dynamics, trends, and challenges is essential.
U.S. boat registrations totaled 11.5 million in 2023, showing a 1.9 percent decline from 2022. The state with the most boats registered in 2023 was Florida, but it showed a sizable 8.1 percent drop; the state with the most significant increase was Iowa, with 7.9 percent more boats registered in 2023. The NMMA also pointed out that unregistered boats are becoming a substantial portion of the landscape—23.9 percent of the total is now unregistered.
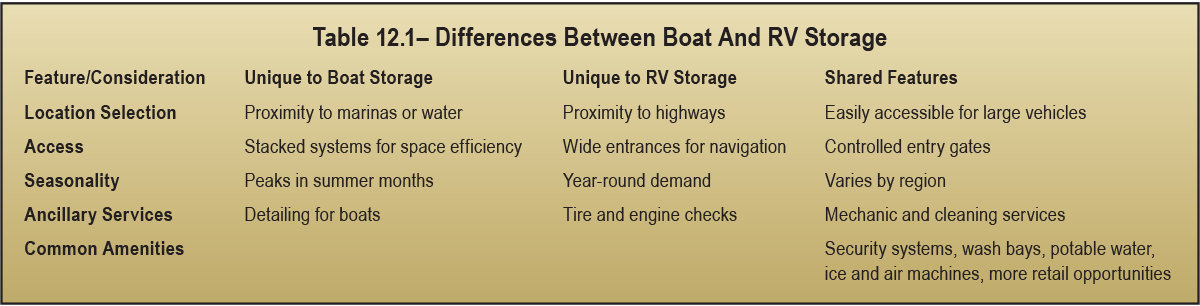
Towable RVs, led by conventional travel trailers, ended the month up 4.2 percent from last September with 22,279 shipments. Motorhomes finished the month down 30.1 percent compared to the same month last year, with 2,316 units. Park Model RVs finished September down 12 percent compared to the same month last year, with 294 wholesale shipments. To date, all RVs are up 7.7 percent compared to the same period last year, with 256,412 units shipped through September.
- Dump stations are essential for waste management and provide a critical service for RV owners between trips.
- Wash bays offer convenience for cleaning and maintenance of RVs and boats before and after use.
- Potable water and air stations ensure readiness for travel by allowing users to fill tanks and tires conveniently on site.
- Solar charging stations are eco-friendly options that enable owners to maintain battery health with trickle charging at individual stalls.
- Play areas for kids encourage family-friendly use of the facility, especially during extended visits for vehicle maintenance or preparation.
- Dog parks cater to pet owners, adding a layer of convenience for families traveling with dogs.
- On-site mechanic shops save customers time and create additional revenue streams.
- Free ice machines are a simple yet attractive feature for boaters and RVers preparing for long trips or fishing outings.
- Advanced security systems with high-quality surveillance and controlled access systems offer peace of mind to customers storing valuable vehicles.
- Paving options (asphalt, concrete, or permeable paving) – Depending on location and environmental considerations, paved lots provide easier navigation and reduce wear on vehicles.
Facilities offering a mix of these amenities are likely to attract a loyal customer base and justify premium pricing.
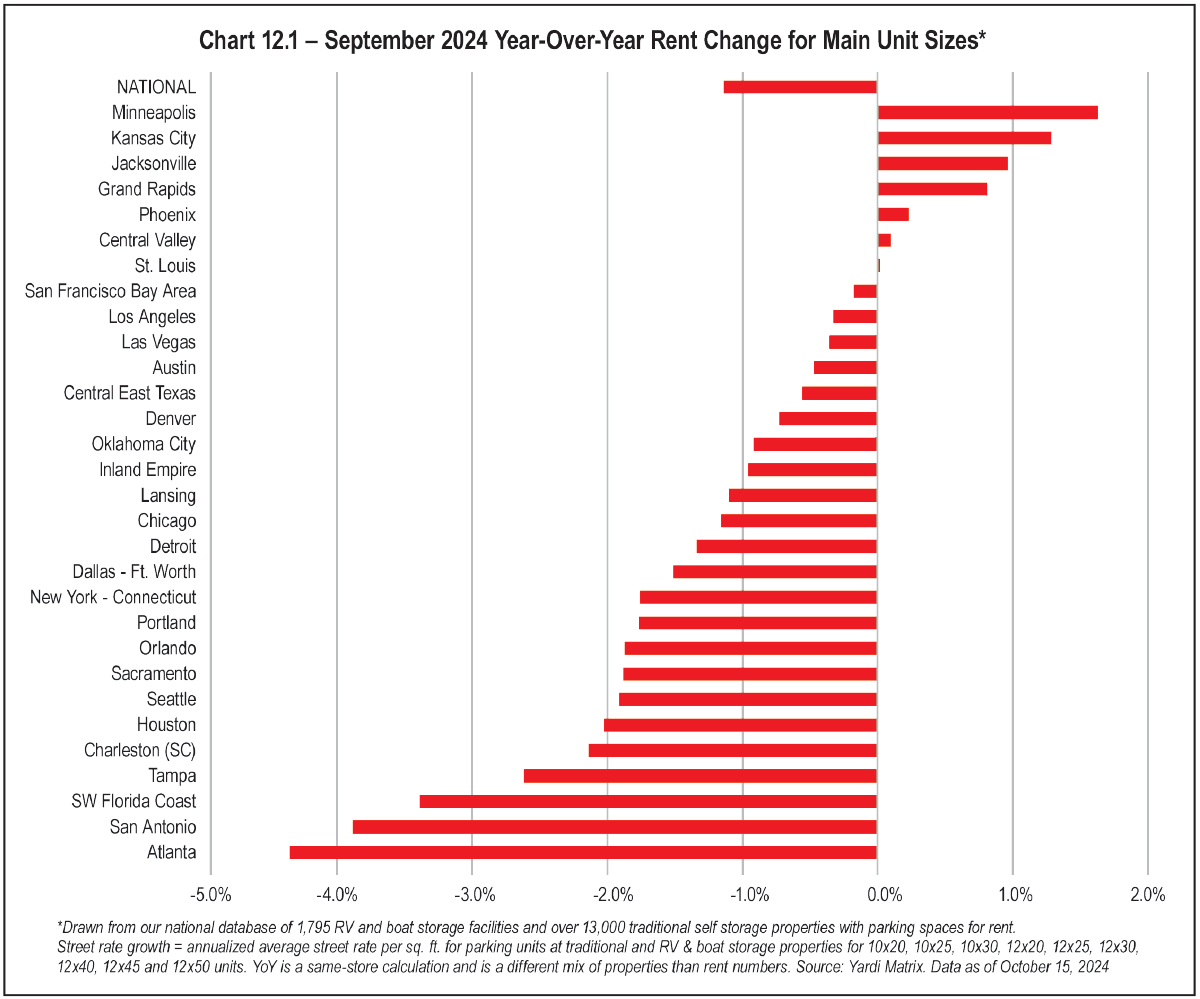
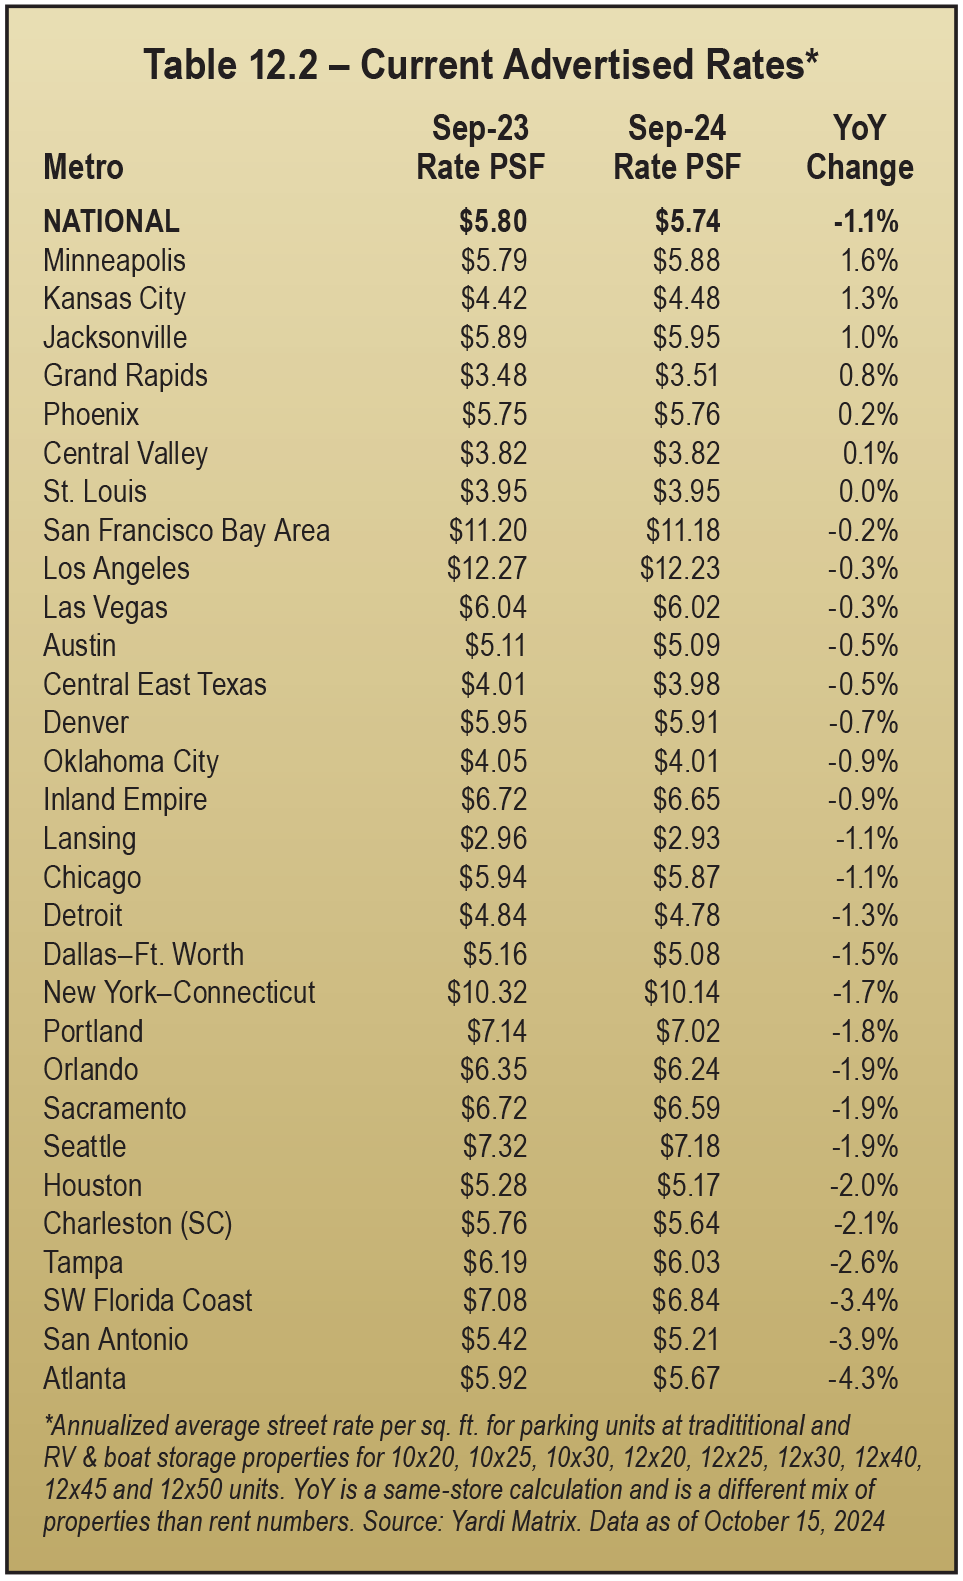
Automated properties use technology to manage customer interactions, access control, and other management tasks. These systems often include keypads, mobile apps, security cameras, and online reservation/payment platforms.
Pros
- Cost Savings – There are lower operational costs due to the reduced need for on-site staff.
- Convenience – Customers can access the facility 24/7 without waiting for assistance.
- Scalability – It’s easier to expand operations or manage multiple locations remotely.
- Efficiency – Automated systems streamline processes such as billing, reservations, and gate access.
- Enhanced Security – Technology can offer real-time monitoring, access logs, and alerts.
Cons
- Limited Customer Interaction – The lack of personal touch may deter customers who prefer in-person support.
- Higher Upfront Costs – A significant investment is required for automation infrastructure.
- Technical Issues – System failures or outages could disrupt operations and frustrate customers.
- Reduced Oversight – Absence of on-site staff may result in slower response to maintenance issues or emergencies.
In-Person Managed Properties
Properties that are managed in person use staff to manage day-to-day operations, customer service, and facility maintenance.
Pros
- Personalized Service – Customers appreciate having staff available for questions, assistance, and guidance.
- On-Site Problem Solving – The immediate resolution of issues such as mechanical failures or access problems prevents downtime and business interruption.
- Human Oversight – Staff can provide additional security and ensure proper use of the facility.
- Upselling Opportunities – Staff can promote ancillary services such as detailing, repairs, or premium amenities.
Cons
- Higher Operating Costs – Payroll and benefits for employees increase expenses.
- Limited Hours – Staff availability may restrict customer access outside regular working hours.
- Scalability Challenges – Managing multiple locations requires more staff and administrative oversight.
- Inconsistent Quality – Customer experience can vary depending on staff performance.
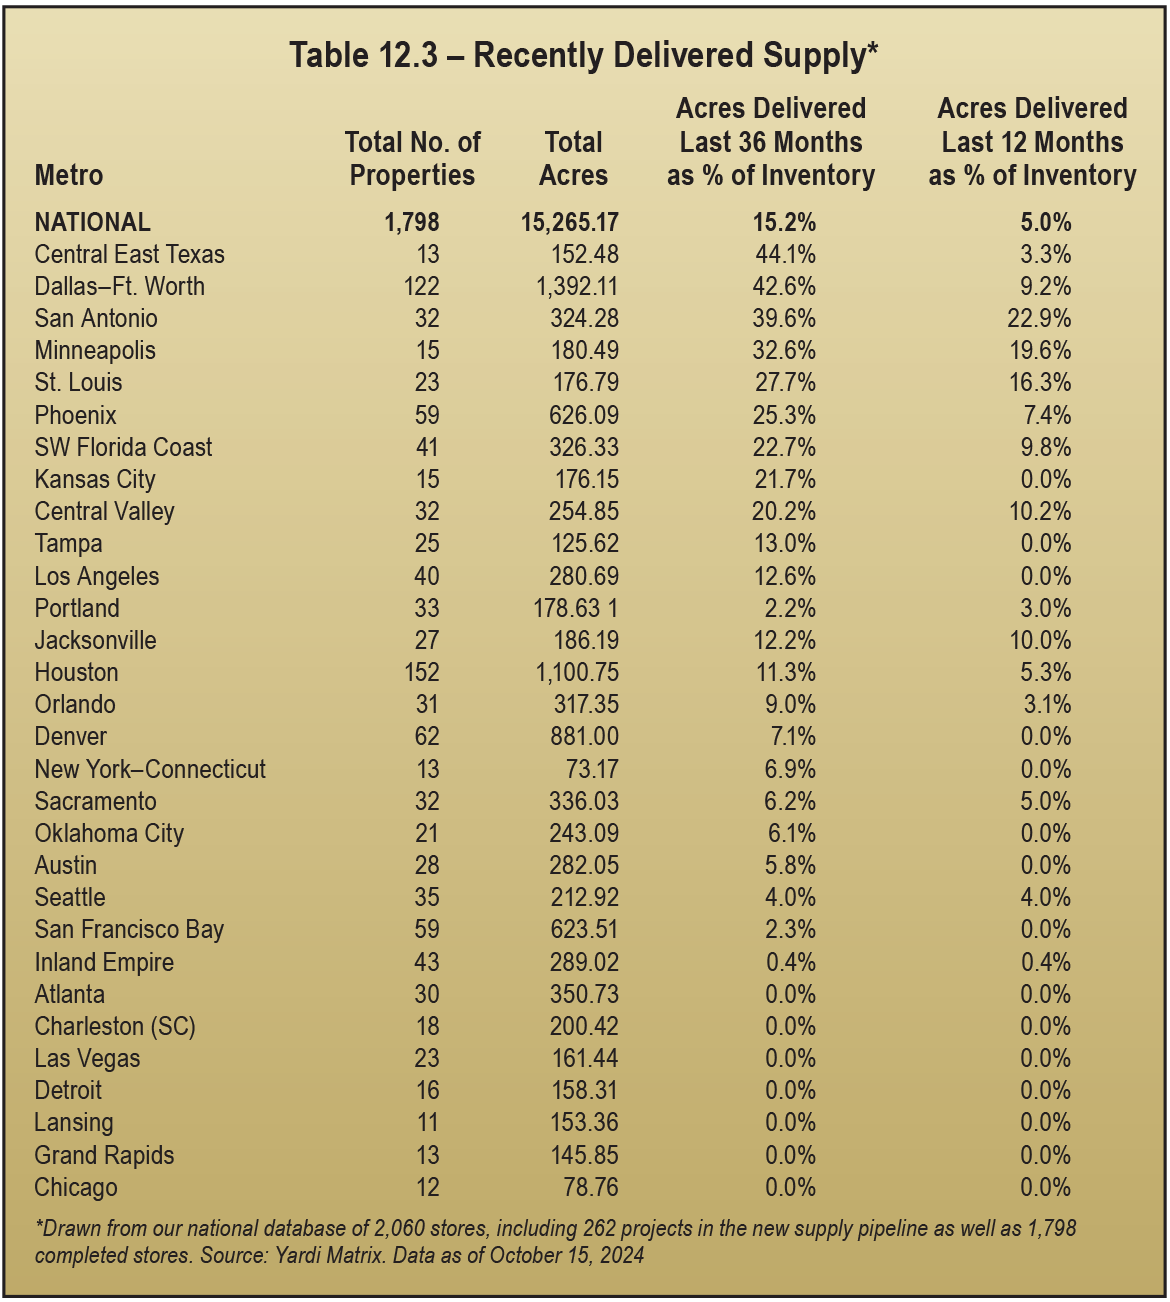
Many facilities employ a hybrid approach, merging automation with limited on-site personnel. For instance, automated systems manage the basic, everyday functions of entry and payment. Staffing is kept to a minimum, but personnel are available during peak hours as well to provide more complicated, specialized services. Benefits of a hybrid model include:
- Balance of Cost and Service – It reduces overhead while maintaining a level of personal interaction.
- Flexibility – It offers 24/7 access with support during critical times.
- Customer Satisfaction – It combines convenience with the reassurance of human oversight.
The decision between automated and in-person management depends on the facility’s target market, location, and operational goals. Automated systems work well for tech-savvy customers and urban areas, while in-person management excels in rural or community-focused settings. A hybrid approach often provides the best of both worlds, maximizing efficiency and customer satisfaction.
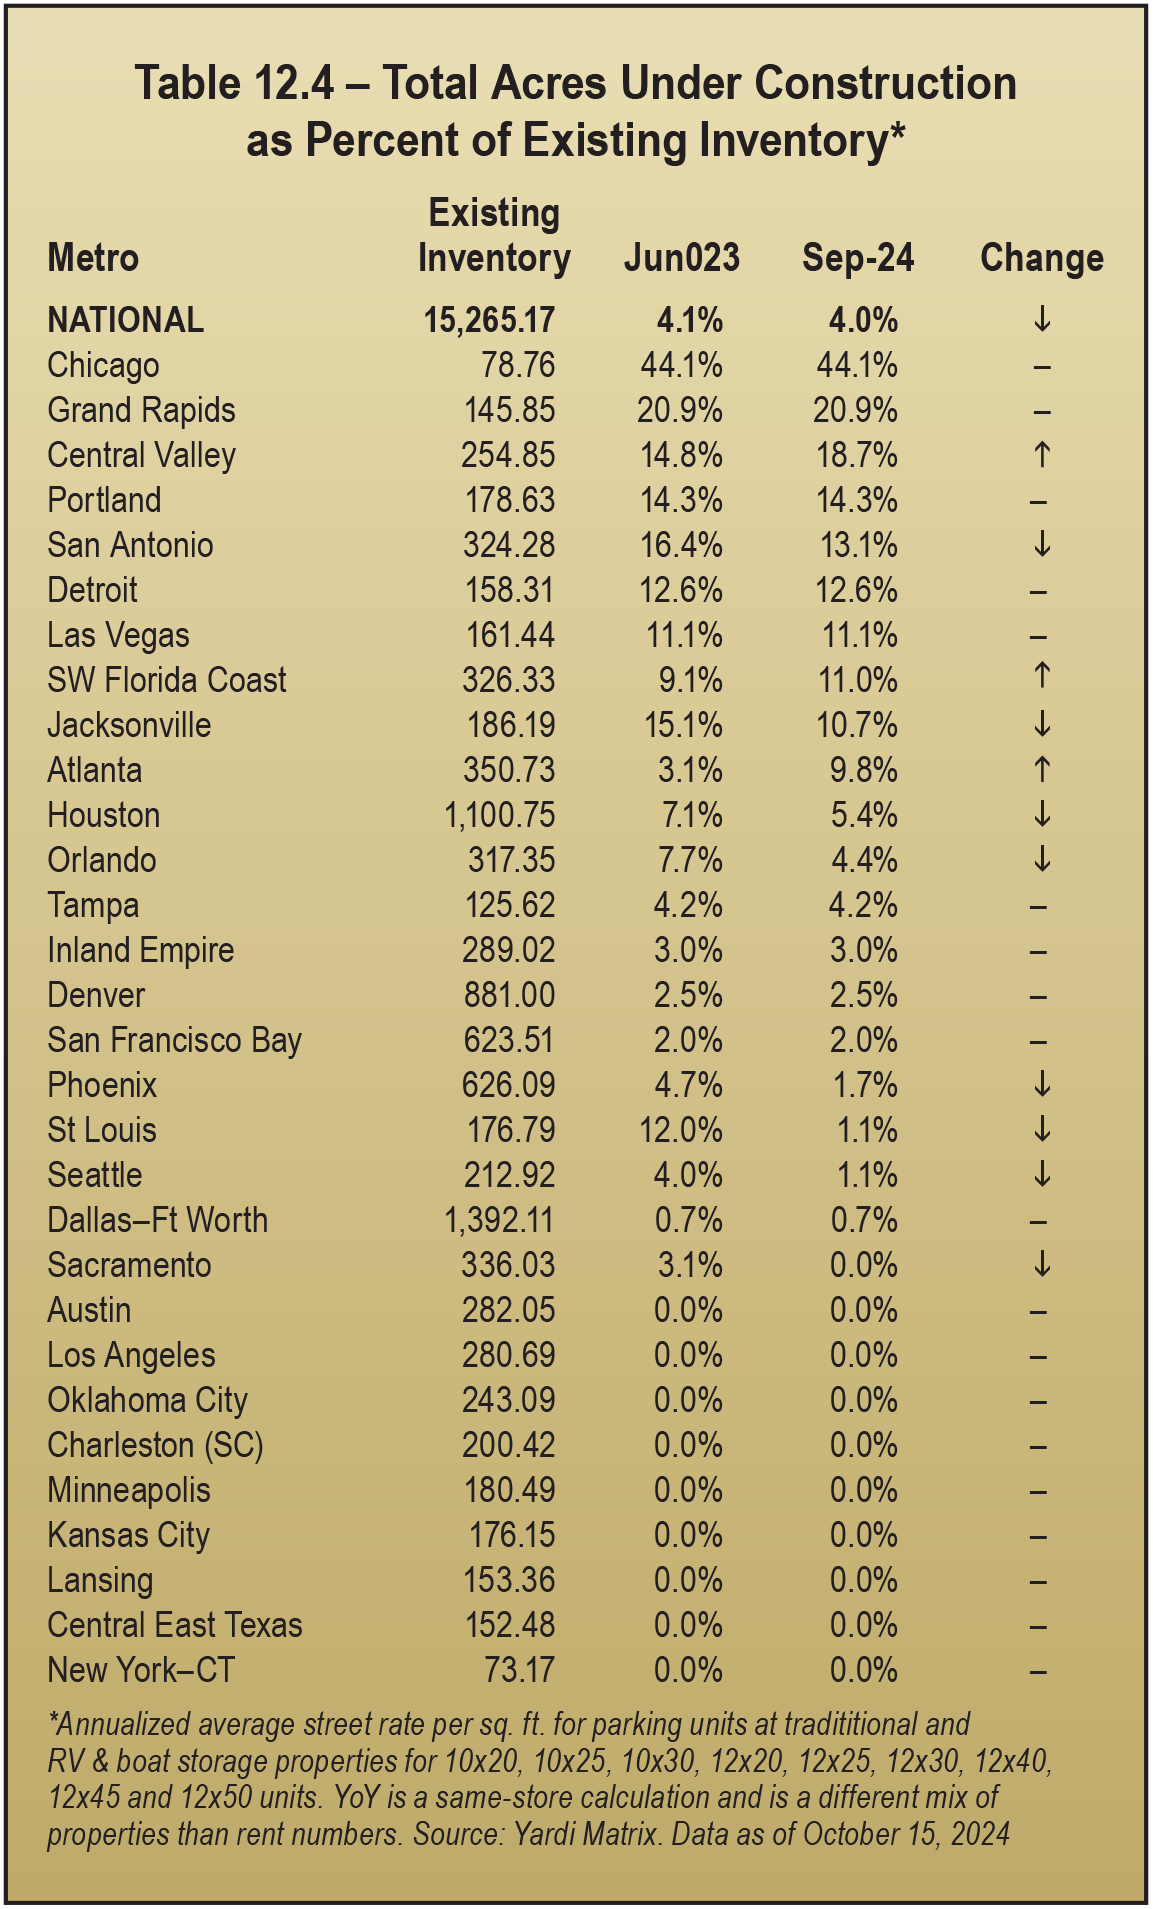
Rent growth also decelerated to -1.1 percent from -0.5 percent in June. Month-over-month declines were more severe in Q3 2024 than Q3 2023, but the sector is outperforming traditional self-storage, where rents dropped 3.5 percent year over year in September. Rent declines were more noticeable in smaller parking units (10-by-20, 10-by-25, and 10-by-30), down 1.4 percent, versus larger units (12-by-40, 12-by-45, and 12-by-50), where rents have remained flat from last year.
Rent growth has varied by market, with seven posting rent growth year over year, led by solid growth above 1 percent in Minneapolis and Kansas City. Sun Belt markets, which tend to have more existing supply, have seen the greatest declines in rates. Atlanta, San Antonio, and Southwest Florida have experienced growth below -3 percent. Most of the markets with the greatest declines in rates have also seen some of the biggest declines in self-storage rents, suggesting a correlation with self-storage performance, although all these markets have also shown more moderate rate growth in the larger parking space sizes.
RV and boat registrations have both fallen from record levels in 2021, while at the same time construction of new dedicated RV and boat storage facilities has increased, particularly in smaller markets in the Midwest and Southeast. There is still a supply-demand imbalance caused by the increase in RV and boat sales during the pandemic and a lack of Class-A dedicated RV and boat storage properties nationally.
Development interest picked up over the summer, with Yardi Matrix tracking 56 dedicated RV and boat storage facilities under construction and 162 planned in September, an increase from June. Despite a growing pipeline, trailing 12-month completions (net rentable square feet) as a percent of stock was 4.4 percent, down 20 basis points in the past three months.
Sales of dedicated RV and boat storage properties picked up in the summer, with 16 sales since July, bringing the number of properties sold in 2024 to 39. Sales volume is still behind 2023, with about 342 acres sold by fall 2024, down nearly 30 percent from October 2023 year-to-date but higher than pre-pandemic years (2014 to 2020). Average sales price per acre was also down to $627,283, versus $685,774 in 2023 and $768,287 in 2022.
A few smaller Midwest markets like Minneapolis, Kansas City, Grand Rapids, and St. Louis have been seeing more resilient rent growth, despite some recently delivered supply in these places. On the other hand, Sun Belt markets with recent high migration have fared worse. Below-average growth in Atlanta, San Antonio, the Southwest Florida Coast, and Tampa corresponds with new dedicated RV and boat storage supply in these places and below-average self-storage rent growth.
Rate declines recently have been mostly concentrated in the smaller parking units. Only five markets saw flat or increasing rates in 10-by-20, 10-by-25, and 10-by-30 spaces, which are usually only suitable for personal vehicles, trailers, and boats. This compares to 15 markets with increasing rates in the larger unit sizes of 12-by-40, 12-by-45, and 12-by-50, which can fit a modern full-size recreational vehicle. Grand Rapids saw a 4.2 percent year-over-year increase in rents for large parking units, followed by Las Vegas at 3.8 percent growth, Kansas City with 2.8 percent growth, and the Bay Area with 2.1 percent growth.
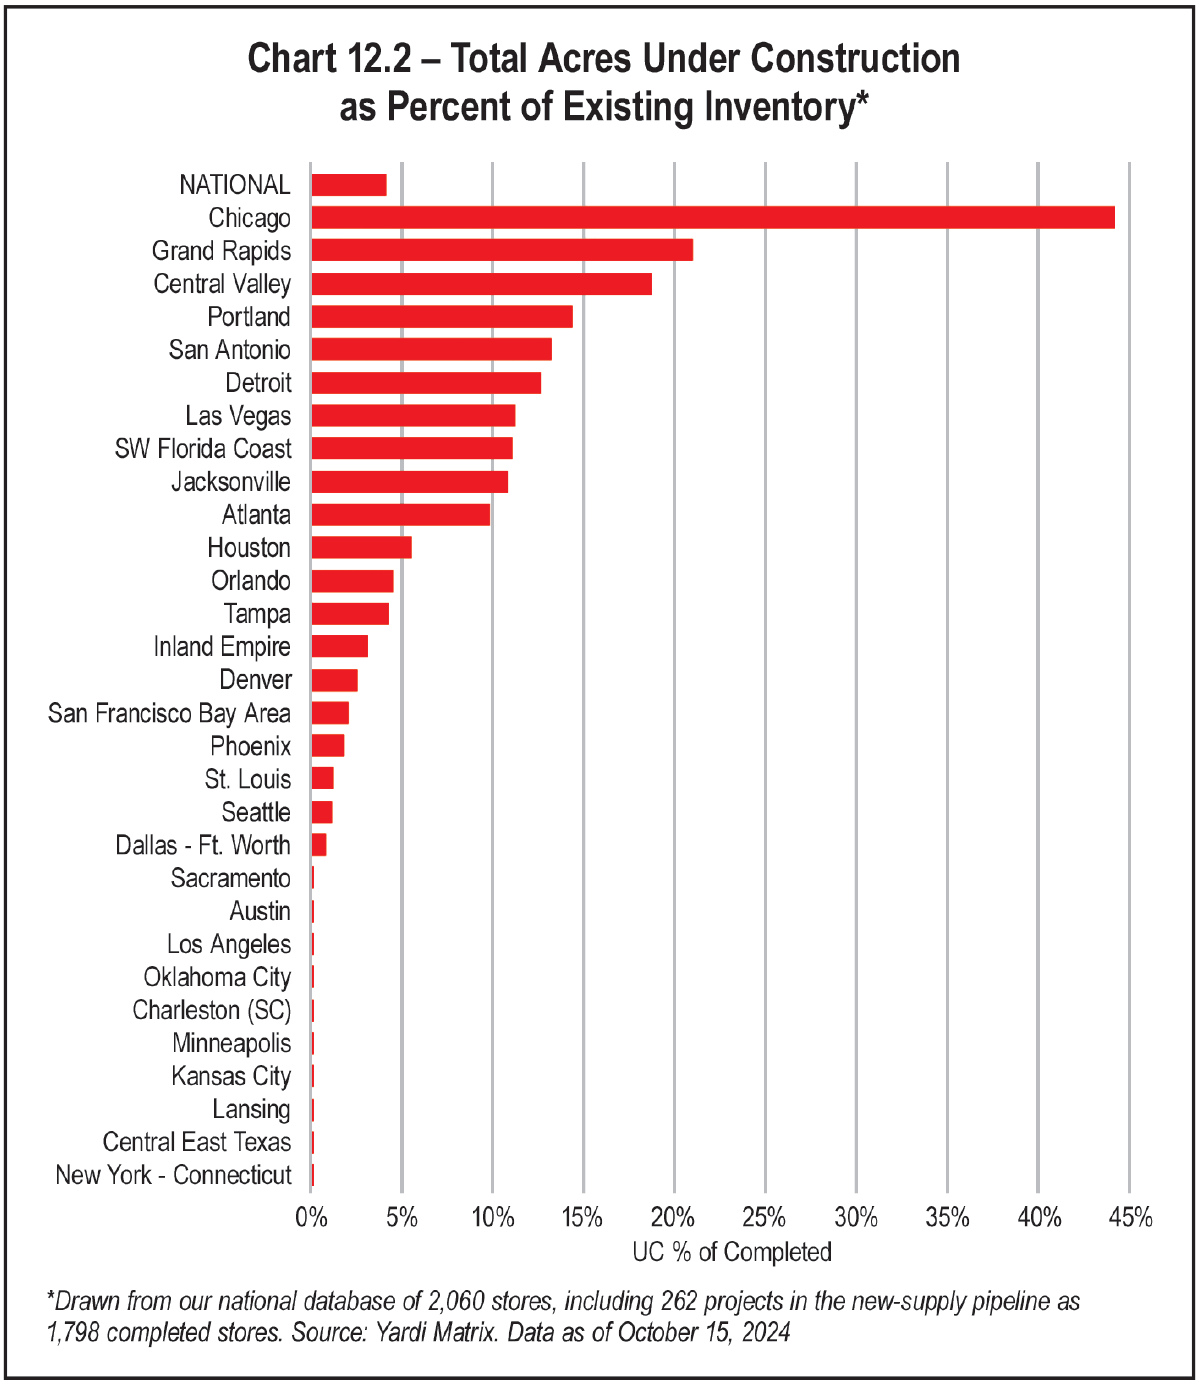
Above-average supply has not had an impact on rent growth in Minneapolis, St. Louis, or Kansas City, which posted above-average rent growth in September. Conversely, Atlanta and Charleston have posted below-average rent growth despite no new dedicated RV and boat storage supply being built in the past three years. These markets could feel pressure from multiple new traditional self-storage properties that include substantial parking.
Total acres under construction as a percent of stock was 4 percent in September, a small 10-basis-point drop from the last report in July as developments have been completed, and a 50-basis-point decline from the three-year peak in October 2023. Construction financing and decline in rate growth are two potential reasons for a slowdown in construction activity. Despite this, three markets (the Central Valley of California, the Southwest Florida Coast, and Atlanta) have seen an increase in supply under construction since June as new projects have broken ground.
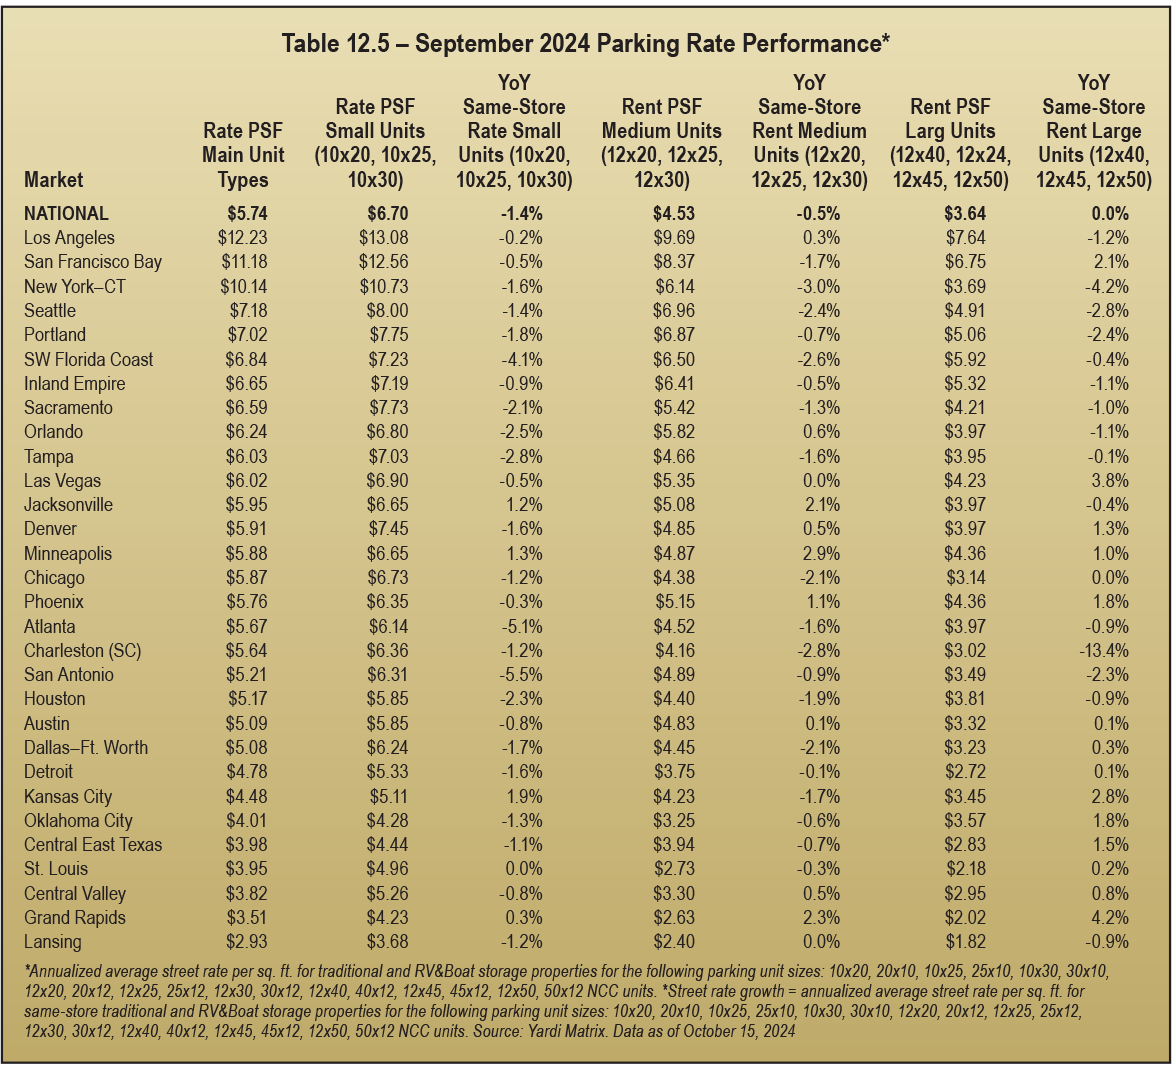


arket sentiment regarding macro economic conditions are rising, based on expectations of continuing compression in interest rates in 2025. As a result, investor interest in the self-storage asset class remains high. Self-storage is resilient to both inflation and recession and is considered by many market participants to be a safe haven. For example, self-storage has outperformed other core sectors of real estate (such as apartments and industrial property) for an extensive period, according to NAREIT data. This demonstrates confidence in the sector over the long run.
In “Self-Storage Economics and Appraisal,” market conditions is outlined as the core of self-storage economics. It is described as an analysis of the market conditions that affect value using both qualitative and quantitative techniques. One tool, benchmarking, can be a starting point of analysis. For example, a measure of the total self-storage supply per person in the local trade area can be benchmarked to core-based statistical area (CBSA) data published in the Almanac. Another tool, the Cost of Occupancy, can measure rents as a ratio of average household income to CBSA data also published in the Almanac.
Supply data by CBSA comes directly from the proprietary database of Radius+ with known self-storage locations based upon latitude and longitude confirmations. The Radius+ database also includes actual square footage data; therefore, the square footage contained in the Almanac is not reported on a site-specific basis rather than on an industry average.
Determinants of the self-storage market relate to the forces of supply and demand, as is the case with other types of real estate. The analysis of demand generators, however, is focused on four key variables:
- Population,
- The percentage of renters,
- Average household size, and
- Average household income.
A simple econometric model can be used to estimate self-storage demand. Table 13.1 shows the results of regression analysis using a proprietary model. However, this data can be easily duplicated in spreadsheet software or statistical packages. In the multiple regression model, the dependent variable is square feet of self-storage per person. The independent variables are the demographic variables by CBSA: population, percentage of renters, average household size, and average household income. Comparing existing supply to demand can be used as a benchmark to determine if a CBSA is undersupplied, oversupplied, or near equilibrium.
Capital Markets Update
Capital allocators currently find better risk-adjusted returns issuing debt than they do deploying equity into assets or ventures, thus providing opportunity for new debt products to become available, including new self-storage bridge loan programs.
CMBS lending is currently the most constructive its been since 2021; bond buyer demand for favored asset classes like self-storage has increased, leading to tightening spreads, including AAA spreads, which have compressed 100-plus basis points (bps) since Q4 2023.

Finance companies and private credit providers have raised significant amounts of capital and are eager to deploy; pricing is inside of SOFR plus 300 bps, with the ability to push proceeds and provide creative loan structures.
Banks continue to be highly selective with most groups, pushing for partial recourse and/or significant depository relationships; money center banks and regional banks remain closer to the sidelines than foreign banks.

State Of The Transaction Market
Transaction volume was limited in the first quarter of the year, largely due to continued volatility in the debt markets; however, transaction volume is expected to increase into the second half of the year as the trajectory and overall environment of interest rates becomes clearer and the buyer/seller pricing spread narrows from the currently estimated 10 percent to 15 percent.
Long-term investors are biased towards dense, urban markets that have a strong renter population and are less reliant on short-term demand drivers. The decreasing average size of apartments is a long-term tailwind for these markets.
Investors are currently underwriting 3 percent to 3.5 percent average annual revenue growth; however, expect to generate outside growth performance by 2026.
While the transaction market has been muted recently, roughly 30 percent of deals brought to market over the last 12-months have transacted, compared to the long-term norm of closer to 85 percent. The second-quarter activity felt like more deals would cross the finish line.
Given the lack of arms-length transactions, clarity into market pricing and cap rates have been difficult; however, the consensus is indicative of going in rates that range from 5.75 to 8.0 percent depending on the market/submarket dynamics and quality of the asset. Cap rates for most top-50 MSAs are in the 5.75 percent to 6.15 percent range.
Portfolio premiums have narrowed significantly from peak pricing, yet buyers are still willing to pay a premium for a “true” portfolio that has geographic concentration and economies of scale.
Street rates seem to have hit a bottom in Q1, with positive signs for the 2024 leasing season; outliers in certain trade-areas are prevalent where operators are forced to compete with the least-common denominator.
Revenue management systems have become paramount to increasing revenue, with a focus on bifurcating the rent roll into different cohorts to understand market rents and apply efficient revenue management strategies with the ultimate goal of lessening the gap between street and in-place tenant rates.
The sector has benefited from increasing lengths of stay and decreasing tenant churn, indicating higher utilization rates and increased stickiness of the consumer base.
Rising insurance costs have forced owners to pay more attention to the environmental risks associated with certain markets and rethink their overall portfolio composition.
New technologies have not been a source of decreased expenses but have increased customer satisfaction and reduced friction in the overall customer experience.
The coastal markets have been particularly challenged given the difficulty with entitlement processes, elevated construction costs, increasing insurance requirements, and high interest reserves resulting in high carrying costs for developers.
Developers underwriting new deals include a conservative discount to market rents while driving physical occupancy in initial lease-up to provide a safe margin of error in proformas.
While construction costs are up 40 percent to 50 percent since 2017, they are flat year over year.
Land sellers are holding firm on pricing and are willing to outlast the current spike in cap rates, which is leading to an optimistic view on the future of interest rates and subsequent decrease in cap rates.


he overall capitalization rate or “cap rate” is used to convert income to value. One of the easiest ways to think of the relationship of a cap rate to value is the acronym IRV: Income divided by Rate = Value or I/R = V. As the cap rate goes down, the value goes up. Officially, the direct capitalization is defined by The Appraisal Institute in the Dictionary of Real Estate as follows (page 65):
To complicate matters, a cap rate can be calculated on last year’s net operating income (often called trailing), a forecast of next year’s expectations of net operating income (forecast). Moreover, the “true” cap rate is often a perspective, not a fact. For example, the seller may believe the cap rate was a 5.50 percent, implying a higher value, while the buyer may believe the cap rate was a 6.0 percent, implying a higher return. And, the broker involved in the deal may report a 5.75 percent cap rate. While all three perspectives are important to understand, it doesn’t exactly determine the cap rate.
For comparison purposes, it is best to understand the forecast or stabilized cap rate (for example, this is the cap rate used in an appraisal) and the trailing cap rate to understand expectations of buyers and sellers in the transaction. It is also important to understand if expenses were adjusted to market, particularly real estate taxes, in the forecast of a stabilized cap rate. For the purposes of this article, the stabilized or forecast (sometimes called Year 1) cap rate will be addressed because it is typically the most consistent cap rate considered for comparison purposes (for example, it is the basis of Investor Survey’s on cap rates).
- Direct Cap Comparables – Deriving comparables from similar properties that have sold is generally the preferred technique when sufficient information is available. For example, what cap rate is reported? The trailing or the stabilized? Comparable cap rates are summarized in Table 14.1 below.
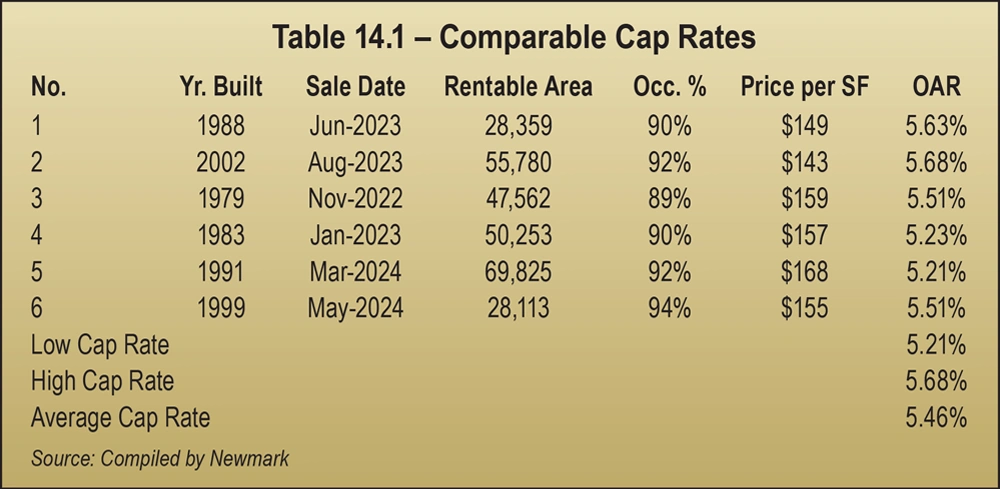
- Investor Surveys – Survey research is based on periodic publications of the current thinking of investors, compared to historical performance data of comparable sales. Surveys are generally used as support and should not be relied upon as a primary source. They are very useful to understand real-time market dynamics. Surveys can vary in scope of research, so it is worthwhile to review a wide variety of publications. The results of the most recent self-storage investor surveys are summarized in Table 14.2 on the previous page.
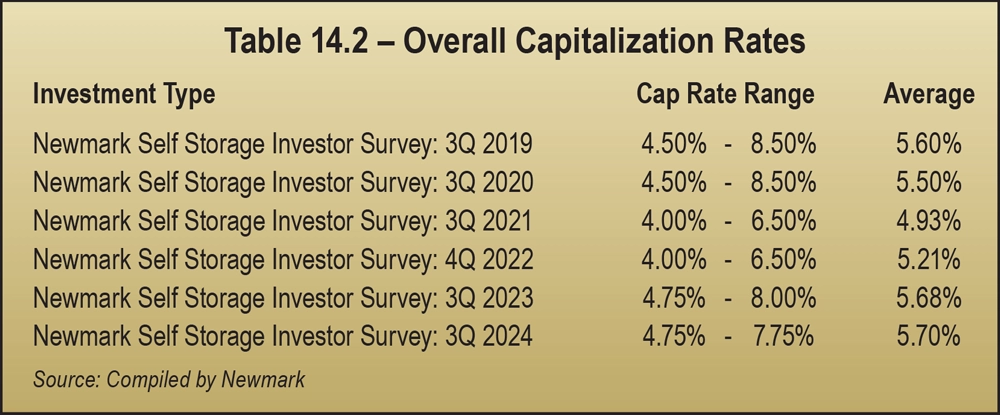
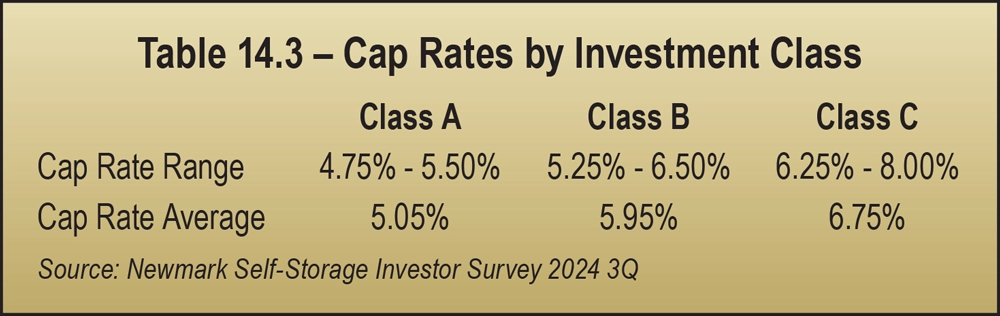
- Band of Investment – This technique is based on returns to debt and equity, sometimes called a built-up model. It accounts for market-based financing with a market-based return to equity. The return to equity for a single asset is typically higher than a comparable self-storage annual return to investor or dividend from a self-storage REIT or stock (does not account for appreciation of the asset). Another way to look at the equity dividend, or cash on cash, is the annual return on every dollar of equity. Since most properties are purchased with a combination of debt and equity, the technique has relevance in the market. A Band of Investment Analysis example is summarized in Table 14.4 on the opposite page.
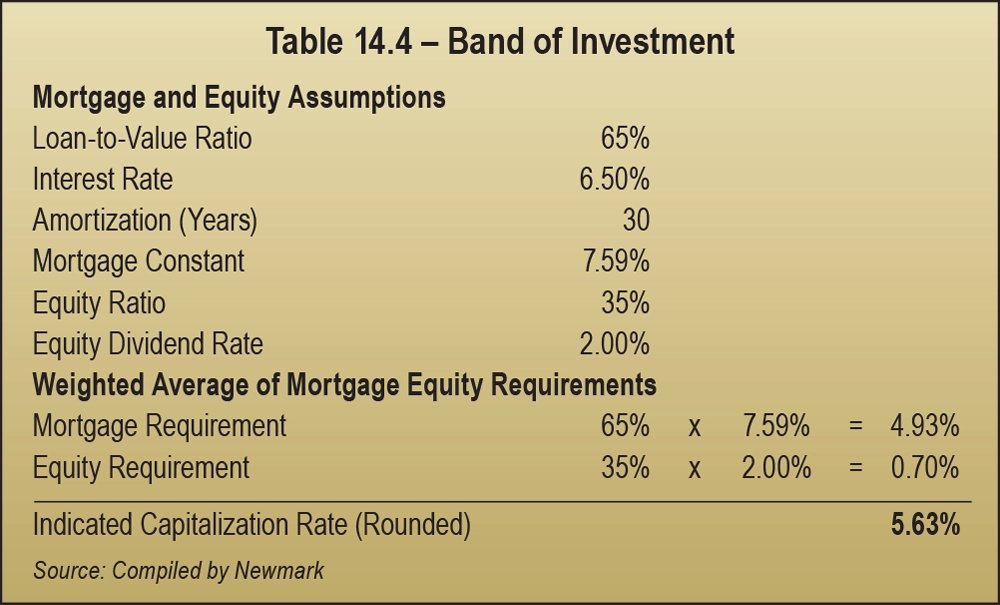
Over the past year, the return to equity has changed significantly higher due to lower interest rates. In the past, some investors were willing to underwrite a negative return in the initial year to make a deal pencil, but that means significant upside is expected in rents. Common to industrial and apartment sectors, this is new for self-storage. It is another indicator that institutional investors have confidence in the self-storage asset class in bull and bear markets. Over the past year, a significant increase in equity dividend indicates a stronger emphasis on cash flow in the year ahead.
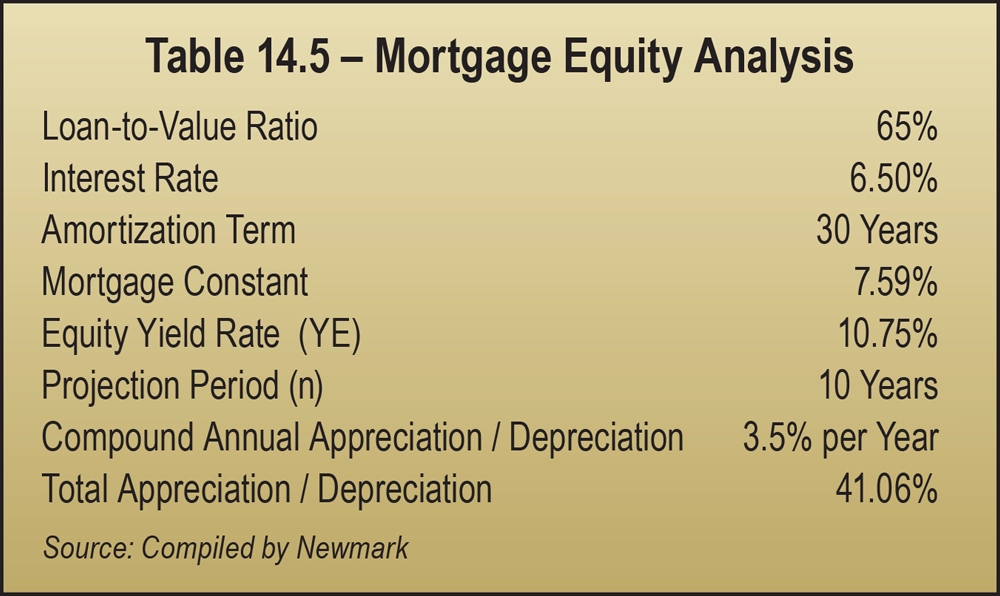
- Mortgage Equity Analysis – This analysis derives from the idea that real property investments are a combination of two components: debt and equity. It differs from the Band of Investment because it accounts for total yield: equity dividend and appreciation over time. It is a useful tool because it solves for a levered equity yield (that includes both cash flow or equity dividend and appreciation over time). Self-storage as an asset class has demonstrated superior returns for many years. For example, comparing total return of self-storage REITs over the last 25 years, self-storage has provided an 17.33 percent return on average and is superior to other core sectors such as office, industrial, retail, or apartments (based on NAREIT data or publicly traded companies only). As a result, institutional investors have been storing capital in the sector. The Mortgage Equity Analysis solves for equity yield, a common metric of the comparison of returns among investments for the institutional market. The equity yield rate estimated is lower for a single asset (in this case estimated at 10.75 percent) than publicly traded REIT data because REITs offer greater liquidity. The mortgage equity example, with the same mortgage requirements as the Band of Investment example for consistency, is presented in Tables 14.5 and 14.6.
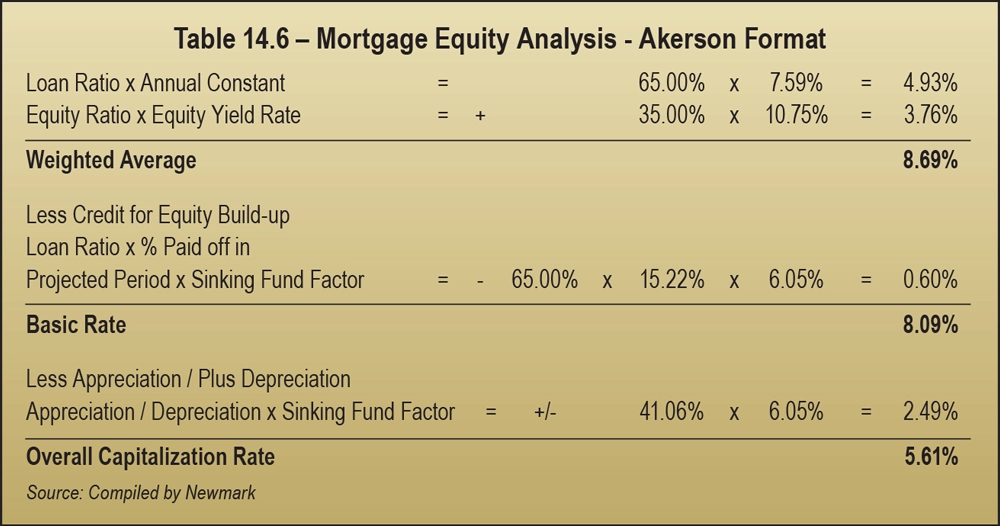
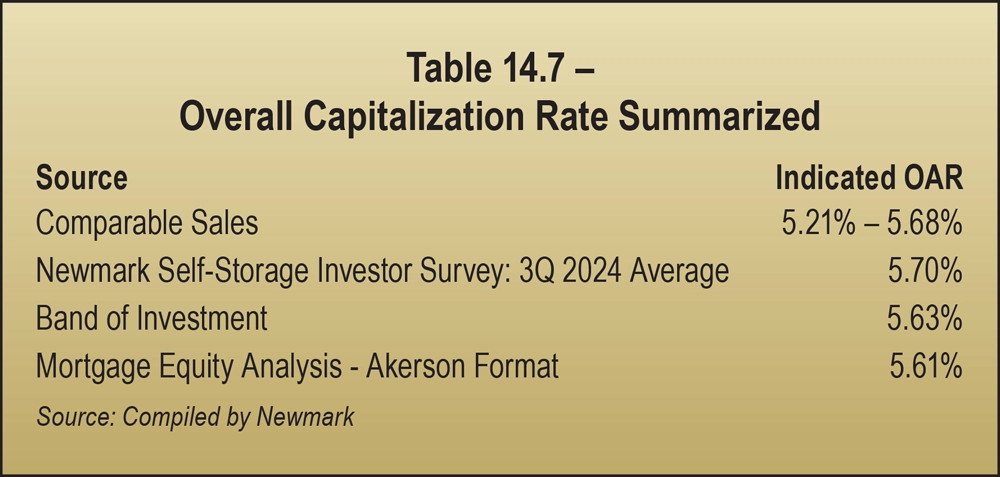
In general, market derived data is best. However, the data represents historical views. Survey research represents what investors view now going forward and is the best estimate of current market sentiment. These analyses are further supported by two mathematical techniques to test the reasonableness of the cap rate market data presented. There are other good tools and analyses, such as a Debt Service Coverage Ratio, debt yield, and residual techniques that can provide tests of reasonableness to a cap rate conclusion (not presented here). For instance, the EGIM multiplier tests the effective gross income (all income after vacancy and collection loss) compared to expense ratios. Using the formula of 1 – expense ratio \ the EGIM = cap rate. This multiplier is market derived, and the analysis tests overall assumptions of the net operating income forecast, such as income, vacancy, and expenses, to the concluded cap rate. Altogether, these analytical tools can be effective resources in concluding a reasonable and credible cap rate for a self-storage property.
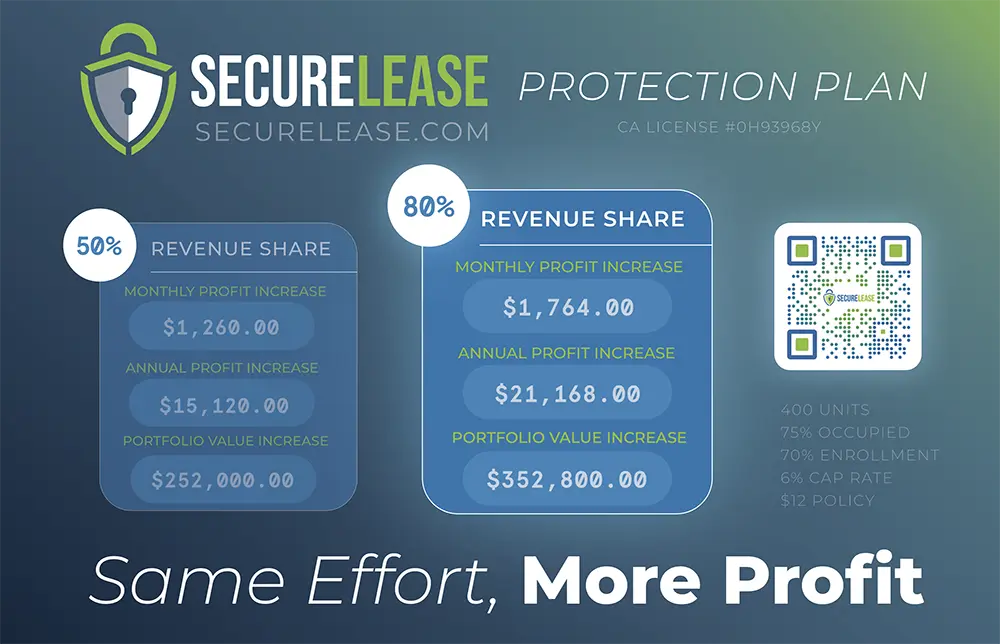
simple terms, an appraisal is “the act or process of developing an opinion of value of an asset” (The Appraisal of Real Estate, 15th Edition). A self-storage appraisal is simply the economic model or methodology of developing an opinion of value. Appraisal has evolved as the asset class has become significantly more sophisticated in recent years. Therefore, the focus of this section is on key points to analyze when appraising or arriving at an opinion of value.


As shown in Table 15.3, the Valuation Matrix with a 7.75 percent shows a typical spread between the cap rate (5.0 percent) and yield rate approximal to the compound rate of growth of NOI. As more institutional investors from other sectors have entered self-storage, modeling for self-storage is reflecting other sectors that have a compressed yield rate and a higher terminal cap rate (75 bp spread to 5.0 percent cap rate) as shown in Table 15.4, the Valuation Matrix with a 7.0 percent Internal Rate of Return (yield rate).
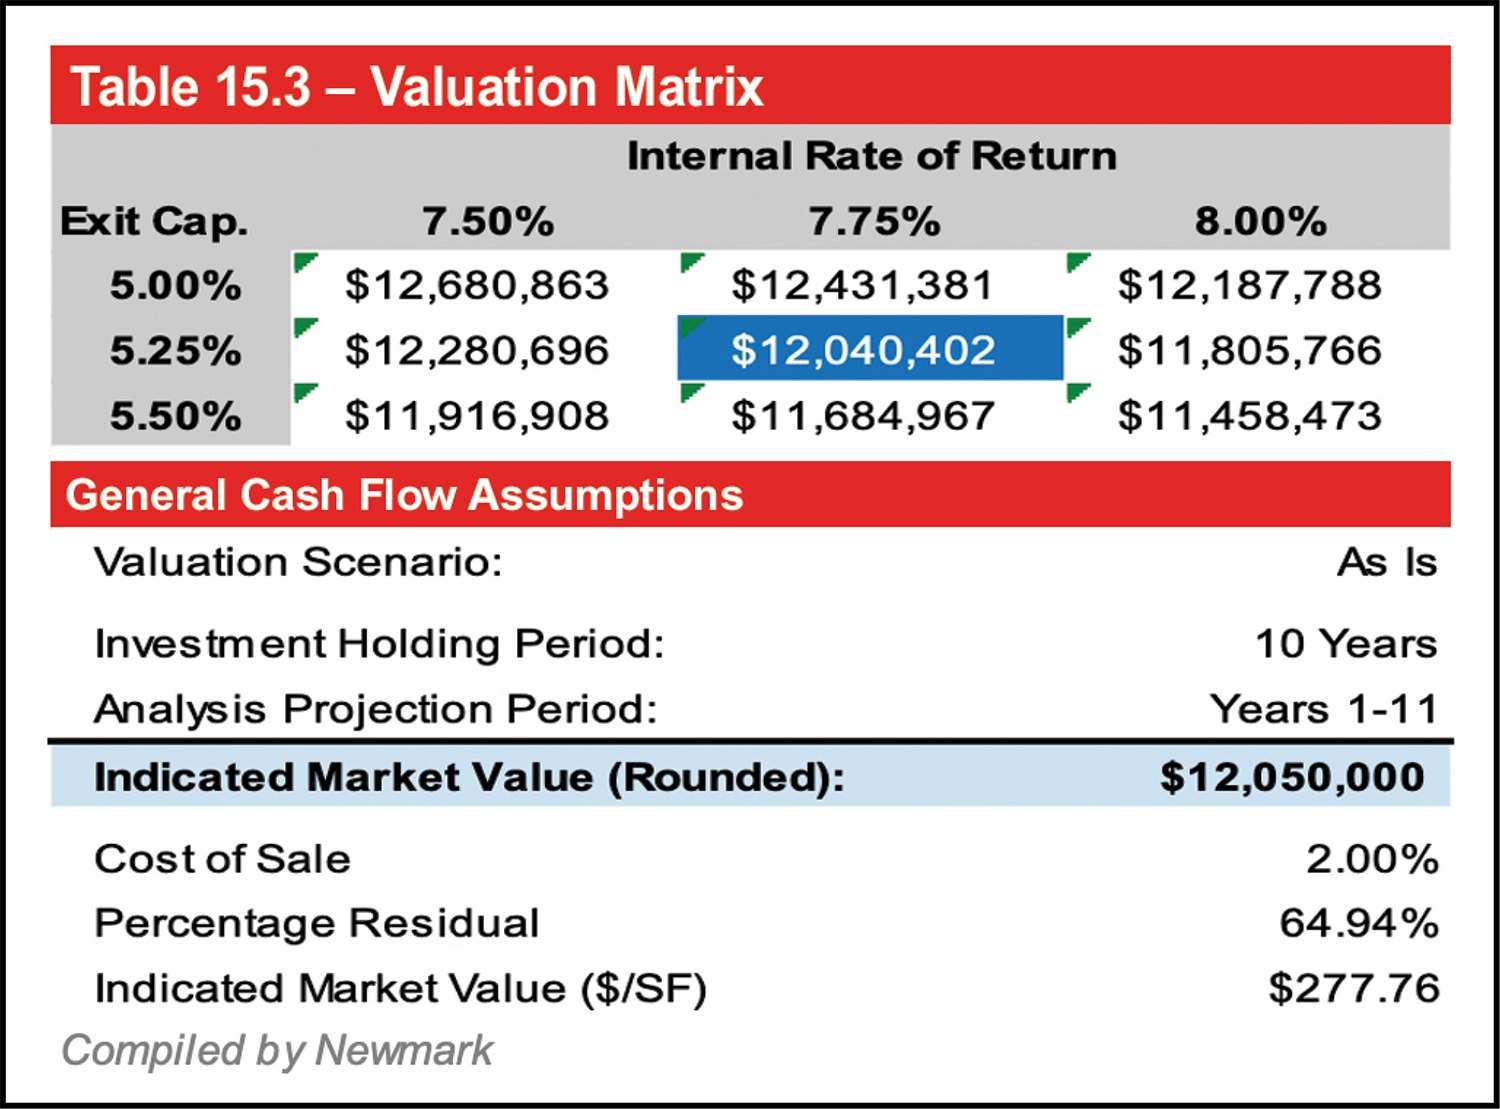
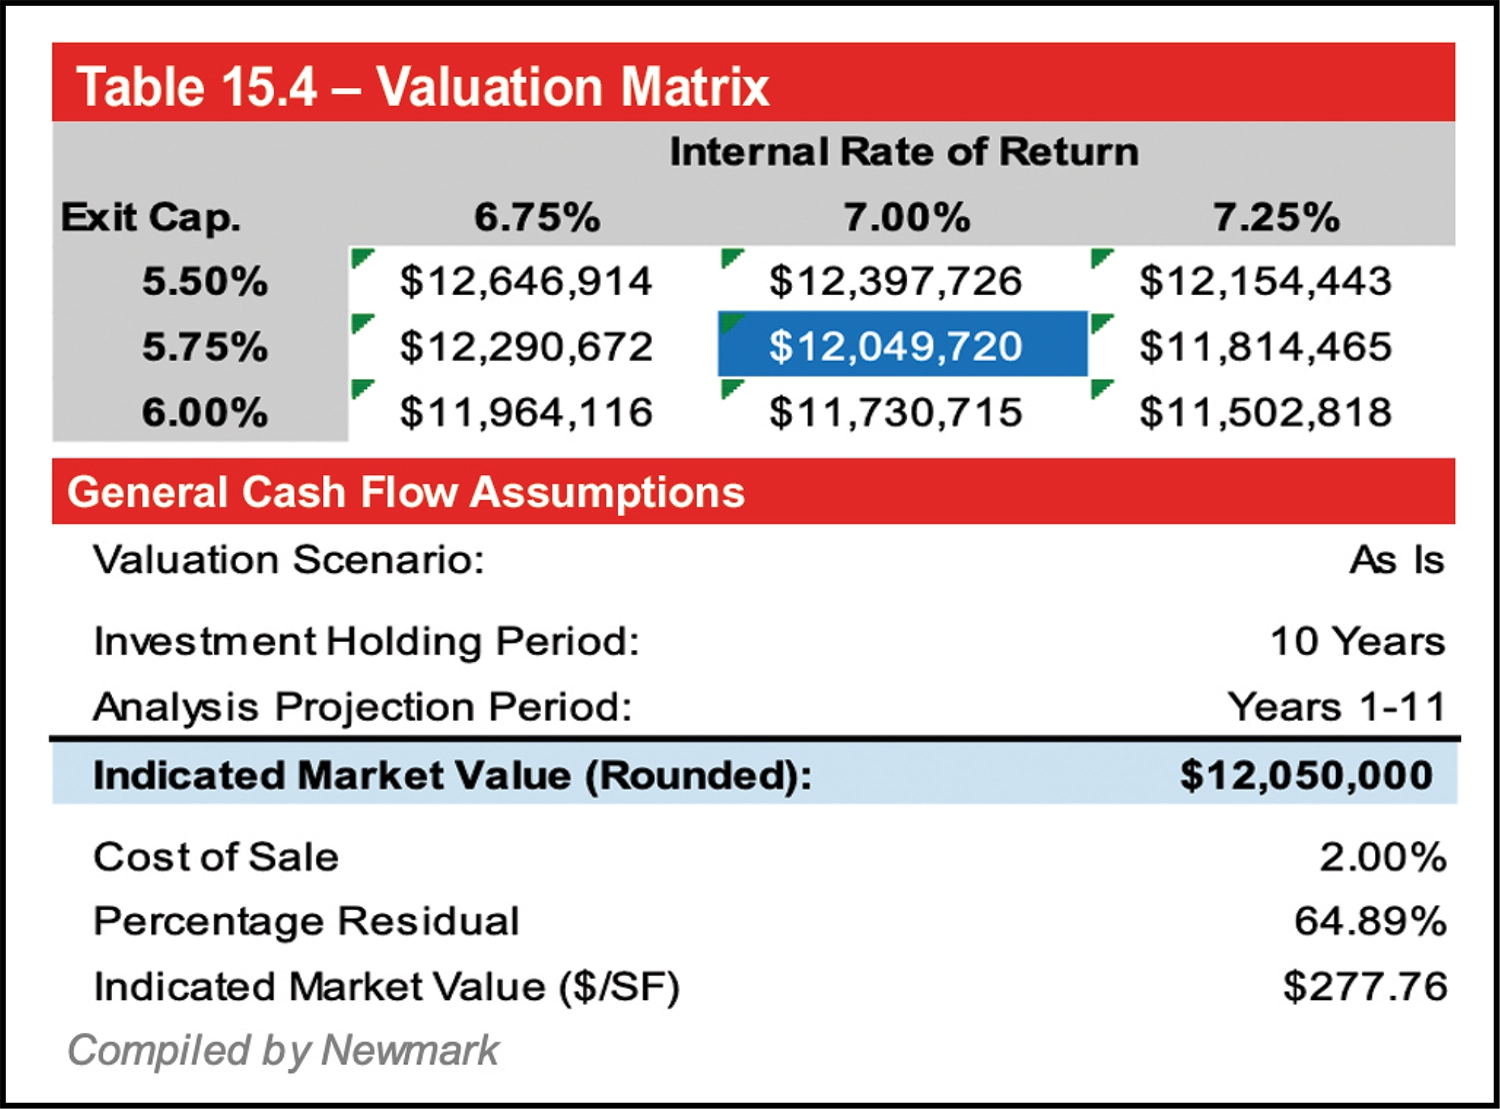
- Identification of the Problem (for appraisal, usually identifying the assignment)
- Scope of Work Determination
- Data Collection and Property Description
- Data Analysis
- Application of the Approaches to Value
There are three specific approaches to value that reflect distinct methods of data analysis: the Cost Approach, the Sales Comparison Approach, and the Income Capitalization Approach. The use of two or three of these approaches are then reconciled into a final opinion of value. For self-storage, the primary investment criteria are based on cash flow. As a result, the income capitalization approach is emphasized in self-storage valuation and will be analyzed first.
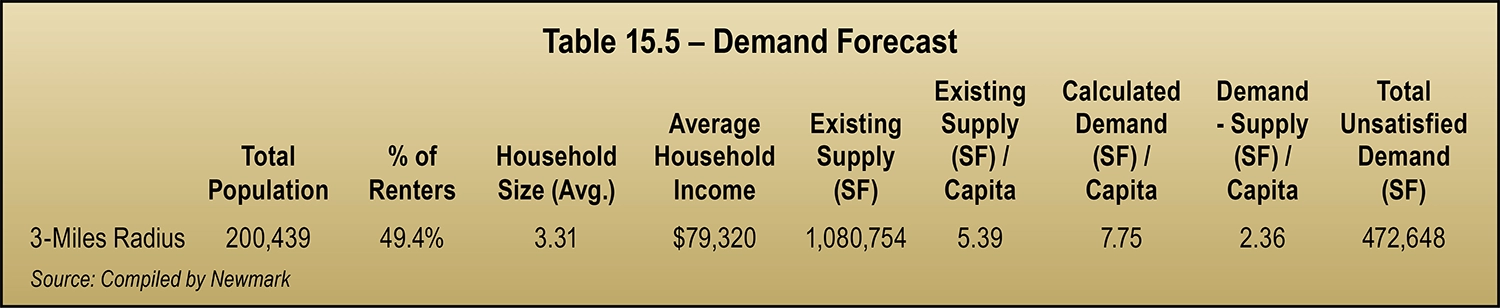
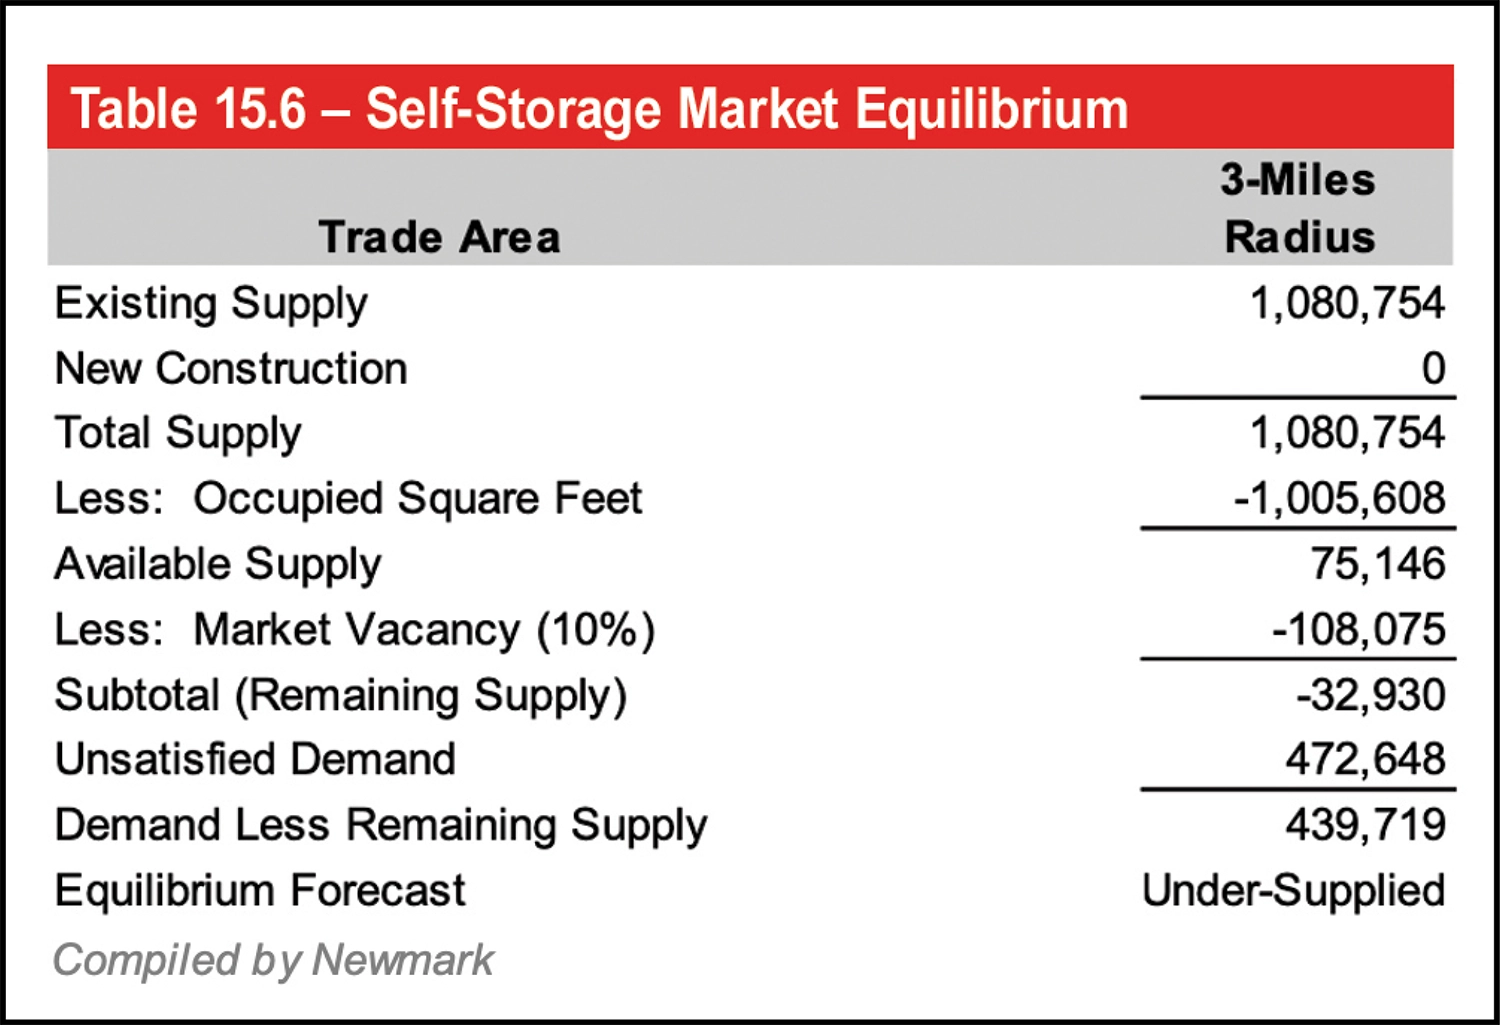
In these examples, the trade area shows physical occupancy of 92 percent and existing supply of 5.39 square feet per person, suggesting undersupply. An econometric model quantifies and corroborates the qualitative model and reflects stabilized demand above the CBSA average of 4.79 square feet per person. This variance highlights the importance of trade area analysis.
As to historical trends, a review of the subject property financials is best. An example is presented in Table 15.7.
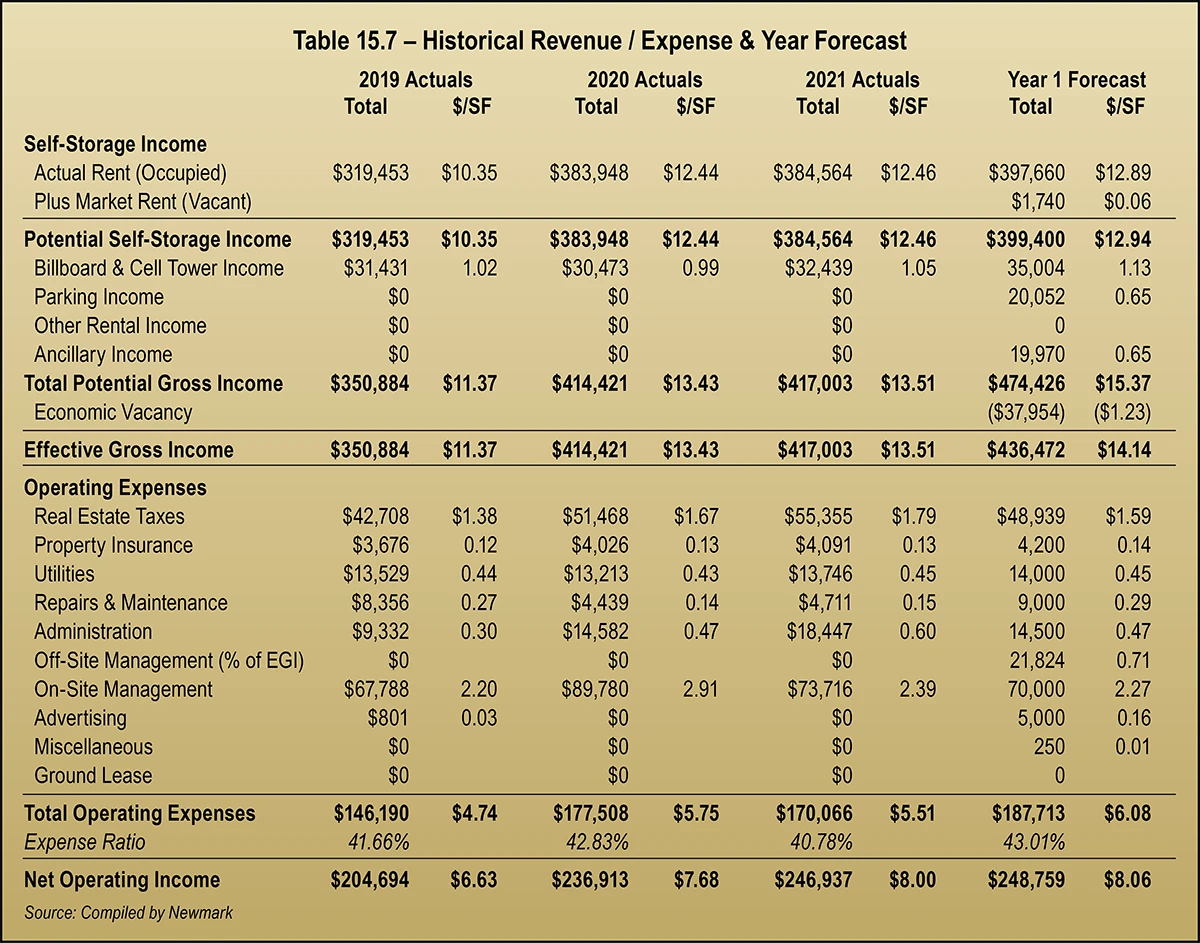
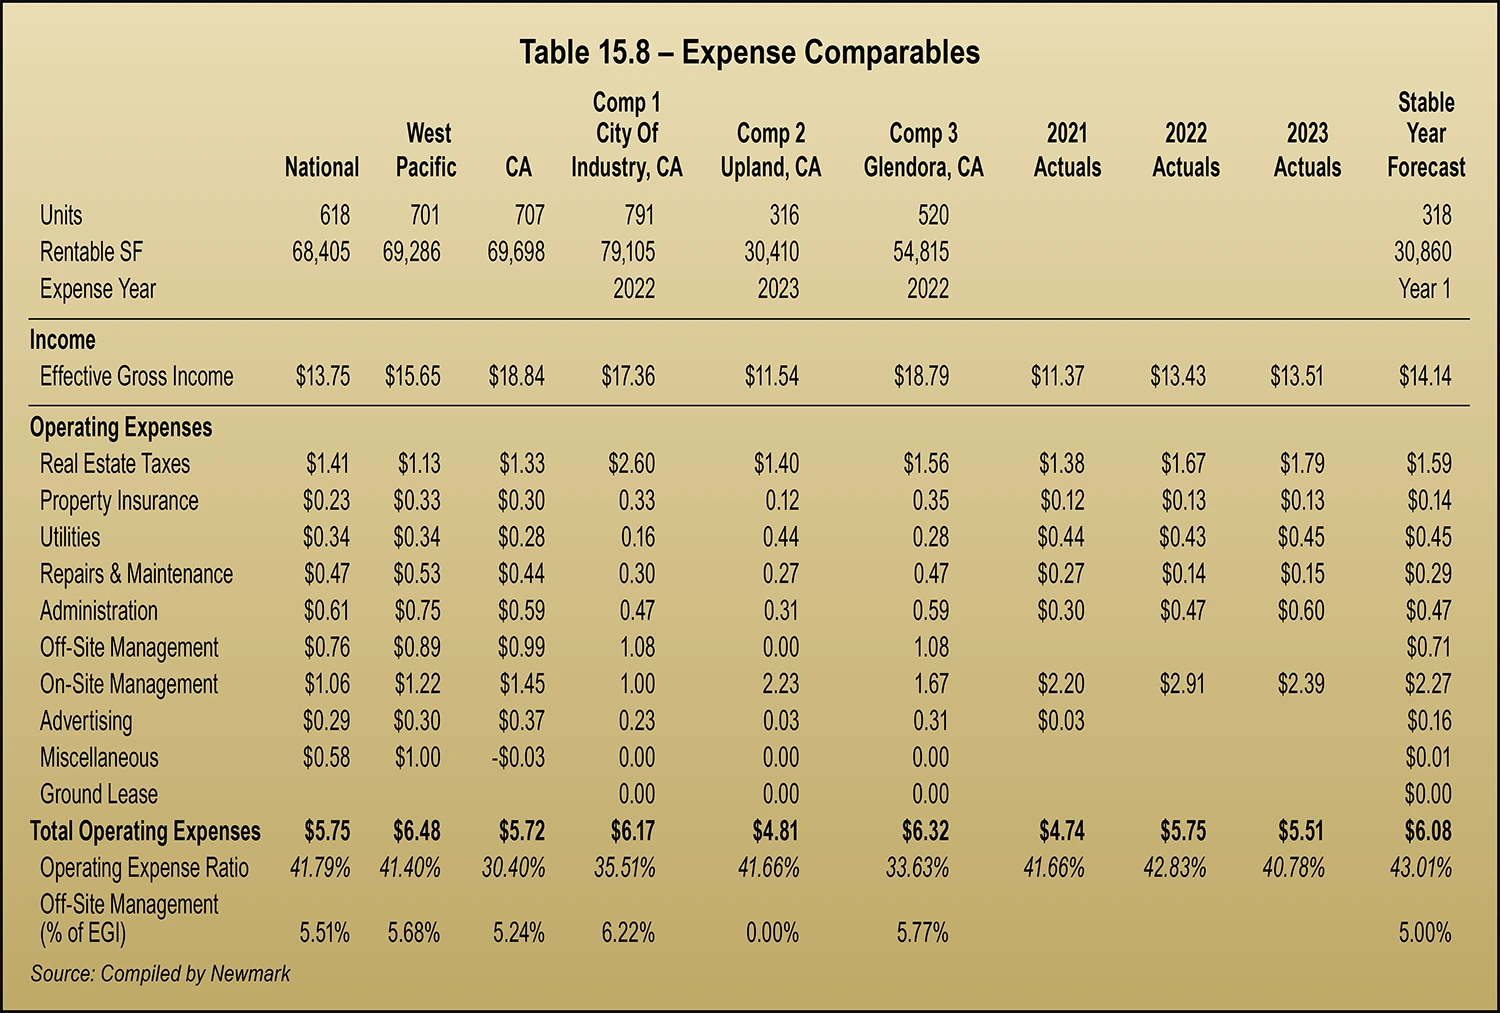
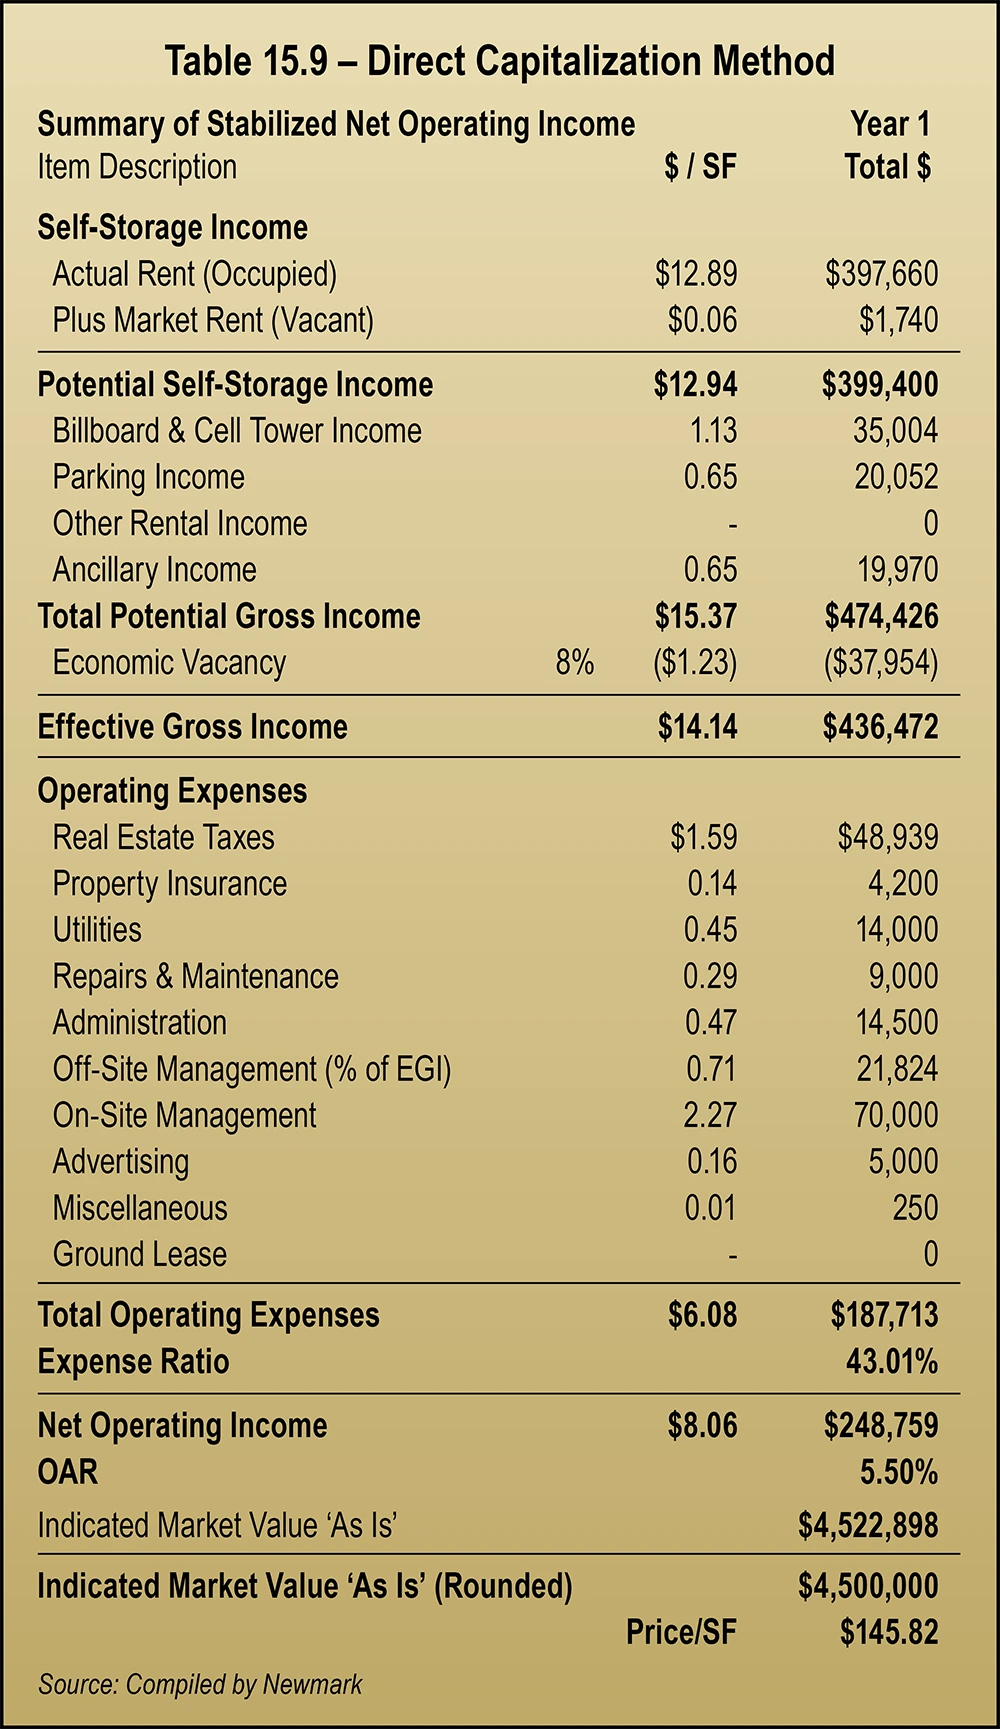
Another test of reasonableness to forecasting collected income or EGI is the Cost of Occupancy (COO). The COO is the average annual rent of a unit (total rent collected divided by occupied units) compared to average annual household income. In general, a ratio near 2 percent suggests rent upside. Alternatively, a ratio above 3.5 percent suggests less upside. In this case, the COO is 1.58 percent, suggesting continued upside in collected rents. As one person noted, some people spend more on coffee than the COO of a self-storage unit. So, who would bother to spend a Saturday moving out of a unit for a savings of 7 percent to 9 percent?
Operating expenses historically at the subject property should be compared to national data, such as the Self-Storage Expense Guidebook (also published by MSM) and expense comparables. Data should be analyzed by square footage and as a ratio of EGI. An example is presented in Table 15.8.
The data indicates that the subject expenses as a $/SF are high and as a ratio are close to the indicated range. It is important to note that in this case, real estate taxes are forecast to increase substantially due to local taxation laws and the definition of market value that assumes a sale. Real estate taxes have been rising in the sector, so a careful review of data and local taxation ordinances are warranted. Similarly, insurance and advertising costs have been rising in the sector and should be carefully considered when forecasting into the future. Now that a year-one forecast is concluded, a direct capitalization and yield capitalization are appropriate and shown in Tables 15.9, 15.10 and 15.11.
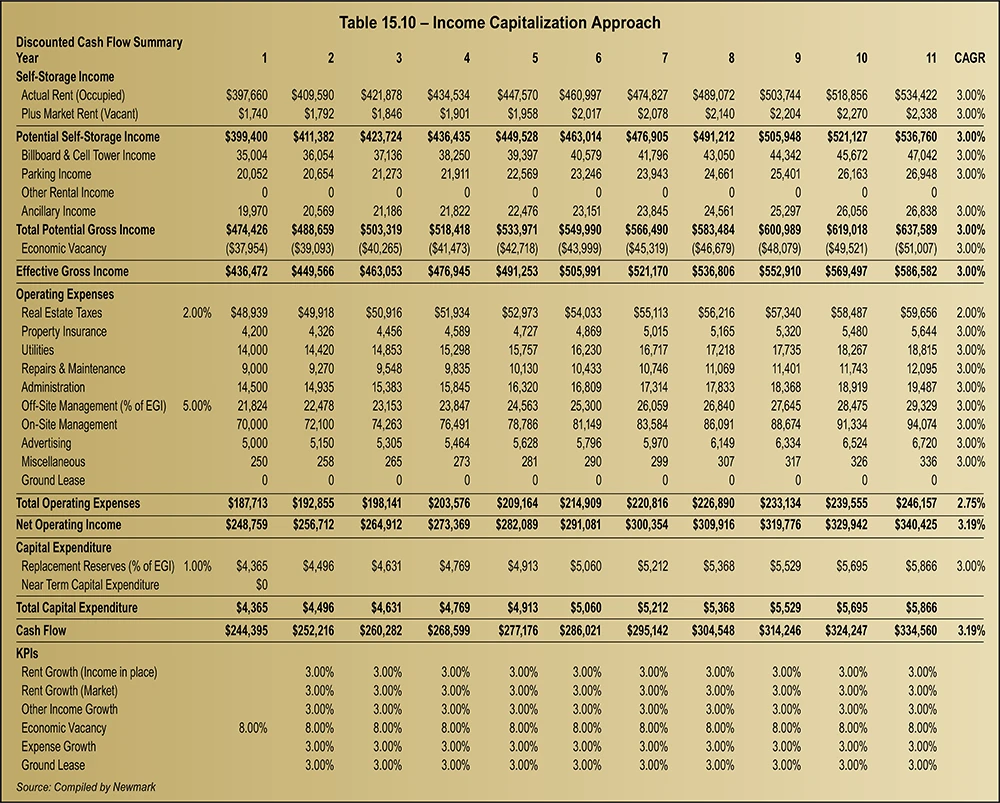
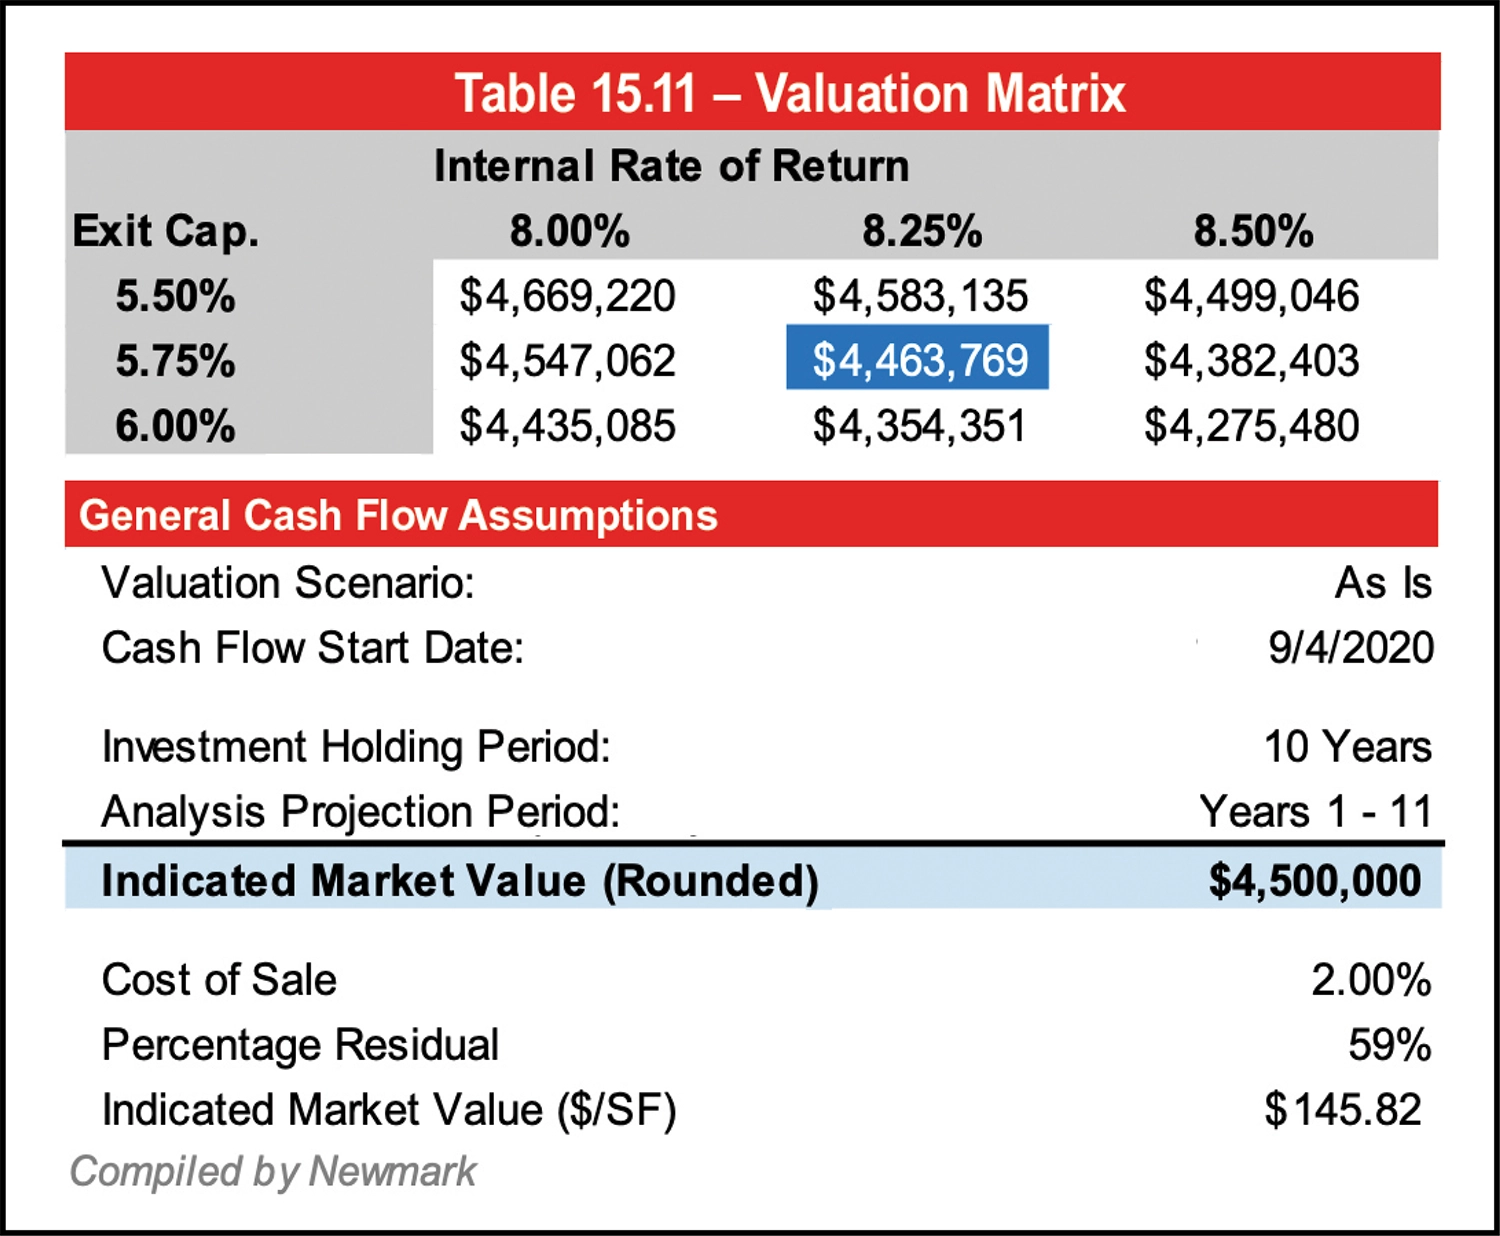
- Relationships – A 10-year discounted cash flow model is the primary decision-maker in over 85 percent of investors surveyed by Newmark. As outlined earlier, this is because of the increasing sophistication of the self-storage sector. It accounts for both cash flow (equity dividend) and appreciation (yield) during a typical 10-year holding period.
- The relationship of the cap rate and Internal Rate of Return (IRR) or discount rate should be within 50 basis points (bps) of the compound rate of the net operating income during the holding period. In this example, the net operating income is forecast to increase at 3.19 percent. With a cap rate of 5.5 percent, an IRR of 8.25 percent is within the 50 bps parameter. Alternatively, since last year, a compressed IRR can be used with an increased terminal cap rate.
- As a test of reasonableness, the relationship of cash flow to appreciation can be examined. In this example, the reversion or appreciation component represents 59 percent of total value, with the balance being attributed to cash flow. In an ideal market, the balance is 50 percent/50 percent. But in appreciating sectors and markets, like this self-storage example, the reversion or appreciation component may be as much as 65 percent. Conversely, in down markets, the cash flow may be emphasized as much as 65 percent, with only 35 percent of total value being attributable to appreciation.
- Unit of Analysis – The appropriate unit for comparison in the sales comparison approach is the price per square foot of rentable area. For self-storage, the price per unit can be easily skewed due to variances in unit mix. For example, a price per unit analysis shows a higher range. Therefore, the price per square foot of rentable area is considered most credible.
- Economic Characteristics – One of the most under-utilized adjustments particular to self-storage is economics characteristics. Since cash flow is the driver of investment decisions in the asset class, economic characteristics should be among the most important adjustments. Economic characteristics include attributes associated with a trade area beyond the location adjustment. For self-storage, this adjustment considers whether the conditions of the comparable trade area can be classified as oversupplied, undersupplied, or at equilibrium. Net operating income per square foot can be one benchmark tool; however, it is not a mathematical relationship and must be used with great care. Another measure of this variable relates to unit rent. For example, the operation of the business generates the net operating income applied to the real estate. In general, there is a correlation between higher rent and higher value. As a result, an adjustment for economic conditions is considered. Unfortunately, precise data and a direct relationship are difficult to isolate. Looking at net operating income as a benchmark, and considering the other adjustments, an adjustment can be derived.
- Adjustment Summary – The total range of adjustments should always decline after the adjustment process, or what is the point of the exercise? In the following example, the range is narrowed from 90 percent to 15 percent. An example is presented in Table 15.12.
- Effective Gross Income Multiplier (EGIM) – The EGIM tests the reasonableness of the forecast year-one cash flow to the concluded cap rate. Using the formula 1-expense ratio/EGIM (or value divided by effective gross income), expense ratios can be compared to concluded cap rates. In general, the lower the expense ratio the higher the cap rate.
- Secondary Approach – For self-storage, the sales comparison approach is secondary. Because of the emphasis and impact of cash flow and relatively low sales volume in many markets, the price elasticity of self-storage can be very large. As previously discussed, the market emphasizes cash flow and the income approach significantly more than the sales comparison approach.
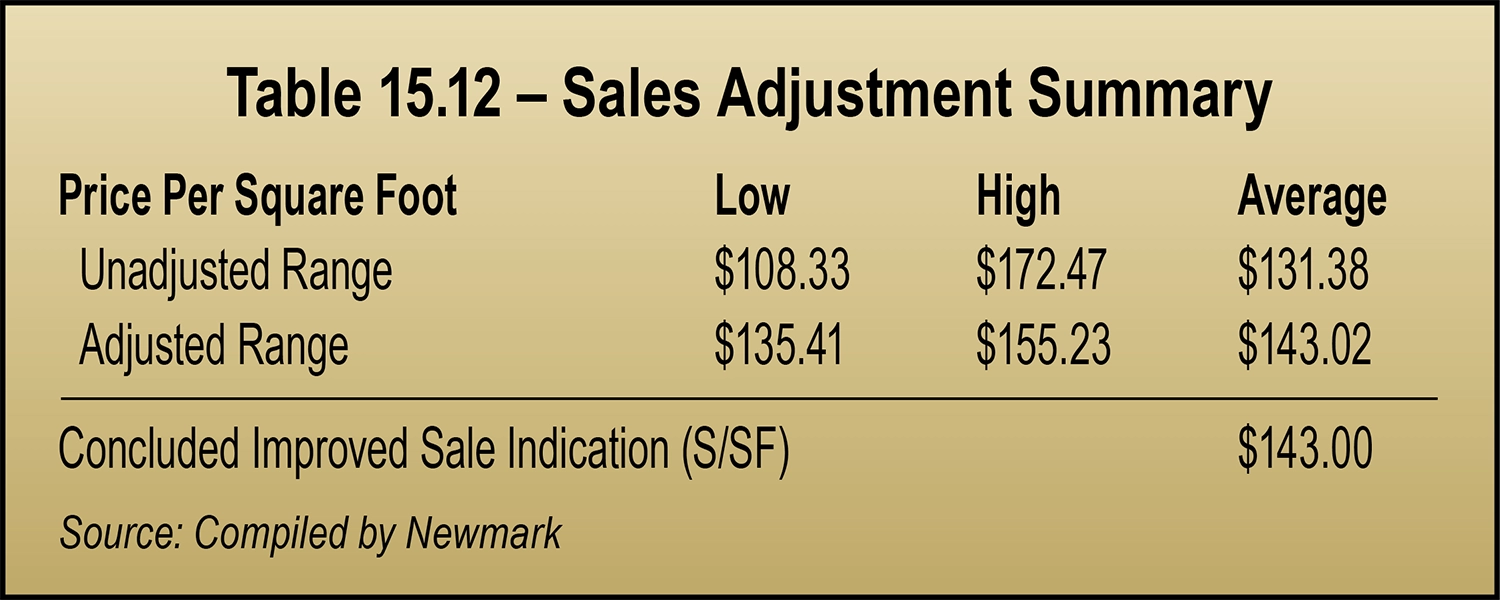
- Applicable and Relevant – The cost approach is best used for newer properties due to the challenges of estimating depreciation. However, some lenders want an estimate of remaining economic life to ensure the building is economically viable during the amortization period of a loan. This can create challenges and highest and best-use questions of a self-storage property. Some investors like to purchase below replacement cost, but this metric can be difficult to quantify due to the wide range of replacement cost estimates, particularly as costs are currently fluctuating due to supply chain problems. Therefore, the applicability and the relevance of the cost approach warrants careful consideration to a credible opinion of value.
- Land valuation – Self-storage land can be difficult to entitle or obtain zoning approval. Municipalities prefer other property types that generate more jobs or retail sales tax revenue. Therefore, if land sales utilized in an appraisal are not purchased and entitled for self-storage, the land component of self-storage can be undervalued. In general, self-storage land approximates a range of 10 percent to 40 percent of total property value but is typically in a narrower range of 25 percent to 35 percent.
- A cost approach for self-storage typically represents a value upon completion. Depending upon the local market, it may be appropriate to add absorption costs for stabilization (rent loss and some profit for time during lease-up).
These guidelines can help a layperson review an opinion of value. Self-storage is a unique asset class, and an opinion of value should carefully review and consider these characteristics. If reviewing a value conclusion, these points can be utilized to consider the credibility of an opinion of value.
he lending environment for commercial real estate in 2024 proved more favorable than in 2023. However, it was a far cry from a banner year of low interest rates as many anticipated. Interest rates were down from recent highs in 2023, but volatility paved the way for a choppy year marked with a handful of favorable transaction windows. The persistence of higher rates at a time when a large portion of outstanding debt was coming due for refinance presented challenges for borrowers across the storage industry. Many borrowers who delayed refinancing in 2023, hoping for lower rates, did not find 2024 to be the saving grace they needed. Still, transaction volume increased, and numerous compelling loan options were available for borrowers who had to refinance last year. In fact, there were positive signals in the market and there is optimism that 2025 may bring relief.
Before diving into various loan products, it will be useful to review recent interest rate trends. Following the onset of the 2008 financial crisis, the Federal Reserve lowered the target range to 0.0 to 0.25 percent; this persisted until an initial rate hike in December 2015. The ensuing rate hike cycle continued until a peak in 2018, when the range hit 2.25 to 2.5 percent. In what Fed Chairman Jerome Powell termed a “mid-cycle adjustment,” the Fed lowered rates by a quarter point three times in 2019. The onset of COVID-19 prompted an emergency meeting in March 2020, when the Fed slashed rates back to zero, echoing policy action enacted in 2008. Two years later, in March 2022, the Fed began aggressively raising rates to combat soaring inflation, increasing the benchmark rate by 525 basis points (bps) over a period of just 14 months. This included seven hikes in 2022 and four more in 2023, the fastest rate hike cycle since the 1980s stagflation crisis. The culmination of the recent rate hikes amounted to significantly more expensive borrowing costs in 2022 and 2023 compared to recent years.
For context, it’s important to note that 2024 marked a shift for the Federal Reserve, which cut rates twice—first by 50 bps in September, followed by another 25-bp reduction in November. There was a possibility of another cut before the year ended, and market sentiment points to the Fed continuing to lower rates into 2025. However, the pace of further rate cuts remains uncertain. Among other concerns, macroeconomic conditions domestically alongside geopolitical factors will guide prospective Fed policy actions in 2025.
The Secured Overnight Funding Rate (SOFR) and Wall Street Journal Prime Rate (Prime) generally move in lockstep with the Fed Rate. For instance, a 25-bp change in the latter typically results in similar movements in the former. SOFR and Prime are commonly applied to price floating rate debt products. Meanwhile, Treasury rates move constantly and are the most frequently utilized index for fixed rate debt. Chart 16.1 on page 163 compares the Federal Funds Target, the 10-Year Treasury, SOFR, and Prime rates across the last decade.
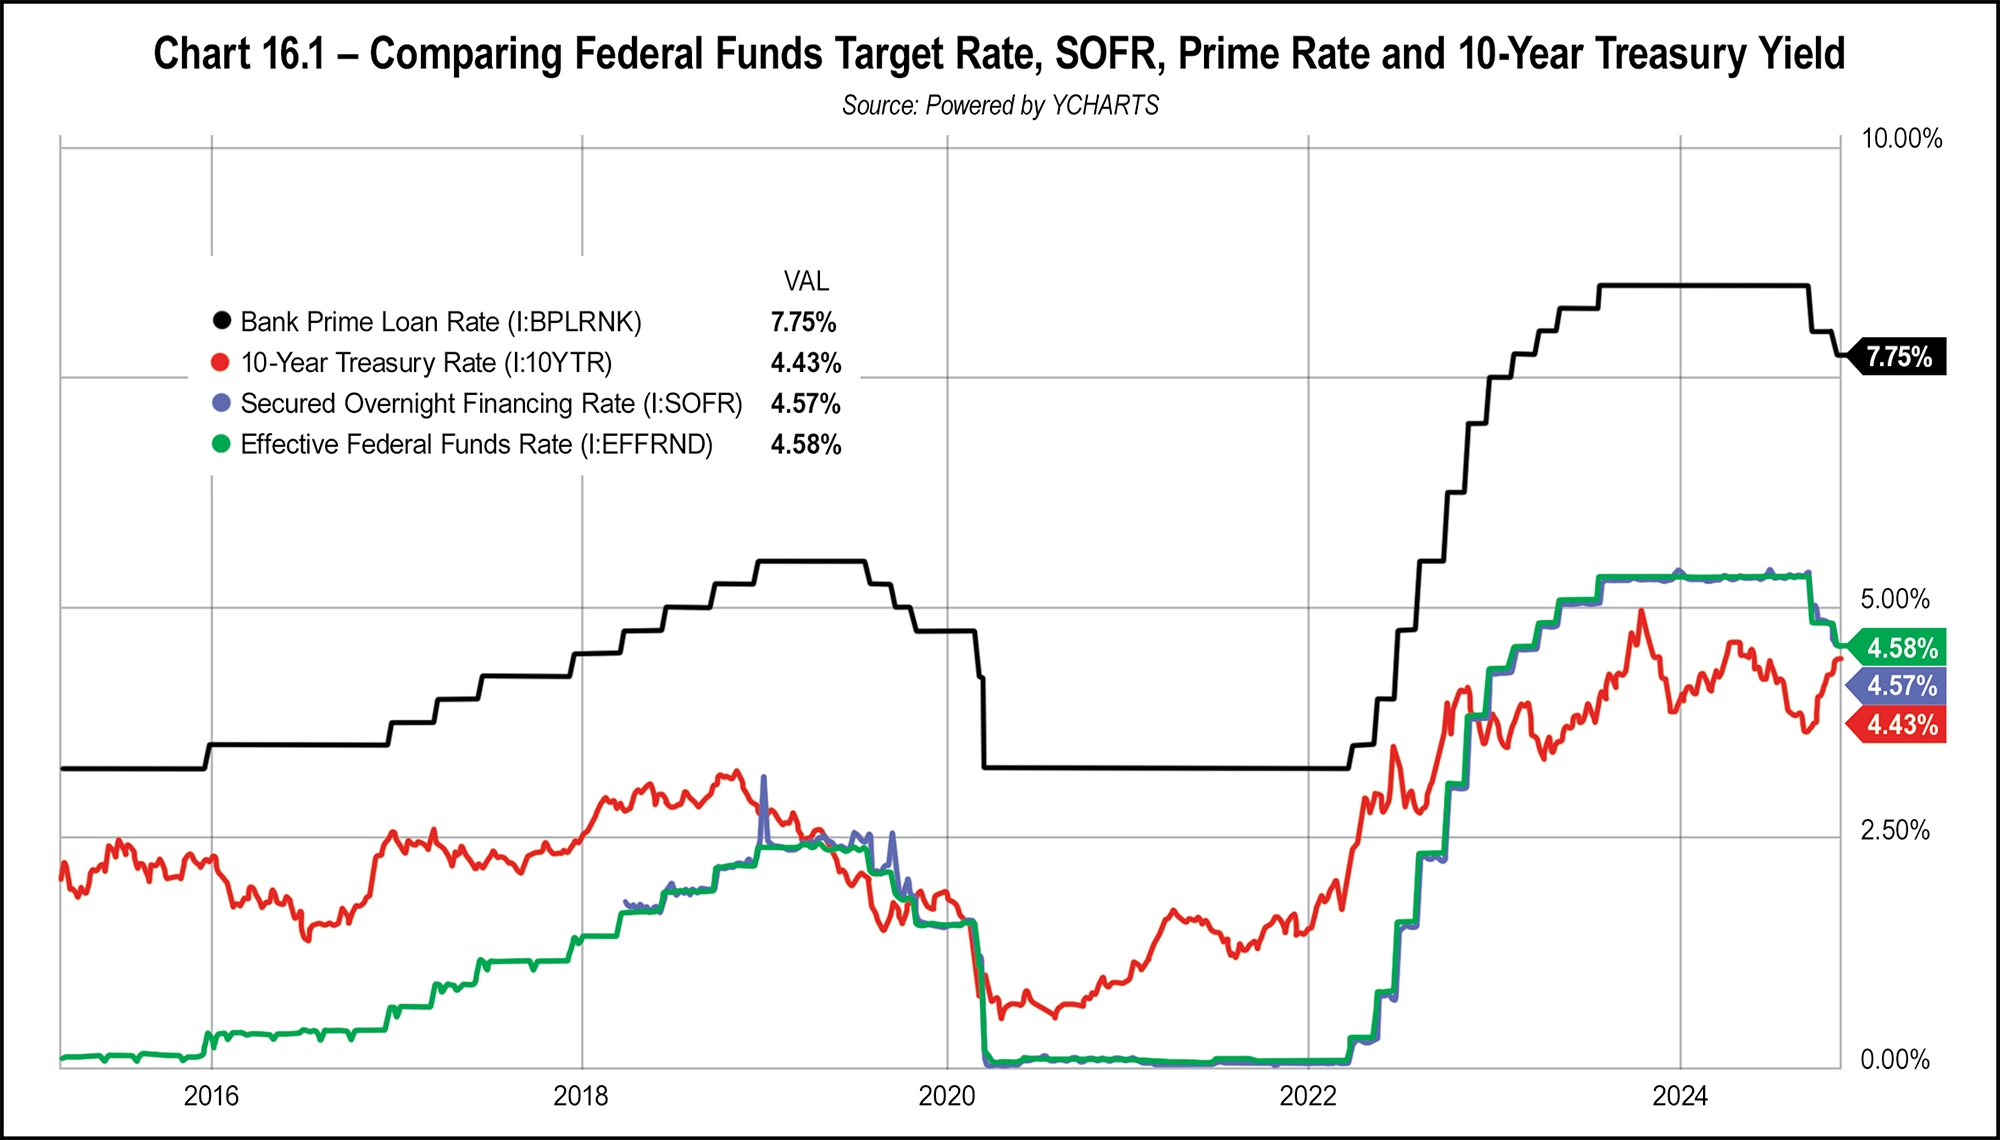
- LTV = loan amount divided by appraised value
- Debt yield = net operating income (NOI) divided by loan amount
- DSCR = NOI divided by annual debt service
In times of rising or elevated interest rates, loan proceeds are commonly constrained by DSCR hurdles rather than LTV or debt yield. For example, an asset with a $10 million valuation may not be eligible for a $7.5 million loan (75 percent LTV) if the in-place cash flow reports well below a 1.2-times DSCR. The following hypothetical capital stack example highlights the challenge some borrowers experienced over the last 18 months if a refinance was required.
Consider a facility that was purchased in 2020 for $4 million with an NOI of $250,000 at acquisition. Assuming moderate growth, Year-4 NOI is reported at $320,000. Holding cap rates constant, the increased NOI results in a Year-4 value of $5.12 million. If rates had increased moderately since acquisition, 75 bps in this example, the borrower could have refinanced the loan and qualified for a cash out of approximately $500,000. Table 16.1 illustrates the scenario described above.
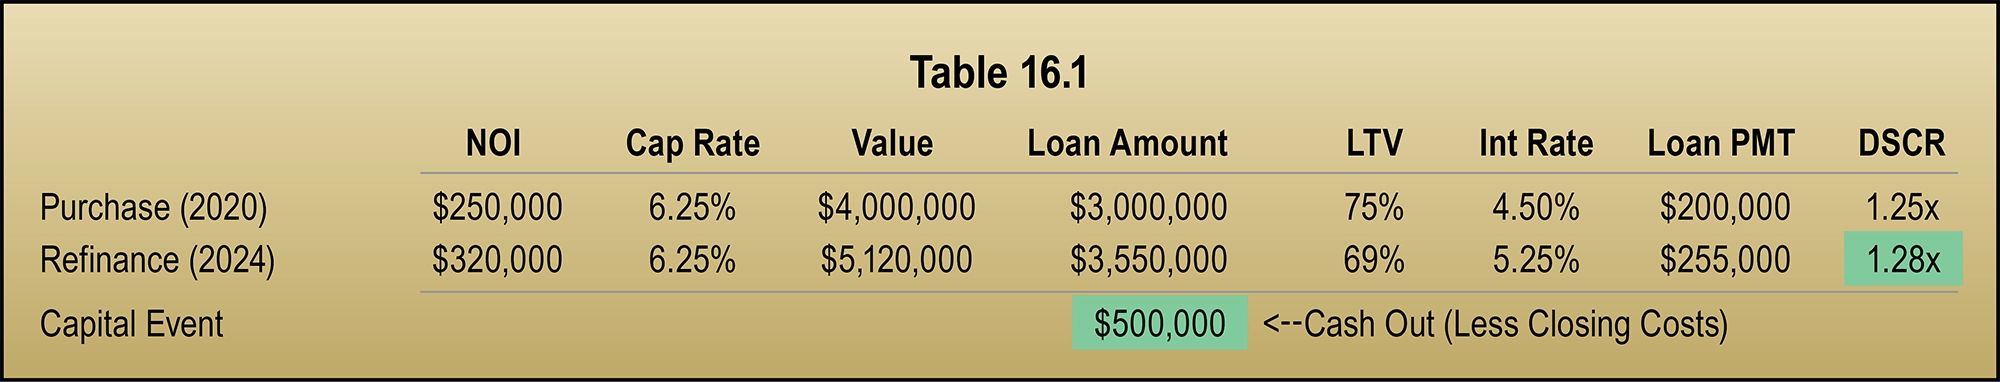
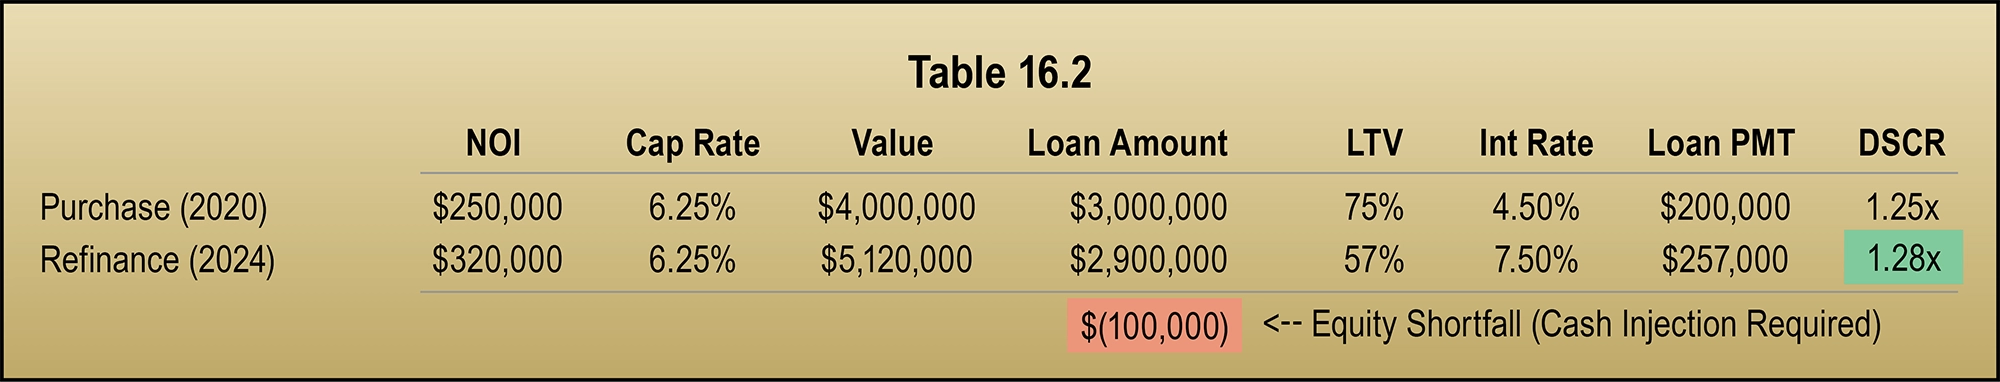
This example, while realistic, was conceived in an Excel spreadsheet and could be adjusted to produce varying outcomes. In fact, not every refinance pushed through resulted in an equity shortfall—some still enabled cash-outs, whereas some were cash-neutral. The key takeaway is that sharply rising interest rates have made debt-service-constrained loans more commonplace.
Although cap rates did not increase in lockstep with interest rates, the transaction market was stifled by an inherent mismatched perception of asset values by buyers and sellers. In other words, while an appraised value might not have been driven down much (or at all), higher interest rates prevented many deals from penciling out across the industry. In addition, a softening of storage fundamentals occurred in recent years, including slower (or negative) rate growth and a pull-back in occupancies. According to data from MJ Partners Market Overview, the public REITs reported same-store occupancies ranging from 85.6 percent to 94.3 percent, compared to 88.5 percent to 94.1 percent in 2023. Perhaps more impactful, MJ Partners notes that same-store revenue growth trends for the REITs were all negative in Q3 2024 compared to one year earlier, ranging from -0.3 percent to -3.5 percent. Softness notwithstanding, a continued trend of declining interest rates in 2025 will pave the way for more lending liquidity next year.
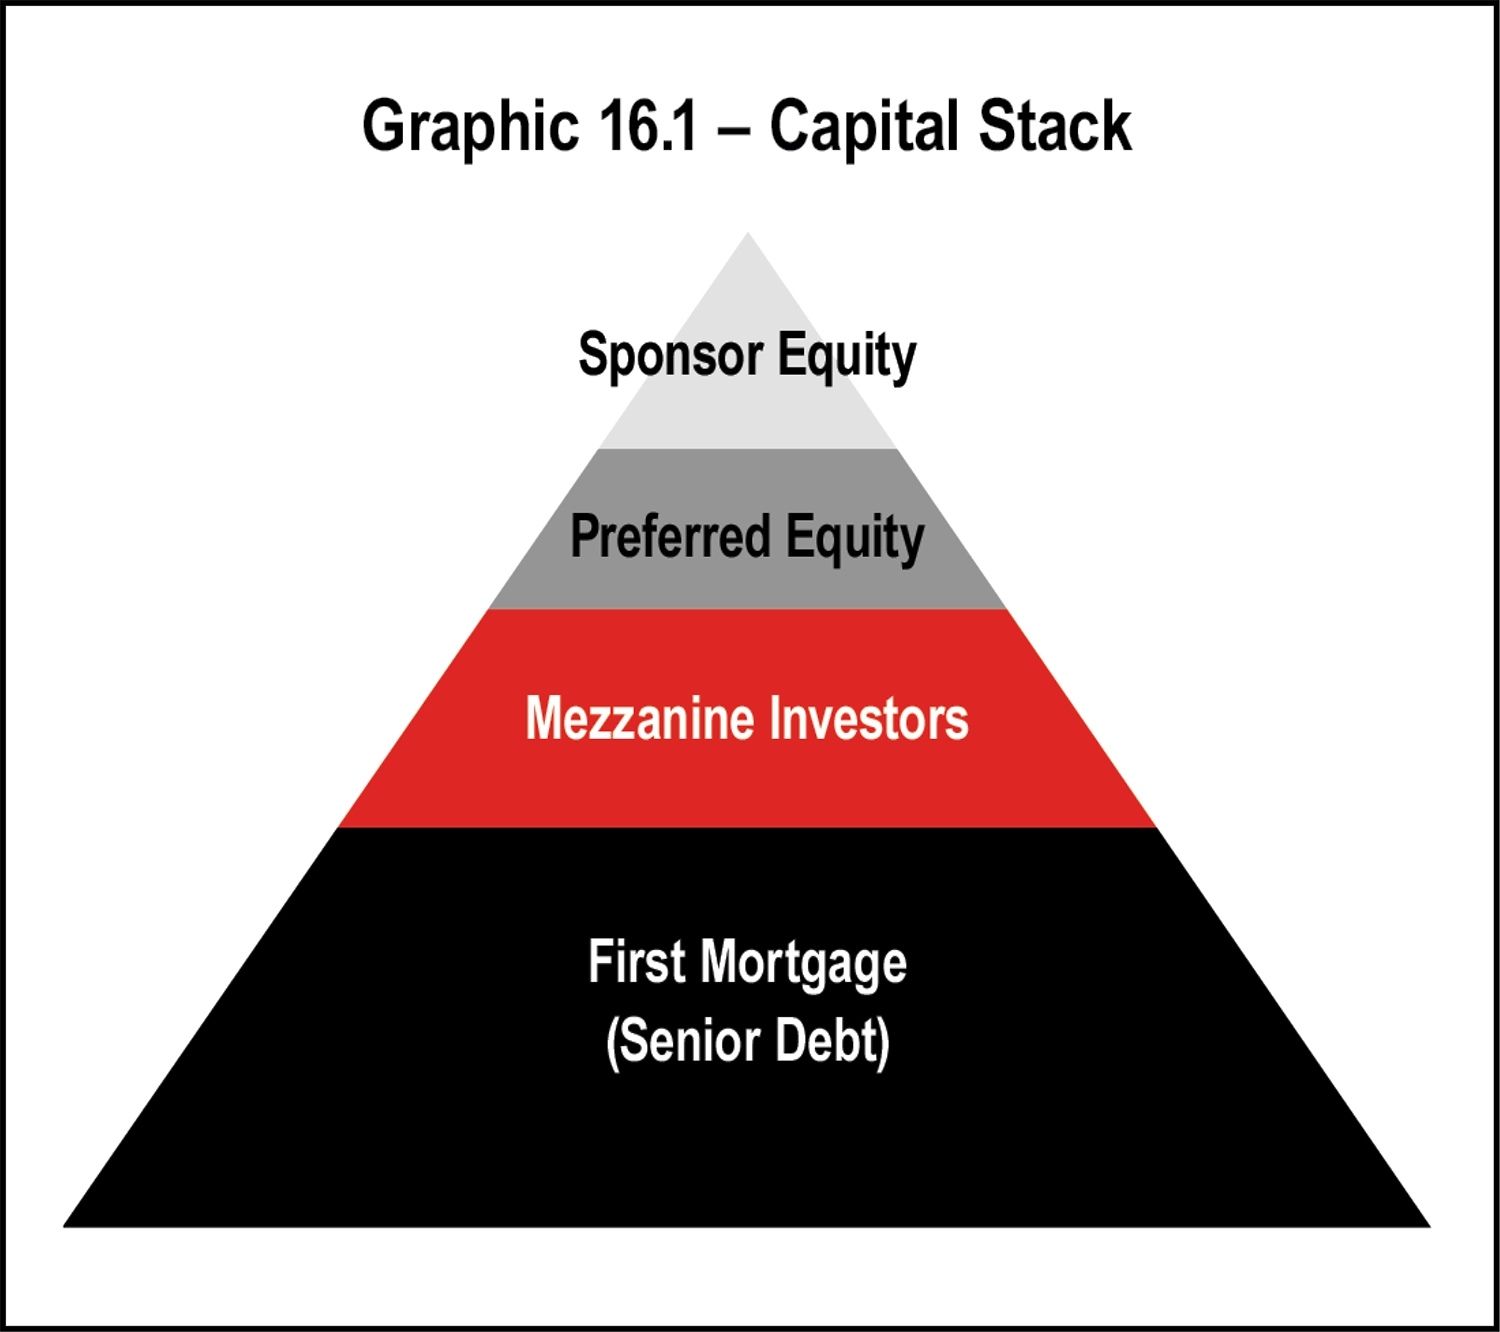
- Sponsor equity
- Preferred equity
- Mezzanine investors (hybrid debt and equity)
- First mortgage (senior debt)
The relative position of the stakeholders within the capital stack changes with the passage of time. As the mortgage principal is paid down, equity increases. Sponsor equity is subordinate to most debt. The value of sponsor equity can be calculated by subtracting the value of the higher priority positions from the asset’s market value.
The amount of equity a sponsor holds in an asset is important to a lender. A borrower with little or no equity stake in a property may have different interests than one with ample equity remaining, especially in the eyes of a lender. This does not discount long-term ownership where capital investments continue to be made into property to support and increase value.
Mezzanine debt and preferred equity are available in the market for larger transactions and under special circumstances. The pyramid graphic shows these interests lodged between the senior loan and sponsor equity positions. Given that these loans are subordinate to senior debt, they are riskier and therefore command higher interest rates. Debt funds, which can serve as the senior lender or provide a level of hybrid debt, have become more popular lately.
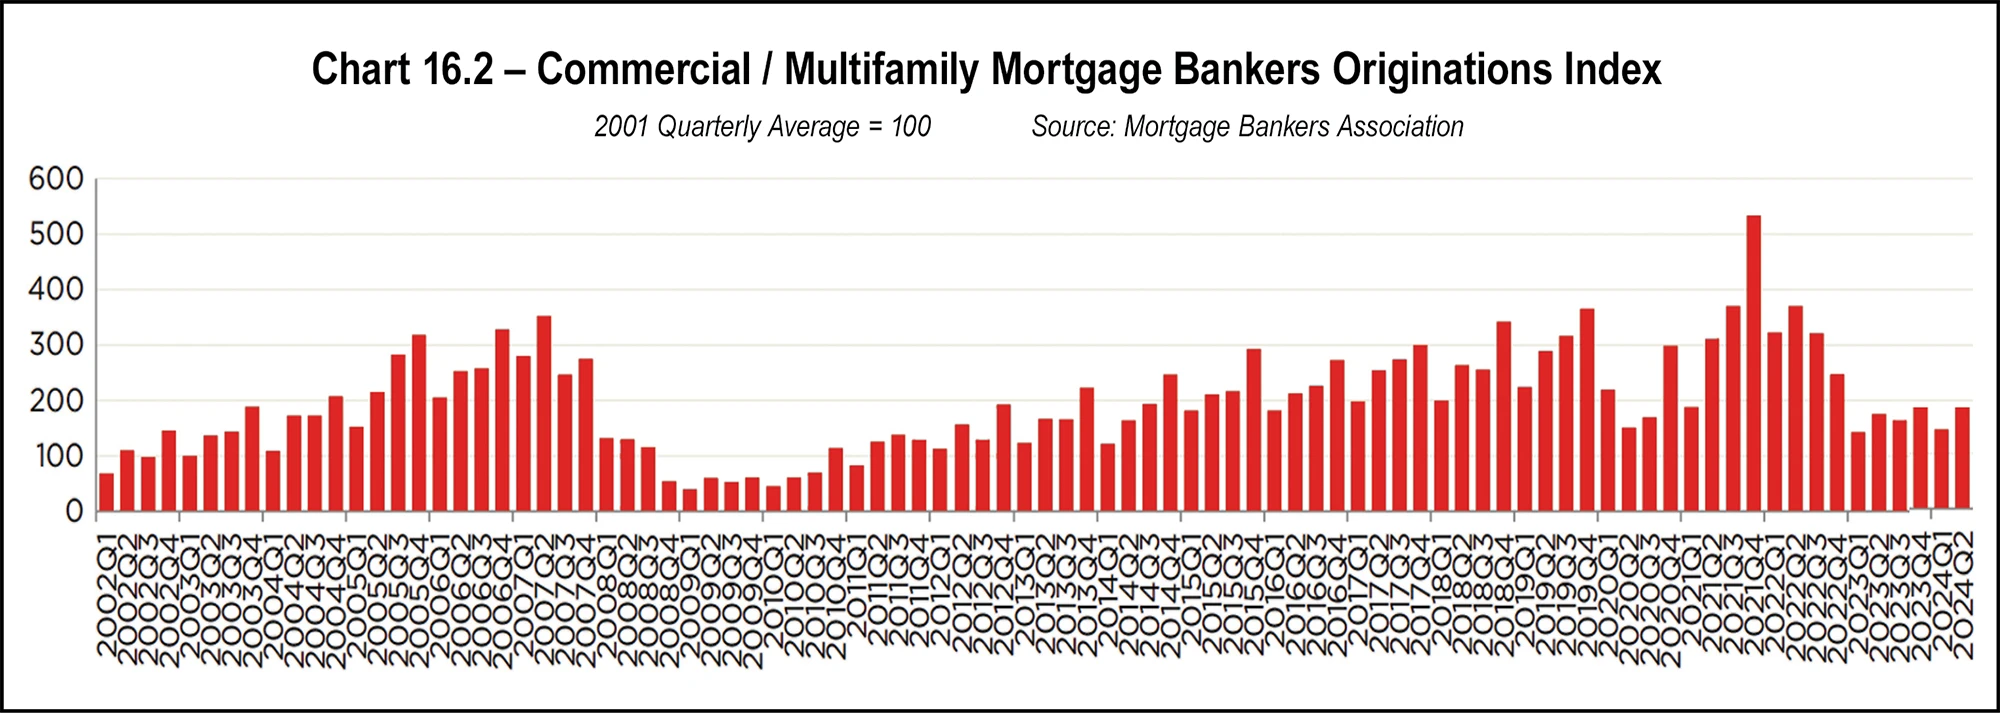
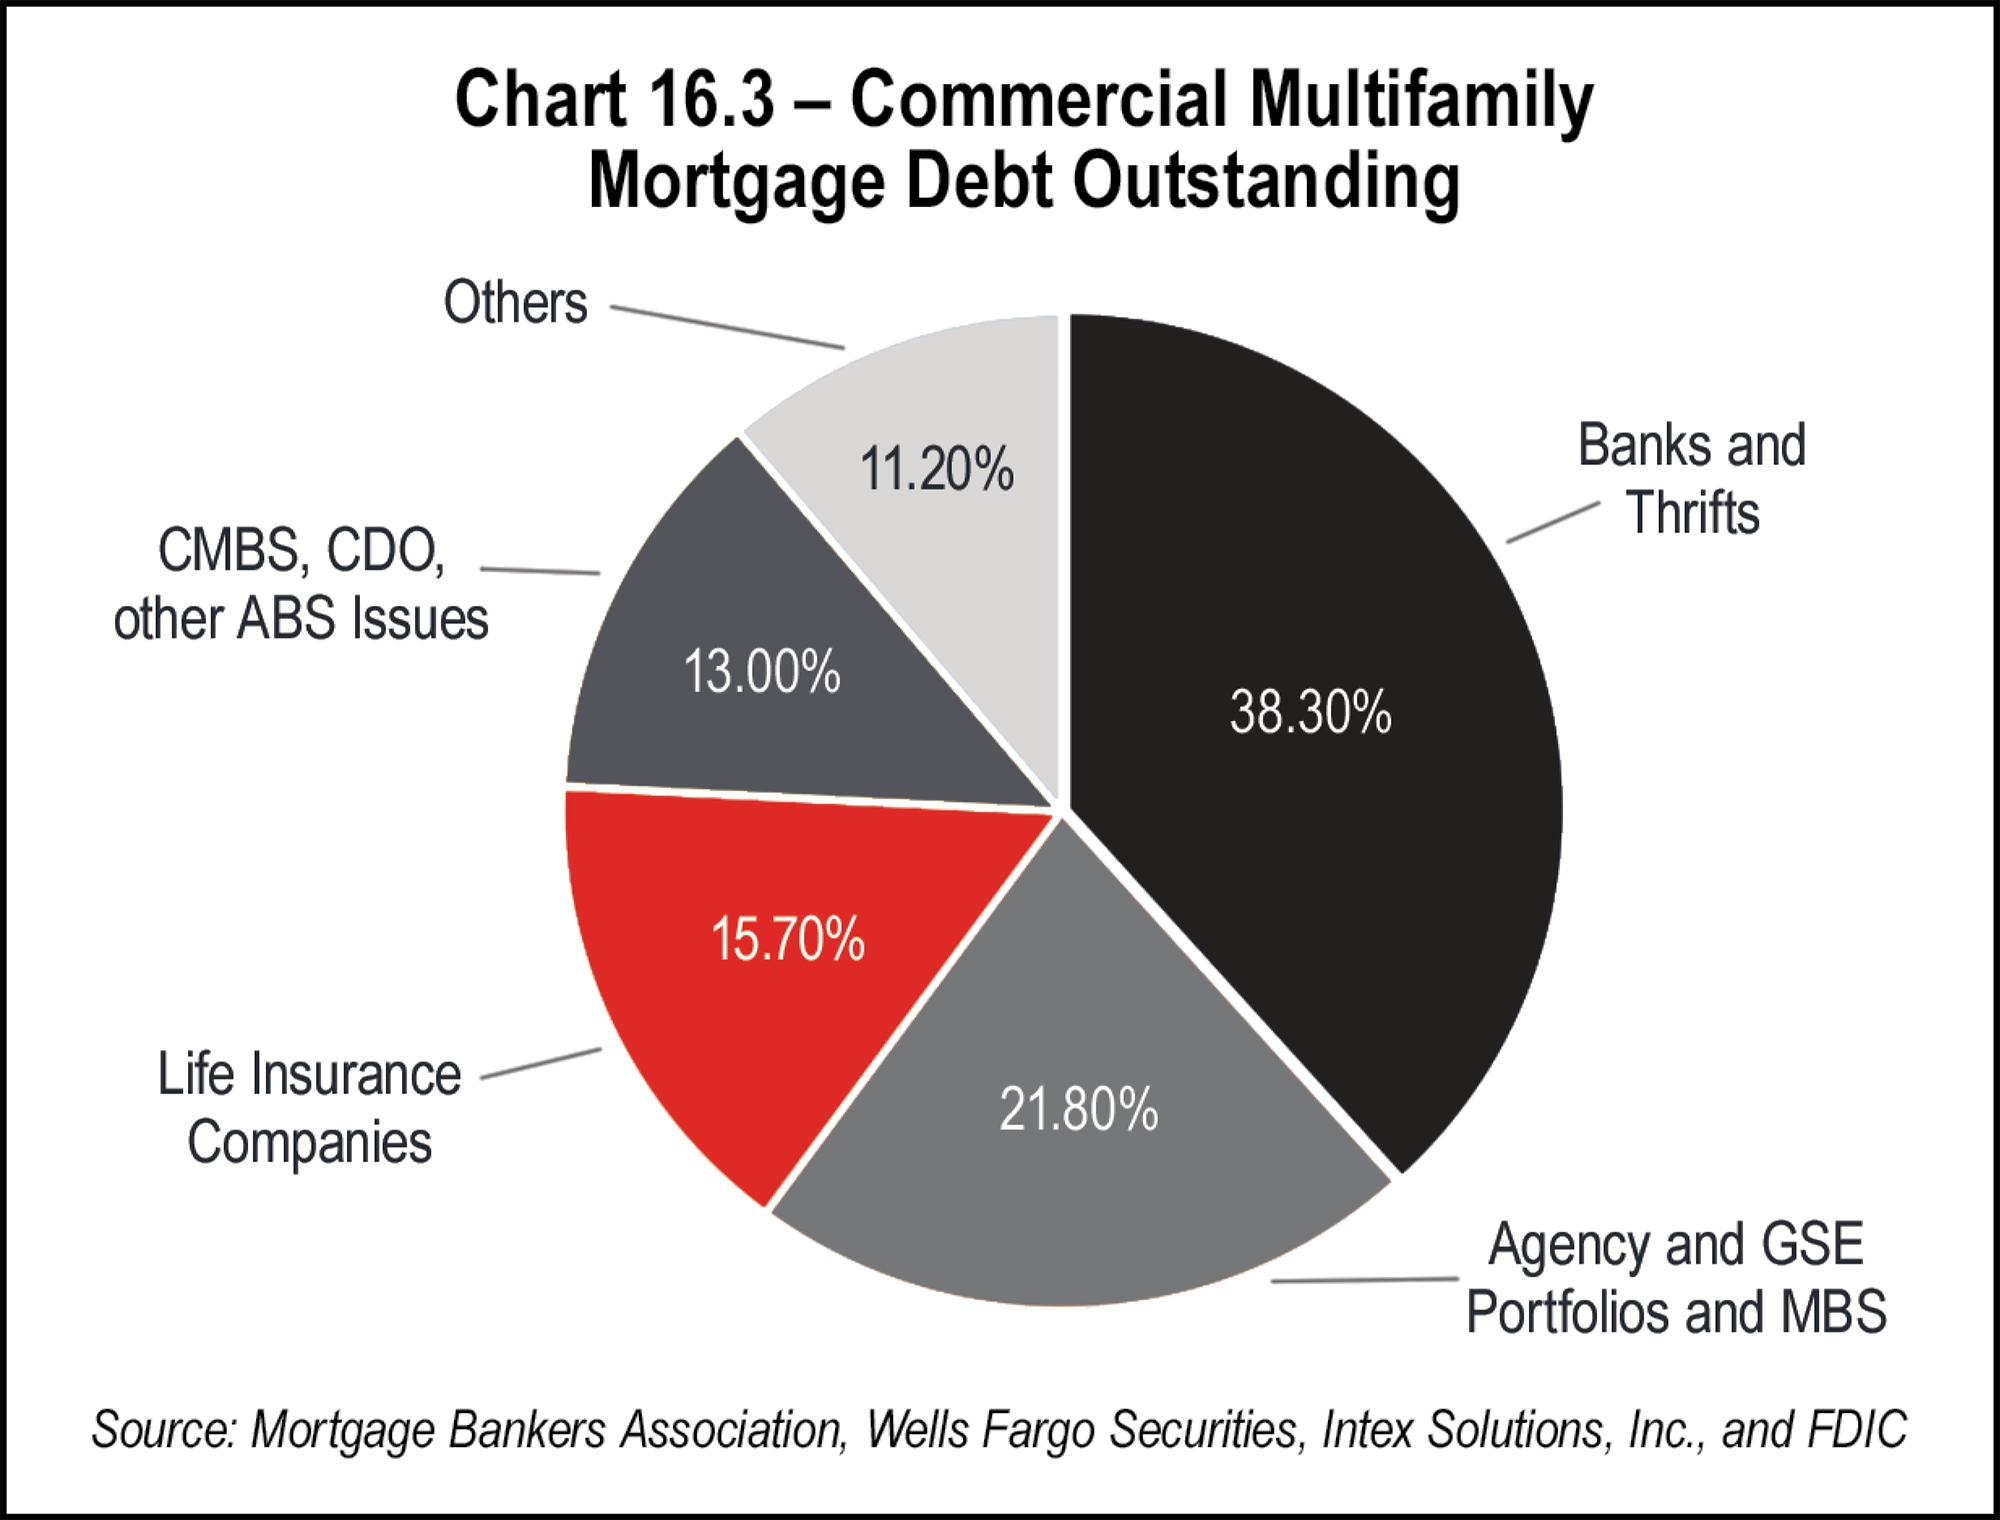
The sum of outstanding commercial mortgage debt rose to $4.69 trillion at the end of the second quarter of 2024. The bank category continues to hold the largest share of outstanding commercial debt, followed by Agency and GSE portfolios, life insurance companies, CMBS, CDO and other ABS issues, and finally “Others.” Chart 16.3 from the MBA Quarterly Databook shows the breakout of outstanding Commercial and Multifamily Mortgage Debt.
Total U.S. Commercial Mortgage-Backed Securities (CMBS) issuance came back strong after the 2008 recession. However, the pandemic led to 2020 year-end U.S. CMBS issuance of just $56 billion. 2021 CMBS issuance rose to $109.8 billion, a 14-year high. After a moderate drop off in in 2022 as rates began to rise, 2023 saw the lowest total issuance reported in many years at just $39.3 billion. The good news is that through just two quarters in 2024, total issuance already exceeds all of 2023 at $43.7 billion. In fact, U.S. CMBS issuance closed the year strong, much more on par with the banner year in 2021.
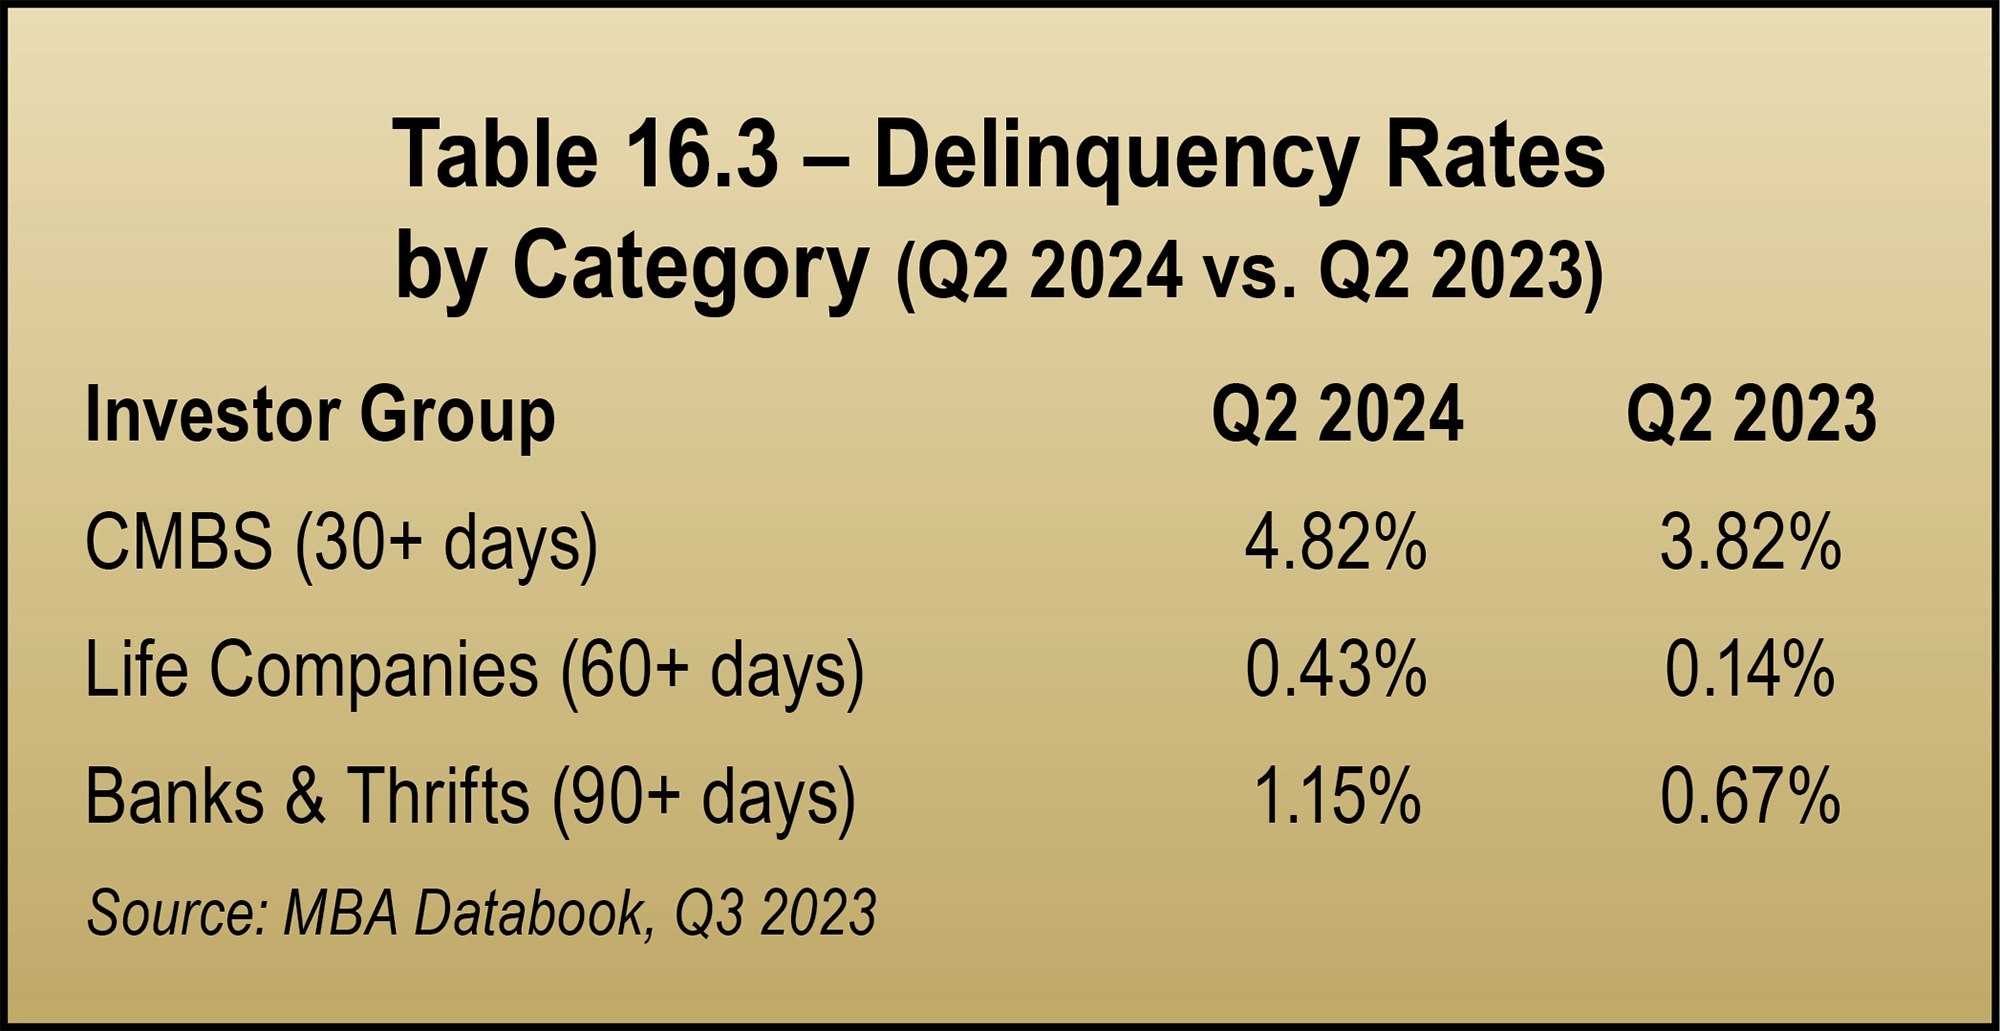
Self-storage reports favorable delinquency trends among its peers, outperforming all other property types. Per data historically available from the rating agency DBRS Morningstar, the delinquency rate for self-storage in the CMBS market peaked at 3.99 percent in 2011. This figure is still reported well below 1 percent, underscoring the strength of the sector. While no commercial real estate sector is fully recession-proof, industry experts have long speculated that self-storage is as close as it gets. See Chart 16.4 below.
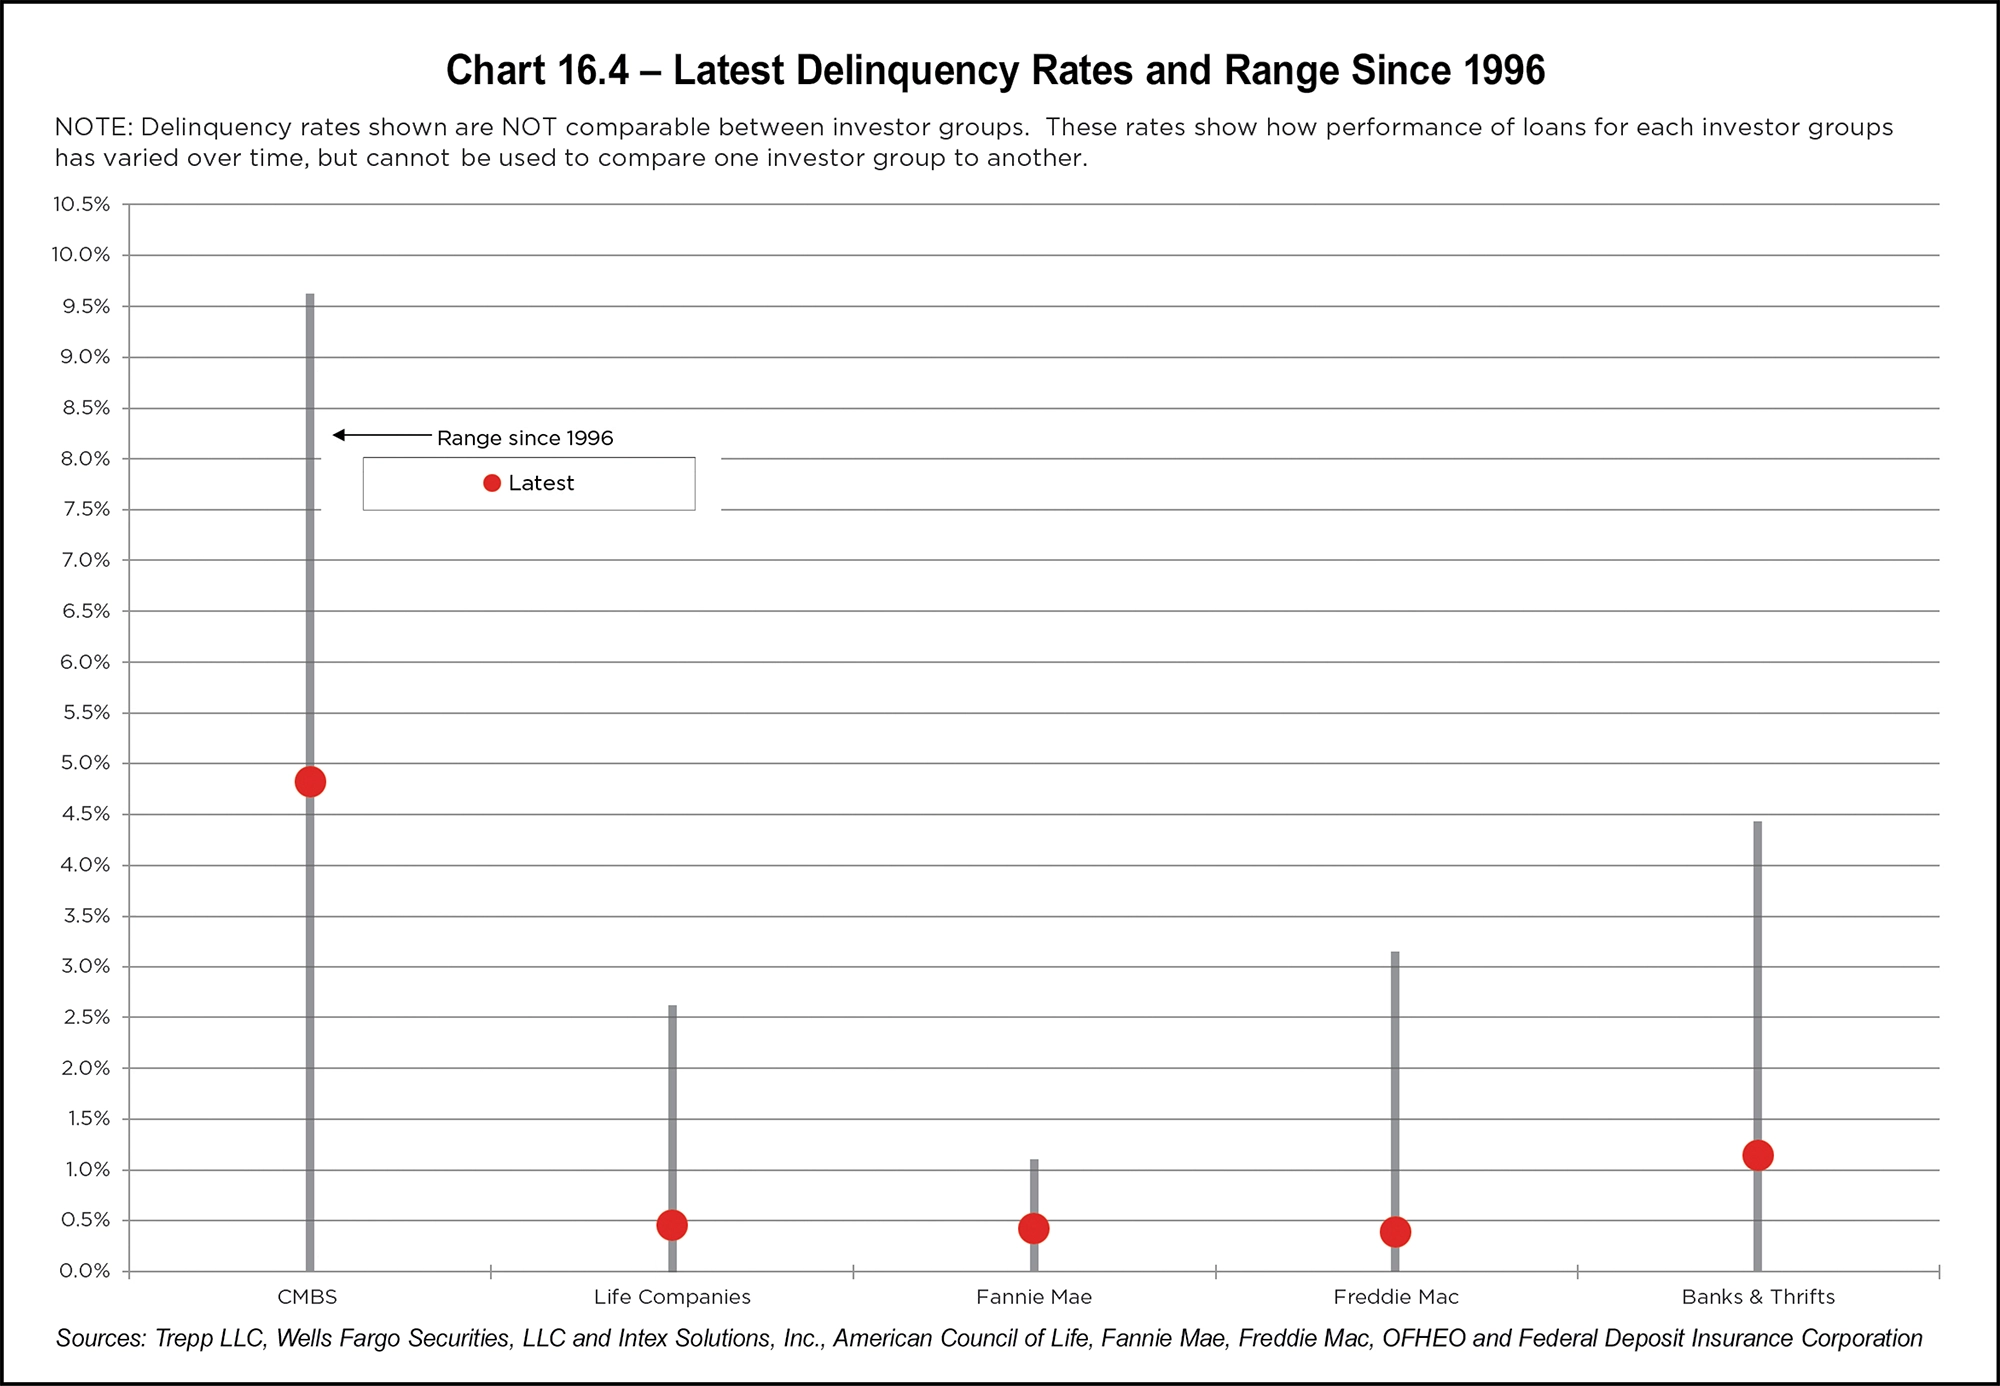
Given the current climate, it is critical to conduct a thorough review of quantitative and qualitative elements of any development in order to be successful, particularly from a financing standpoint.
With this in mind, banks are the most viable capital source for most developers. Small Business Administration (SBA) programs also provide construction financing, and some debt funds will selectively finance construction projects.
Conventional construction lenders were historically advancing up to 75 percent loan-to-cost (LTC). However, lenders have grown more risk averse in recent years. In fact, even if a lender had an appetite to lend at 75 percent, the deal often would not pencil at that leverage with current interest rates. Construction lenders can selectively offer fixed-rate options, floating rate priced over Treasuries, SOFR, or Prime is most common. As of the time of this writing, interest rates in development financing range from around 7 percent to well over Prime, depending on the project.
There is a strong preference in construction lending for full recourse with a completion guarantee, but non-recourse may be available at low leverage for well-heeled sponsors. After Certificate of Occupancy, a reduction to partial recourse (or non-recourse) is negotiable at the lender’s discretion.
It is important to arrange an upfront interest-only period until the property can cover amortizing debt service payments. This is coupled with an interest carry reserve until the property breaks even. One of the more costly errors in development financing is miscalculating the required lease-up time, a mistake which can, in a worst-case scenario, sink a development.
Lenders build debt service coverage tests into loan agreements and will stress test a project to see if it can cover interest-only payments after a predetermined number of months following completion. Eventually, lenders will test for principal and interest coverage. In addition to testing for project viability, this doubles as a lender safeguard.
The importance of thoughtful budgeting before beginning a project cannot be overstated. A feasibility study is essential. Borrowers should go above and beyond to understand the market, including market rents and the competitive landscape for both existing and prospective projects.
Bridge lenders came into focus following the 2008 recession and were competing for deals more than ever before. In fact, bridge lenders were so inundated with storage deals that they had the luxury of setting more restrictive loan minimums. While these minimums can prove challenging for borrowers with smaller transactions, they are not uniform and shouldn’t discourage borrowers from seeking bridge debt if necessary.
Bridge loans are often non-recourse in nature and can be originated to include a fixed or floating interest rate. They will commonly involve three-year terms with extension options exercisable for a predetermined fee if the loan is performing. Prepayment methodology varies but can be flexible and may include a stepdown or some minimum interest period. At the time of this writing, interest rate spreads range from roughly 300 to 600 bps above an index such as SOFR. The fee structure is sometimes referred to as “one in, one out,” because these lenders commonly charge an origination and exit fee of 1 percent of the loan amount.
Properties that require a bridge loan may not even cover interest-only debt service payments at origination, let alone amortizing payments. Consequently, bridge loans are structured with interest shortfall reserves to cover the gap. In some cases, these loans feature future funding components. Lenders may require cross-collateralization with another asset to provide additional credit enhancement for the lender. A bridge loan is not an appropriate long-term debt solution; however, it can be a flexible interim financing option. Even as interest rates ideally decline in 2025, there is no doubt bridge loans will remain an important source of capital for the storage industry.
Bank interest rates vary widely based on such factors as loan size, leverage, risk profile, and strength of the borrower’s existing relationship. Borrowers will find that banks can present extremely compelling quotes for transactions that fit inside their credit box. Bank loans are quoted over many indexes, including Treasuries, SOFR, Prime, and others. As such, banks are probably the product with the widest variation of interest rates in the market. Banks and credit unions can offer a rate lock at application for a set period of time to insulate interest rate risk over the closing period. Furthermore, banks can offer fixed or floating rate executions. At the time of this writing, rates range from mid-6 percent up beyond 9 percent.
Bank loans can have terms as short as two years or extend for 10 years or beyond. Amortization schedules tend to be on the conservative side at 20 or 25 years. Despite historically being able to offer as high as 80 percent leverage, today it is rare for a bank to comfortably exceed 75 percent leverage given DSCR constraints.
Banks will generally require personal recourse guarantees on almost all loans; however, the amount of recourse may be reduced or eliminated for low-leverage loans and for institutional sponsors where active relationships exist. Transaction costs for bank deals are generally reasonable, and prepayment structures are frequently negotiable.
Credit unions have been increasingly relevant capital sources for storage borrowers in the face of rising borrowing costs. Credit unions are akin to banks with several key differences. Banks tend to be extremely relationship driven, while credit unions may be more transactional in nature. Some credit unions exhibit a greater willingness to lend outside of a predefined footprint and are comfortable lending without a preexisting relationship. Credit unions rarely have deposit requirements and may be in a position to offer better interest rates than other lenders given their tax designations.
While credit unions have shined in the face of rising interest rates, this is not to imply they are better than banks. The particulars of a loan request will dictate which product is a better fit. Indeed, credit unions can be stricter on cash-out requests and are more likely to quote a tighter amortization period. Holding interest rates constant, shorter amortization schedules result in higher debt payments. Finally, credit unions are not typically equipped to handle construction or other transitional deals that require draws and the carrying of interest.
SBA rates are broadly priced over the Wall Street Journal Prime Rate. During the pandemic in 2020, when Prime was approximately 3 percent, SBA loans were particularly attractive compared to other products. However, Prime increased to a peak of 8.5 percent in July 2023, which was less compelling for new loans and also created challenges for existing loans that were floating rate in nature. It wasn’t until late 2024 that the Fed began reducing benchmark rates. Currently, SBA loan rates range from 0 percent to 3 percent over Prime, which could benefit borrowers if rates continue to decline in 2025.
The SBA 504 program consists of two loans: a bank-funded first mortgage covering 50 percent of the project and a CDC loan funding up to an additional 40 percent. The bank provides interim financing for the second loan, which is replaced by a 20- or 25-year, fully amortized fixed-rate SBA note after closing. Currently, the 25-year debenture rate is 6.1 percent. The resulting all-in 504 interest rate is the weighted average of the bank and SBA debenture rates. This product includes a step-down prepayment penalty, which can make early repayment costly compared to the 7(a) loan. Overall, the SBA 504 program is a viable financing option for both new and experienced borrowers.
SBA loans have key differences worth noting. The 504 program includes two loans (unlike the single-loan structure of 7[a]) and requires a mini-closing at the SBA funding stage. Since only part of a 504 loan is government sponsored, borrowers can often secure higher amounts than with a 7(a) loan. However, 504 loans typically have longer closing timelines and are limited to real estate uses. Conversely, 7(a) loans offer greater flexibility, including funding for working capital or interest shortfalls. Notably, 504 loans can be paired with a “sidecar” 7(a) loan to achieve similar outcomes. Prepayment penalties are generally more favorable with 7(a) loans. Lastly, while 7(a) loans are usually floating rate (with fixed-rate options selectively available), 504 loans always include a fixed-rate debenture, helping mitigate interest rate risk.
Both programs can come with heavy transaction costs compared to other loans, including guarantee fees and additional collateral requirements. SBA loans are also document intensive and time consuming to close. A shift in SBA operating procedures was recently implemented that opens a previously closed door for borrowers planning to engage larger third-party management companies, such as a REIT. SBA loans are a great option, specifically for first-time borrowers who are capital constrained, to finance storage in 2025.
Interest rates for CMBS transactions, like most loan products, are computed by adding a risk spread premium to a benchmark index such as a U.S. Treasury rate. For example, if spreads were 2.5 percent and the 10-year treasury rate sat at 4.2 percent, the corresponding rate on 10-year CMBS money would be 6.7 percent. CMBS interest rates are currently priced at roughly 200 to 300 bps over the applicable Treasury at the time of this writing. There is an option to buy down rate for a fee (1 percent buys down the interest rate by roughly 15 bps in a 10-year deal, while the same 1 percent buys down rate roughly 25 bps for a five-year product).
The bulk of CMBS loans originated traditionally were 10-year fixed-rate products with a 30-year amortization schedule after any interest-only period. There has been a proliferation of five-year CMBS deals in direct response to market demand, which creates a strategic advantage for borrowers who prefer a shorter term. This, in conjunction with six-month open prepayment at the end of the term, increases flexibility and will likely continue to be a popular option. Borrowers can take advantage of several structural advantages in CMBS such as non-recourse, multiple years of interest only, or to facilitate a cash out.
Historically, borrowers could achieve 75 percent leverage; however, higher interest rates have put downward pressure on leverage as deals become DSCR constrained. The CMBS product type can close quicker than many of its counterparts. All the above traits are distinguished advantages of the loan type, but the CMBS product is not without its drawbacks.
Restrictive prepayment options like yield maintenance or defeasance can pose challenges for borrowers. Defeasance involves replacing collateral for debt service payments, often with a portfolio of multi-denomination securities. Though time consuming and costly, hiring a defeasance firm can simplify the process. Both defeasance and yield maintenance penalties are less severe in a rising interest rate environment. In fact, the current interest rate environment has made a compelling case for those looking to refinance a CMBS loan as the rates of the day are often elevated compared to the rate attached to the loan being prepaid.
CMBS features higher closing costs and more rigid loan documents than other loan types. However, a few CMBS lenders offer competitive fixed closing cost programs between $25,000 and $32,000 all-in for loans up to $10 million as part of a small balance loan program.
Because CMBS loans are pooled together and sold as a securitized bond in the secondary market, the loan documents have many non-negotiable standard clauses and requirements. Additionally, the loans are most often serviced by a third-party, rendering any post-closing structural changes more challenging.
CMBS lenders prefer primary market deals but will compete for loans in secondary markets as well. Location is one of several qualitative factors that can impact base pricing. The non-recourse nature of these loans, in addition to the ability to secure extended interest-only periods and cash-outs make these loan products appealing for borrowers. As interest rates ideally continue to fall over the coming months, the CMBS market has been and will continue to be an extremely active loan option for self-storage borrowers.
Given their conservative nature, Life Companies put an emphasis on stressing cash flow and cap rates, in addition to mandating higher going in DSCRs. It is no surprise these loans are frequently constrained at lower leverage than their counterparts. Many Life Companies have historically preferred larger loans ($10 million and up) but will stretch down for the right deal to compete with other loan products.
Life Companies offer terms ranging from three years all the way up to 30-year, fully amortizing structures. These products are cost-effective to close, and borrowers can often negotiate flexible prepayment terms. Lenders may also provide forward rate lock agreements with a signed application. With a focus on conservative underwriting and low leverage, Life Companies currently offer some of the lowest interest rates in the market, starting in the low 5 percent range. Notably, nearly all structural features are open to negotiation.
While Life Company loans can be a great source of capital if the deal checks the credit criteria boxes, it is worth reiterating that these lenders only extend terms to the best properties owned by highly experienced and well-capitalized sponsors. That said, because of the tremendous track record of self-storage against other property types, insurance lenders continue to exhibit an appetite for self-storage in 2025.
Many developments funded in the past five years relied on projections that have not materialized as anticipated. Rising interest rates, construction delays, increased development costs, and downward pressure on rental rates have left some borrowers struggling to meet loan payments or debt covenants. These challenges have sometimes left projects requiring creative solutions. This is all in addition to the situation outlined in the previous capital stack example regarding stressed debt on stabilized assets. Softening fundamentals have even led to a decline in operating income for some stabilized assets, making it more difficult to cover debt service.
In today’s volatile market, understanding financing options for distressed assets is critical. Fortunately, true distress in the storage industry remains rare. If distress becomes more common, various solutions are available. Bridge loans, for instance, can provide additional time for assets to stabilize. For more severely distressed properties, consulting brokers or other professionals may uncover viable strategies.
Subordinate debt is a blanket term for additional financing with a lower priority to cash flow than the first lien mortgage. This type of debt can provide more capital and higher leverage to help bridge an equity gap. Subordinate debt lenders in the current market will take a capital position between the first mortgage cut off, reaching up to 85 percent LTV or sometimes even higher.
By reaching higher in the capital stack, subordinate lenders inherently assume greater risk and therefore expect a higher rate of return. Interest rates on subordinate debt available in the market today range from 10 percent to 20 percent. Subordinate debt lenders can be flexible and willing to structure payments to match the cash flow projections of the asset. For example, the debt might feature interest-only payments for several years or in some cases for the full term.
The two most common subordinate debt products are junior mortgages (B-Notes) and mezzanine financing. Mezzanine lenders provide subordinate debt that is secured against an ownership position in the borrowing entity, rather than the mortgaged property itself. Conversely, B-Notes take a secondary debt position secured by the mortgaged property as collateral for the loan.
There are situations where cash flow erosion is so severe that it no longer supports the debt service payments. In extreme cases, the corresponding value decline may be so significant that the sponsor’s equity is completely eroded. In these situations, the sponsor may be required to infuse fresh equity into the transaction. If the sponsor does not have the equity, one option is to seek joint venture equity. Joint venture equity is selectively available to owners in transactions where there is upside, stemming from a development or recapitalization scenario and resulting in enhanced cash flow and consequent value.
An experienced broker knows how to effectively package a loan request and strategically present the asset to the lending community. When lenders are reviewing multiple potential deals, they are far more likely to engage with a well-organized presentation than a disjointed assortment of documents. Mortgage brokers are constantly in the market assessing lender appetite and implementing feedback from those lenders to fine tune the deliverable and secure the best lending options available.
Mortgage brokers will charge for their services, but borrowers reap the benefits of a more seamless loan process. Beyond assisting with the packaging and loan closing process, engaging a qualified broker allows borrowers to focus on maximizing their resources in other areas. By freeing up time otherwise spent shopping and closing a loan on their own, these borrowers can focus on other value-add strategies, such as acquiring new facilities or expanding existing assets.
There remains room for improvement in both the underlying interest rate indices and credit spreads to bring on more favorable financing this year. Even if interest rates remain relatively constant in 2025, they are favorable by historic comparison. Self-storage has reacted positively to economic volatility in the past and performs very well in the face of adversity. It seems more likely with each passing day that 2025 may mark an inflection point where cautious optimism yields to much better times.


Call: 877-350-4104
Email: Results@StoragePRO.com
StoragePROmanagement.com


-
NATIONALNational Portable Storage Association
Contact: Mark DePasquale, CEO
3312 Broadway, Suite 105
Kansas City, MO 63114
(816) 960-6552
mark@npsa.org
www.npsa.org -
Self Storage Association
Contact: Tim Dietz, CEO
1001 N. Fairfax Street, Suite 505
Alexandria, VA 22314
(888) 735-3784
tdietz@selfstorage.org
www.selfstorage.org
-
STATEAlabama Self Storage Association
Contact: Mary Ellen Brown or Nikki Skrmetti
PO Box 282
Hixson, TN 37343
(423) 443-8249
info@alabamassa.org
www.alabamassa.org -
Arizona Self-Storage Association
Contact: Amy Amideo, Exec. Director
PO Box 44031
Phoenix, AZ 85064
(602) 374-7184
azsa@azselfstorage.org
www.azselfstorage.org -
Arkansas Self Storage Association
Contact: Shelly Harris
PO Box 250768
Little Rock, AR 72225
(501) 607-4775
sharris@arssa.org
www.arssa.org -
California Self Storage Association
Contact: Ross Hutchings, Exec. Director
5325 Elkhorn Boulevard, #283
Sacramento, CA 95842
(888) 277-2207
ross@californiaselfstorage.org
www.californiaselfstorage.org -
Colorado Self Storage Association
Contact: Sherry Harris, Administrator
9457 S. University Boulevard, Suite 810
Highlands Ranch, CO 80126
(303) 350-0070
admin@coloradossa.com
www.coloradossa.com -
Dakotas Self Storage Association
Contact: Erin Lightfoot
1001 N. Fairfax Street, Suite 505
Alexandria, VA 22314
(703) 575-8000, ext. 100
DakotasSSAExecDir@selfstorage.org
www.DakotasSSA.org -
Florida Self Storage Association
Contact: Leslie Fuqua
1001 N. Fairfax Street, Suite 505
Alexandria, VA 22314
(863) 884-7204
FSSAExecDir@selfstorage.org
www.floridassa.org -
Georgia Self Storage Association
Contact: Samantha Kilgore, Exec. Director
PO Box 1128
LaGrange, GA 30241
(678) 764-2006
info@gassa.org
www.gassa.org -
Idaho Self Storage Association
Contact: Erin Lightfoot
1001 N. Fairfax Street, Suite 505
Alexandria, VA 22314
(703) 575-8000, ext. 100
IDSSAExecDir@selfstorage.org
www.ssaidaho.org -
Illinois Self Storage Association
Contact: Leslie Fuqua
1001 N. Fairfax Street, Suite 505
Alexandria, VA 22314
(703) 575-8000, ext. 100
ILSSAExecDir@selfstorage.org
www.ilselfstorage.org -
Indiana Self Storage Association
Contact: Darren Ing
1001 N. Fairfax Street, Suite 505
Alexandria, VA 22314
(703) 575-8000, ext. 100
INSSAExecDir@selfstorage.org
www.ssaindiana.org -
Iowa Self Storage Association
Contact: Erin Lightfoot
1001 N. Fairfax Street, Suite 505
Alexandria, VA 22314
(703) 575-8000, ext. 100
iassaexecdir@selfstorage.org
www.iowassa.org -
Kansas Self Storage Owners Association
Contact: Brian Goldman, Exec. Director
PO Box 7624
Overland Park, KS 66207
(785) 380-8886
kansasstorage@gmail.com
www.kssoa.org -
Kentucky Self Storage Organization
Contact: Darren Ing
1001 N. Fairfax Street, Suite 505
Alexandria, VA 22314
(703) 575-8000, ext. 100
KYSSAExecDir@selfstorage.org
www.kyssa.org -
Louisiana Self Storage Association
Contact: Melissa Huff, Director
13434 Plank Road
Baker, LA 70714
(423) 443-8249
info@ssala.org
www.ssala.org -
Maine Self Storage Association
Contact: Rich Trott, President
c/o Swift Storage
35 Farwell Drive
Rockland, ME 04841
(207) 596-6401
mainestorage@gmail.com
www.mainessa.com -
Maryland Self Storage Association
Contact: Julie LaRose
1001 N. Fairfax Street, Suite 505
Alexandria, VA 22314
(703) 575-8000, ext. 100
MDSSAExecDir@selfstorage.org
www.ssamaryland.org -
Self-Storage Association of Michigan
Contact: Darren Ing
1001 N. Fairfax Street, Suite 505
Alexandria, VA 22314
(888) 308-7726
SSAMExecDir@selfstorage.org
www.selfstoragemichigan.org -
Minnesota Self Storage Association
Contact: Erin Lightfoot
1001 N. Fairfax Street, Suite 505
Alexandria, VA 22314
(703) 575-8000, ext. 100
MNSSAExecDir@selfstorage.org
www.minnesotassa.org -
Mississippi Self Storage Owners Association
Contact: Heather McCombs, Exec. Director
PO Box 352
Biloxi, MS 39533
(228) 365-8965
msssoa@gmail.com
www.msssoa.org -
Missouri Self Storage Owners Association
Contact: Shelly Harris, Exec. Director
PO Box 105920
Jefferson City, MO 65110
(573) 480-0454
sharris@mssoa.org
www.mssoa.org -
Montana Self Storage Association
Contact: Erin Lightfoot
1001 N. Fairfax Street, Suite 505
Alexandria, VA 22314
(703) 575-8000, ext. 100
MTSSAExecDir@selfstorage.org
www.montanassa.org -
Nebraska Self Storage Association
Contact: Bill Lange, President
PO Box 173
Kearney, NE 68848
(308) 338-9947
www.nebraskaselfstorageownersassociation.com -
Nevada Self Storage Association
Contact: Erin Lightfoot
1001 N. Fairfax Street, Suite 505
Alexandria, VA 22314
(703) 575-8000, ext. 100
NVSSAExecDir@selfstorage.org
www.nvssa.org -
New Hampshire Self Storage Association
Contact: Courtney Kahler, Exec. Director
17047 Goldcrest Loop
Clermont, FL 34714
(603) 255-7055
NHSSA@NHSSA.net
www.NHSSA.net -
New Jersey Self Storage Association
Contact: Julie LaRose
1001 N. Fairfax Street, Suite 505
Alexandria, VA 22314
(703) 575-8000, ext. 100
NJSSAExecDir@selfstorage.org
www.njssa.org -
New Mexico Self Storage Association
Contact: Erin Lightfoot
1001 N. Fairfax Street, Suite 505
Alexandria, VA 22314
(703) 575-8000, ext. 100
NMSSAExecDir@selfstorage.org
www.newmexicossa.org -
New York Self Storage Association
Contact: Peter Ferraro, CEO
121 State Street
Albany, NY 12207
(518) 431-1106
admin@nyselfstorage.org
www.nyselfstorage.org -
North Carolina Self Storage Association
Contact: Sally Novak
1001 N. Fairfax Street, Suite 505
Alexandria, VA 22314
(703) 575-8000, ext. 100
NCSSAExecDir@selfstorage.org
www.NCSSAonline.org -
Northeast Self Storage Association
Contact: Courtney Kahler, Exec. Director
17047 Goldcrest Loop
Clermont, FL 34714
(617) 600-4481
NeSSA@NeSSA.org
www.NeSSA.org -
Ohio Self Storage Association
Contact: Sally Novak
1001 N. Fairfax Street, Suite 505
Alexandria, VA 22314
(703) 575-8000, ext. 100
OHSSAExecDir@selfstorage.org
www.ohiossa.org -
Oregon Self Storage Association
Contact: Erin Lightfoot
1001 N. Fairfax Street, Suite 505
Alexandria, VA 22314
(703) 575-8000, ext. 133
eking@selfstorage.org
www.orssa.org -
Pennsylvania Self Storage Association
Contact: Julie LaRose
1001 N. Fairfax Street, Suite 505
Alexandria, VA 22314
(703) 575-8000, ext. 100
passaexecdir@selfstorage.org
www.paselfstorage.org -
Self Storage Association of South Carolina
Contact: Mary Kate Mackie, Exec. Director
PO Box 12042
Columbia, SC 29211
(803) 814-4000
info@SCSelfStorage.org
www.SCSelfStorage.org -
Tennessee Self Storage Association
Contact: Melissa Huff, Director
PO Box 91
Hixson, TN 37343
(423) 443-8249
info@tnssa.net
www.tnssa.net -
Texas Self Storage Association
Contact: Kristy Spurr, Exec. Director
595 Round Rock West Drive, Suite 503
Round Rock, TX 78681
(512) 374-9089
info@txssa.org
www.txssa.org -
Utah Self Storage Association
Contact: Erin Lightfoot
1001 N. Fairfax Street, Suite 505
Alexandria, VA 22314
(703) 575-8000, ext. 100
UTSSAExecDir@selfstorage.org
www.ssautah.org -
Vermont Self Storage Association
Contact: Julie LaRose
1001 N. Fairfax Street, Suite 505
Alexandria, VA 22314
(703) 575-8000, ext. 100
VTSSAExecDir@selfstorage.org
www.ssavt.org -
Virginia Self Storage Association
Contact: Sally Novak
1001 N. Fairfax Street, Suite 505
Alexandria, VA 22314
(703) 575-8000, ext. 114
VASSAExecDir@selfstorage.org
www.virginiassa.org -
Washington Self Storage Association
Contact: Diane Bevins
1402 Lake Tapps Parkway SE, Suite F-104-133
Auburn, WA 98092
(206) 653-7259
info@wa-ssa.org
www.wa-ssa.org -
Wisconsin Self Storage Association
Contact: Barbara Scheibe, Exec. Director
21620 Belgren Road
Waukesha, WI 53186
(262) 786-3960
info@wiselfstorage.org
www.wiselfstorage.org -
INTERNATIONALFederation of European Self Storage Associations (FEDESSA)
Contact: Rennie Schafer
Bluepoint
80 BD. A. Reyers
1030 Brussels, Belgium
+32 472 943324
info@fedessa.org
www.fedessa.org -
Self Storage Association of Australasia
Contact: Sandra Evans
Unit 4 – 2 Enterprise Drive
Bundoora, Victoria 3083
Australia
+61 3 9466 9699
admin@selfstorage.com.au
www.selfstorage.com.au -
Belgian Self Storage Association
Contact: Carlo Swaab
Breedveld 29
1702 Groot-Bijgaarden, Belgium
+32 2 229 56 42
info@shurgard.be -
Canadian Self Storage Association
Contact: Sue Margeson
PO Box 43
Rosseau, ON, P0C 1J0, Canada
(888) 898-8538
info@cssa.ca
www.cssa.ca -
Danish Self Storage Association
c/o City Self Storage
Bryghuspladsen 8, Indg. C, 3. Sal
1473 Kbh K, Denmark
+45 30 36 00 43
alag@pelicanselfstorage.dk
www.selfstoragedenmark.dk -
France Self Storage Association
Contact: Loic Vaillant
+33 1 70 37 29 64
contact@ci-selfstockage.fr
ci-selfstockage.fr -
Germany Self Storage Association
Contact: Christian Lohmann
NordkanalstraBe 52
20097 Hamburg, Germany
040 21091765
info@selfstorage-verband.de
www.selfstorage-verband.de -
Ireland Self Storage Association
Contact: Brian Hefferon
c/o Elephant Storage Ltd. Nesta
Deansgrange Business Park
Deansgrange
Co. Dublin, A94 A4AG
353 (01) 219 0200
www.irishselfstorageassociation.ie -
Italy Self Storage Association
Contact: Cesare Carcano
info@aisi-selfstorage.it
www.aisi-selfstorage.it -
Japan Self Storage Association
Contact: Tatsuya Saji
Japan 101-0051 Tokyo 2-11-4-301 Jinbocho Kanda Chiyoda-ku
81-3-5211-8933
rsaji@trwinds.com -
The Netherlands’ Self Storage Association
Van Lennepweg 10
2111 HV Aerdenhout
The Netherlands
0031 6 54 27 47 92
info@shurgard.nl
www.nssa.nl -
Norwegian Self Storage Association
Contact: Per Hague
Havnegaten 2 – 4306 Sandnes
0580 Oslo
992 518 944
www.nssa.no -
Spain Self Storage Association
Contact: Carles Viladecans
Street Calvet 5, 2º 2ª
08021 Barcelona, Spain
34 937 076 549
info@aess.es
www.aess.es -
Self Storage Association Sweden
Contact: Paola Barraza
Box 2-178 21 Ekero, Sweden
46 851970073
paola.barraza@ssasweden.com
www.ssasweden.com -
Swiss Self Storage Association
Contact: Christian Schmutz
Hardstrasse 14
CH-4052 Basel
Switzerland
0041 61 312 44 88
info@3sa.ch
www.3sa.ch -
Self Storage Association of the United Kingdom
Contact: Rennie Schafer
The Gullet
Nantwich, Cheshire
CW5 5SZ, UK
+44 1270 623150
admin@ssauk.com
www.ssauk.com -
Other Sources
-
BRB Publications, Inc.
-
Bureau of Labor Statistics
-
Claritas
-
ESRI
-
Integra Realty Resources
-
International Code Adoptions State and Jurisdiction Information
-
International Code Council (ICC)
-
MapInfo
-
National Conference of States on Building Codes and Standards (NCSBCS)
-
The National Fire Protection Association (NFPA)
-
PublicData.com
-
U.S. Census Bureau
-
U.S. Chamber of Commerce