he lending environment for commercial real estate in 2024 proved more favorable than in 2023. However, it was a far cry from a banner year of low interest rates as many anticipated. Interest rates were down from recent highs in 2023, but volatility paved the way for a choppy year marked with a handful of favorable transaction windows. The persistence of higher rates at a time when a large portion of outstanding debt was coming due for refinance presented challenges for borrowers across the storage industry. Many borrowers who delayed refinancing in 2023, hoping for lower rates, did not find 2024 to be the saving grace they needed. Still, transaction volume increased, and numerous compelling loan options were available for borrowers who had to refinance last year. In fact, there were positive signals in the market and there is optimism that 2025 may bring relief.
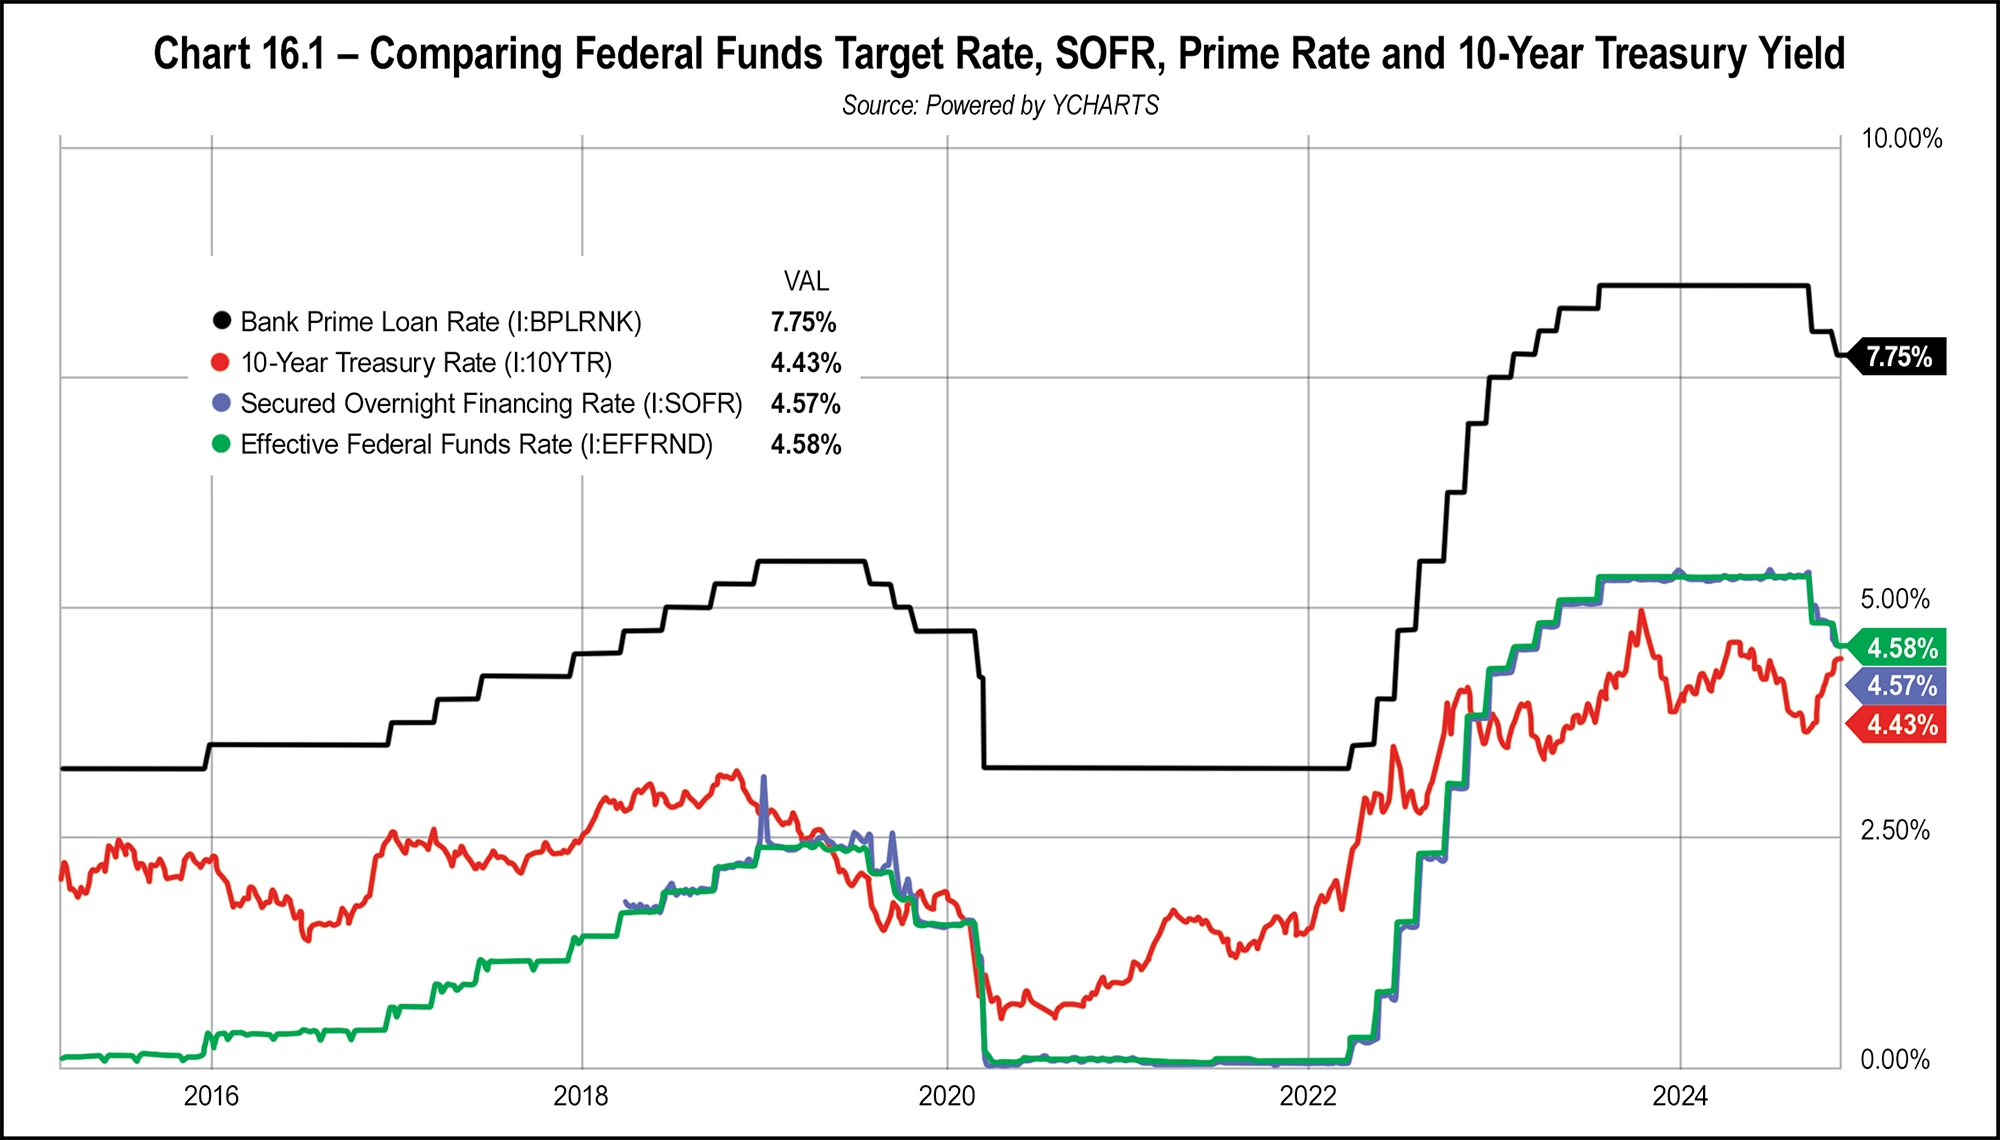
Before diving into various loan products, it will be useful to review recent interest rate trends. Following the onset of the 2008 financial crisis, the Federal Reserve lowered the target range to 0.0 to 0.25 percent; this persisted until an initial rate hike in December 2015. The ensuing rate hike cycle continued until a peak in 2018, when the range hit 2.25 to 2.5 percent. In what Fed Chairman Jerome Powell termed a “mid-cycle adjustment,” the Fed lowered rates by a quarter point three times in 2019. The onset of COVID-19 prompted an emergency meeting in March 2020, when the Fed slashed rates back to zero, echoing policy action enacted in 2008. Two years later, in March 2022, the Fed began aggressively raising rates to combat soaring inflation, increasing the benchmark rate by 525 basis points (bps) over a period of just 14 months. This included seven hikes in 2022 and four more in 2023, the fastest rate hike cycle since the 1980s stagflation crisis. The culmination of the recent rate hikes amounted to significantly more expensive borrowing costs in 2022 and 2023 compared to recent years.
For context, it’s important to note that 2024 marked a shift for the Federal Reserve, which cut rates twice—first by 50 bps in September, followed by another 25-bp reduction in November. There was a possibility of another cut before the year ended, and market sentiment points to the Fed continuing to lower rates into 2025. However, the pace of further rate cuts remains uncertain. Among other concerns, macroeconomic conditions domestically alongside geopolitical factors will guide prospective Fed policy actions in 2025.
The Secured Overnight Funding Rate (SOFR) and Wall Street Journal Prime Rate (Prime) generally move in lockstep with the Fed Rate. For instance, a 25-bp change in the latter typically results in similar movements in the former. SOFR and Prime are commonly applied to price floating rate debt products. Meanwhile, Treasury rates move constantly and are the most frequently utilized index for fixed rate debt. Chart 16.1 on page 163 compares the Federal Funds Target, the 10-Year Treasury, SOFR, and Prime rates across the last decade.
- LTV = loan amount divided by appraised value
- Debt yield = net operating income (NOI) divided by loan amount
- DSCR = NOI divided by annual debt service
In times of rising or elevated interest rates, loan proceeds are commonly constrained by DSCR hurdles rather than LTV or debt yield. For example, an asset with a $10 million valuation may not be eligible for a $7.5 million loan (75 percent LTV) if the in-place cash flow reports well below a 1.2-times DSCR. The following hypothetical capital stack example highlights the challenge some borrowers experienced over the last 18 months if a refinance was required.
Consider a facility that was purchased in 2020 for $4 million with an NOI of $250,000 at acquisition. Assuming moderate growth, Year-4 NOI is reported at $320,000. Holding cap rates constant, the increased NOI results in a Year-4 value of $5.12 million. If rates had increased moderately since acquisition, 75 bps in this example, the borrower could have refinanced the loan and qualified for a cash out of approximately $500,000. Table 16.1 illustrates the scenario described above.
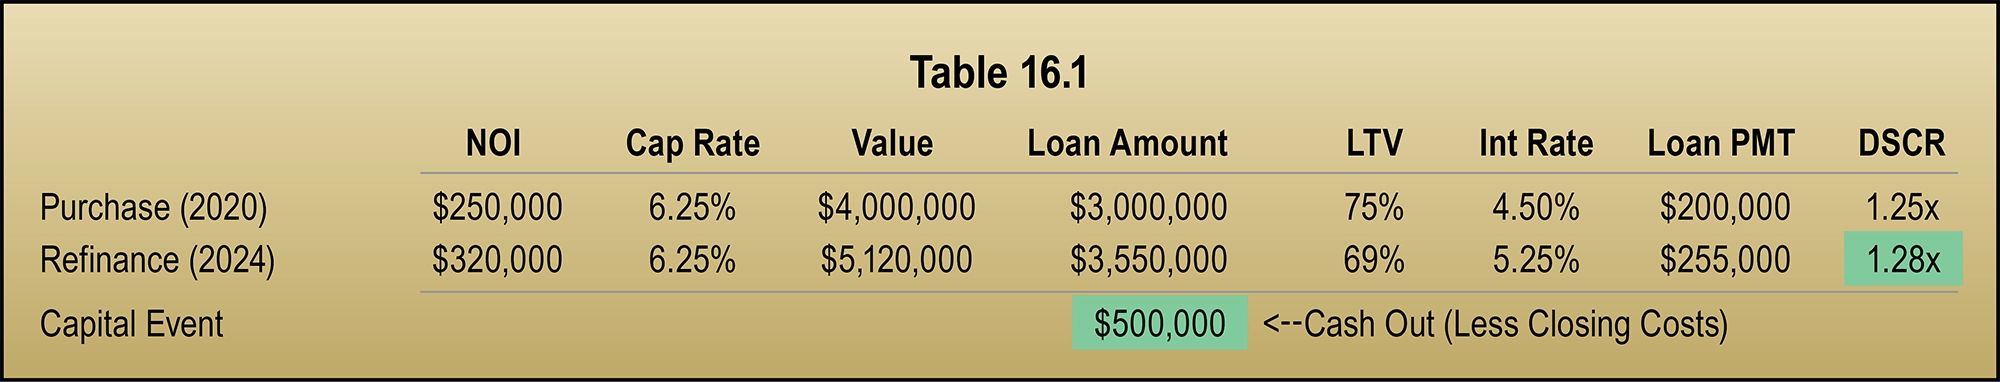
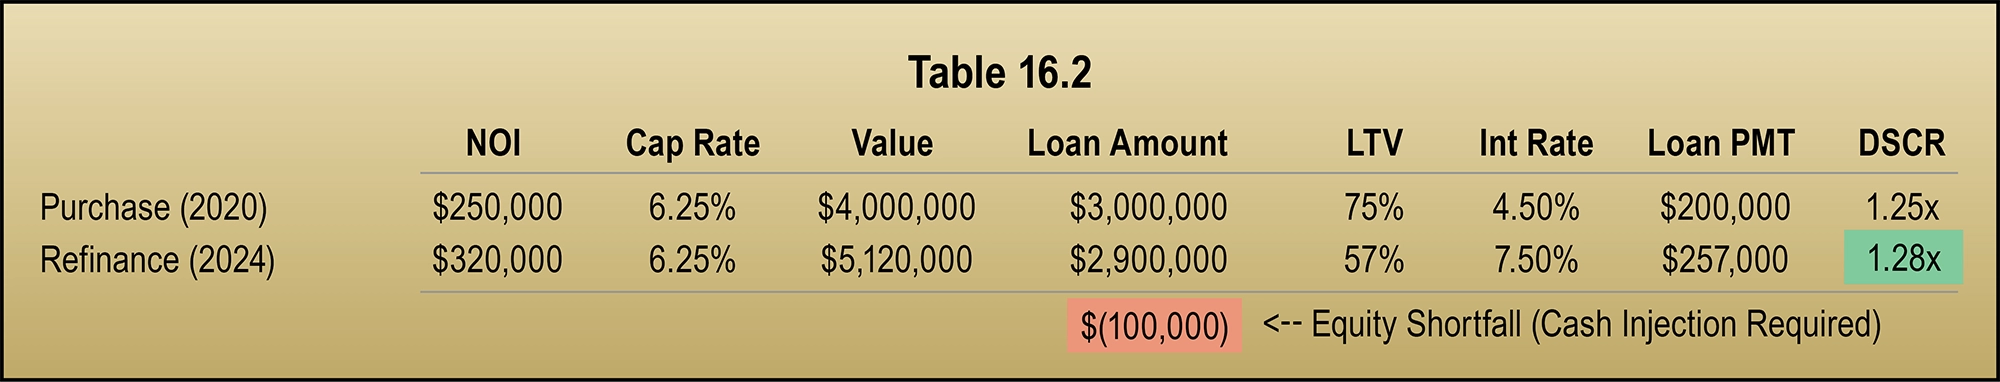
This example, while realistic, was conceived in an Excel spreadsheet and could be adjusted to produce varying outcomes. In fact, not every refinance pushed through resulted in an equity shortfall—some still enabled cash-outs, whereas some were cash-neutral. The key takeaway is that sharply rising interest rates have made debt-service-constrained loans more commonplace.
Although cap rates did not increase in lockstep with interest rates, the transaction market was stifled by an inherent mismatched perception of asset values by buyers and sellers. In other words, while an appraised value might not have been driven down much (or at all), higher interest rates prevented many deals from penciling out across the industry. In addition, a softening of storage fundamentals occurred in recent years, including slower (or negative) rate growth and a pull-back in occupancies. According to data from MJ Partners Market Overview, the public REITs reported same-store occupancies ranging from 85.6 percent to 94.3 percent, compared to 88.5 percent to 94.1 percent in 2023. Perhaps more impactful, MJ Partners notes that same-store revenue growth trends for the REITs were all negative in Q3 2024 compared to one year earlier, ranging from -0.3 percent to -3.5 percent. Softness notwithstanding, a continued trend of declining interest rates in 2025 will pave the way for more lending liquidity next year.
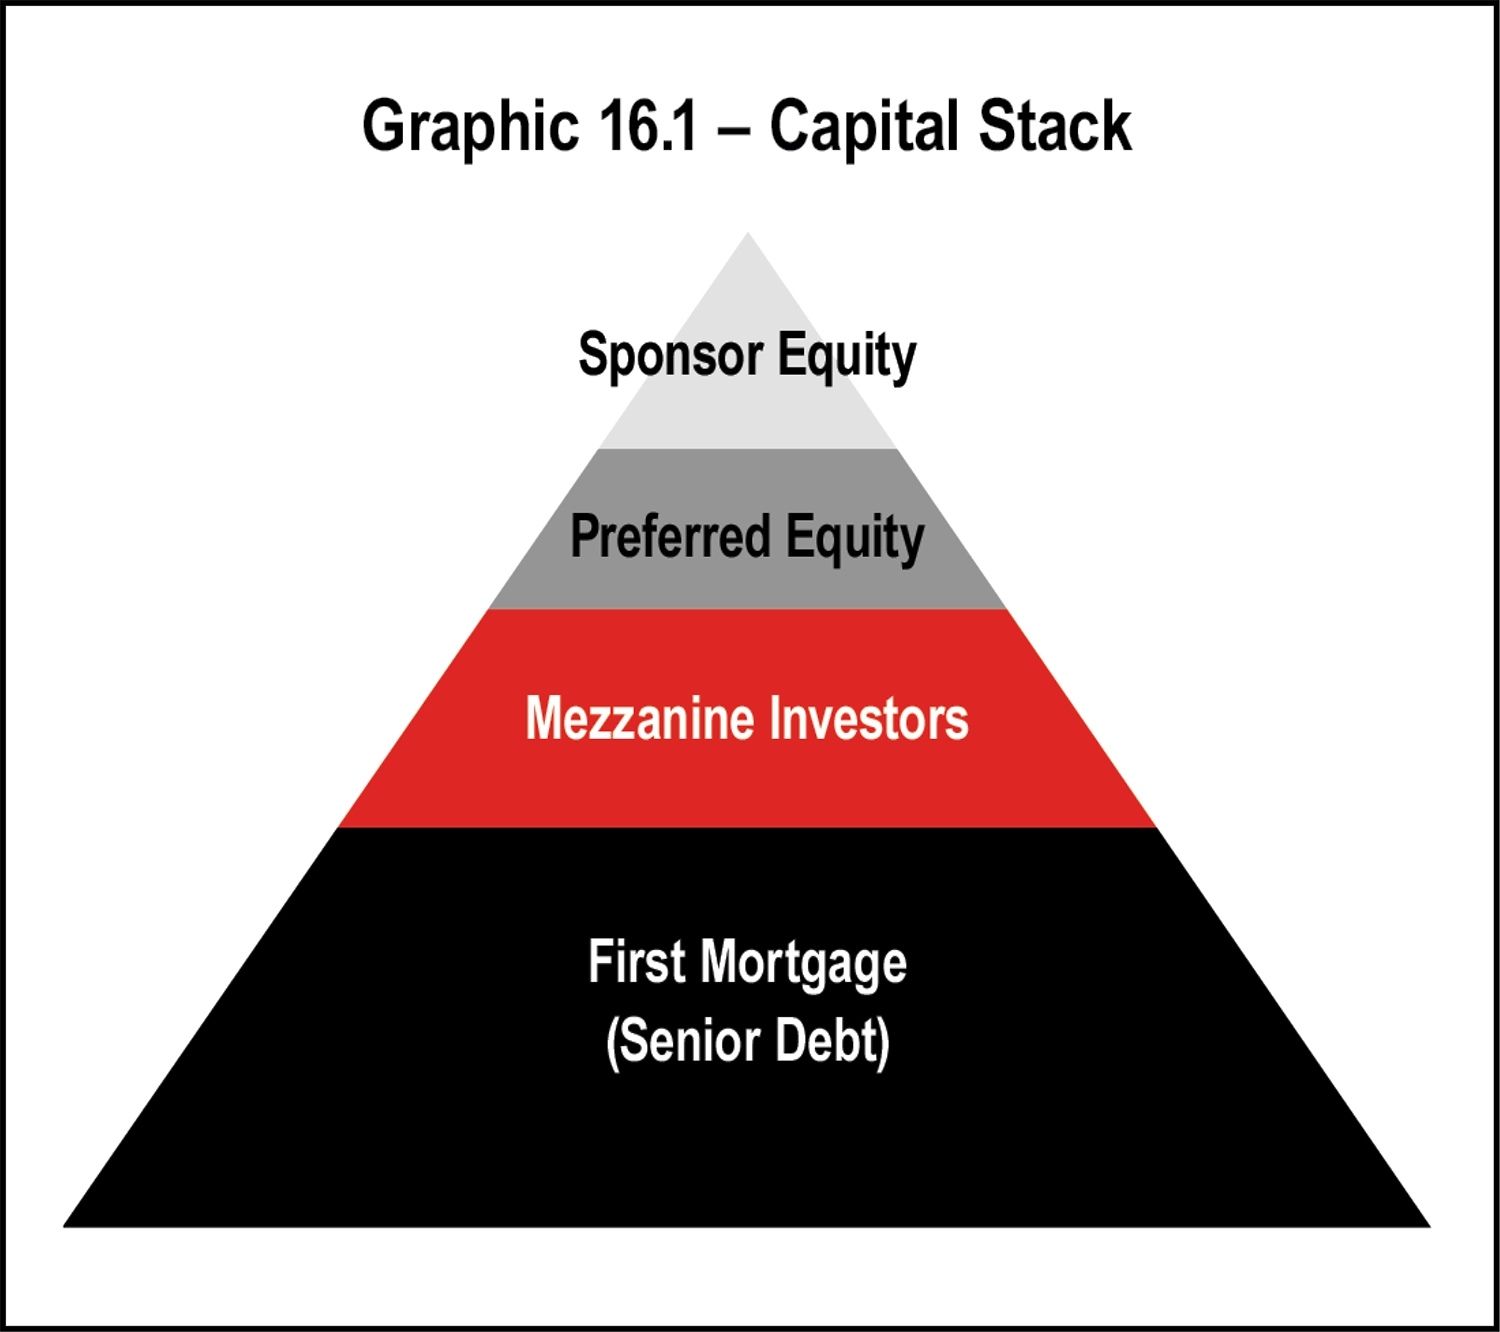
- Sponsor equity
- Preferred equity
- Mezzanine investors (hybrid debt and equity)
- First mortgage (senior debt)
The relative position of the stakeholders within the capital stack changes with the passage of time. As the mortgage principal is paid down, equity increases. Sponsor equity is subordinate to most debt. The value of sponsor equity can be calculated by subtracting the value of the higher priority positions from the asset’s market value.
The amount of equity a sponsor holds in an asset is important to a lender. A borrower with little or no equity stake in a property may have different interests than one with ample equity remaining, especially in the eyes of a lender. This does not discount long-term ownership where capital investments continue to be made into property to support and increase value.
Mezzanine debt and preferred equity are available in the market for larger transactions and under special circumstances. The pyramid graphic shows these interests lodged between the senior loan and sponsor equity positions. Given that these loans are subordinate to senior debt, they are riskier and therefore command higher interest rates. Debt funds, which can serve as the senior lender or provide a level of hybrid debt, have become more popular lately.
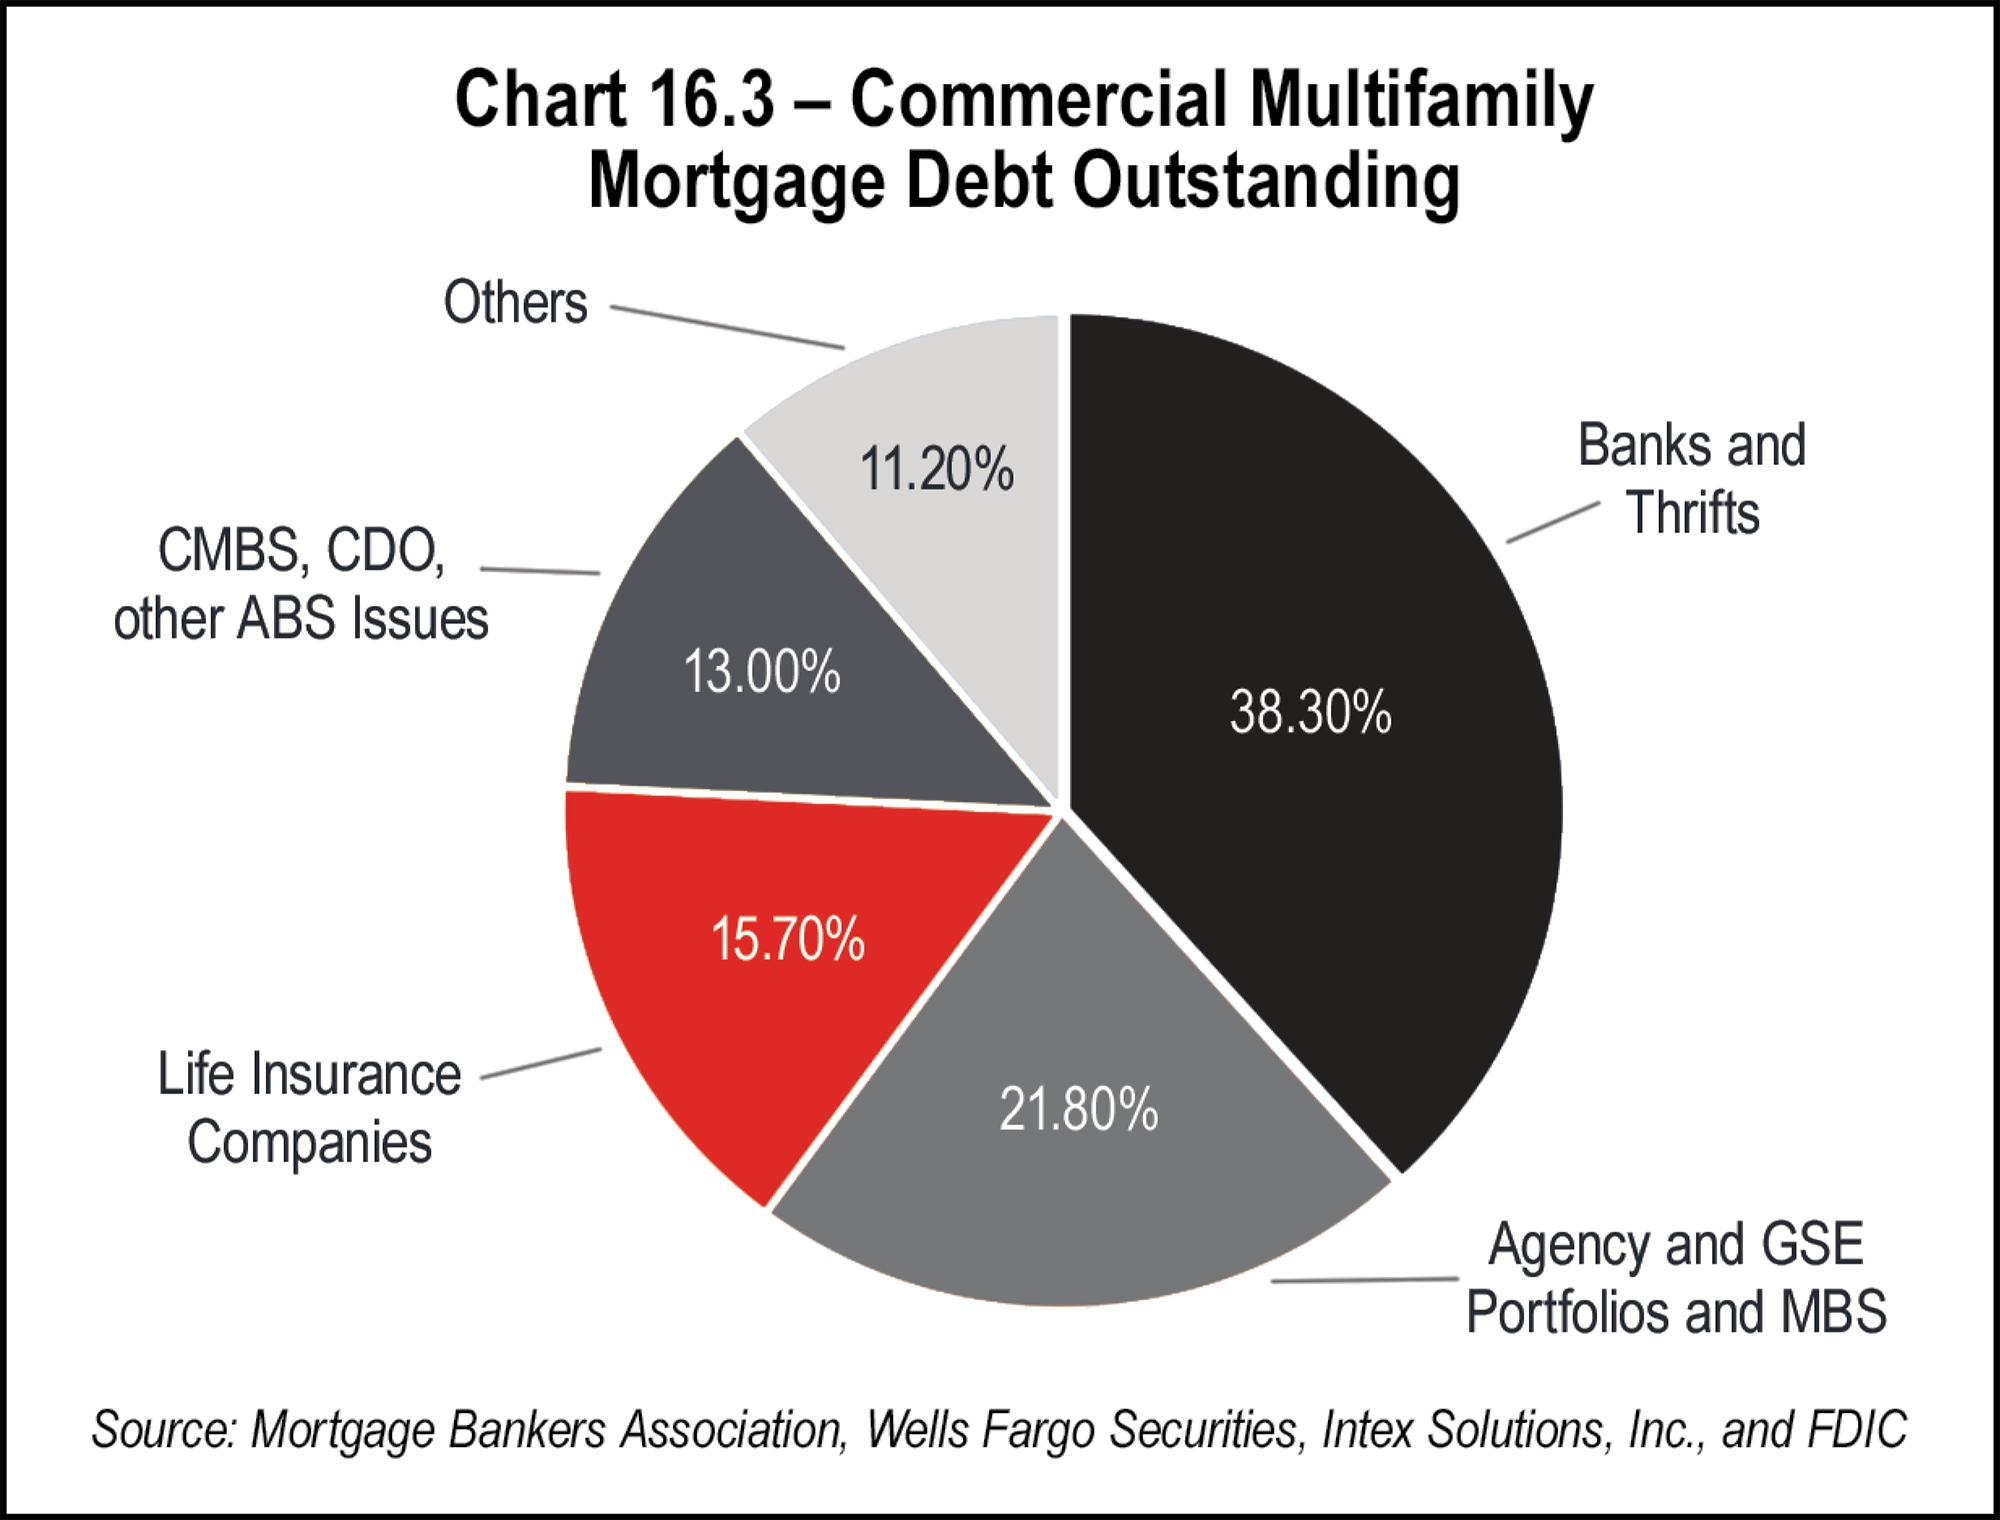
The sum of outstanding commercial mortgage debt rose to $4.69 trillion at the end of the second quarter of 2024. The bank category continues to hold the largest share of outstanding commercial debt, followed by Agency and GSE portfolios, life insurance companies, CMBS, CDO and other ABS issues, and finally “Others.” Chart 16.3 from the MBA Quarterly Databook shows the breakout of outstanding Commercial and Multifamily Mortgage Debt.
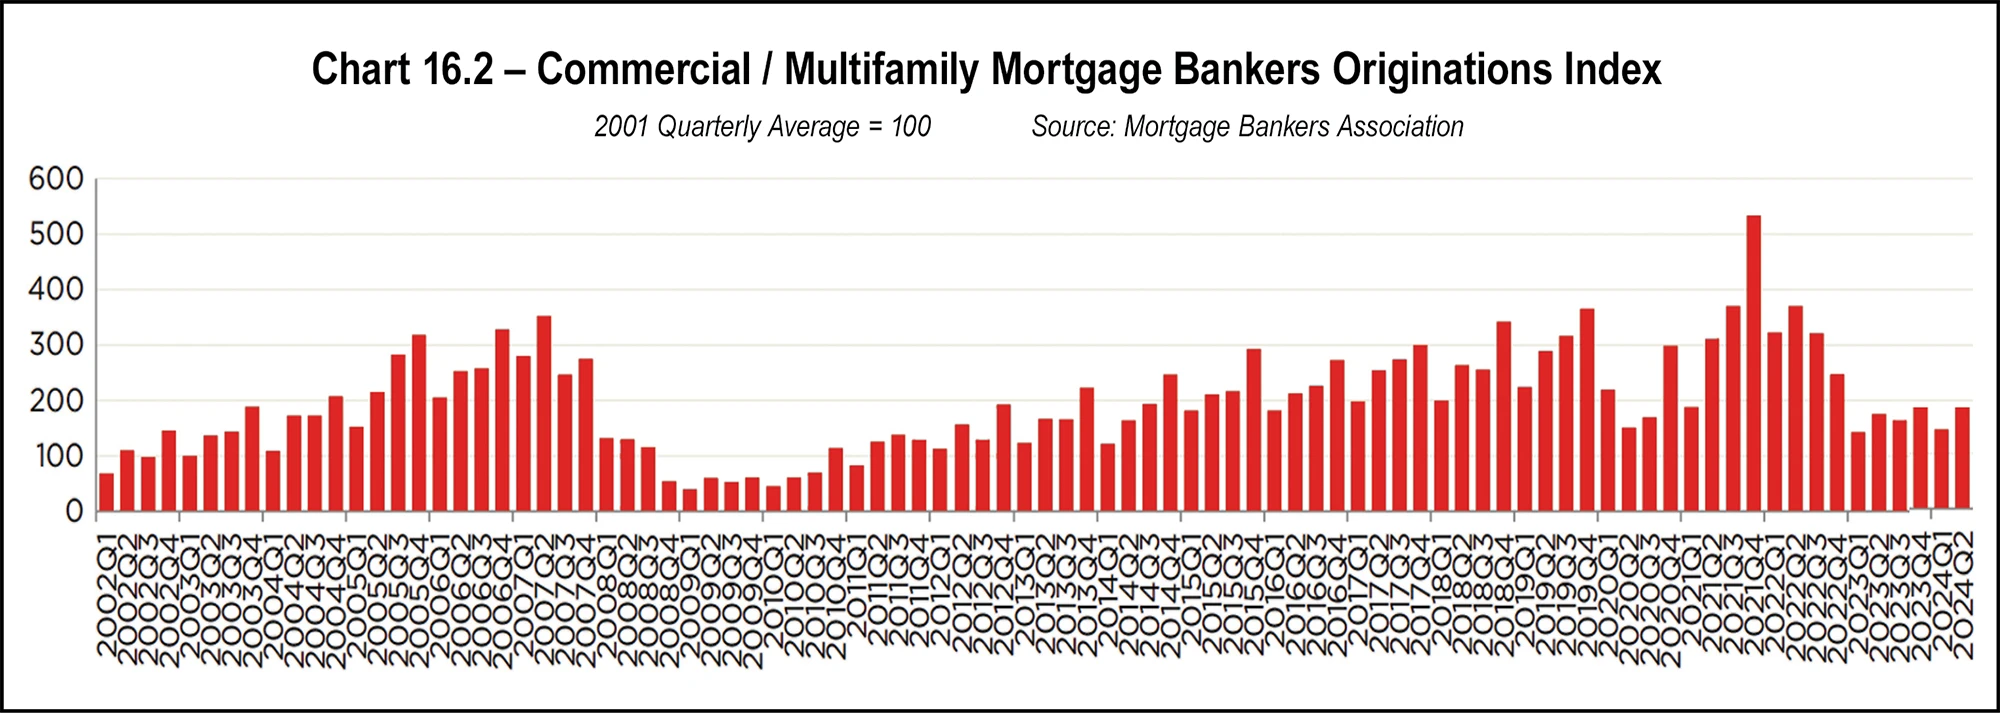
Total U.S. Commercial Mortgage-Backed Securities (CMBS) issuance came back strong after the 2008 recession. However, the pandemic led to 2020 year-end U.S. CMBS issuance of just $56 billion. 2021 CMBS issuance rose to $109.8 billion, a 14-year high. After a moderate drop off in in 2022 as rates began to rise, 2023 saw the lowest total issuance reported in many years at just $39.3 billion. The good news is that through just two quarters in 2024, total issuance already exceeds all of 2023 at $43.7 billion. In fact, U.S. CMBS issuance closed the year strong, much more on par with the banner year in 2021.
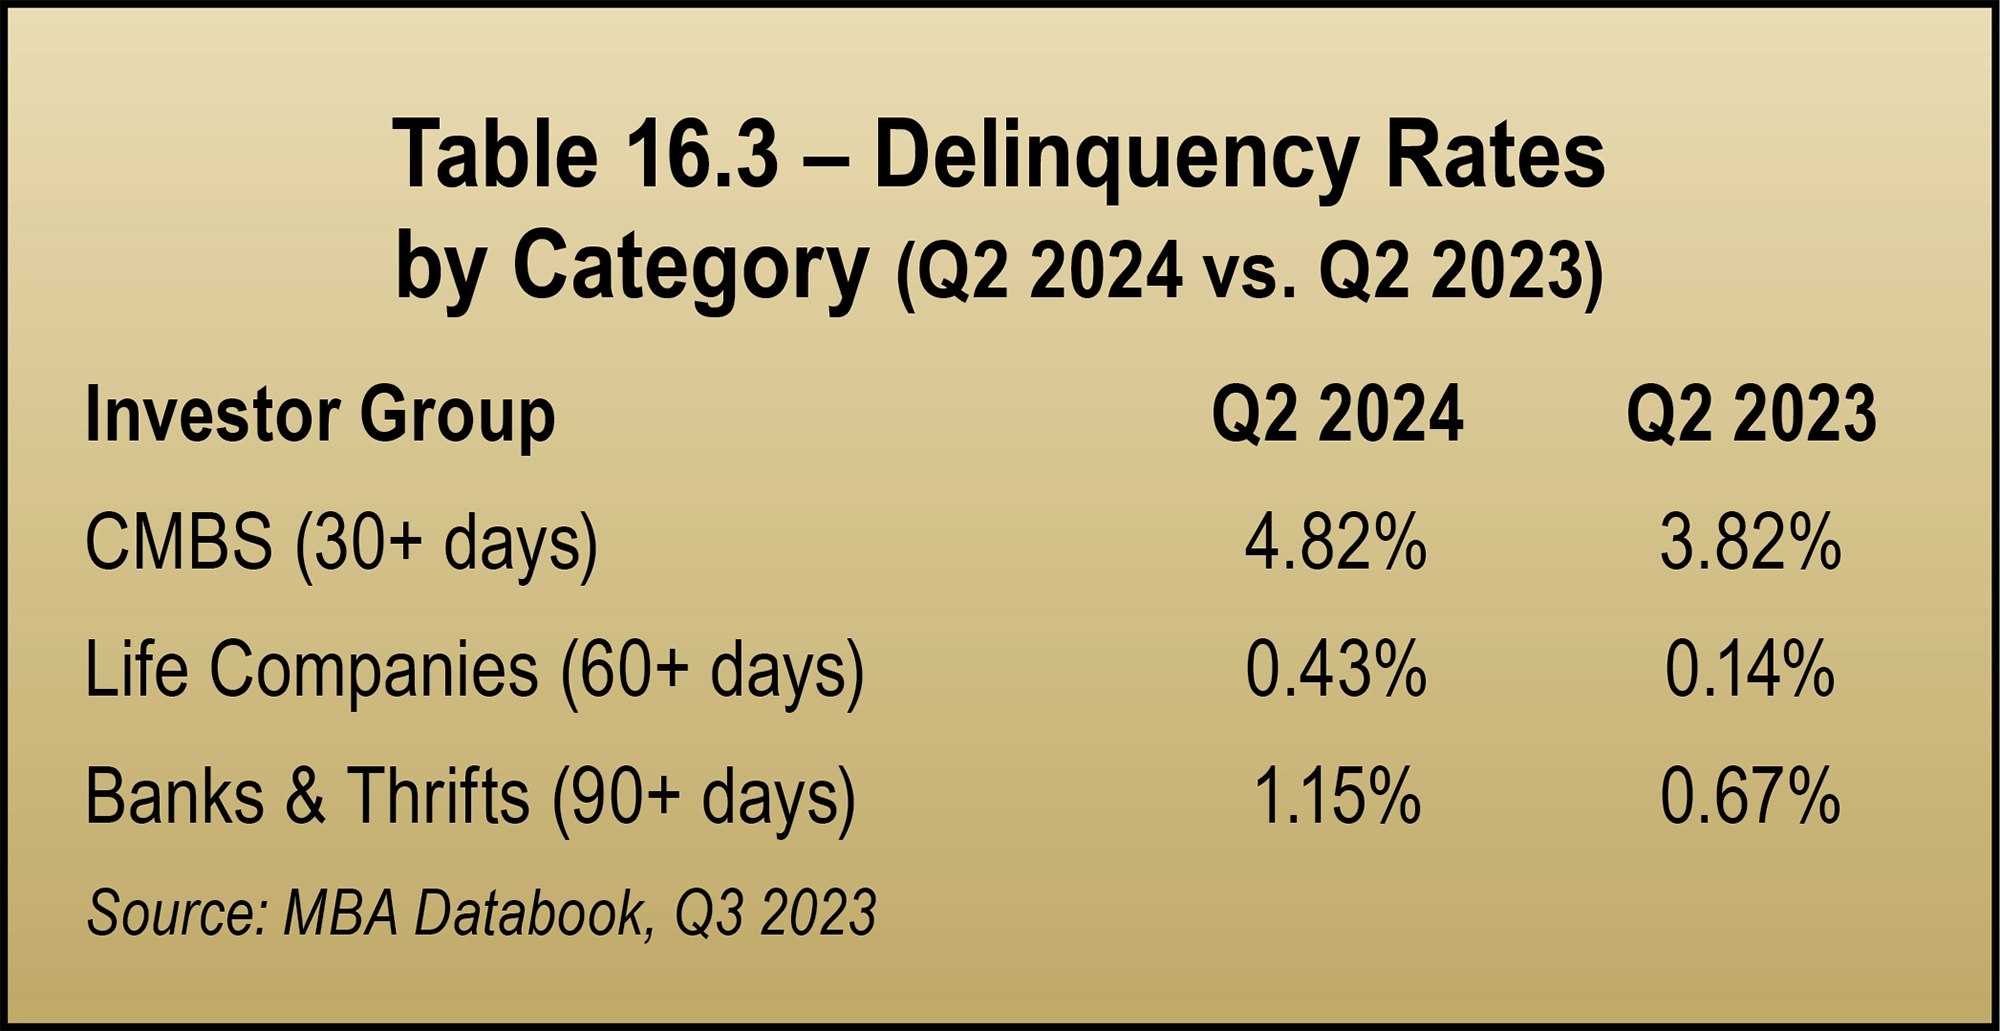
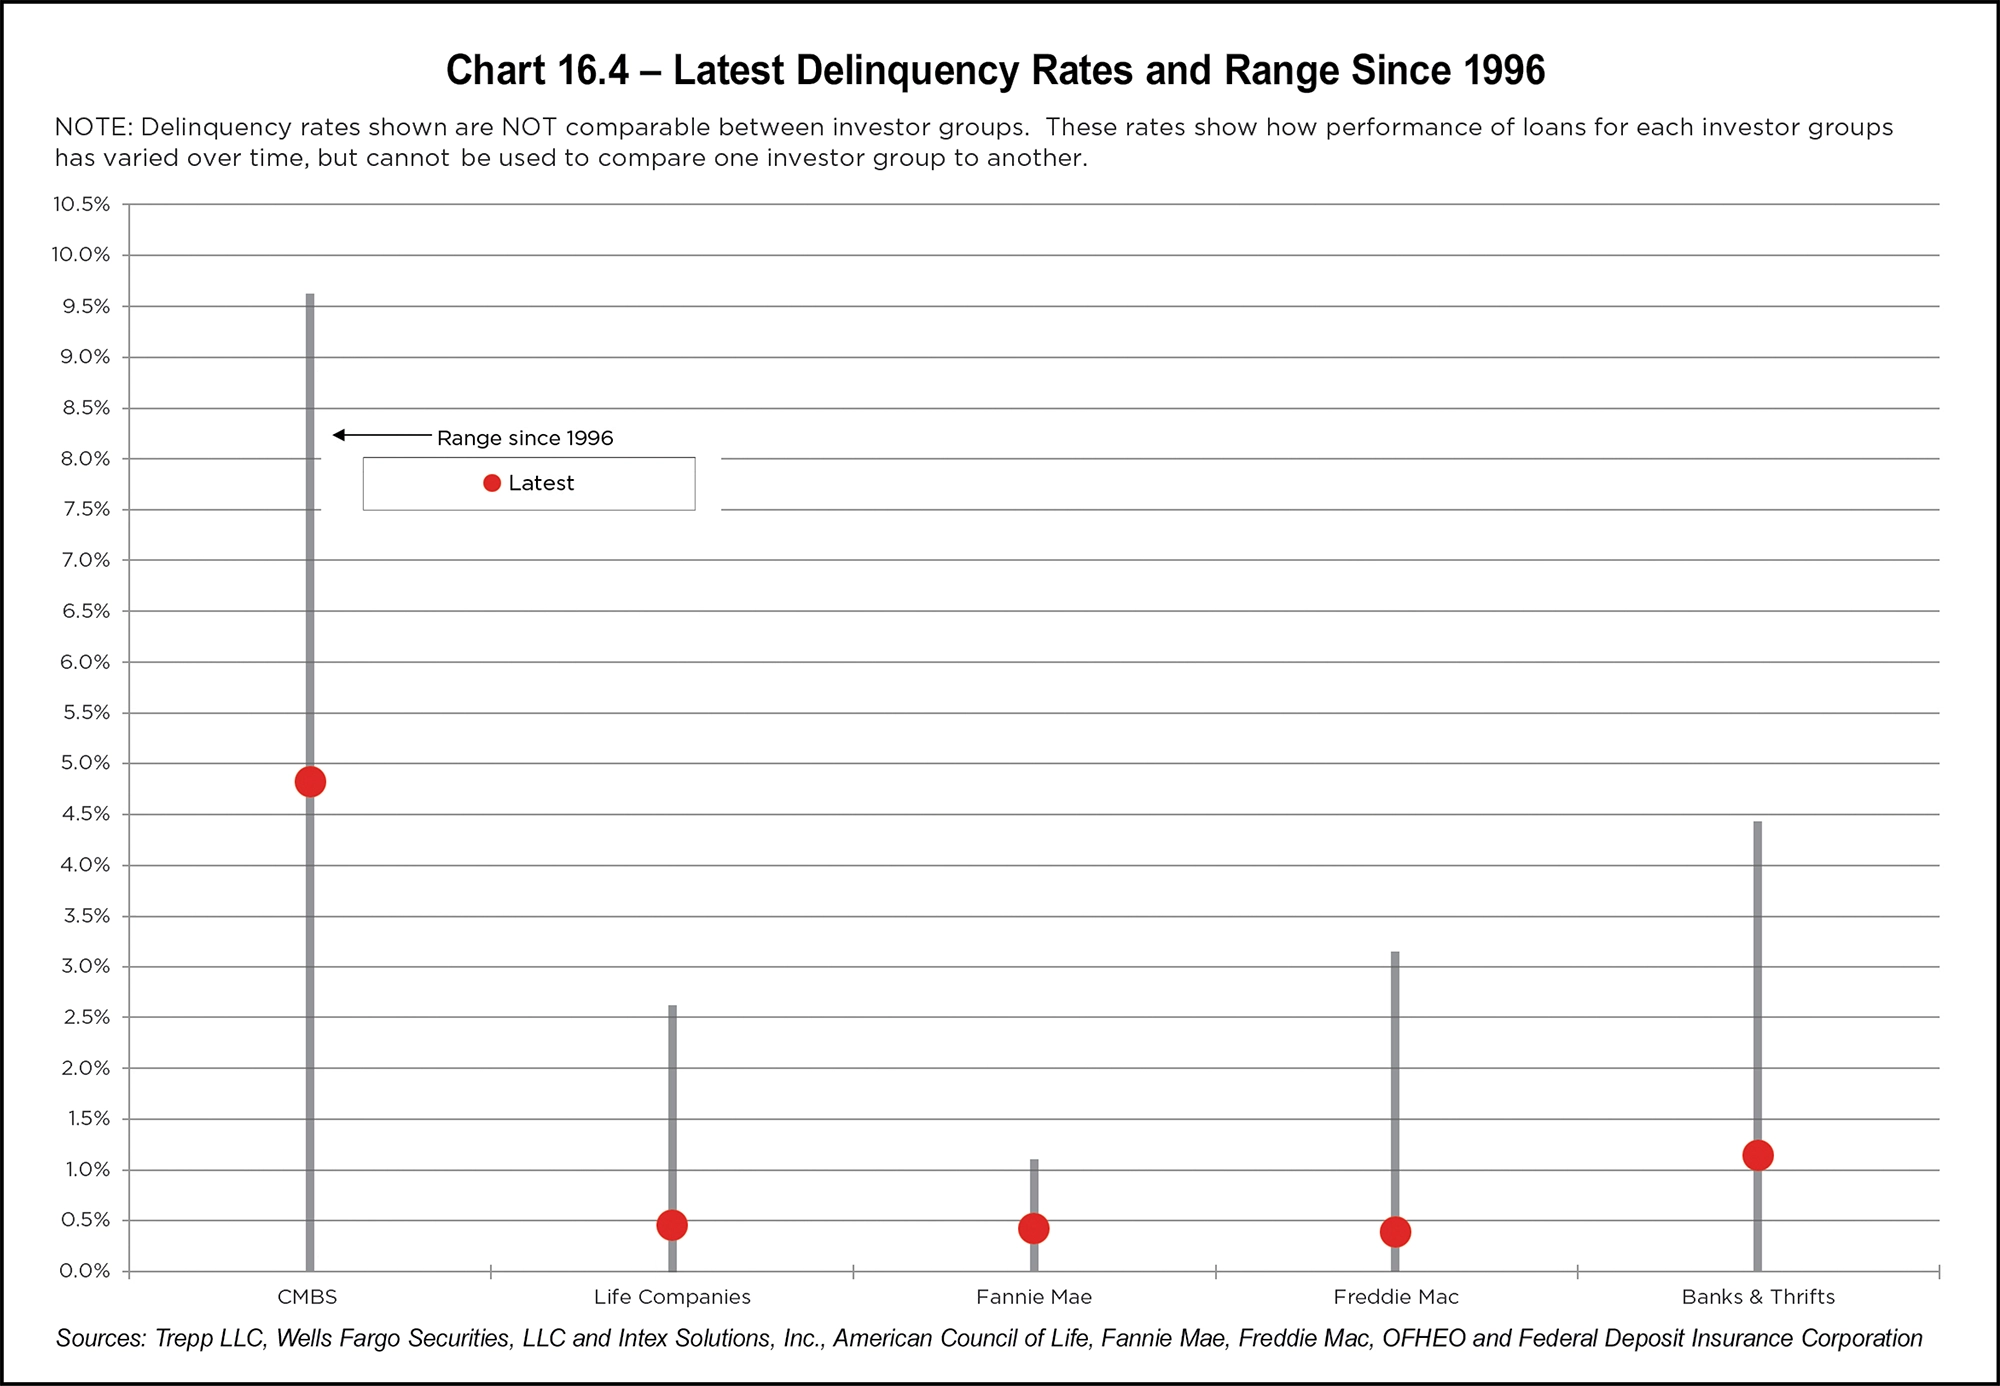
Self-storage reports favorable delinquency trends among its peers, outperforming all other property types. Per data historically available from the rating agency DBRS Morningstar, the delinquency rate for self-storage in the CMBS market peaked at 3.99 percent in 2011. This figure is still reported well below 1 percent, underscoring the strength of the sector. While no commercial real estate sector is fully recession-proof, industry experts have long speculated that self-storage is as close as it gets. See Chart 16.4 below.
Given the current climate, it is critical to conduct a thorough review of quantitative and qualitative elements of any development in order to be successful, particularly from a financing standpoint.
With this in mind, banks are the most viable capital source for most developers. Small Business Administration (SBA) programs also provide construction financing, and some debt funds will selectively finance construction projects.
Conventional construction lenders were historically advancing up to 75 percent loan-to-cost (LTC). However, lenders have grown more risk averse in recent years. In fact, even if a lender had an appetite to lend at 75 percent, the deal often would not pencil at that leverage with current interest rates. Construction lenders can selectively offer fixed-rate options, floating rate priced over Treasuries, SOFR, or Prime is most common. As of the time of this writing, interest rates in development financing range from around 7 percent to well over Prime, depending on the project.
There is a strong preference in construction lending for full recourse with a completion guarantee, but non-recourse may be available at low leverage for well-heeled sponsors. After Certificate of Occupancy, a reduction to partial recourse (or non-recourse) is negotiable at the lender’s discretion.
It is important to arrange an upfront interest-only period until the property can cover amortizing debt service payments. This is coupled with an interest carry reserve until the property breaks even. One of the more costly errors in development financing is miscalculating the required lease-up time, a mistake which can, in a worst-case scenario, sink a development.
Lenders build debt service coverage tests into loan agreements and will stress test a project to see if it can cover interest-only payments after a predetermined number of months following completion. Eventually, lenders will test for principal and interest coverage. In addition to testing for project viability, this doubles as a lender safeguard.
The importance of thoughtful budgeting before beginning a project cannot be overstated. A feasibility study is essential. Borrowers should go above and beyond to understand the market, including market rents and the competitive landscape for both existing and prospective projects.
Bridge lenders came into focus following the 2008 recession and were competing for deals more than ever before. In fact, bridge lenders were so inundated with storage deals that they had the luxury of setting more restrictive loan minimums. While these minimums can prove challenging for borrowers with smaller transactions, they are not uniform and shouldn’t discourage borrowers from seeking bridge debt if necessary.
Bridge loans are often non-recourse in nature and can be originated to include a fixed or floating interest rate. They will commonly involve three-year terms with extension options exercisable for a predetermined fee if the loan is performing. Prepayment methodology varies but can be flexible and may include a stepdown or some minimum interest period. At the time of this writing, interest rate spreads range from roughly 300 to 600 bps above an index such as SOFR. The fee structure is sometimes referred to as “one in, one out,” because these lenders commonly charge an origination and exit fee of 1 percent of the loan amount.
Properties that require a bridge loan may not even cover interest-only debt service payments at origination, let alone amortizing payments. Consequently, bridge loans are structured with interest shortfall reserves to cover the gap. In some cases, these loans feature future funding components. Lenders may require cross-collateralization with another asset to provide additional credit enhancement for the lender. A bridge loan is not an appropriate long-term debt solution; however, it can be a flexible interim financing option. Even as interest rates ideally decline in 2025, there is no doubt bridge loans will remain an important source of capital for the storage industry.
Bank interest rates vary widely based on such factors as loan size, leverage, risk profile, and strength of the borrower’s existing relationship. Borrowers will find that banks can present extremely compelling quotes for transactions that fit inside their credit box. Bank loans are quoted over many indexes, including Treasuries, SOFR, Prime, and others. As such, banks are probably the product with the widest variation of interest rates in the market. Banks and credit unions can offer a rate lock at application for a set period of time to insulate interest rate risk over the closing period. Furthermore, banks can offer fixed or floating rate executions. At the time of this writing, rates range from mid-6 percent up beyond 9 percent.
Bank loans can have terms as short as two years or extend for 10 years or beyond. Amortization schedules tend to be on the conservative side at 20 or 25 years. Despite historically being able to offer as high as 80 percent leverage, today it is rare for a bank to comfortably exceed 75 percent leverage given DSCR constraints.
Banks will generally require personal recourse guarantees on almost all loans; however, the amount of recourse may be reduced or eliminated for low-leverage loans and for institutional sponsors where active relationships exist. Transaction costs for bank deals are generally reasonable, and prepayment structures are frequently negotiable.
Credit unions have been increasingly relevant capital sources for storage borrowers in the face of rising borrowing costs. Credit unions are akin to banks with several key differences. Banks tend to be extremely relationship driven, while credit unions may be more transactional in nature. Some credit unions exhibit a greater willingness to lend outside of a predefined footprint and are comfortable lending without a preexisting relationship. Credit unions rarely have deposit requirements and may be in a position to offer better interest rates than other lenders given their tax designations.
While credit unions have shined in the face of rising interest rates, this is not to imply they are better than banks. The particulars of a loan request will dictate which product is a better fit. Indeed, credit unions can be stricter on cash-out requests and are more likely to quote a tighter amortization period. Holding interest rates constant, shorter amortization schedules result in higher debt payments. Finally, credit unions are not typically equipped to handle construction or other transitional deals that require draws and the carrying of interest.
SBA rates are broadly priced over the Wall Street Journal Prime Rate. During the pandemic in 2020, when Prime was approximately 3 percent, SBA loans were particularly attractive compared to other products. However, Prime increased to a peak of 8.5 percent in July 2023, which was less compelling for new loans and also created challenges for existing loans that were floating rate in nature. It wasn’t until late 2024 that the Fed began reducing benchmark rates. Currently, SBA loan rates range from 0 percent to 3 percent over Prime, which could benefit borrowers if rates continue to decline in 2025.
The SBA 504 program consists of two loans: a bank-funded first mortgage covering 50 percent of the project and a CDC loan funding up to an additional 40 percent. The bank provides interim financing for the second loan, which is replaced by a 20- or 25-year, fully amortized fixed-rate SBA note after closing. Currently, the 25-year debenture rate is 6.1 percent. The resulting all-in 504 interest rate is the weighted average of the bank and SBA debenture rates. This product includes a step-down prepayment penalty, which can make early repayment costly compared to the 7(a) loan. Overall, the SBA 504 program is a viable financing option for both new and experienced borrowers.
SBA loans have key differences worth noting. The 504 program includes two loans (unlike the single-loan structure of 7[a]) and requires a mini-closing at the SBA funding stage. Since only part of a 504 loan is government sponsored, borrowers can often secure higher amounts than with a 7(a) loan. However, 504 loans typically have longer closing timelines and are limited to real estate uses. Conversely, 7(a) loans offer greater flexibility, including funding for working capital or interest shortfalls. Notably, 504 loans can be paired with a “sidecar” 7(a) loan to achieve similar outcomes. Prepayment penalties are generally more favorable with 7(a) loans. Lastly, while 7(a) loans are usually floating rate (with fixed-rate options selectively available), 504 loans always include a fixed-rate debenture, helping mitigate interest rate risk.
Both programs can come with heavy transaction costs compared to other loans, including guarantee fees and additional collateral requirements. SBA loans are also document intensive and time consuming to close. A shift in SBA operating procedures was recently implemented that opens a previously closed door for borrowers planning to engage larger third-party management companies, such as a REIT. SBA loans are a great option, specifically for first-time borrowers who are capital constrained, to finance storage in 2025.
Interest rates for CMBS transactions, like most loan products, are computed by adding a risk spread premium to a benchmark index such as a U.S. Treasury rate. For example, if spreads were 2.5 percent and the 10-year treasury rate sat at 4.2 percent, the corresponding rate on 10-year CMBS money would be 6.7 percent. CMBS interest rates are currently priced at roughly 200 to 300 bps over the applicable Treasury at the time of this writing. There is an option to buy down rate for a fee (1 percent buys down the interest rate by roughly 15 bps in a 10-year deal, while the same 1 percent buys down rate roughly 25 bps for a five-year product).
The bulk of CMBS loans originated traditionally were 10-year fixed-rate products with a 30-year amortization schedule after any interest-only period. There has been a proliferation of five-year CMBS deals in direct response to market demand, which creates a strategic advantage for borrowers who prefer a shorter term. This, in conjunction with six-month open prepayment at the end of the term, increases flexibility and will likely continue to be a popular option. Borrowers can take advantage of several structural advantages in CMBS such as non-recourse, multiple years of interest only, or to facilitate a cash out.
Historically, borrowers could achieve 75 percent leverage; however, higher interest rates have put downward pressure on leverage as deals become DSCR constrained. The CMBS product type can close quicker than many of its counterparts. All the above traits are distinguished advantages of the loan type, but the CMBS product is not without its drawbacks.
Restrictive prepayment options like yield maintenance or defeasance can pose challenges for borrowers. Defeasance involves replacing collateral for debt service payments, often with a portfolio of multi-denomination securities. Though time consuming and costly, hiring a defeasance firm can simplify the process. Both defeasance and yield maintenance penalties are less severe in a rising interest rate environment. In fact, the current interest rate environment has made a compelling case for those looking to refinance a CMBS loan as the rates of the day are often elevated compared to the rate attached to the loan being prepaid.
CMBS features higher closing costs and more rigid loan documents than other loan types. However, a few CMBS lenders offer competitive fixed closing cost programs between $25,000 and $32,000 all-in for loans up to $10 million as part of a small balance loan program.
Because CMBS loans are pooled together and sold as a securitized bond in the secondary market, the loan documents have many non-negotiable standard clauses and requirements. Additionally, the loans are most often serviced by a third-party, rendering any post-closing structural changes more challenging.
CMBS lenders prefer primary market deals but will compete for loans in secondary markets as well. Location is one of several qualitative factors that can impact base pricing. The non-recourse nature of these loans, in addition to the ability to secure extended interest-only periods and cash-outs make these loan products appealing for borrowers. As interest rates ideally continue to fall over the coming months, the CMBS market has been and will continue to be an extremely active loan option for self-storage borrowers.
Given their conservative nature, Life Companies put an emphasis on stressing cash flow and cap rates, in addition to mandating higher going in DSCRs. It is no surprise these loans are frequently constrained at lower leverage than their counterparts. Many Life Companies have historically preferred larger loans ($10 million and up) but will stretch down for the right deal to compete with other loan products.
Life Companies offer terms ranging from three years all the way up to 30-year, fully amortizing structures. These products are cost-effective to close, and borrowers can often negotiate flexible prepayment terms. Lenders may also provide forward rate lock agreements with a signed application. With a focus on conservative underwriting and low leverage, Life Companies currently offer some of the lowest interest rates in the market, starting in the low 5 percent range. Notably, nearly all structural features are open to negotiation.
While Life Company loans can be a great source of capital if the deal checks the credit criteria boxes, it is worth reiterating that these lenders only extend terms to the best properties owned by highly experienced and well-capitalized sponsors. That said, because of the tremendous track record of self-storage against other property types, insurance lenders continue to exhibit an appetite for self-storage in 2025.
Many developments funded in the past five years relied on projections that have not materialized as anticipated. Rising interest rates, construction delays, increased development costs, and downward pressure on rental rates have left some borrowers struggling to meet loan payments or debt covenants. These challenges have sometimes left projects requiring creative solutions. This is all in addition to the situation outlined in the previous capital stack example regarding stressed debt on stabilized assets. Softening fundamentals have even led to a decline in operating income for some stabilized assets, making it more difficult to cover debt service.
In today’s volatile market, understanding financing options for distressed assets is critical. Fortunately, true distress in the storage industry remains rare. If distress becomes more common, various solutions are available. Bridge loans, for instance, can provide additional time for assets to stabilize. For more severely distressed properties, consulting brokers or other professionals may uncover viable strategies.
Subordinate debt is a blanket term for additional financing with a lower priority to cash flow than the first lien mortgage. This type of debt can provide more capital and higher leverage to help bridge an equity gap. Subordinate debt lenders in the current market will take a capital position between the first mortgage cut off, reaching up to 85 percent LTV or sometimes even higher.
By reaching higher in the capital stack, subordinate lenders inherently assume greater risk and therefore expect a higher rate of return. Interest rates on subordinate debt available in the market today range from 10 percent to 20 percent. Subordinate debt lenders can be flexible and willing to structure payments to match the cash flow projections of the asset. For example, the debt might feature interest-only payments for several years or in some cases for the full term.
The two most common subordinate debt products are junior mortgages (B-Notes) and mezzanine financing. Mezzanine lenders provide subordinate debt that is secured against an ownership position in the borrowing entity, rather than the mortgaged property itself. Conversely, B-Notes take a secondary debt position secured by the mortgaged property as collateral for the loan.
There are situations where cash flow erosion is so severe that it no longer supports the debt service payments. In extreme cases, the corresponding value decline may be so significant that the sponsor’s equity is completely eroded. In these situations, the sponsor may be required to infuse fresh equity into the transaction. If the sponsor does not have the equity, one option is to seek joint venture equity. Joint venture equity is selectively available to owners in transactions where there is upside, stemming from a development or recapitalization scenario and resulting in enhanced cash flow and consequent value.
An experienced broker knows how to effectively package a loan request and strategically present the asset to the lending community. When lenders are reviewing multiple potential deals, they are far more likely to engage with a well-organized presentation than a disjointed assortment of documents. Mortgage brokers are constantly in the market assessing lender appetite and implementing feedback from those lenders to fine tune the deliverable and secure the best lending options available.
Mortgage brokers will charge for their services, but borrowers reap the benefits of a more seamless loan process. Beyond assisting with the packaging and loan closing process, engaging a qualified broker allows borrowers to focus on maximizing their resources in other areas. By freeing up time otherwise spent shopping and closing a loan on their own, these borrowers can focus on other value-add strategies, such as acquiring new facilities or expanding existing assets.
There remains room for improvement in both the underlying interest rate indices and credit spreads to bring on more favorable financing this year. Even if interest rates remain relatively constant in 2025, they are favorable by historic comparison. Self-storage has reacted positively to economic volatility in the past and performs very well in the face of adversity. It seems more likely with each passing day that 2025 may mark an inflection point where cautious optimism yields to much better times.