

Section 5 | Customer Traits
woman pointing with pen to holographic network of people in front of her
T

o cultivate a profitable self-storage business, you first need to know your customers. Knowing your customer base enables you to customize your marketing, offer the features and amenities your prospects need and/or want, and increase your success within your market.

This section takes a national look at the traits of self-storage customers, with much of the referenced data sourced from the Self Storage Association’s (SSA) 2025 Self Storage Demand Study. These national trends will shed light on customers in your market, but employing local sources to obtain more granular data is necessary for the best results. For instance, realtors tend to have valuable information about an area’s number of households, household income, poverty, and other helpful statistics.

Tenant Mix
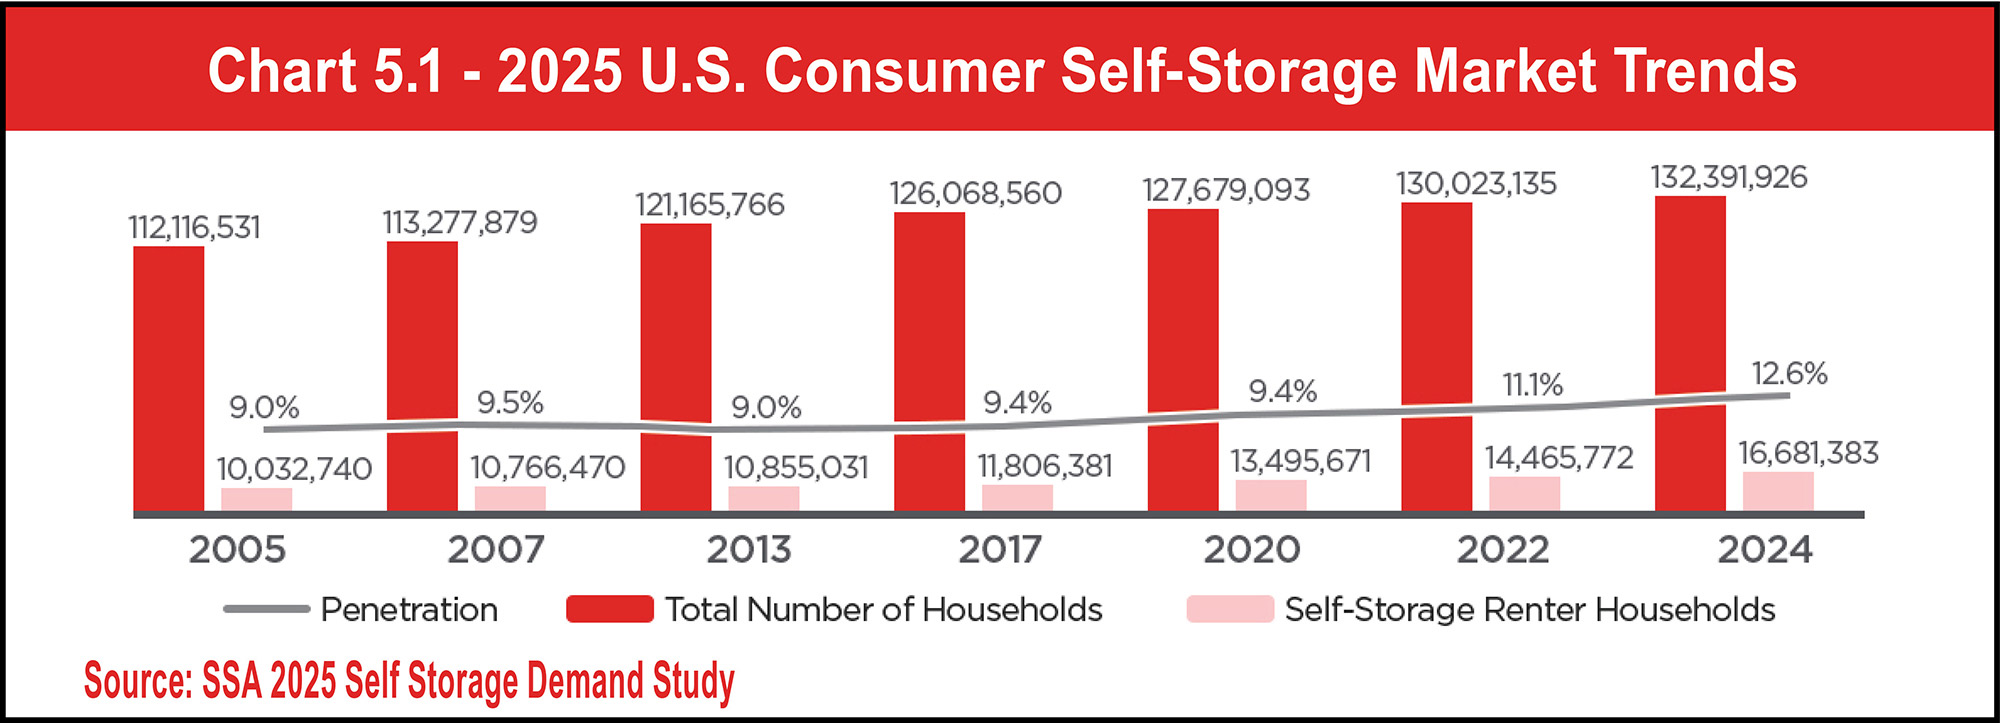
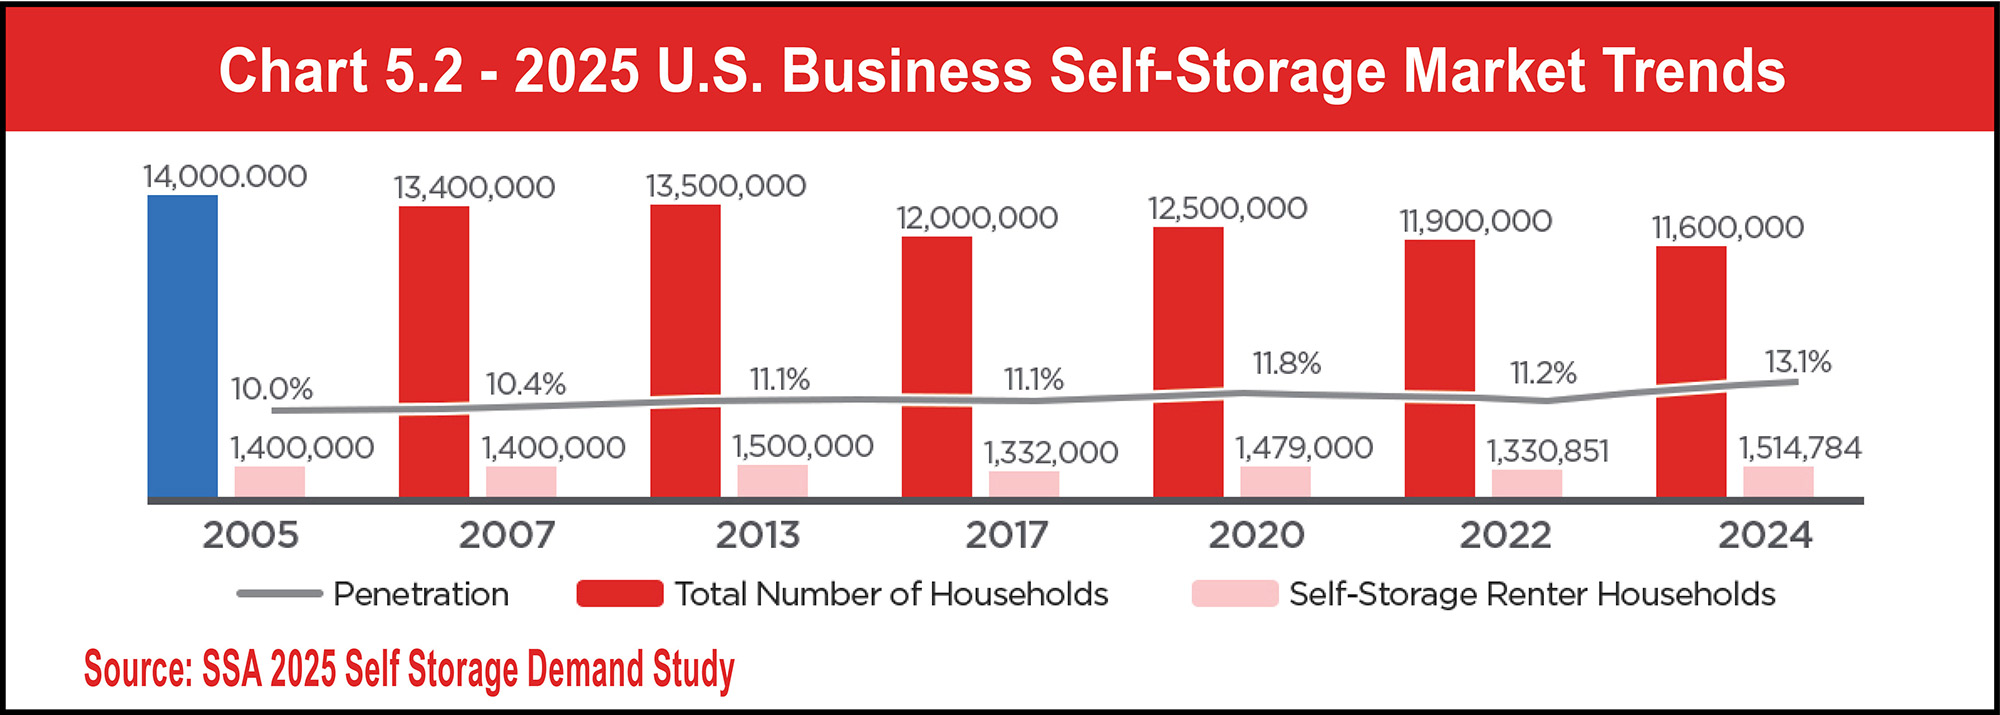
As seen in Charts 5.1 and 5.2, overall usage of self-storage continues to climb, albeit gradually, with consumer usage increasing by 1.5 percent and business usage increasing by 1.9 percent from 2022 to 2024.

See Charts 5.1 and 5.2.

Chart 5.1 - 2025 U.S. Consumer Self-Storage Market Trends
Chart 5.2 - 2025 U.S. Business Self-Storage Market Trends
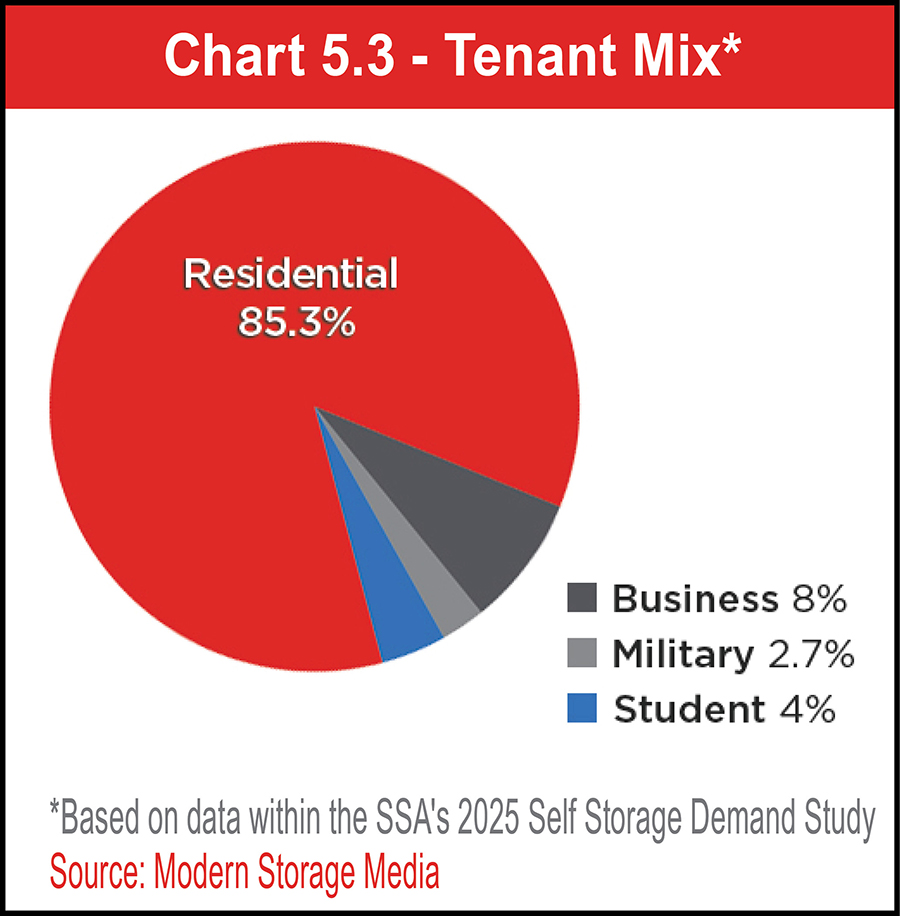
Although self-storage customers still come from the same four groups (residential, business, military, and student), the percentages have shifted over the last two years. Based on data from the SSA’s 2025 Self Storage Demand Study, the percentage of residential customers has increased from 80.2 percent (as reported in the 2025 Self-Storage Almanac) to 85.3 percent. Conversely, the segment of business customers has shrunk slightly more than 5 percent, from 13.2 percent to 8 percent. And while the number of student tenants grew by 1 percent, there were nearly 1 percent fewer military tenants in 2025 than 2023 (down to 2.7 percent from 3.6 percent).

See Chart 5.3.

Chart 5.3 - Tenant Mix
The percentages presented in Chart 5.3 represent a national average, as tenant mix varies by facility. Self-storage properties near military bases or universities are more likely to have higher percentages of military or student renters. Moreover, a strong small business community within your market area could boost the number of commercial tenants, which would be beneficial to your bottom line as commercial tenants usually pay on time through an automatic payment program. They also tend to rent units longer than residential tenants, thus increasing the lifetime value of the customer. Additionally, because their monthly rent is typically charged to a business credit card via autopay, commercial tenants are much less likely to go into foreclosure.

To attract commercial customers, many self-storage operators focus on forming strategic, business-to-business alliances with professionals and businesses most likely to need storage or refer customers, such as realtors who need storage for items used to stage houses for sale, businesses requiring file/record storage, small businesses needing to store inventory, drug reps needing to securely store drug samples in a climate-controlled setting, service providers needing to store equipment and supplies, and package delivery services in need of last-mile storage. Your local chamber of commerce is a great source for information about businesses in your market area.

Where Renters Live
Nearly half (49 percent) of consumer renters reside in the suburbs, as shown in Chart 5.4, which is a 1 percent increase from the 2023 Self Storage Demand Study but still lower than the 51.2 reported in 2019. The number of urban renters held relatively steady since 2023, increasing only 0.3 percent to 35 percent in 2025. Rural renters, on the other hand, decreased from 17.3 to 15 percent.

See Chart 5.4.

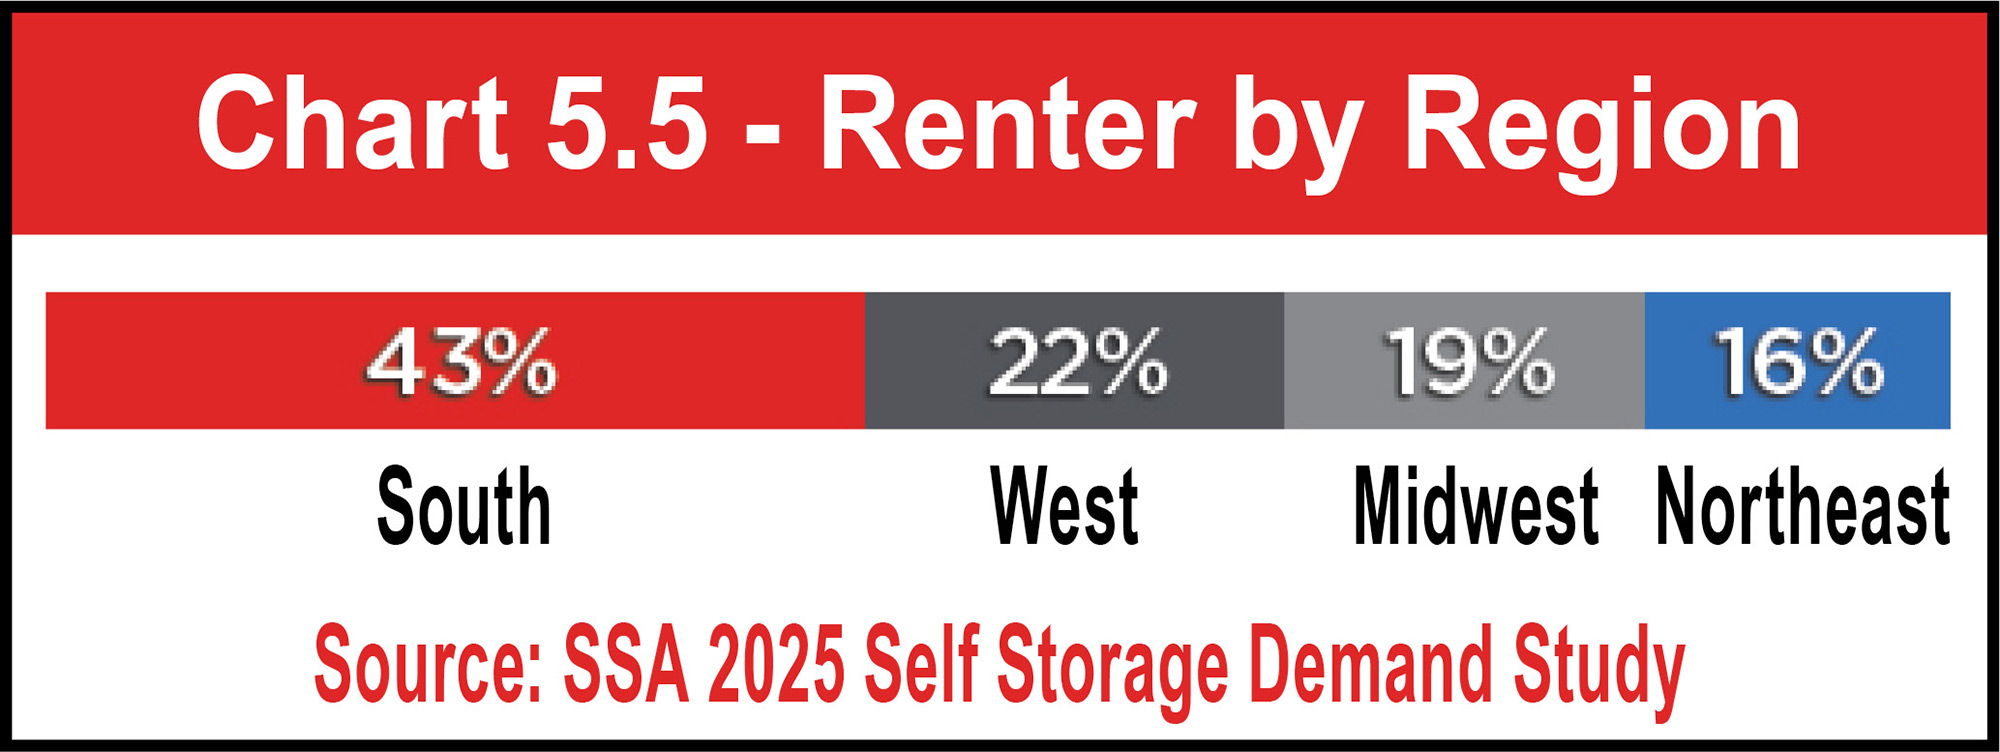
Chart 5.5 shows that there are nearly twice as many renters in the South than other regions in the United States. Forty-three percent of all households in the South use self-storage, whereas only 22 percent rent in the West, 19 percent rent in the Midwest, and 16 percent rent in the Northeast.

See Chart 5.5.
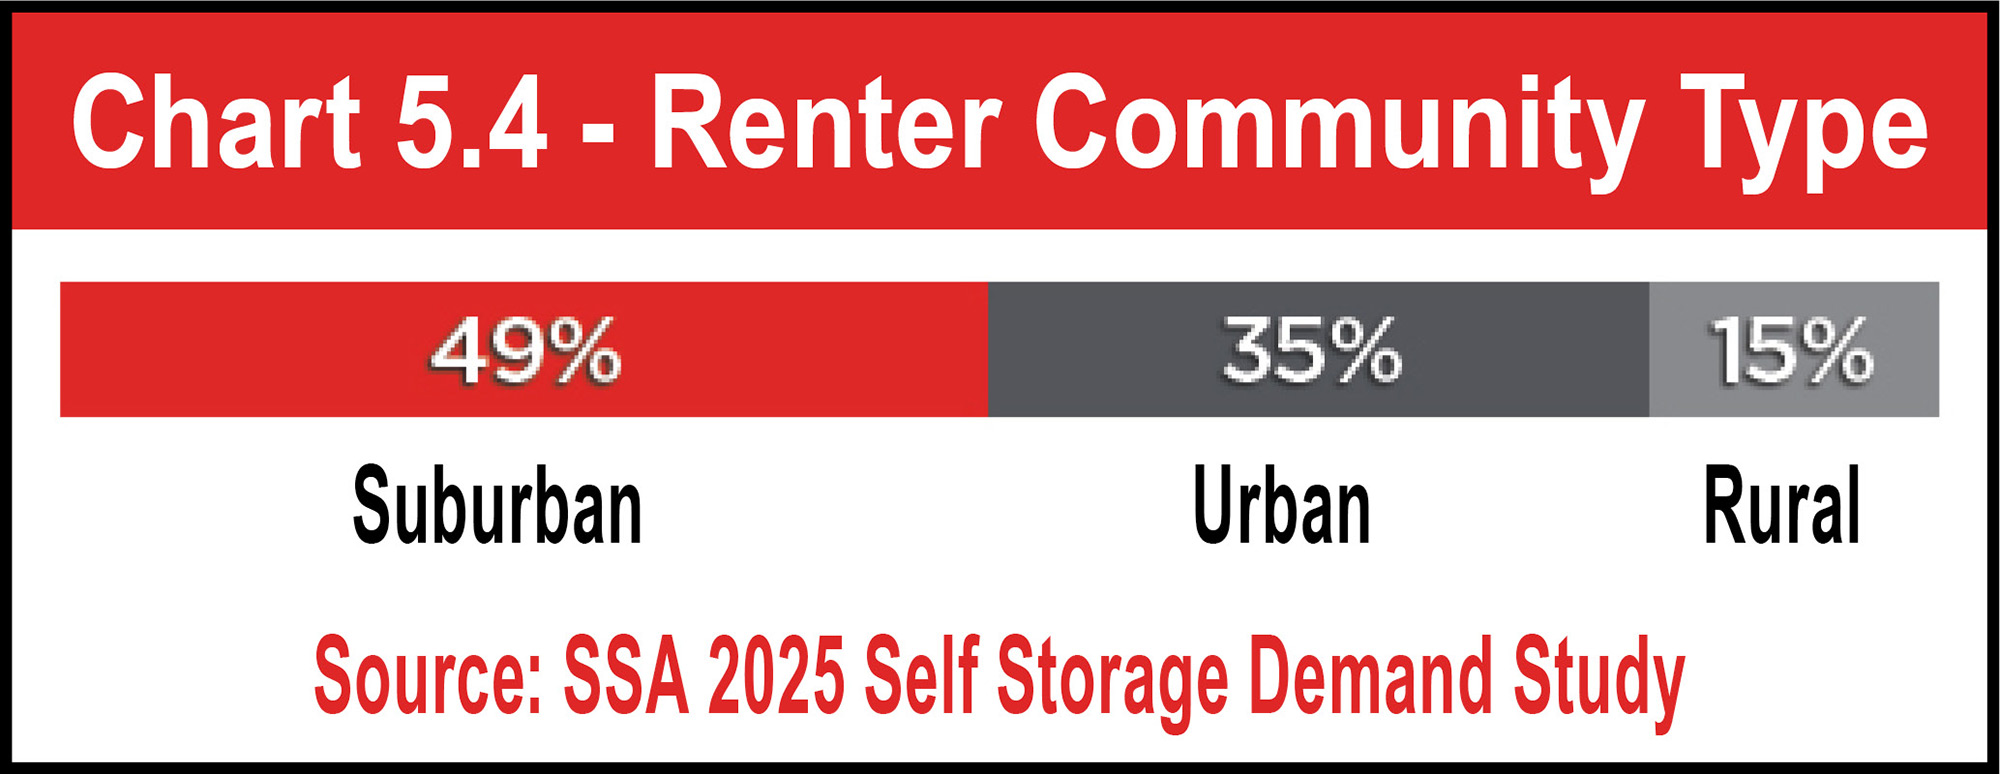
Chart 5.4 - Renter Community Type
Chart 5.5 - Renter by Region
Gender And Generation
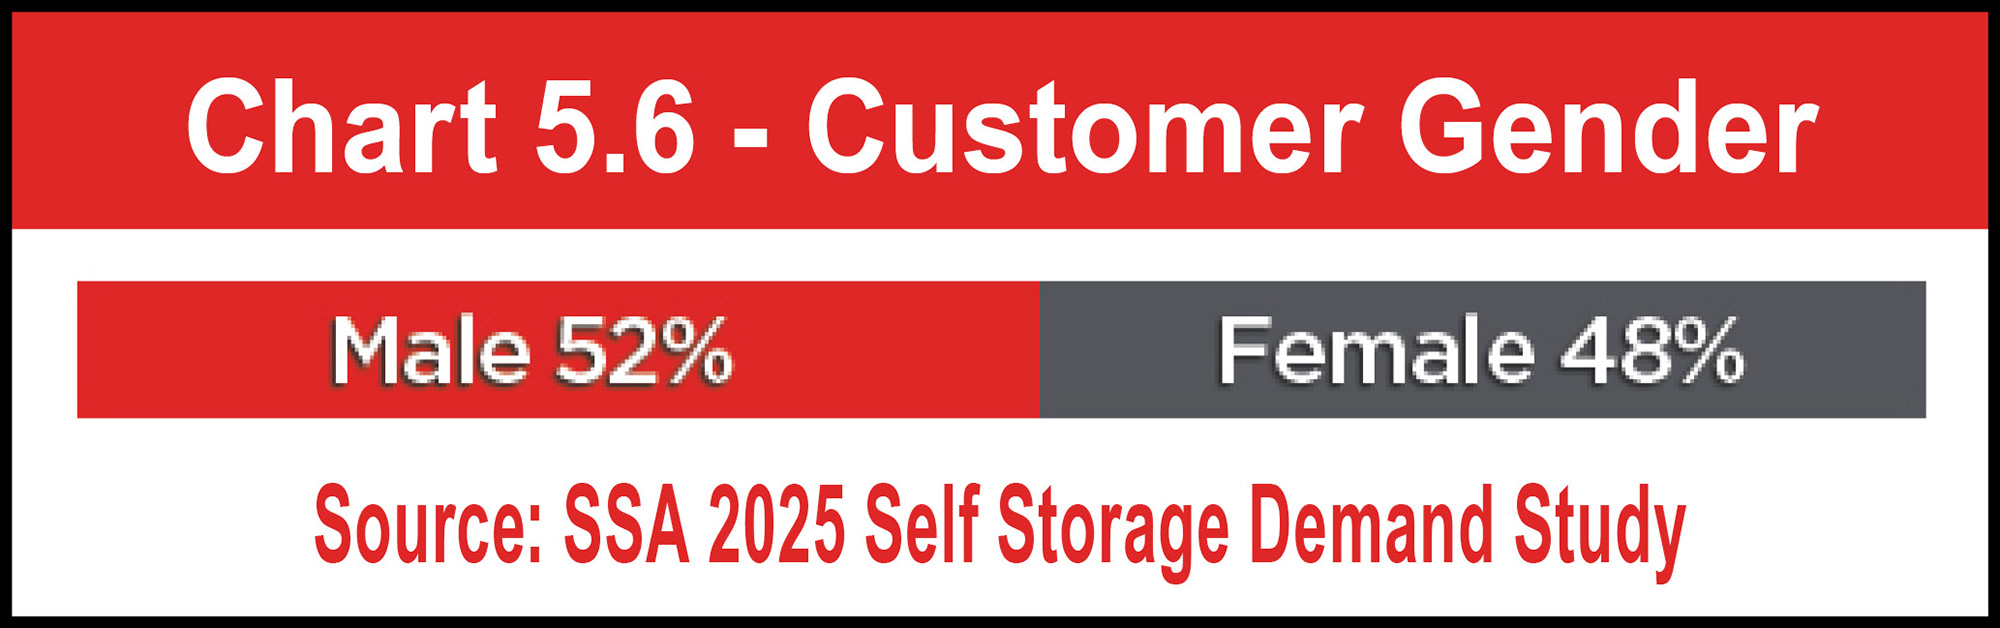
According to the 2025 Self Storage Demand Study, there are now more male renters (52 percent) than female renters (48 percent) in the U.S. by 4 percent. On a generational basis, however, there are more female renters within the Gen-X and boomer segments of the population. Alternatively, there are fewer female millennials renting storage than male millennials. Chart 5.7 shows that 57 percent of millennial renters are male, while only 43 percent are female—a 14 percent difference.

See Charts 5.6 and 5.7.

Chart 5.6 - Customer Gender
Chart 5.7 - Gender by Generation
Regardless of the gender ratio, it is highly likely that many self-storage facilities will continue to cater to female customers by creating bright, clean, and inviting environments that make them feel safe, especially when females are often thought to be the main decision-makers when it comes to deciding where to store the family’s belongings.

Looking at demographic data by generation brings other shifts to light. For starters, there are more younger renters than ever. At 57 percent, Gen-Z and millennials make up more than half of the consumer self-storage market. Simultaneously, the number of boomers and Gen-Xers renting self-storage units continues to shrink (16 percent and 26 percent, respectively), and the Greatest generation is on the brink of disappearing from the data by representing only 1 percent of renters.

See Chart 5.8.
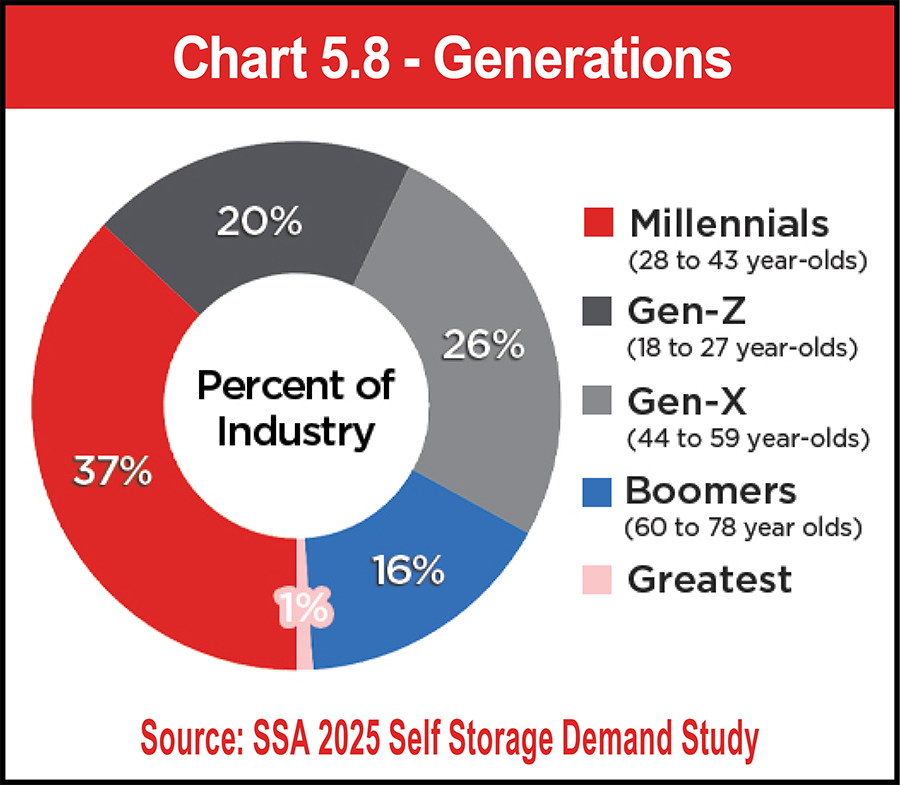
Chart 5.8 - Generations
As older renters move out and younger renters move in, it’s worth noting that the various generations utilize self-storage in different ways. At 18 to 27 years old, Gen-Z renters are more likely to be using storage temporarily, perhaps between college semesters or traveling; some may rent units due to a lack storage space at their cramped apartments, using self-storage as an extension of their home. With residences being built smaller each year, it’s no surprise that many planned communities have been incorporating self-storage facilities into their designs from the get-go.

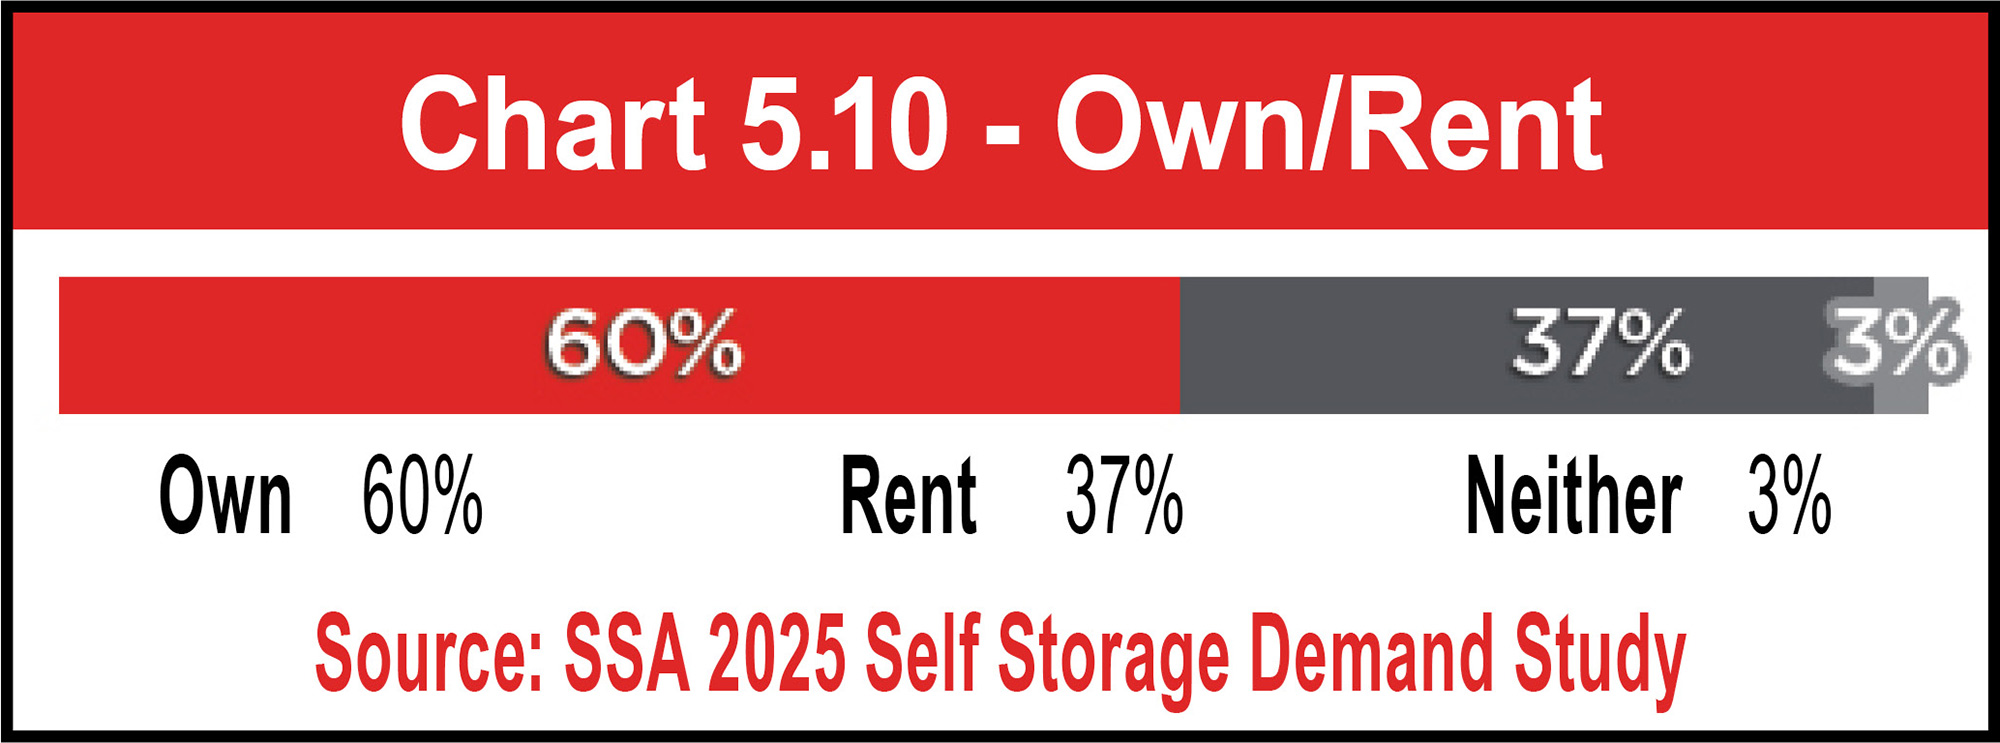
Along that line, nearly one-fourth of renters (24 percent) live in an apartment or condominium, whereas 72 percent reside within a single-family home. According to the 2025 Self Storage Demand Study, more than half of those single-family houses also provide at-home storage space via garages and attics. This proves that many Americans have more stuff than space, regardless of their residence type. But perhaps homeowners, who make up 60 percent of self-storage renters, are simply using their extra square footage for living instead of storing—a trend that peaked during the COVID-19 pandemic era.

See Charts 5.9 and 5.10.
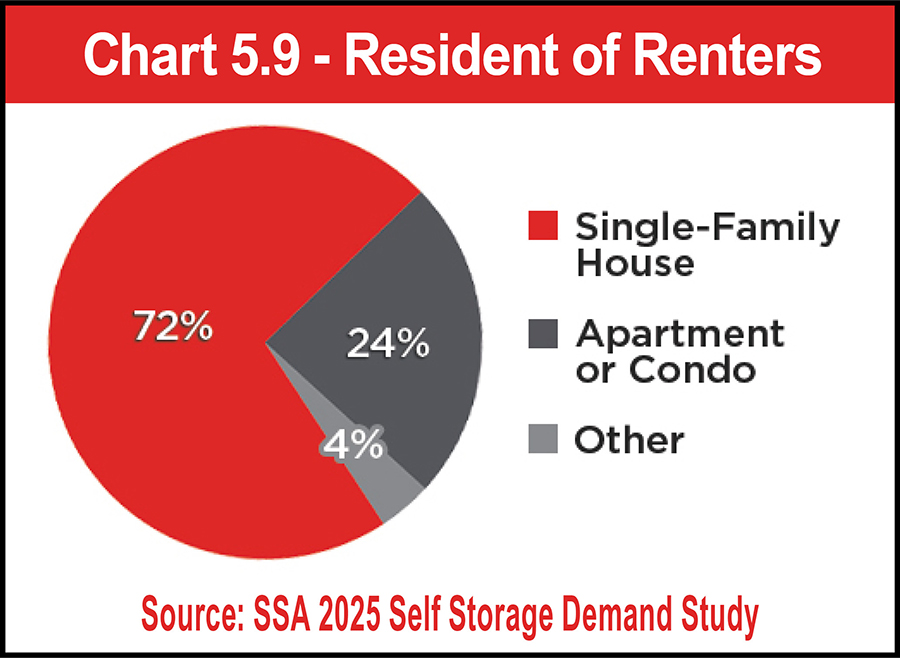
Chart 5.9 - Resident of Renters
Chart 5.10 - Own/Rent
Education, Employment, And Income
How educated are self-storage renters? Per Chart 5.11, a total of 50 percent of renters have a college degree or professional/post-graduate degree, whereas 18 percent haven’t pursued an education beyond high school. Only two percent of renters have not received a high school diploma or equivalent. Thirty percent have had some college or trade schooling.

See Chart 5.11.

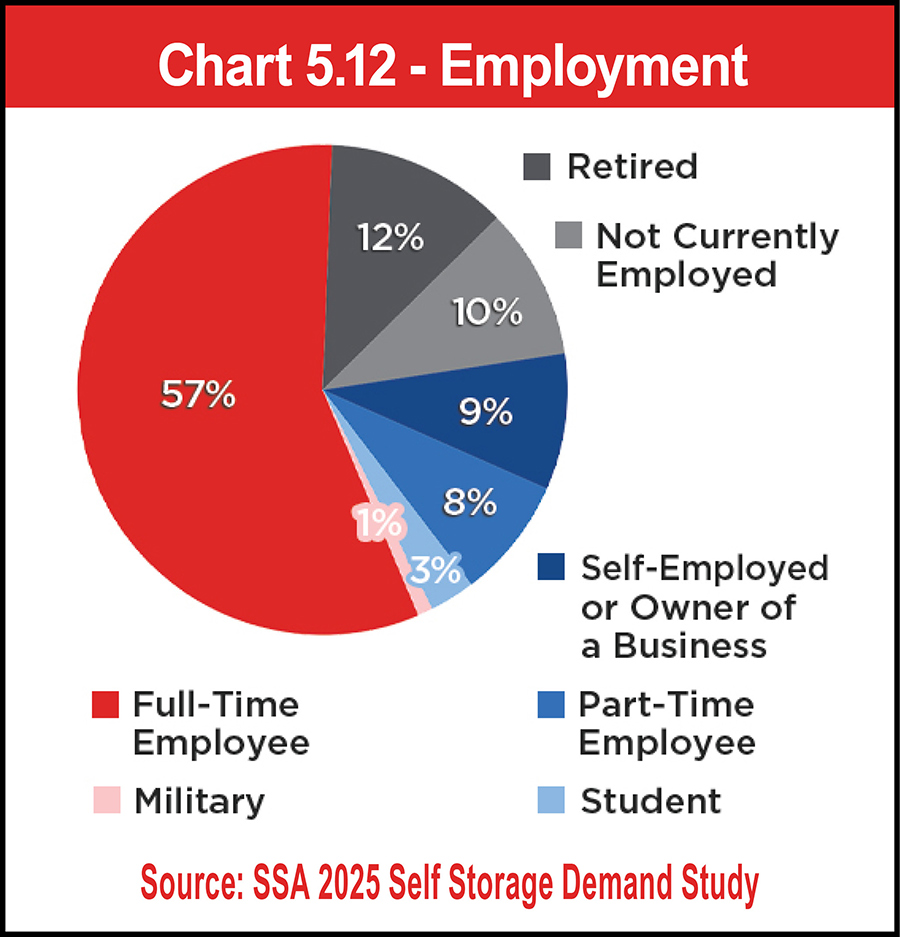
Obviously, education level can have an impact on employment and income. Of consumer renters, 57 percent are employed full time and 8 percent are employed part time. Although boomers and the Greatest generations make up 17 percent of renters, only 12 percent of renters are retired, which likely means that a portion of younger boomers are still active within the workforce. Nine percent of renters fall into the “self-employed and owner of a business” category. Another 10 percent of renters are currently unemployed.

See Chart 5.12.
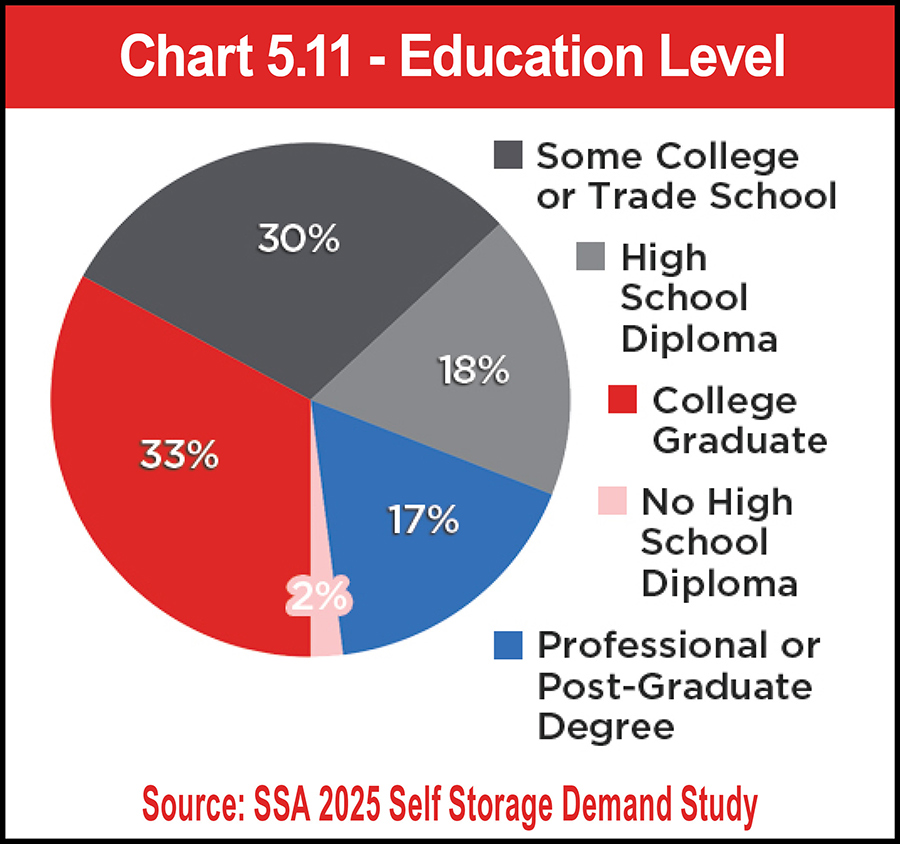
Chart 5.11 - Education Level
Chart 5.12 - Employment
Employment status has a direct impact on household income. According to the 2025 Self Storage Demand Study, the average household income of self-storage renters is $94,000. However, as shown in Chart 5.13, most (28 percent) renters’ household income is $125,000 or more. On the opposite side of the pay scale, 29 percent of renters make less than $50,000. A total of 30 percent of renters have a household income that falls between $50,000 and $100,000. Only 14 percent of renters have a household income of $100,000 to less than $125,000.

See Chart 5.13.

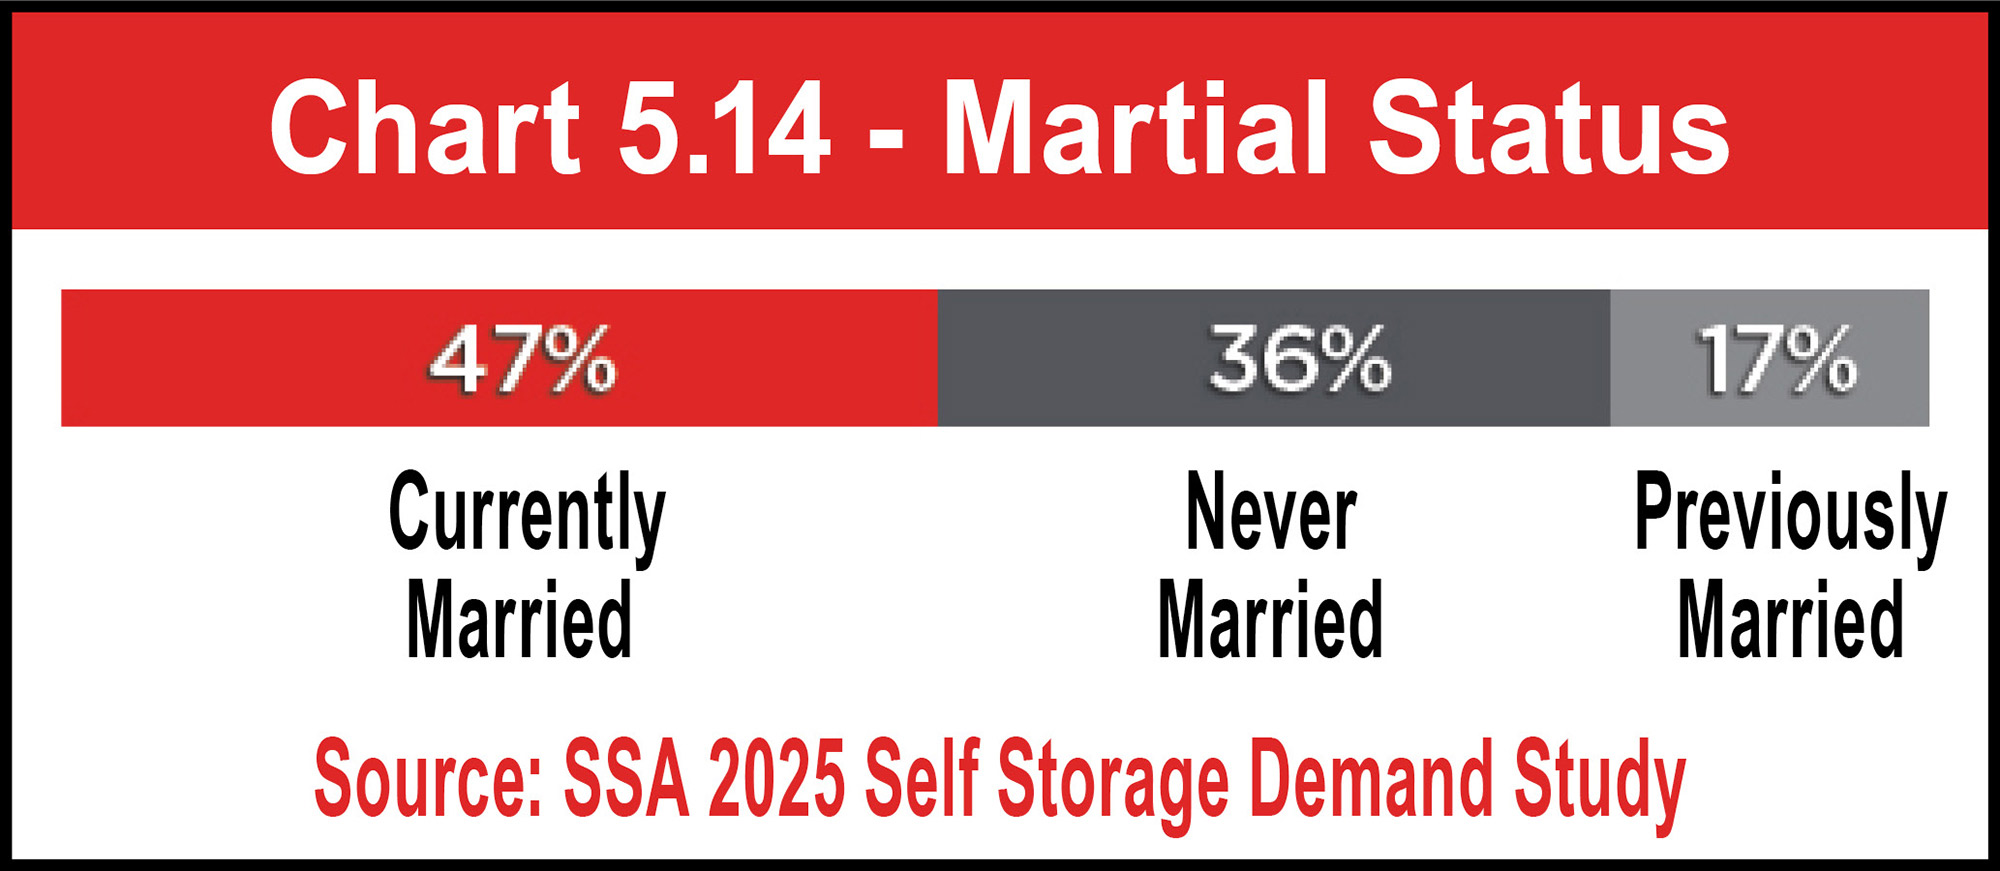
Of course, for married renters, household income would include their spouses’ wages. According to Chart 5.14, 47 percent of renters are currently married. While 17 percent were previously married, 36 percent have never been married. Fortunately for self-storage operators, all martial statuses can necessitate self-storage demand. Newlyweds may need to store belongings after consolidating two homes into one, whereas couples going through divorces may require storage as they sort through the home they once shared and make other living arrangements. Those never married may be impacted by the other “Ds” of demand: death, downsizing, distribution, dislocation (or disaster), and decluttering.

See Chart 5.14.
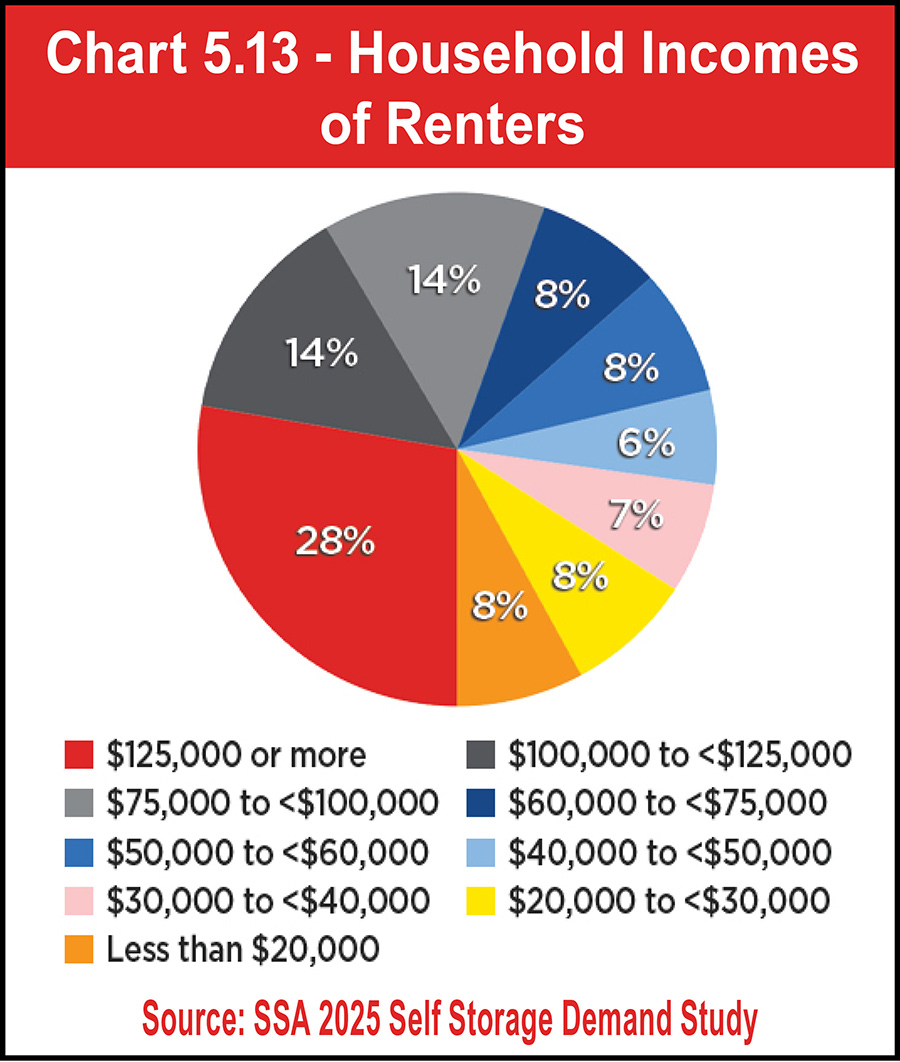
Chart 5.13 - Household Incomes of Renters
Chart 5.14 - Martial Status
Reasons For Renting Units
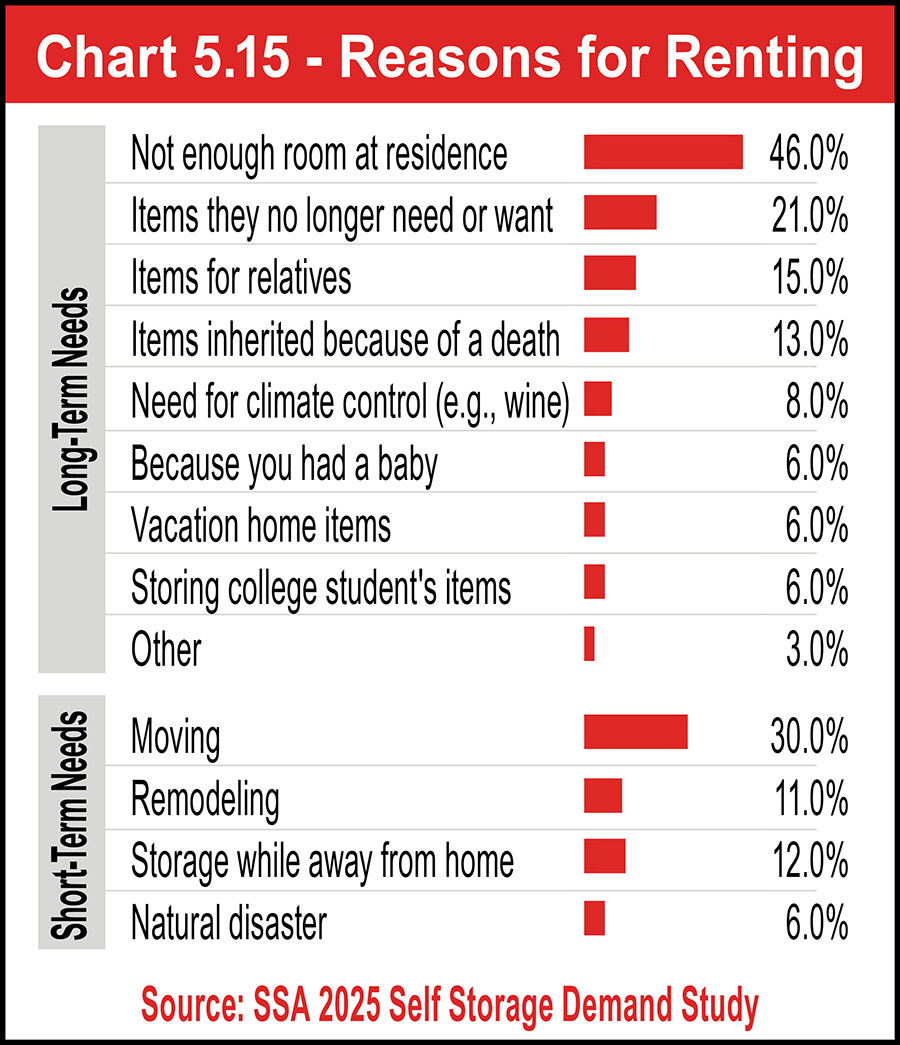
Consumers rent self-storage space for both long-term and short-term needs. The 2025 Self Storage Demand Study reports that long-term storage was the leading reason households rented a self-storage unit in 2024. The most significant reason for long-term storage is that renters don’t have enough room in their homes for their belongings; this accounts for 46 percent of long-term rentals. Twenty-one percent of renters store items they no longer want or need; instead of disposing of the items, they choose to pay to store them at a self-storage facility. Another 15 percent store items for relatives who’ve experienced a change to their living situation, and 13 percent store items inherited following a death. A total of 12 percent of renters are storing due to children-related life changes, either having a new baby (6 percent) or sending one off to college (6 percent). Still another combined 14 percent are storing items from vacation homes (6 percent) and items that require a climate-controlled environment (8 percent), such as wine.

Among short-term needs, moving still tops the list at 30 percent. However, since the 2023 Self Storage Demand Study was released, the percentage of renters using storage during a change a residence has dropped 5 percent. The main reason for this decline is people have been moving less due to high housing costs and expensive mortgages with high interest rates. Moreover, unlike traditional in-person employment opportunities, remote work may make moving unnecessary, so this percentage could continue to decrease. Needing storage while away from home is the reason 12 percent of customers rent units. Six percent use it due to a natural disaster, and 11 percent use storage during remodeling projects.

See Chart 5.15.

Length Of Stay
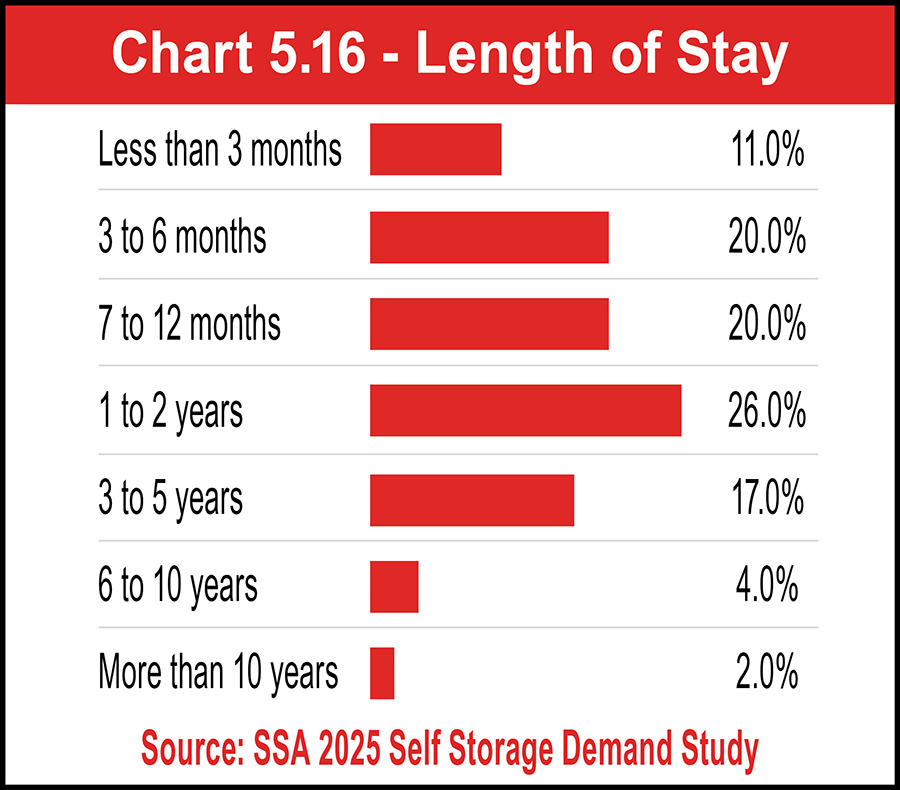
Chart 5.16 shows how long consumers rent self-storage units. Most (26 percent) tend to stay one to two years. Twenty percent stay three to six months, while another 20 percent rent for seven to 12 months. Whereas 11 percent of renters move out within three months, 17 percent of renters choose to stay three to five years. A total of six percent rent units for six years or longer. Additional length of stay data is included in Section 10 about Site Information.

See Chart 5.16.

Chart 5.15 - Reasons for Renting
Chart 5.16 - Length of Stay
Frequency Of Visits To Units
Because self-storage is seen as an extra closet, or a lifestyle extension, younger customers go to their storage unit more frequently. Whereas boomers rarely “visited” their household goods and boxes of memories from generations gone by, millennials and Gen-Xers pick up and return their kayaks or snowboarding equipment several times a month, and they swap out furniture, clothing, and even children’s toys between residences and storage.

As such, it should come as no surprise that units are being visited more frequently than ever before. In fact, the percentage of renters visiting their units more than once per week has increased by 5 percent in two years to 17 percent. Now, only 8 percent of renters visit their stored belongings fewer than three times per year—a 2 percent decrease from 10 percent in 2023. Additional visits to units can be helpful for early detection of mold, mildew, pests, and other potential damages, but increased foot traffic at a facility could prompt renters to request more amenities, products, and/or services.

See Chart 5.17.
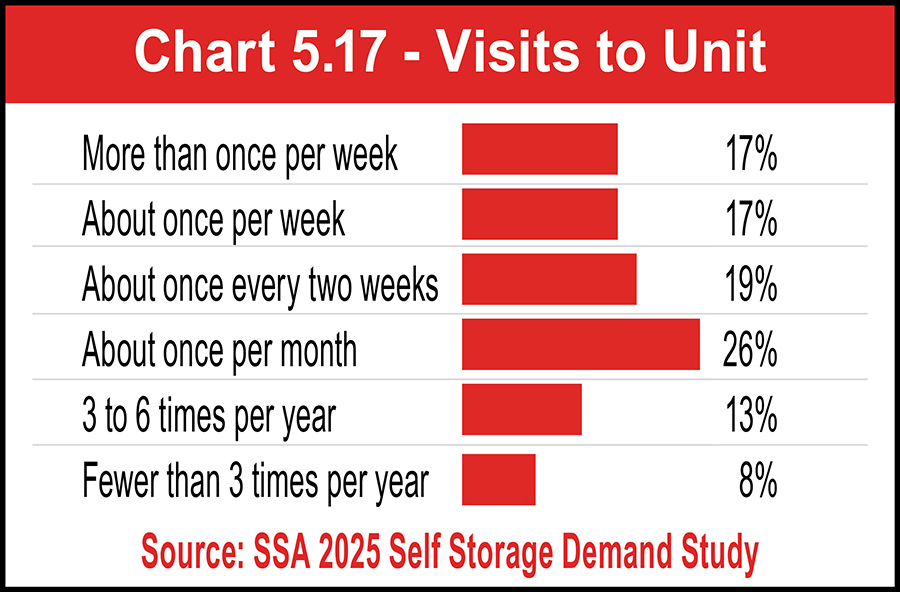
Chart 5.17 - Visits to Unit
Features And Amenities Customers Want
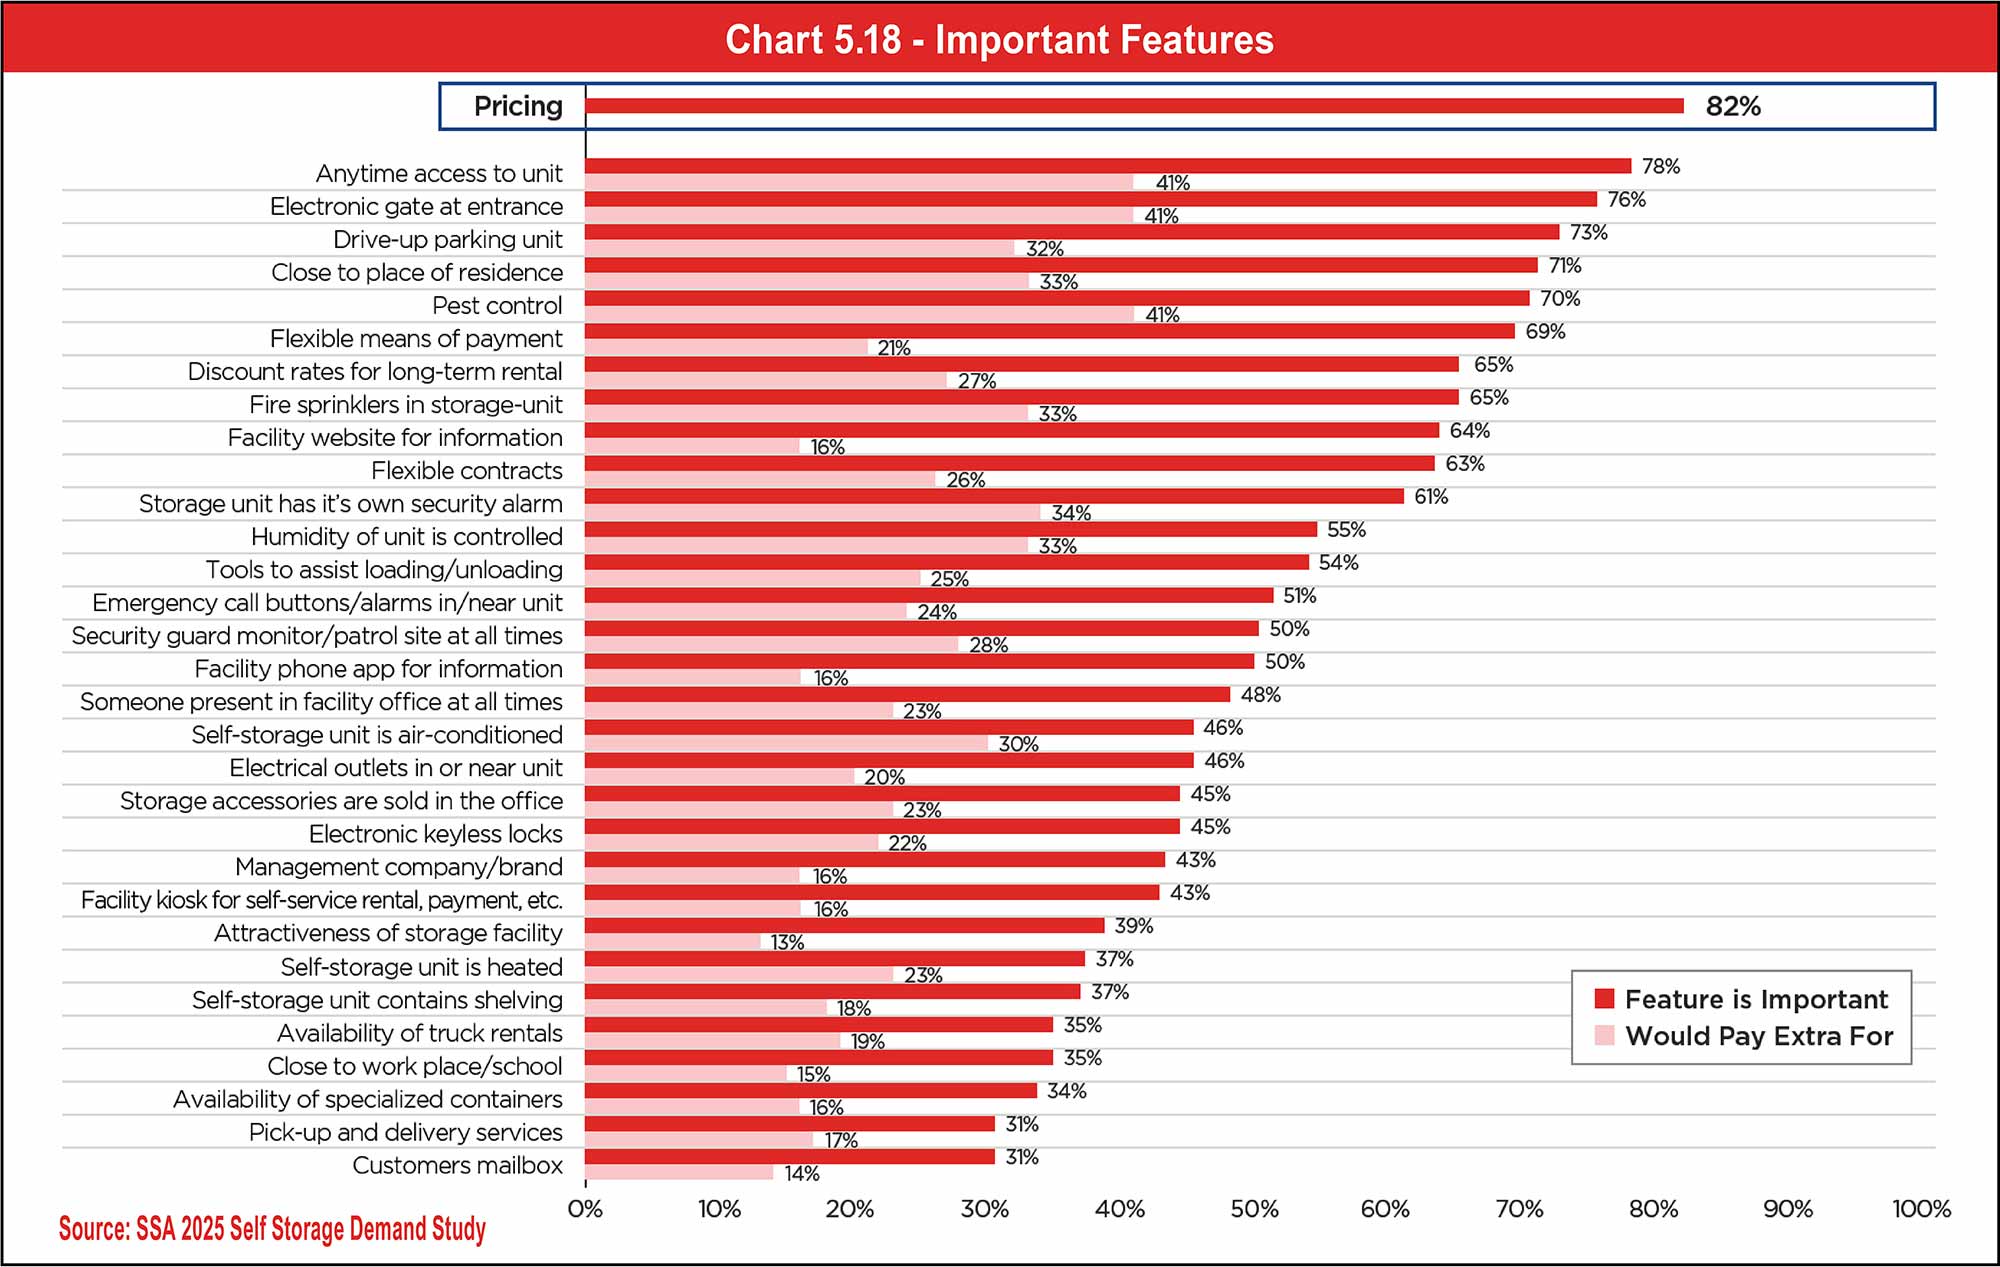
Above all, pricing remains the most important feature of a self-storage unit to renters; 82 percent rank it as such. But there are plenty of other features and amenities that attract and retain customers. Chart 5.18 lists many of them. After price, the top five items most valued by renters are anytime access to unit (78 percent), electronic gates at entrance (76 percent), drive-up parking to unit (73 percent), close to place of residence (71 percent), and pest control (70 percent). Moreover, 41 percent of customers are willing to pay more for anytime access, electronic gates, or pest control.

See Chart 5.18.

Chart 5.18 - Important Features
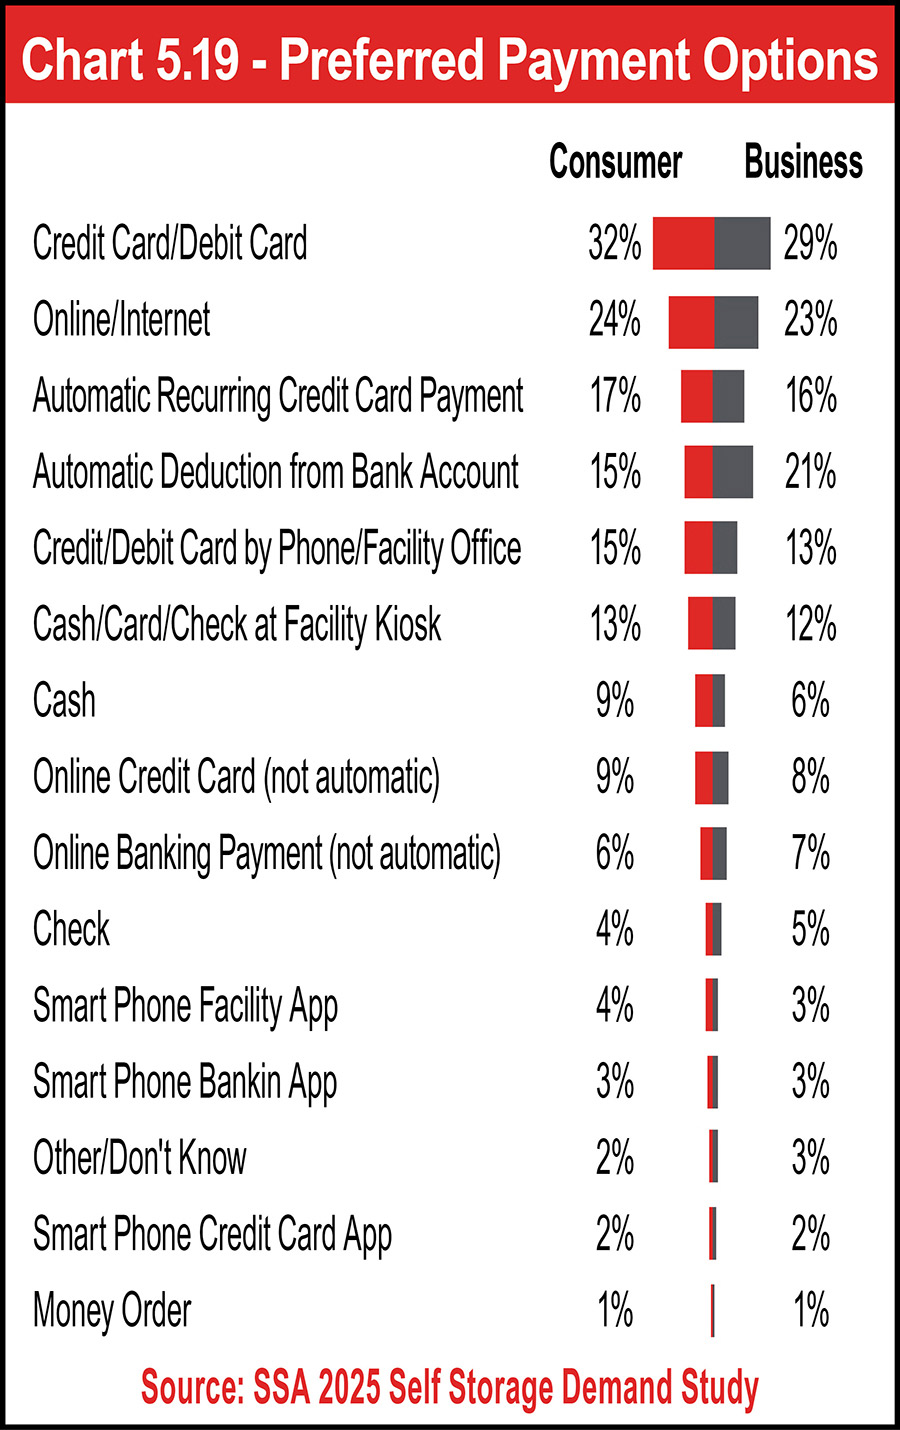
More than two-thirds (69 percent) of customers also appreciate having flexible means of payment. Their preferences are shown in Chart 5.19, which includes more than a dozen payment options. Self-storage facilities are not required to offer every available payment option, but it is wise to provide the most popular options within your market area.

See Chart 5.19.

Items Stored
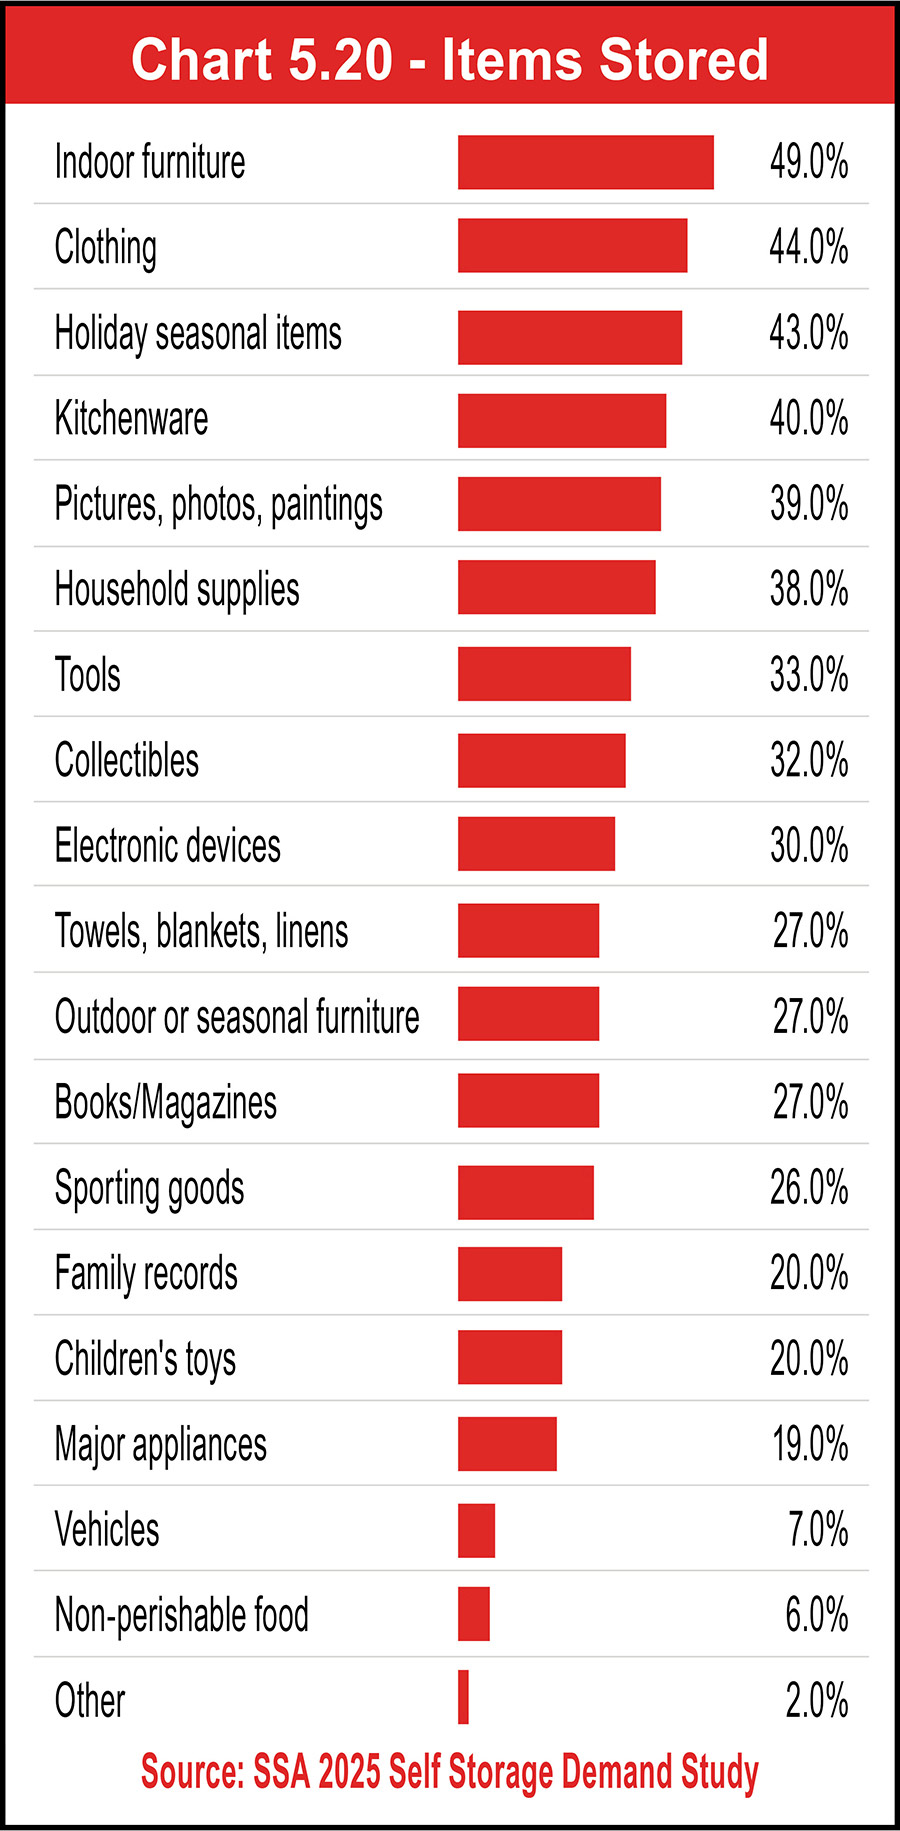
Finally, it’s time to look at what customers are storing. Chart 5.20 includes 19 categories. Of those, the most stored item is indoor furniture, which 49 percent of renters keep in their units. Clothing (44 percent), holiday seasonal items (43 percent), kitchenware (40 percent), and pictures, photos, paintings (39 percent) round out the top five items being stored. Although the percentages of renters storing vehicles and non-perishable foods have increased slightly to 7 percent and 6 percent, respectfully, those items remain at the bottom of the list as two of the least stored things.

See Chart 5.20.

Chart 5.19 - Preferred Payment Options
Chart 5.20 - Items Stored
It may seem somewhat intrusive, but asking your customers what they are storing is a good (and recommended) business practice for two reasons. First, knowing what is being stored enables you to offer products and services at your self-storage facility that could enhance the customer experience while boosting your bottom line, such as retail items to protect stored goods, custom shelving/racks within units, shredding services, specialty storage options, and the like. Secondly, and most importantly, asking what’s being stored helps you verify that items prohibited from storage aren’t putting your customers, employees, and property at risk.

Quite simply, there’s a lot that can be learned from knowing what a customer is storing, and asking helps you know and safeguard your valuable customers from danger and competitors.