M icon
Stats With Starr
Drive Time
Vs. Radius
Which is Better For A Trade Area Analysis?
By Noah StaRr
A stylized 3D image of a large, glossy red map pin, like one used to mark a location on an online map.
Drive Time Vs. Radius
Which is Better For A Trade Area Analysis?
By Noah StaRr
F

or residential tenants, beach-front or lake-front properties are highly desirable. The views alone make the land more valuable to investors and the rent premium for tenants worth every penny. When it comes to self-storage facilities, however, the opposite may be true. Topographical barriers could significantly affect the performance of a self-storage facility. Because of this, the lens through which you look at a trade area is vitally important. Let’s dive into an example.

See Image 1.

An aerial map view centered on a red map pin. There are two concentric circles around the pin. The inner red circle is labeled "1 mi." and the outer orange circle is labeled "3 mi." The area within the circles is primarily green, with a winding river and some roads and buildings visible. Several other self-storage facility pins are visible outside the circles.
Image 1
Let’s say the red pinpoint in the Image 1 map represents our facility of interest. The colorful rings around the pinpoint represent a one-mile, three-mile, and five-mile trade area. It’s not uncommon for investors to analyze trade areas through the mile-radius lens, and it can be a completely appropriate methodology depending on the trade area.

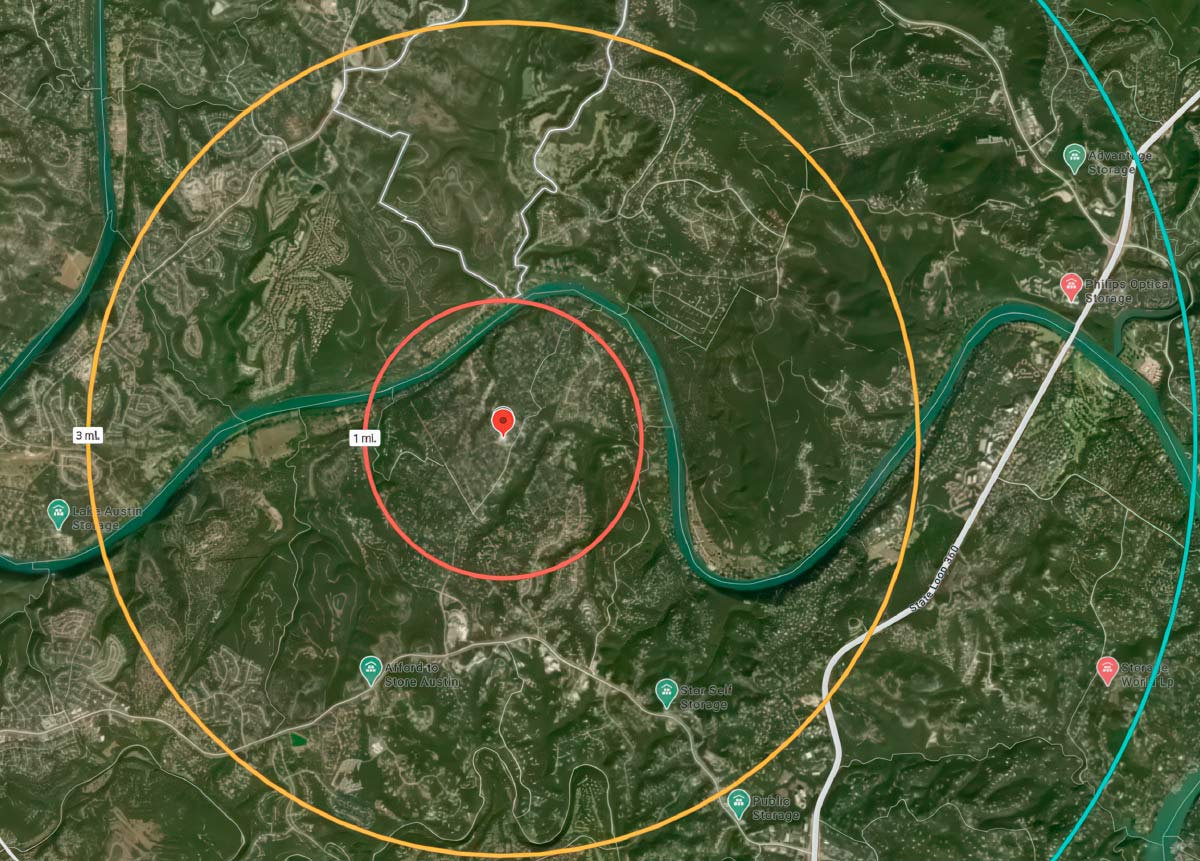
Now, we have discovered that the supply per capita is only 3.3 within three miles of the subject site, suggesting this is an area of low storage supply compared to the amount of people living in proximity to the facility. This must be a great deal, right? Let’s take a closer look.

You will notice in the map image that there is a river that cuts through roughly half of the three-mile radius, meaning roughly half of your target customer base is located across the river from the facility. The closest bridge is about 10 miles away. It is unlikely that people on the north side of the river will drive east 10 miles, cross the bridge, and then drive 10 miles west to the subject facility when they have other options along the way.

This is a perfect example of when to use a drive time analysis as opposed to a radius analysis when looking at a trade area. Let’s change the map image to represent a five-minute, 10-minute, and 20-minute drive-time perspective.

See Image 2.

An aerial map view showing the same red map pin. There are two irregular, non-circular shapes drawn around the pin, representing drive-time zones. The inner red shape is labeled "5 min" and shows the area accessible within a 5-minute drive. The outer orange shape is labeled "10 min" and represents the 10-minute drive-time zone. These zones follow roads and terrain, resulting in a different shape than the simple circular radius. A river is also visible on the map.
Image 2
As you can see, no one on the north side of the river is within a 20-minute drive of your property. This is important because, according to the SSA’s 2023 Self Storage Demand Study, nearly 70 percent of renters live within a 20-minute drive of their self-storage unit.
The best investors understand the topographical barriers affecting a property and use a drive time or radius analysis accordingly when looking at a trade area.
It is likely that the people living on the north side of the river are not part of your potential customer base. To further prove the point, supply per capita within a 10-minute drive time of the site is actually 19.8, much higher than 3.3 when doing a three-mile radius analysis, suggesting the area is actually over-supplied compared to the amount of people living in proximity to the subject facility. If we dig into rental rates too, we will find the rental rates within a five-minute drive time have consistently been lower (since 2023) than facilities within a 10- and 15-minute drive time, further suggesting that performance is being affected by the area’s topographical barriers.

Does this analysis mean the deal is bad? Not necessarily. The point of this exercise is to be aware of the topography and factor the results into your overall analysis. Other topographical barriers could include mountains, hills, oceans, lakes, and canyons. The best investors understand the topographical barriers affecting a property and use a drive time or radius analysis accordingly when looking at a trade area.

Noah Starr is the CEO of TractIQ.