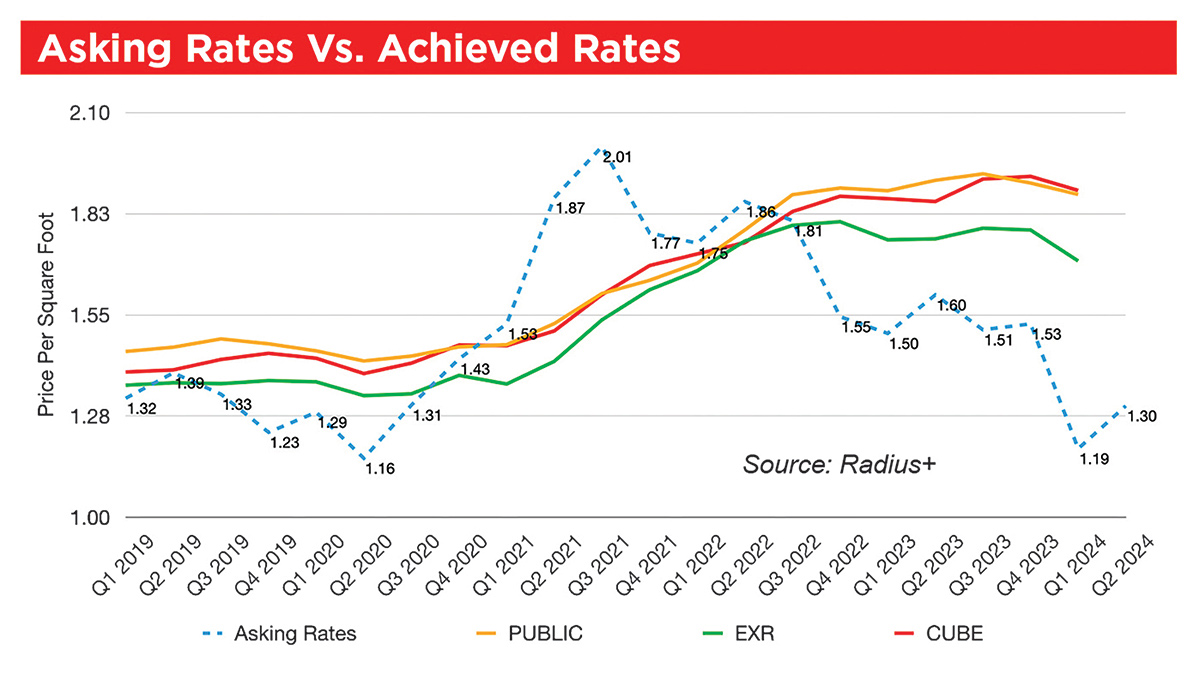
ne of the most widely discussed topics in the industry right now is the large gap between asking rates being advertised by the REITs and the achieved rates their stores are producing. While asking rates have cooled off dramatically from the 2021 all-time highs, we’re seeing that the achieved rates are still staying strong.
PUBLIC: $1.45
EXR: $1.36
CUBE: $1.40
PUBLIC: $1.88
EXR: $1.70
CUBE: $1.89
PUBLIC: +29.67%
EXR: +25%
CUBE: +35%
The outcome of this new revenue management strategy is still to be determined, but the effects of it on the industry have been made clear. Forecasting where rates will go in a market seems to be nearly impossible now, as the rates being advertised by REIT owned/operated facilities have become increasingly volatile. It is unclear to me if a facility that employs this aggressive ECRI model will stabilize its in-place rates within the 36-month timeline that is usually applied to Class-A facilities, even if its physical occupancy is stabilized (85-plus percent physically occupied).
Will tenants be more likely to move out when getting their monthly fees increased at a higher velocity? Will they be less likely to rent a self-storage unit in the future if they moved out due to getting their rent increased? Or will there be minimal impact on the consumer, and this becomes the new norm?
The REITs have demonstrated that they can drive revenue across their portfolio using this model, but whether this will be a sustainable practice, only time will tell.
See Asking Rates Vs. Achieved Rates Chart

- Top 25 markets
- Unit sizes averaged: 5-by-5, 5-by-10, 10-by-10, 10-by-15, 10-by-20
- Companies: Public Storage, Extra Space Storage, CubeSmart
- Features: climate control and non-climate control
- Price Type: Web