he outlook for storage is uncertain in the second half of the year.
A team from Yardi Matrix attended the SSA Fall 2024 Conference in Las Vegas on Sept. 3 to 6 and found the atmosphere mixed. Operators are pessimistic about 2024 results, given that the typically busy summer leasing season has been shorter and weaker, while brokers and investors feel confident that deal flow will pick up as performance finds a bottom and interest rates come down. Advertised rental rate declines are fueling uncertainty in underwriting for acquisitions and development, but investor interest remains high and there is an abundance of capital waiting to start or expand self-storage portfolios. The bid-ask spread that has kept many on the sidelines has shown little sign of budging, but impending interest rate cuts could help bring cap rates back down from 5.5 to 6-plus percent. Rental rate declines could moderate over the next few months, after rates dropped aggressively in fall and winter 2022 and 2023, as supply pressures start to ease and existing customer rate increases become less accretive to in-place rent growth, providing motivation to hold the line on street rates.
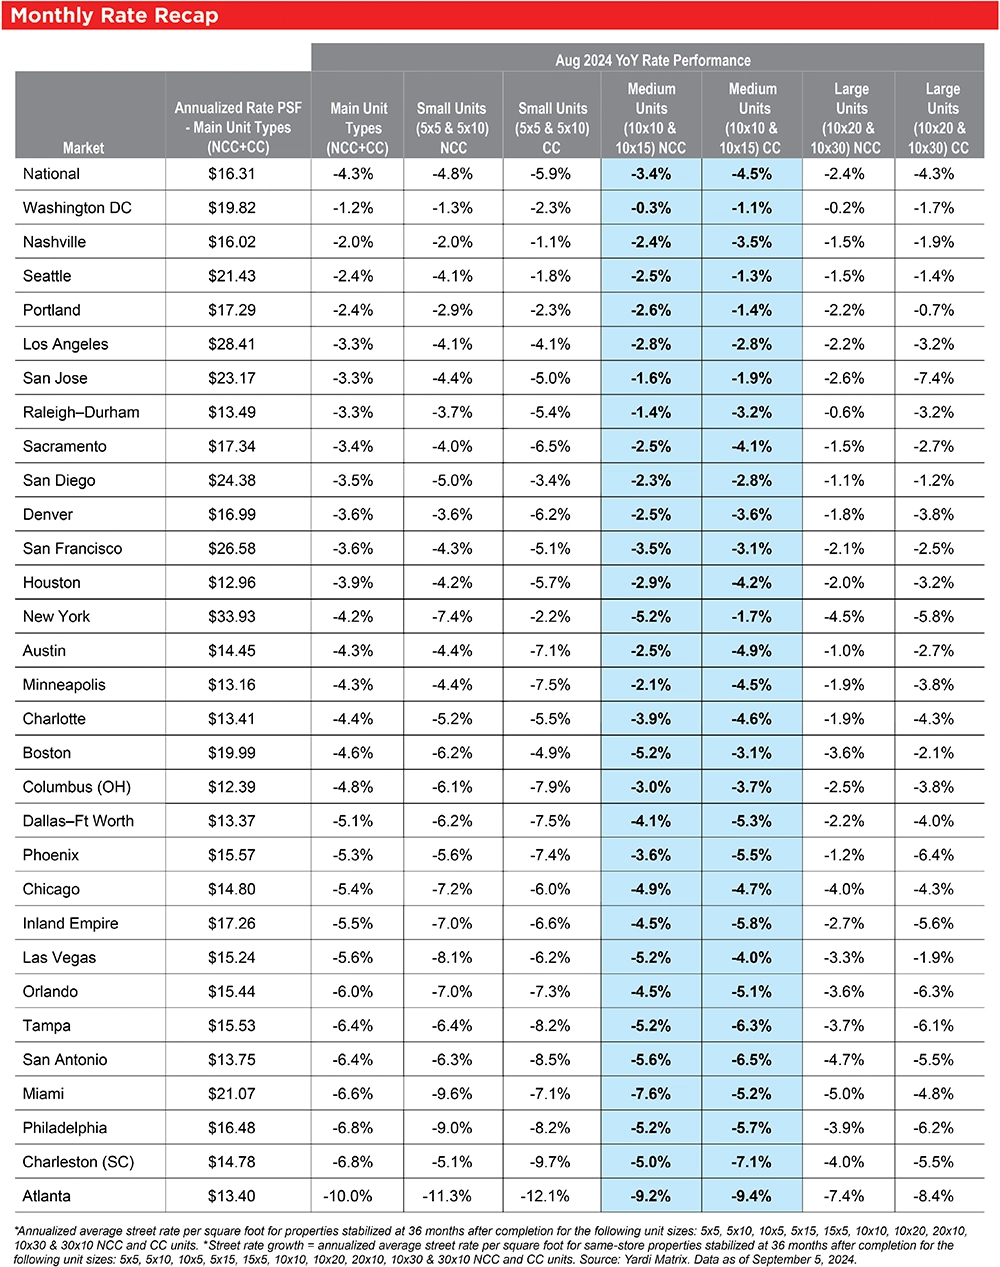
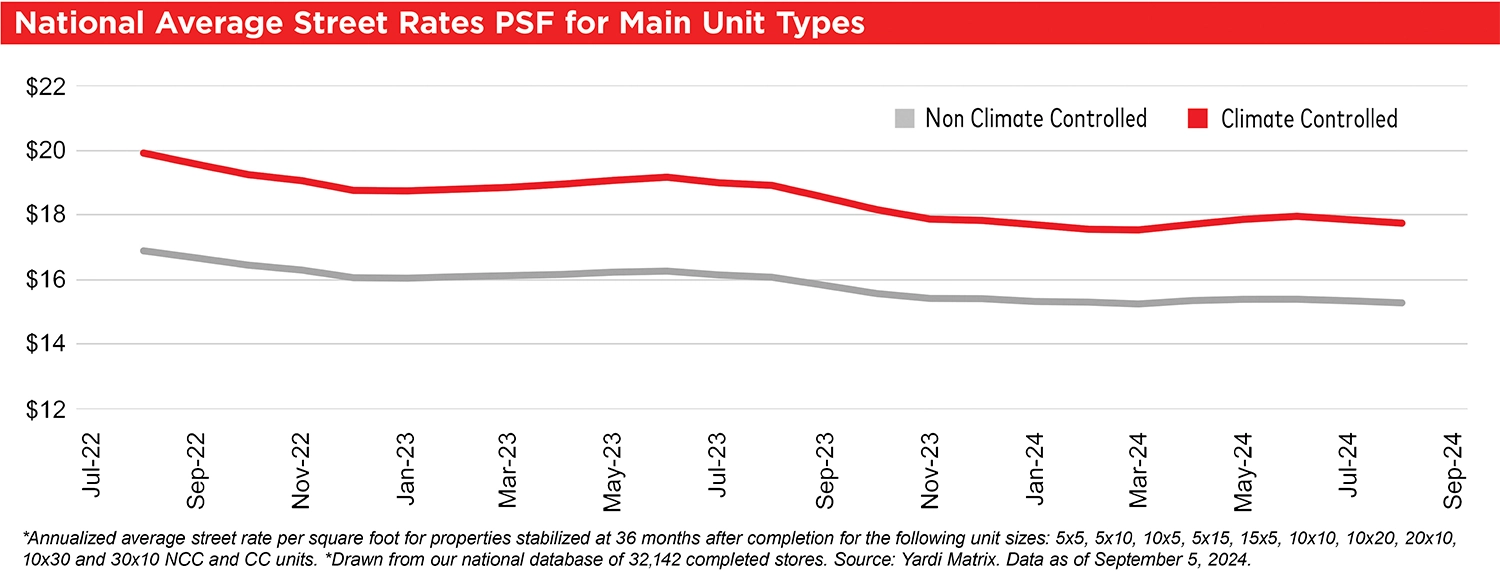
Advertised rates continue to decline year over year. Following weakened demand and declining occupancy, advertised rate growth continues to be negative. Nationwide, advertised rates were down 4.3 percent year over year in August, with an annualized average per square foot of $16.31 for the combined mix of unit sizes and types—the 23rd consecutive month of annual declines.
Advertised rate growth also remains negative year over year across Yardi Matrix’s top metros. Same-store rates for non-climate-controlled (NCC) and climate-controlled (CC) units decreased in all 30 top metros in August compared to last year, while rates for large units (10-by-20, 10-by-30) are doing much better than those for small units (5-by-5, 5-by-10) in nearly all metros.
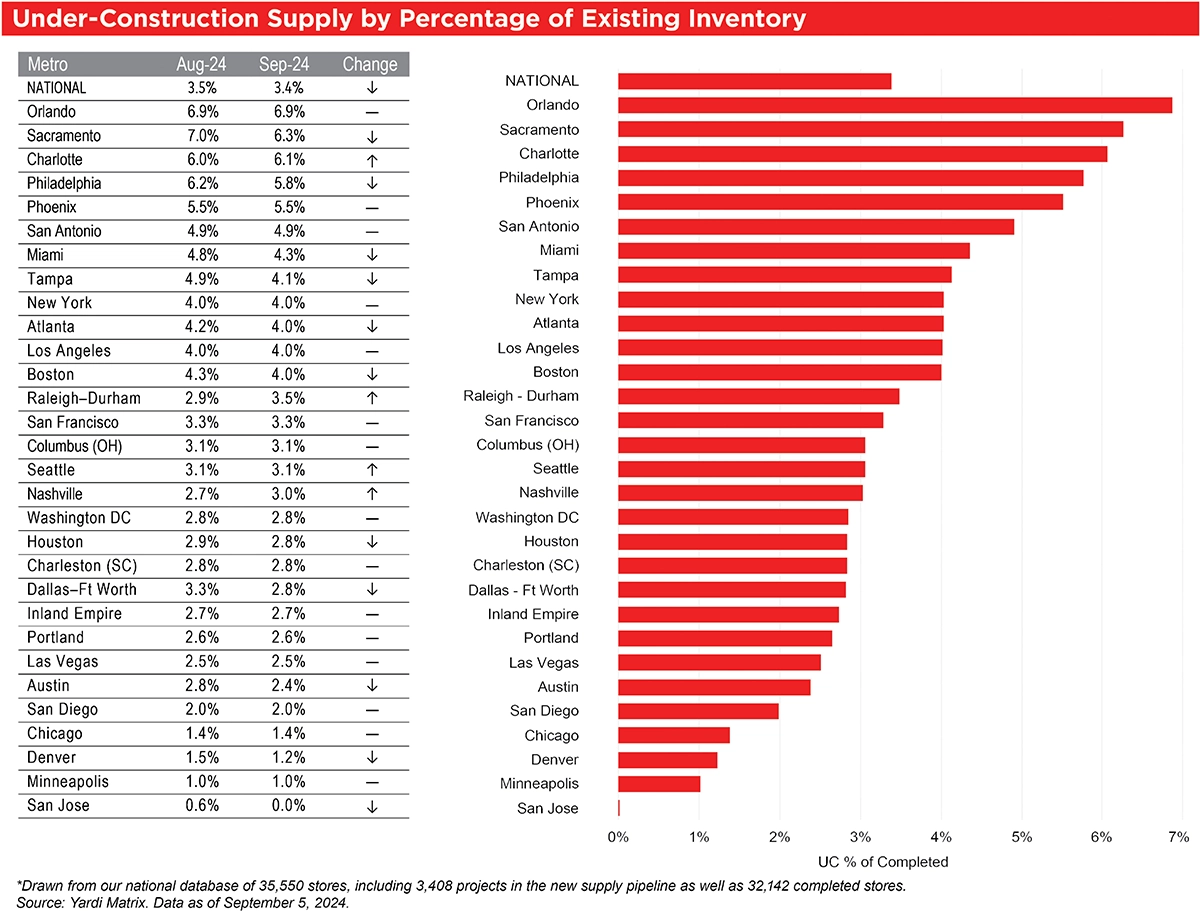
Nationally, Yardi Matrix tracks a total of 3,408 self-storage properties in various stages of development, including 837 under construction, 2,063 planned, and 508 prospective properties. The share of projects (net rentable square feet) under construction nationwide was equivalent to 3.4 percent of existing stock through the end of August.
Yardi Matrix also maintains operational profiles for 32,142 completed self-storage facilities in the U.S., bringing the total dataset to 35,550. We are happy to announce our new Evansville, Iowa City, Longview, and Peoria storage markets are now available on the subscriber portal.
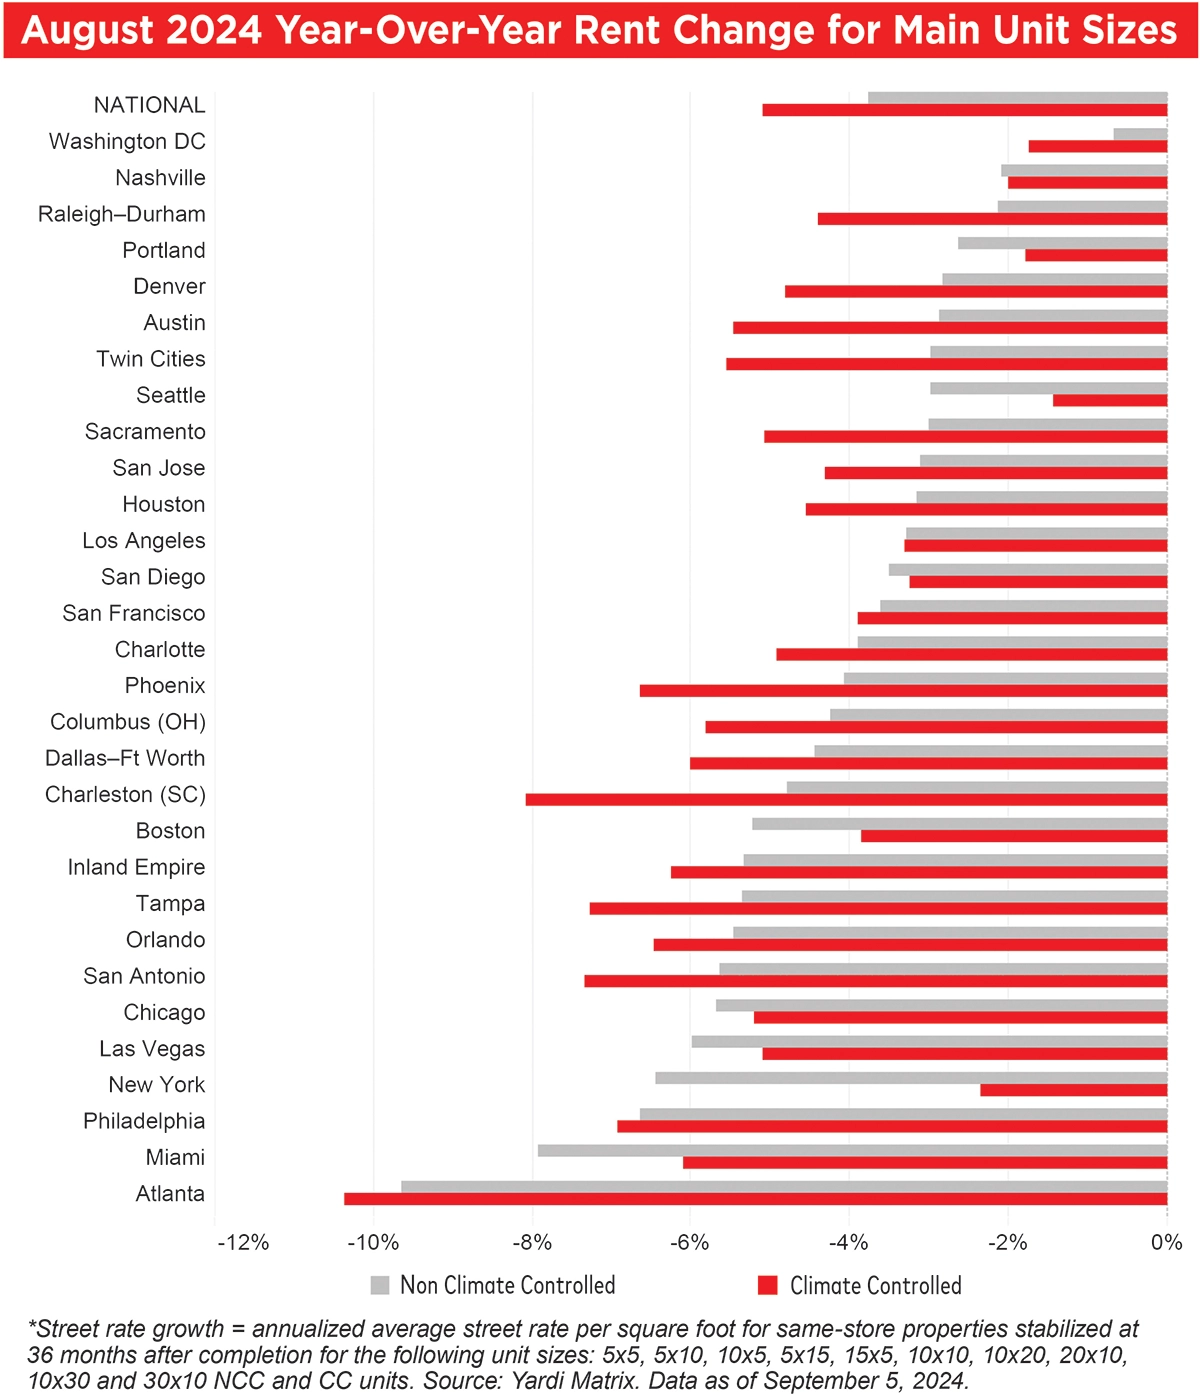
Same-store advertised rates for combined NCC units nationwide decreased 3.8 percent year over year in August, a slight improvement over the -3.9 percent average over the first seven months of the year, while same-store advertised rates performed worse for comparable CC units, declining 5.1 percent year over year, a deceleration from an average of -4.7 percent from January to July. Customers are more likely to rent NCC units when the weather is nicer, likely contributing to the difference in performance between NCC and CC units. In addition, new supply tends to primarily be CC units, which impacts rates.
The self-storage REITs continue to lead rate declines, with advertised rents at stabilized properties down 5.4 percent annually versus 4.0 percent for their non-REIT competitors in the same markets nationwide. However, the difference has come in quite a bit compared to August 2023, when REITs’ advertised rates decreased 7.4 percent year over year versus their non-REIT competitors at 3.5 percent.
See August 2024 Year-Over-Year Rent Change for Main Unit Sizes Table
The national average for combined advertised rates per square foot fell 50 basis points, or eight cents, to $16.31 in August from July. This is the second consecutive month of decreases after the busier summer leasing season came to an earlier-than-anticipated end, and slightly worse than the average 0.3 percent month-over-month decline in August of 2017 to 2019.
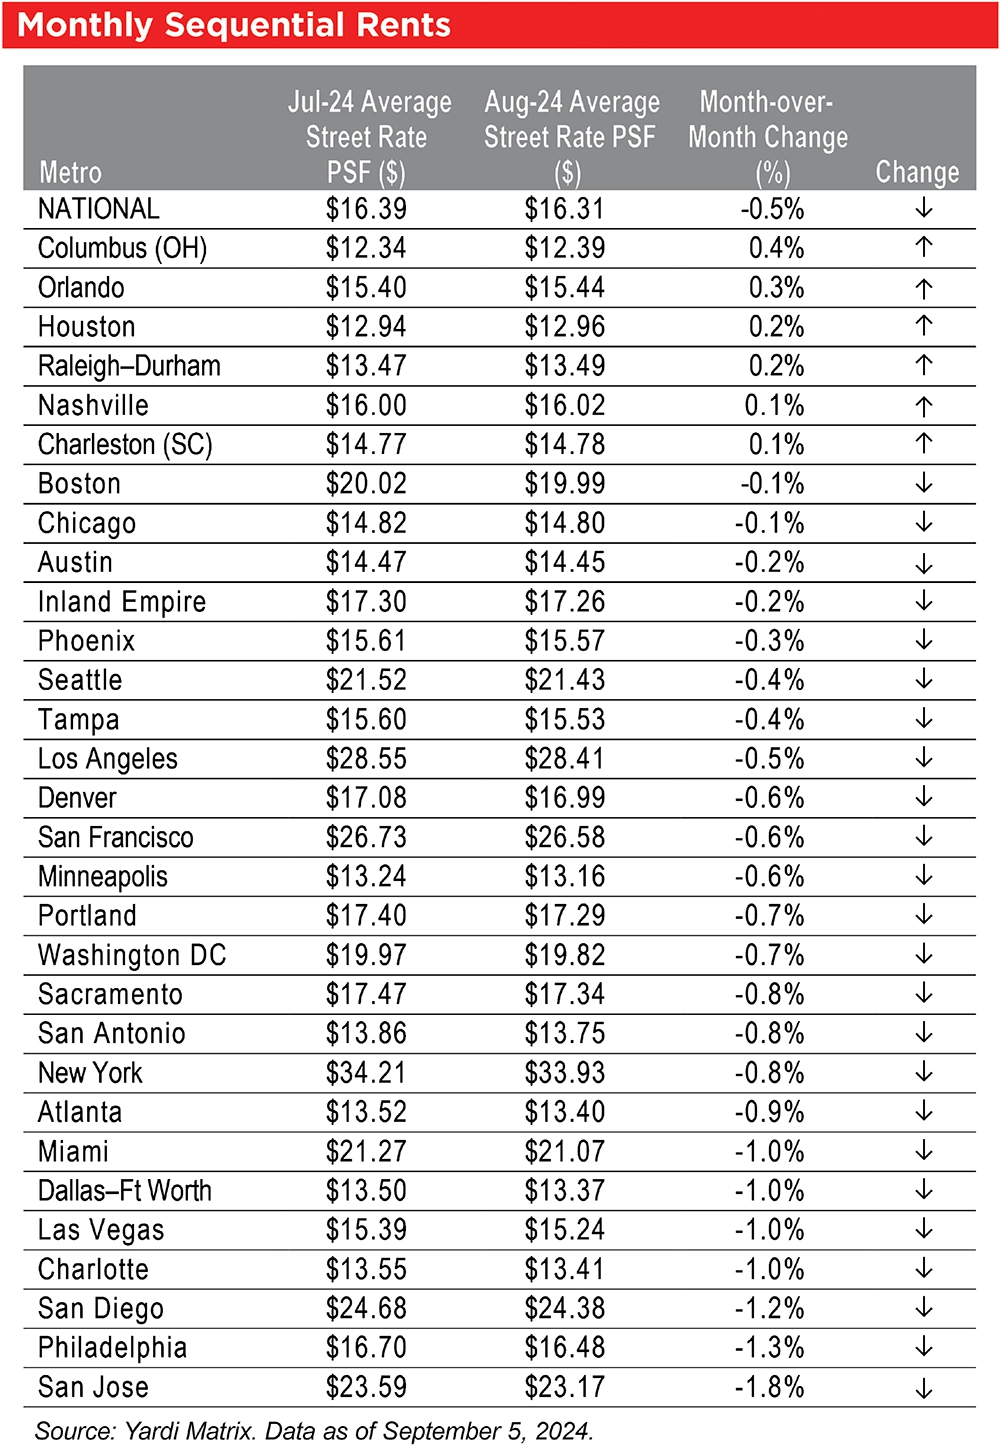
One of the metros experiencing positive growth in sequential rates was Nashville, which had the second- strongest performance in advertised rates year over year. Nashville has seen a rapid reduction in new supply in lease-up over the past three years, which has led to a turnaround in rate growth in the metro.
See National Average Street Rates PSF Unit Types Table/Chart
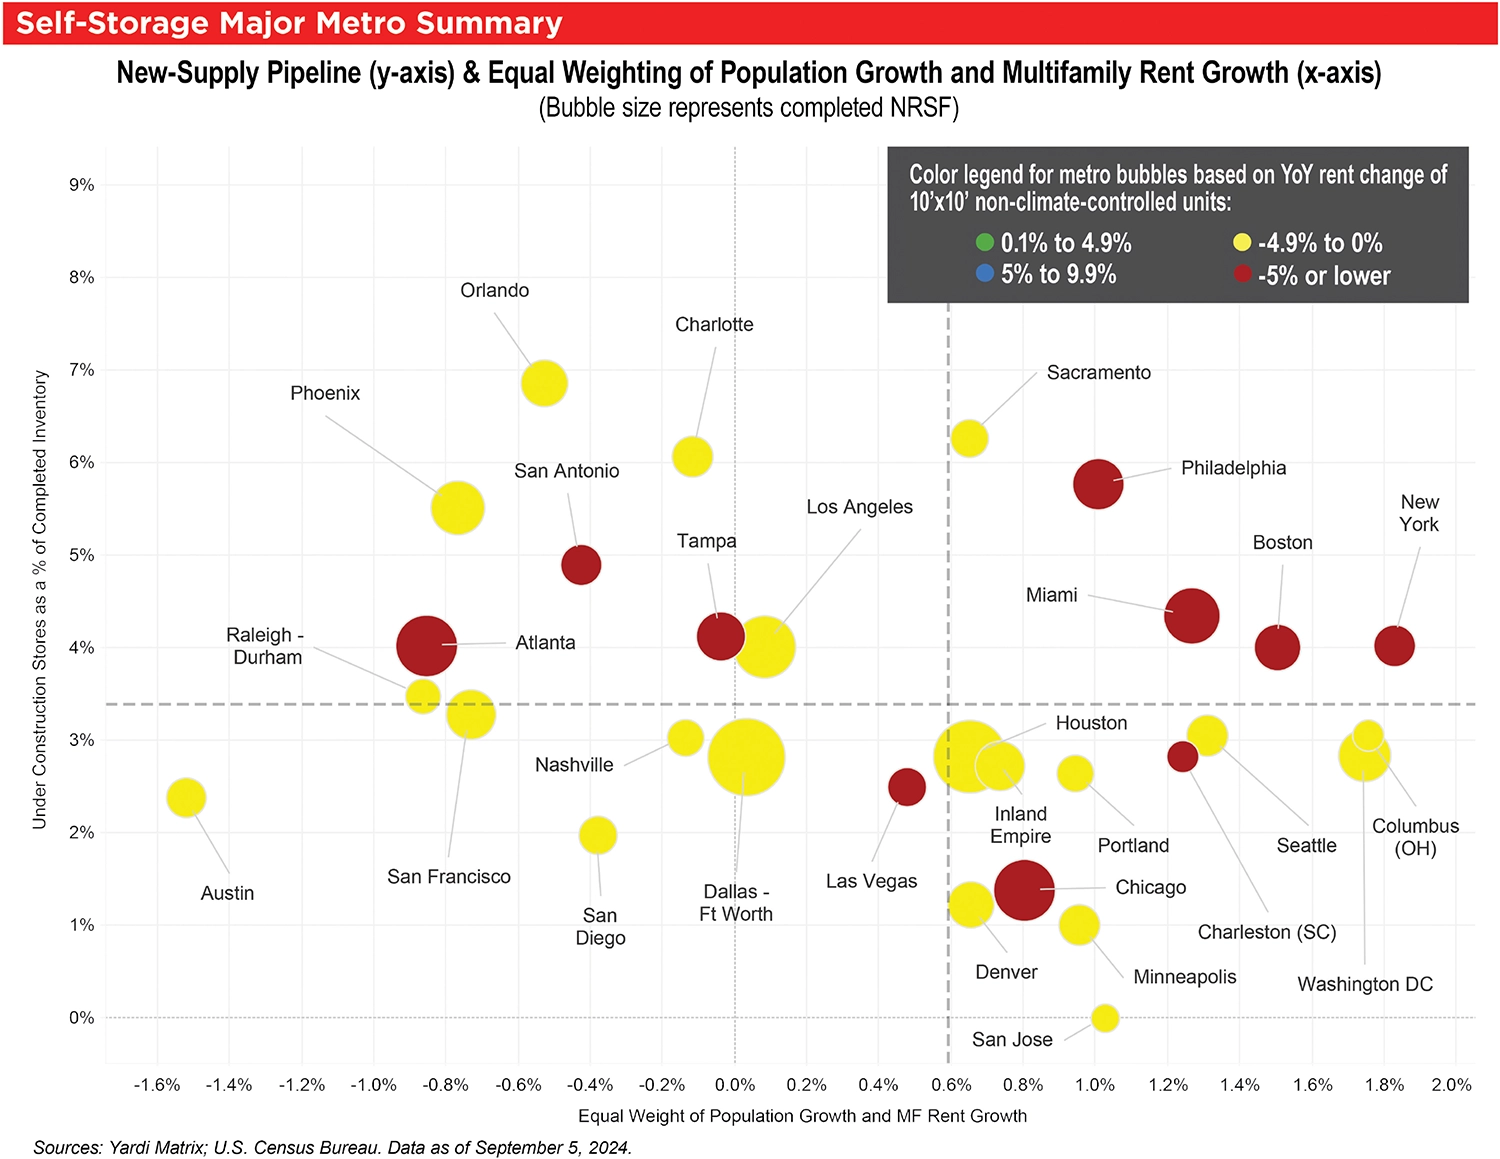
A handful of top metros are seeing healthier storage rates in spite of weak multifamily performance. Storage performance in Austin has improved from a year ago, and advertised rates decreased 3.0 percent year over year in August for popular 10-by-10 NCC units. However, amid strong population growth (up 2.5 percent year over year), Austin has seen an influx of recent apartment supply, and rents significantly underperformed all the other top metros in August, with multifamily advertised rates dropping 5.5 percent year over year.
On the other hand, other top metros are seeing strong rent performance across both their storage and multifamily markets. Washington, D.C., had the best storage rate growth in August, with same-store advertised rates for 10-by-10 NCC units falling only 0.5 percent compared to August 2023. The metro’s apartment rent growth also outpaced all but one of the other top metros, with multifamily advertised rates increasing 3.8 percent year over year. In addition to a strong apartment market, Washington, D.C.’s storage performance has been fueled by a decline in new supply being delivered over the past few years.
See Self-storage Major Metro Summary Chart
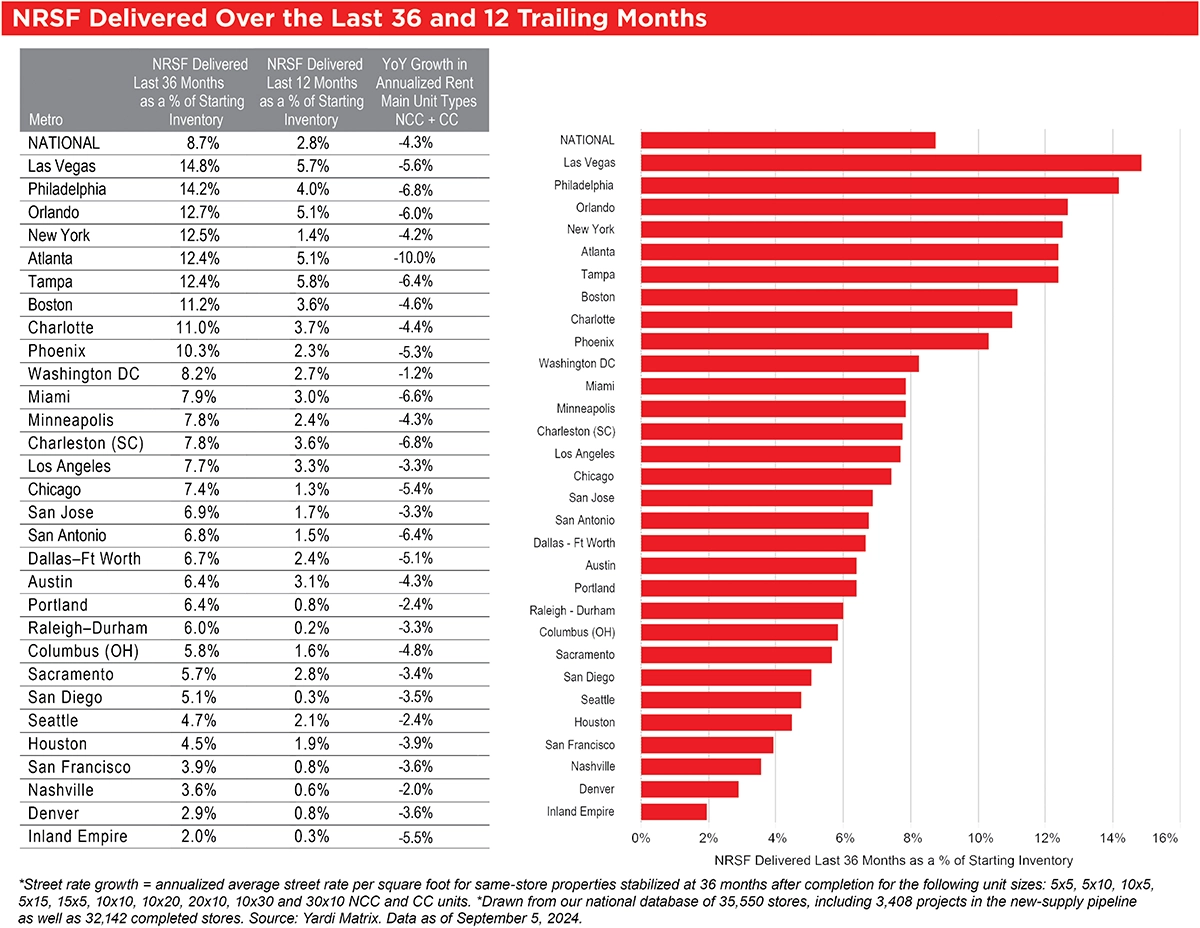
Nationally, the amount of new supply delivered over the past three years is equal to 8.7 percent of starting inventory, while deliveries over the trailing 12 months account for 2.8 percent of the inventory that existed in August 2023. Three-year supply, a proxy for inventory in lease-up, has been gradually decreasing over the past few years across the nation, from 9.2 percent in August 2023 and 10.2 percent in August 2022.
Atlanta has been impacted by a large amount of supply in lease-up, with deliveries over the last three years equal to 12.4 percent of starting inventory. As a result, storage performance in Atlanta has been weak and advertised rates for main unit types and sizes dropped 10.0 percent year over year. The metro has been attracting developer interest following strong performance during the pandemic, and suburban Atlanta has seen over 1.1 million square feet of construction starts thus far in 2024, which will create even more challenges in the future.
See NRSF Delivered Over the Last 36 and 12 Trailing Months Table/Graph
With 63.3 million net rentable square feet (NRSF) under construction, the national pipeline was equal to 3.4 percent of existing stock through the end of August, shrinking a small 0.1 percent month over month. Construction starts have slowed only modestly from a recent peak in summer 2023, which means we will continue to see new projects come online in 2024 and 2025. However, despite new supply continuing to move forward, the pace has slowed given the interest rate and rental rate environment, and our recent forecast shows deliveries declining 9.4 percent in 2024 from 2023.
Without any construction starts in 2023 or 2024 to backfill recent deliveries, San Jose saw its pipeline of new supply under construction dwindle to 0 percent of existing stock in August. However, this is a welcome reprieve for the metro and should help the market in the near term. San Jose has dealt with weak demand from out-migration, losing 0.7 percent of its population in 2022. Consequently, rental rates have struggled across the metro, with advertised rates falling a considerable 180 basis points from July to August for combined unit types and sizes.
See Under-Construction Supply by Percentage of Existing Inventory Table/Graph
