s the Federal Reserve has paused, the rate of increase of self-storage cap rates has slowed. Our 3Q 2023 Self-Storage Investor Survey increased an average of 12 basis points this quarter to an average stabilized cap rate of 5.68 percent. This reflects a total of 46 basis points increase since our 4Q 2022 Investor Survey. Participants remain cautiously optimistic on the sector, despite a slow summer rental season. One response noted other asset classes are phrasing “stay alive until 25,” but that self-storage has remained a steady sector in bull and bear markets, and in times of uncertainty.
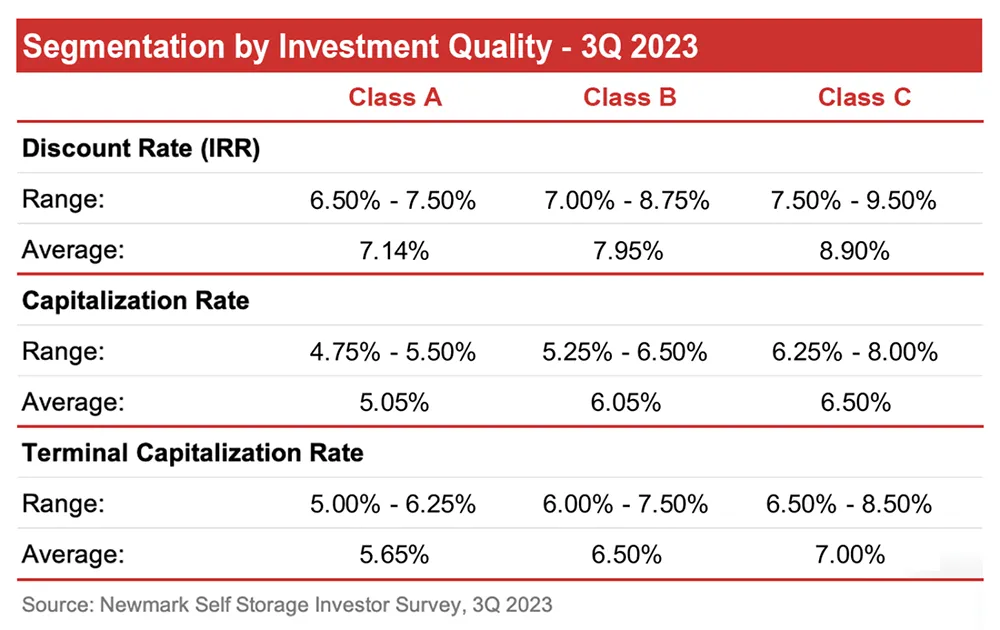
The Q3 2023 data is focused primarily on overall capitalization rates, terminal capitalization rates, and discount rate (IRR). Key performance indicators are shown in the table below.
The self-storage team at Newmark Valuation & Advisory surveyed over 50 market participants about a wide variety of data points, including market sentiment, marketing time, and outlook. Survey participants include buyers, brokers, owners (small and large operators including REITs, national and regional owners), investors, lenders, and REIT analysts. Most interviews were in person, by telephone, or via electronic conferencing.
Other notable items from the survey include an expectation of significant increases in sales volume in 2024 as debt will be coming due. This may cause self-storage cap rates to stabilize or even decline as capital on the sidelines competes for acquisitions. Underwriting is becoming “more realistic,” according to another respondent, with less emphasis on negative underwriting suggesting confidence in self-storage over the long run. Many noted a muted supply chain, indicating general market balance in supply and demand factors (highlighting of course the variances among trade areas).
We have recently received more requests to restate our general guidelines for Class-A, Class-B, and Class-C product, summarized below.

Class-A facilities are the top performing assets located in high rent and occupancy markets. Most of these facilities are centered in high-density locations within major MSAs. Markets are under-supplied to equilibrium with high barriers to entry and assets reflect an NOI/SF of at least $10. Construction quality is high with state-of-the-art security features. Projects are generally less than 15 years old and contain at least 75,000 square feet. These properties are rarely offered to the open market; instead, they are offered directly to large, sophisticated operators with large portfolios such as REITs.
Class-B facilities perform well but are in more average markets compared with Class-A locations. Markets are generally equilibrium to slight over-supply with some risk of new construction, and typically have an NOI/SF in a range of $6.00 to $10.00. Construction quality is good with most security features. Projects are well-maintained, but may be 15 to 25 years old, and generally contain 50,000 to 75,000 rentable square feet. These facilities are typically adequately maintained and are purchased by regional or national investors.
Class-C product are the remaining facilities. They often have a rural location with low barriers to entry (lots of land, less challenges to zoning and entitlements). They generally have an NOI/SF of less than $6.00. Markets are often over-supplied and rarely do Class-C facilities have economic occupancy higher than 85 percent. Facilities are generally 25 years old or older and may require capital expenditures for deferred maintenance. Projects are typically smaller than 50,000 square feet of rentable area.
The Q4 2023 Investor Survey may foreshadow performance for 2024. Global uncertainties such as the recent attack on Israel exacerbate uncertainty and existing concerns of macro-economic conditions. However, the yield inversion is down to almost 25 bps (down from nearly 100) suggesting an economic soft landing, not a recession. Based on our 3Q 2023 Investor Survey, participants remain cautiously optimistic about self-storage.