EITs see revenue decline in Q4 amid occupancy and rate drops. Q4 2024 self-storage REIT results reflect ongoing challenges, with revenue growth slowing each quarter, ending the year down 1 percent. This was driven by a 0.5 percent drop in occupancy and rates. While markets in the Northeast, Midwest, and West show signs of stabilization, Sun Belt regions struggle with weak home sales and oversupply. The 2025 revenue growth forecast midpoint averages -0.3 percent, with some improvement in advertised rent growth already occurring. NOI growth for 2024 averaged -2.2 percent due to rising expenses, a trend expected to continue. Occupancy is likely to remain flat, with potential growth driven by higher rents in the second half of the year and declining new supply. The transaction market should continue last year’s momentum, with estimated sales volume up 50 percent year over year in the second half of 2024, as a number of well-capitalized private owners and operators have remained very active.
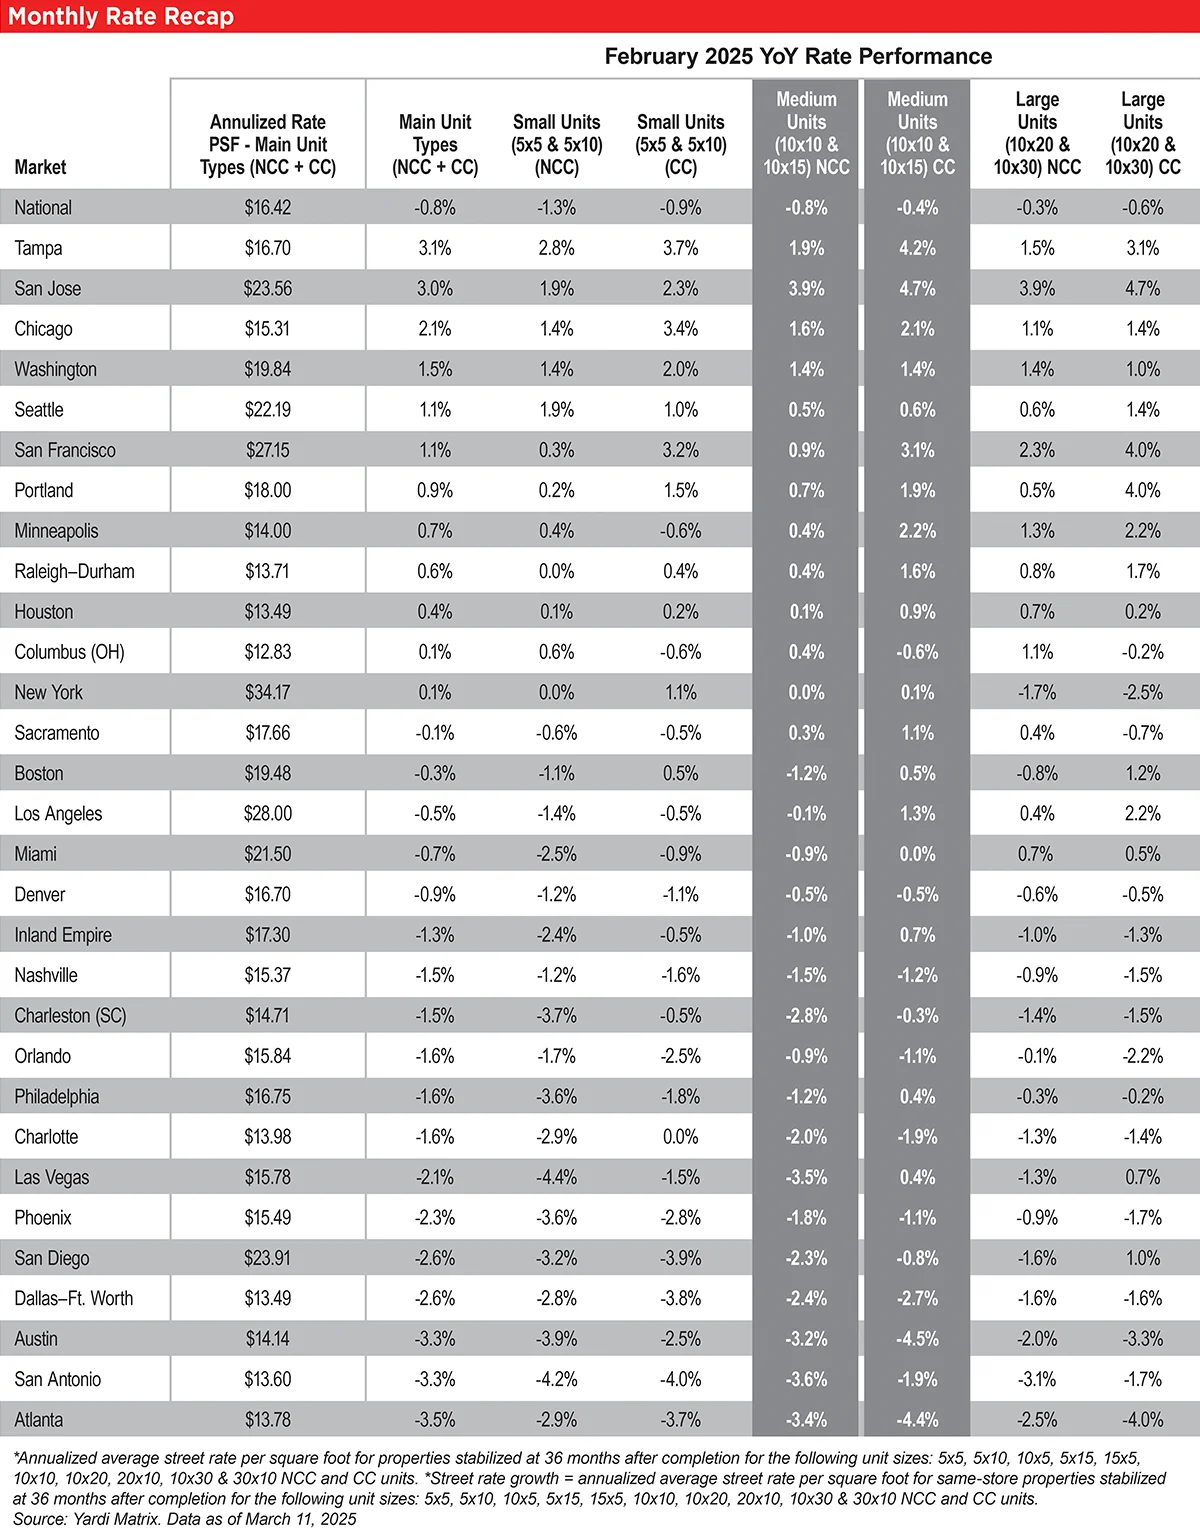
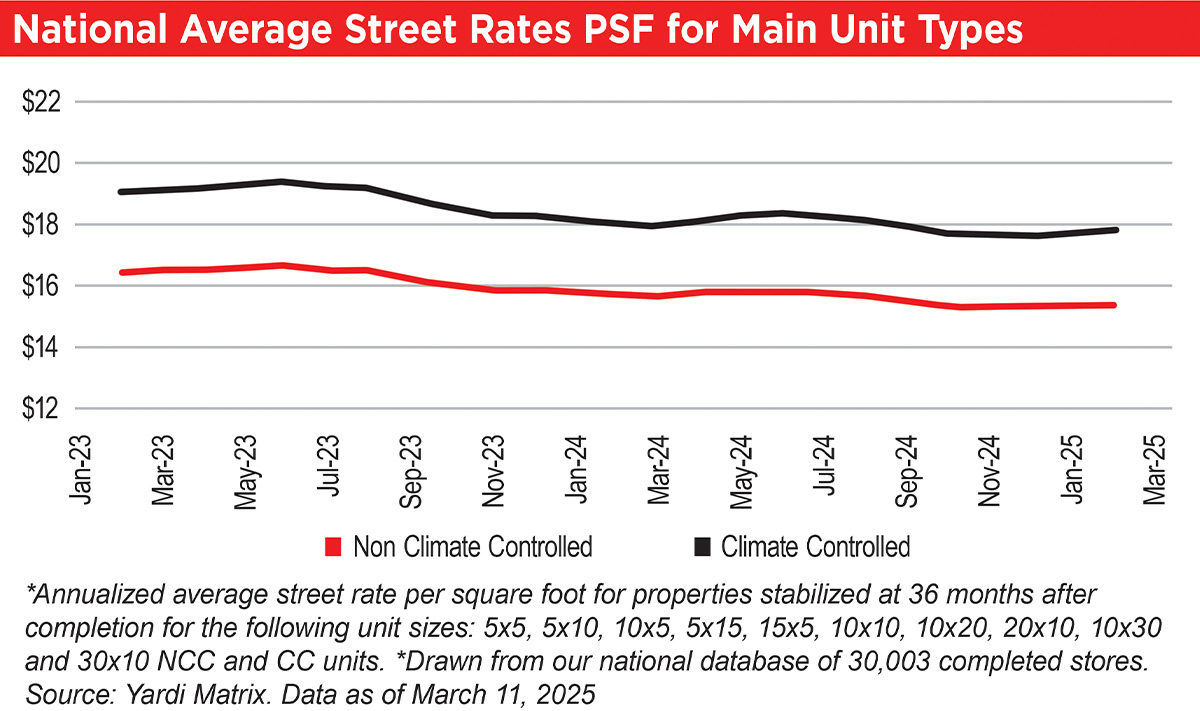
Advertised rates continue to improve year over year in many top metros. While advertised rates continue to drop year over year on a national level, they are declining at a slower rate than in the previous 27 months. National advertised rates were down 0.8 percent year over year in February, with an annualized average per square foot of $16.42 for the combined mix of unit sizes and types. This is an improvement from -1.1 percent in January and -2.2 percent in December.
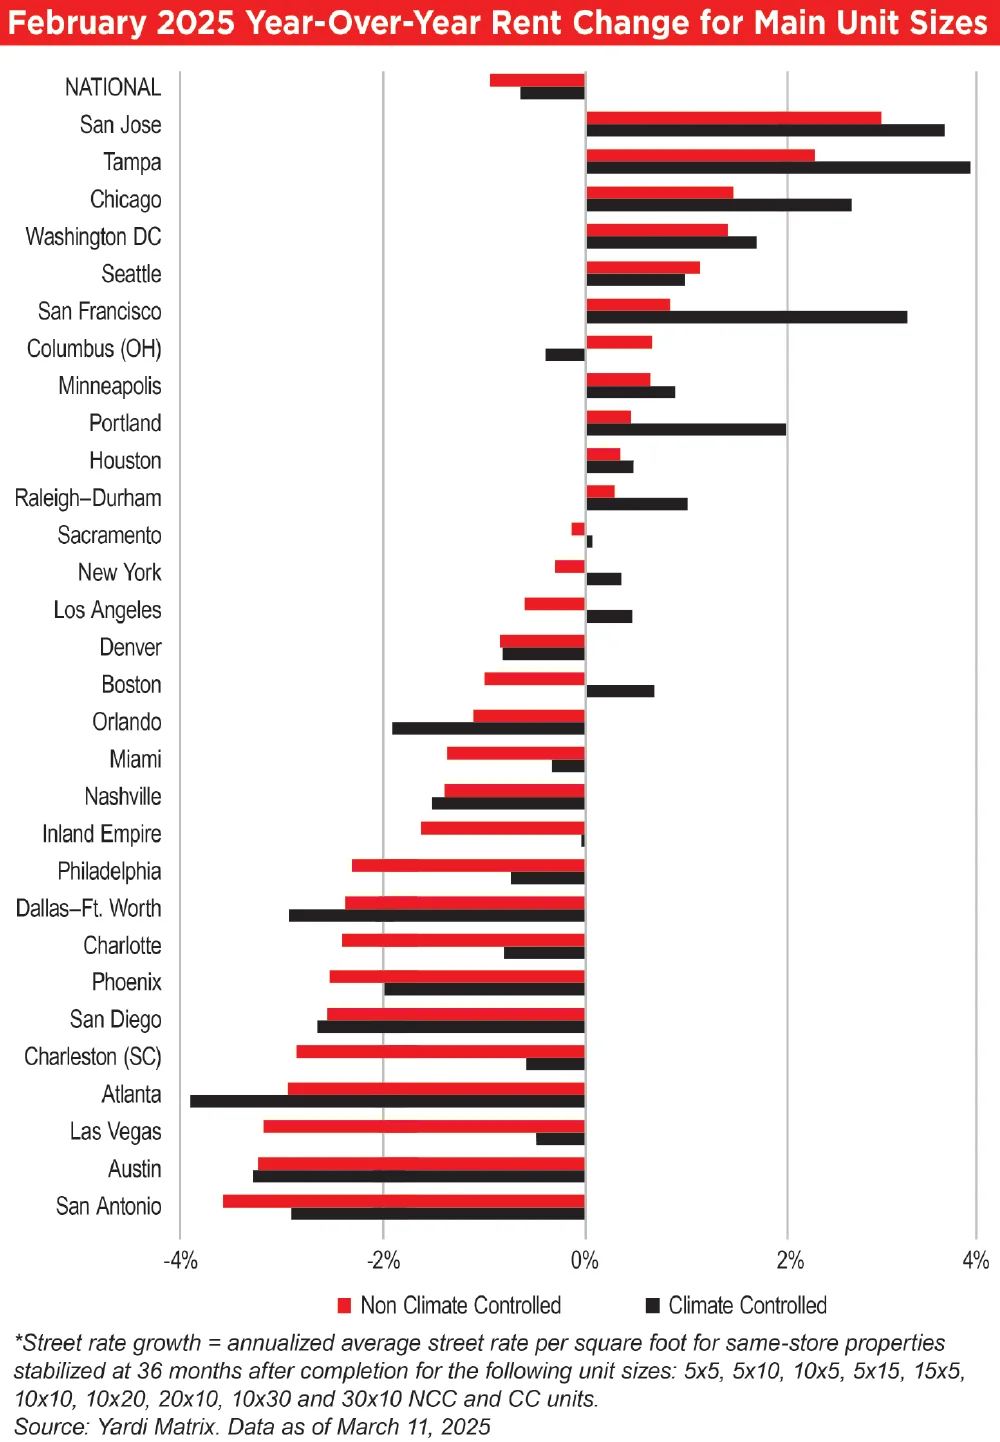
A significant portion of the top metros actually saw advertised rates increase year over year in February. Same-store rates for non-climate-controlled (NCC) units increased in 11 of the top 30 metros. For climate-controlled (CC) units, rates have risen in 14 of the top 30 metros compared to a year ago.
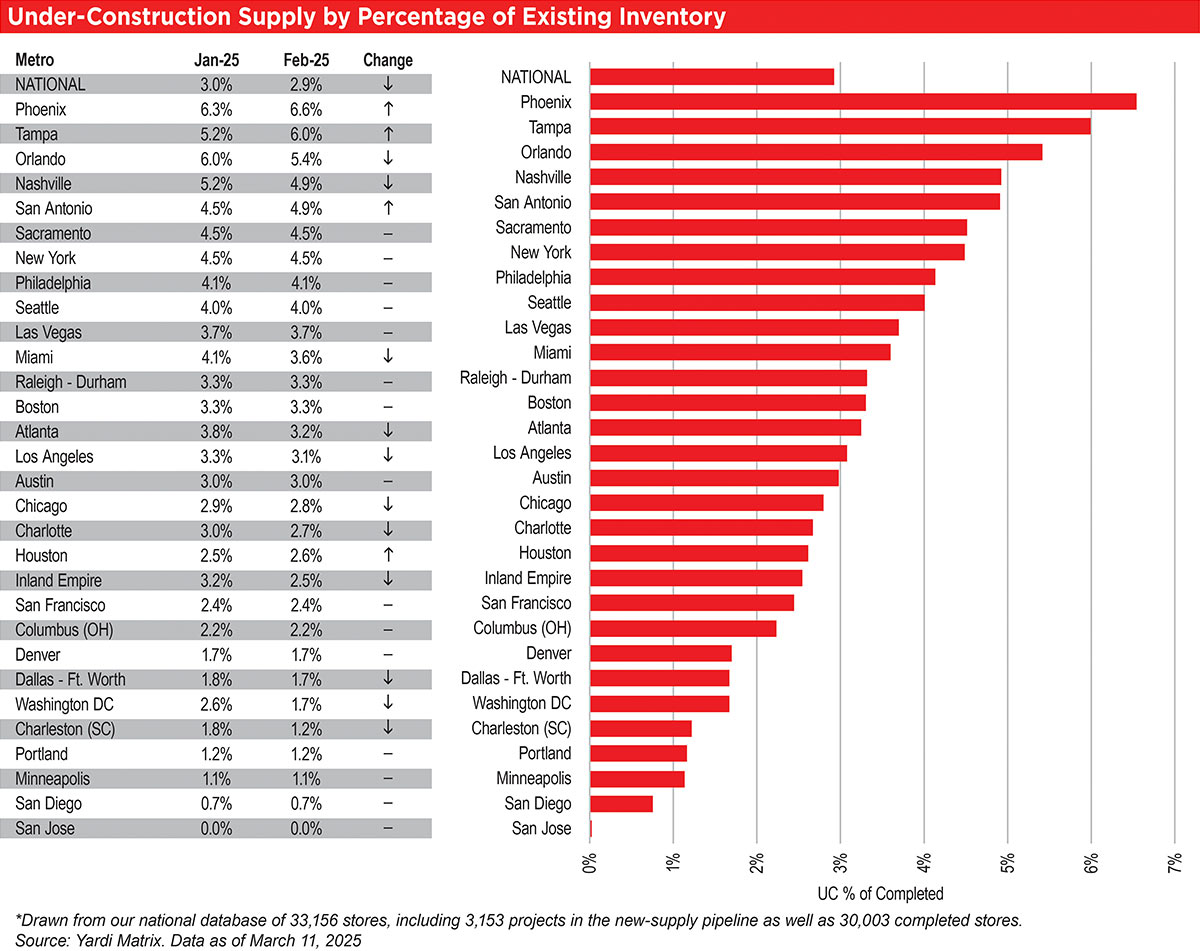
Nationally, Yardi Matrix tracks a total of 3,153 self-storage properties in various stages of development, including 740 under construction, 1,989 planned, and 424 prospective properties. The share of projects (net rentable square feet) under construction nationwide was equivalent to 2.9 percent of existing stock through the end of February, a 10-basis-point decrease from the month prior.
Yardi Matrix also maintains operational profiles for 30,003 completed self-storage facilities in the U.S., bringing the total dataset to 33,156. We are happy to announce the release of our new Medford, Ore., and Green Bay, Wis., storage markets, which are now available to Yardi Matrix customers on the subscriber portal.
For the first time since August 2022, self-storage REITs increased their advertised rates year over year. Same-store advertised rents at stabilized properties for all REITs were up 0.3 percent year over year in February versus -1.4 percent for their non-REIT competitors in the same markets nationwide. Public Storage led the REITs, increasing advertised rates 2.8 percent year over year.
See February 2025 Year-Over-Year Rent Change for Main Unit Sizes.
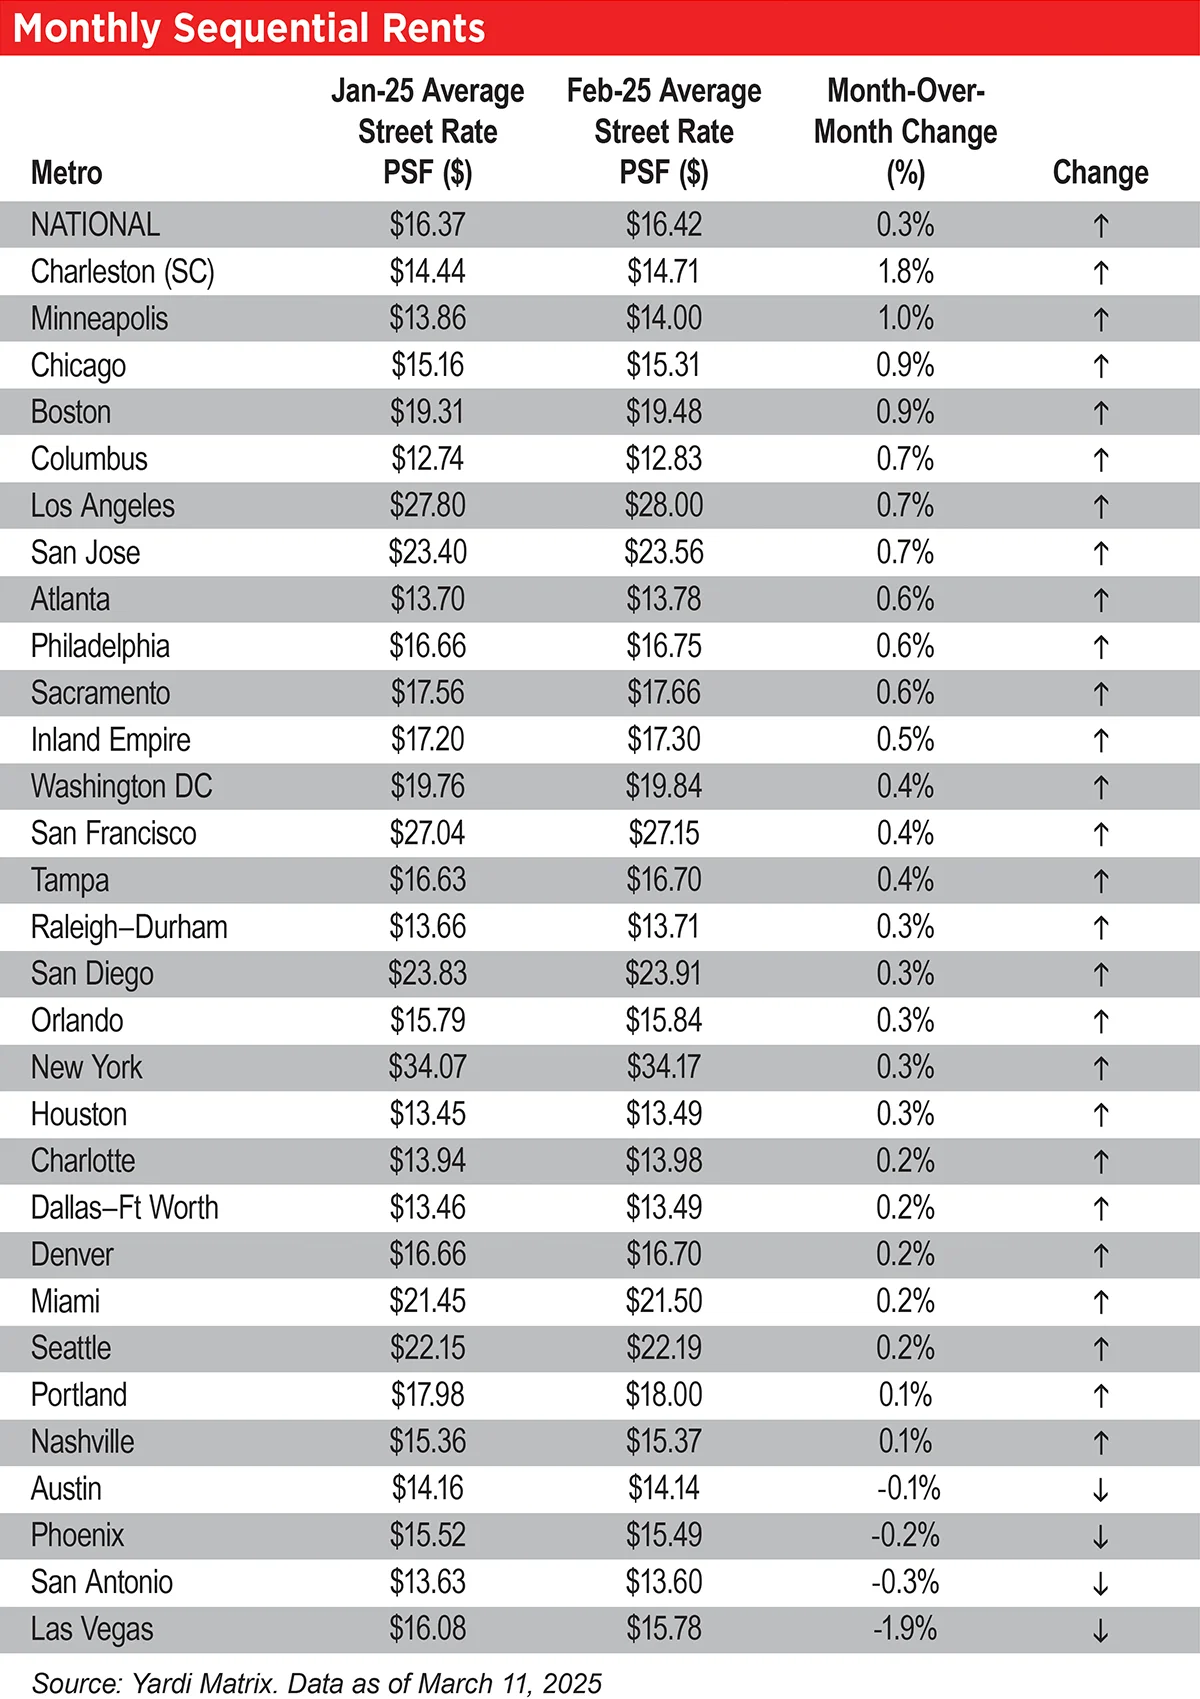
The increase in sequential asking rates was also broad-based across markets, with same-store advertised rates rising month over month in 26 of the top 30 metros in February. The remaining four top metros saw rates fall month over month.
Charleston led the other top metros in month-over-month advertised rate growth, up 1.8 percent in February. Charleston benefits from a recent major slowdown in lease-up supply and supply under construction, as well as strong migration and population growth.
See Monthly Sequential Rents Table.
See National Average Street Rates PSF for Main Unit Types.
Tampa continued to have the strongest year-over-year advertised rates of Yardi’s top metros in February. Advertised rates increased 3.1 percent, an improvement from 2.0 percent in January. The metro still benefits from hurricane-driven demand, despite having among the greatest amount of supply in lease-up, as well as supply under construction.
See Self-Storage Major Metro Summary.
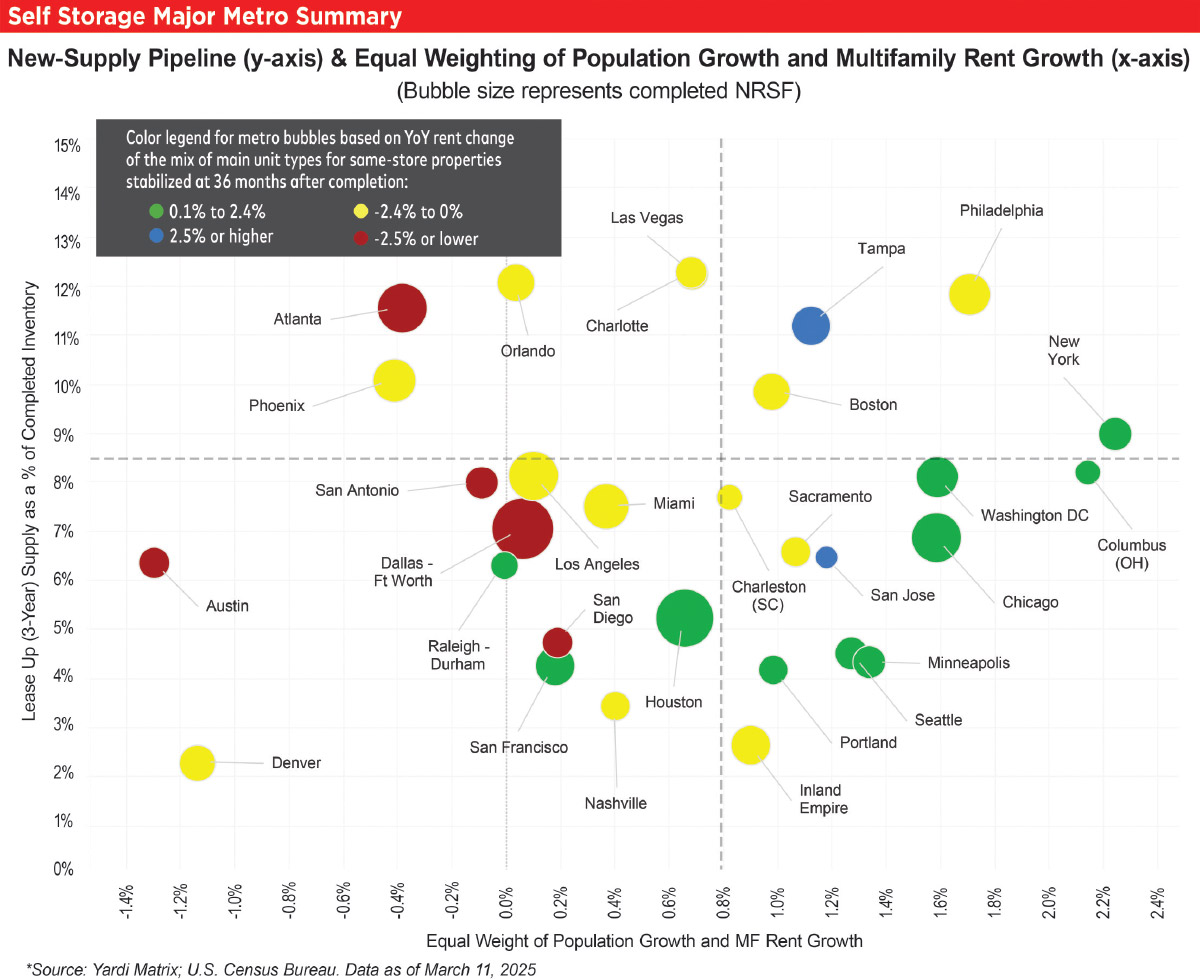
The majority of Yardi Matrix’s top 30 metros have a lower level of lease-up supply than the national average, indicating that new supply has recently shifted towards smaller markets outside the top 30. However, new construction starts in the last year have shifted back to the top 30 metros, so this trend will likely be temporary.
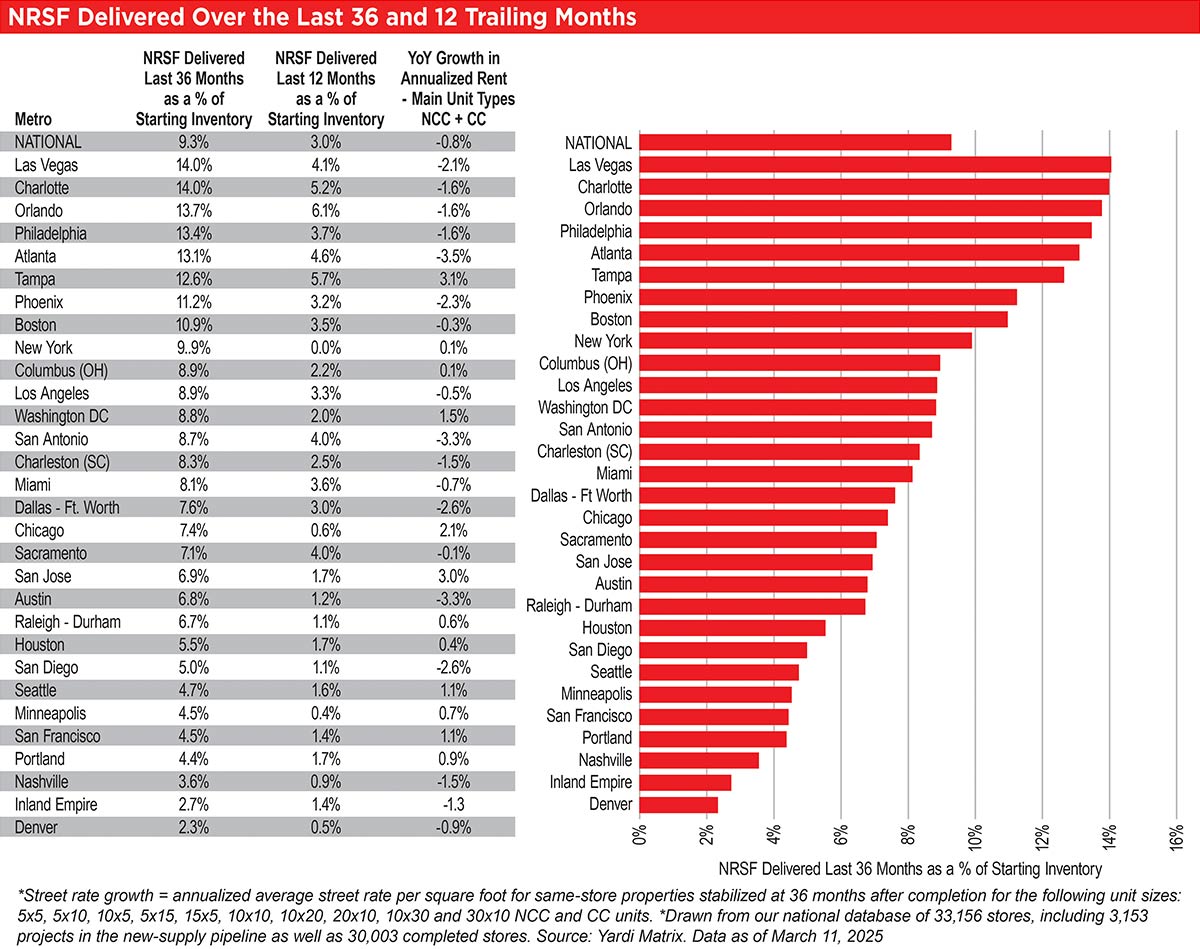
Atlanta has seen substantial new supply recently, with deliveries over the last 36 months equal to 13.1 percent. Due to this influx of new supply, advertised rates have faced downward pressure, and Atlanta had the weakest rate performance in February, down 3.5 percent year over year.
See NRSF Delivered Over the Last 36 and 12 Trailing Months.
Washington, D.C., had the largest decrease in construction activity, contracting 1.0 percent month over month. With a construction pipeline equal to 4.9 percent of existing stock, the metro has had limited new supply growth over the past year, which has helped support advertised rate performance. However, there is uncertainty in the future performance of Washington, D.C., due to recent job cuts, especially as rate improvement has decelerated in recent months.
Phoenix has the most supply under construction, equal to 6.6 percent of existing stock through the end of February. Phoenix has seen construction activity increase over the past year, despite the metro already dealing with heavy existing supply and robust supply in lease-up. The ongoing construction pipeline will likely continue to create headwinds for advertised rates in Phoenix.
See Under-Construction Supply by Percentage of Existing Inventory.
See Monthly Rate Recap.