Self-Storage
Report
autious sentiment shapes the self-storage market in 2026. Yardi Matrix recently attended the NYSSA Investment Forum and KeyBanc Capital Markets events in New York and the SSA Ski Workshop in Aspen. The overall tone to start the year is more cautious than in prior years, reflecting sustained weakness in self-storage demand driven by historically low home sales and supply pressure in select markets and submarkets. Rents, occupancy, and revenues remain under pressure, leading investors to adopt more conservative underwriting assumptions around rent growth, lease-up timelines, and exit cap rates. While fundamentals are challenged, capital availability is not: Both debt and equity remain plentiful for experienced investors and operators, though capital is increasingly selective and deal flow has been constrained by consistent loan extensions and a surge in bridge lending. Although asking rents appear to have bottomed nationally, they are still well behind in-place rates, and the recovery will be gradual and uneven in 2026, favoring markets with low supply and improving housing conditions.
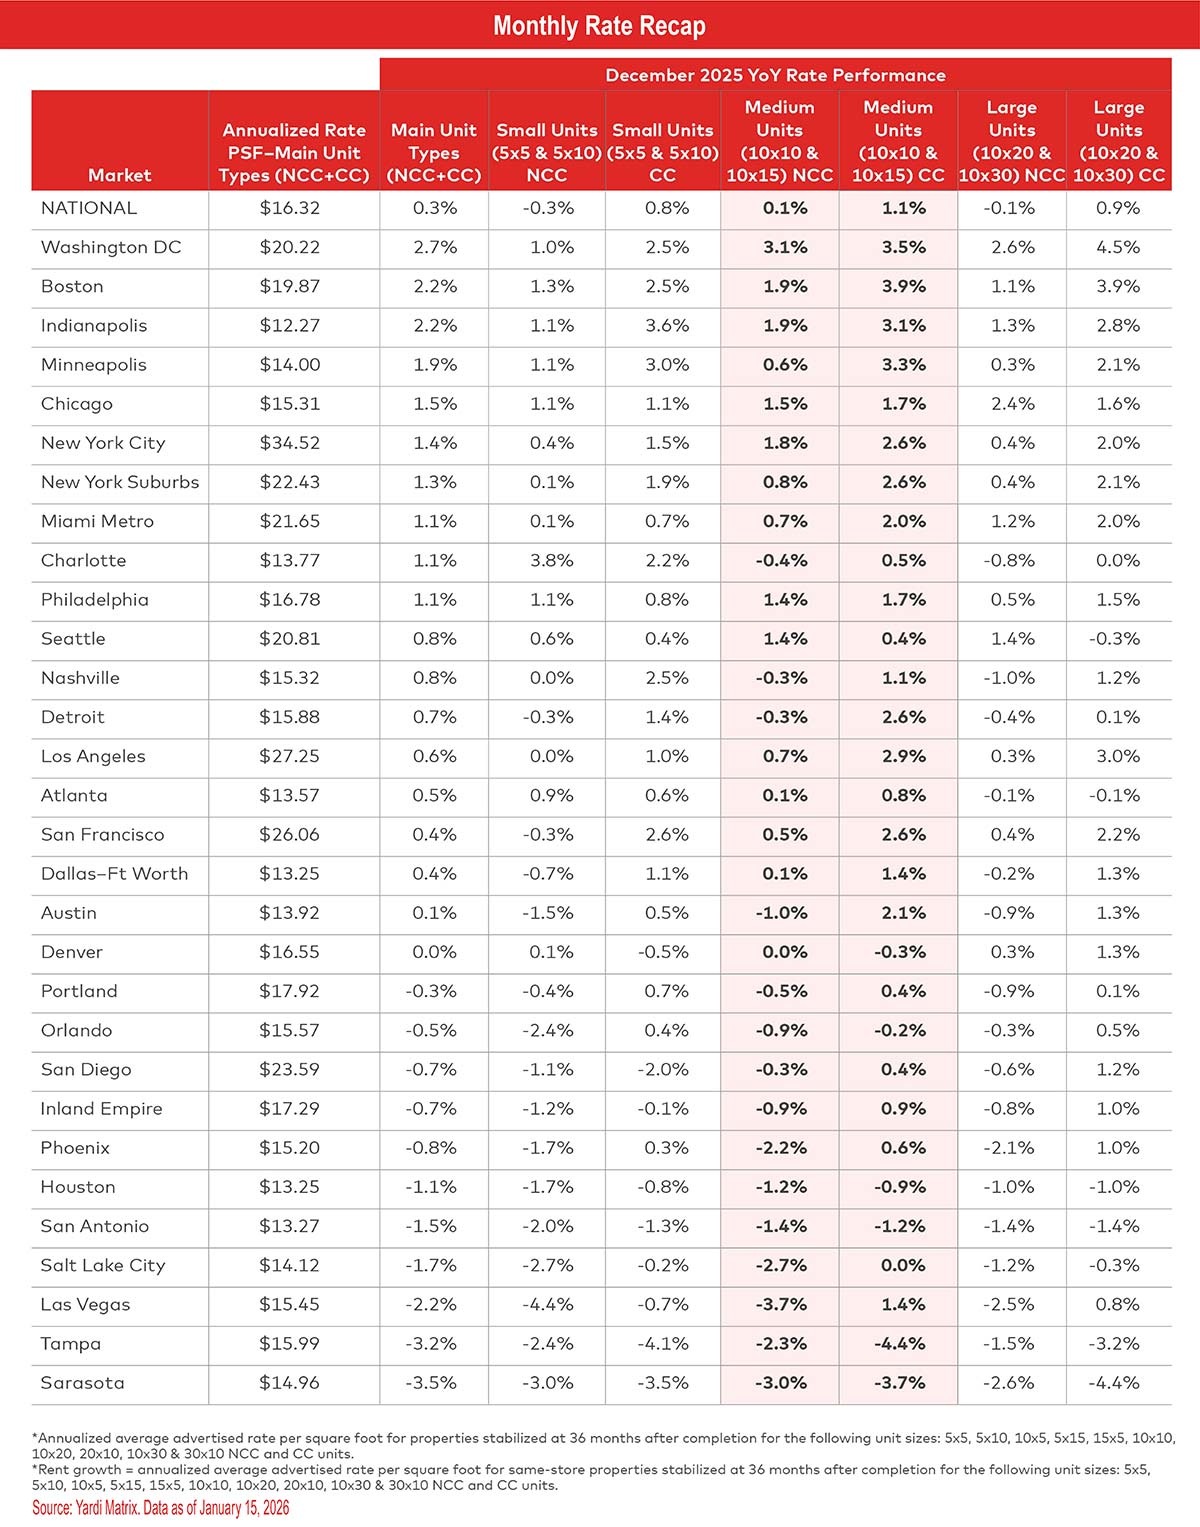
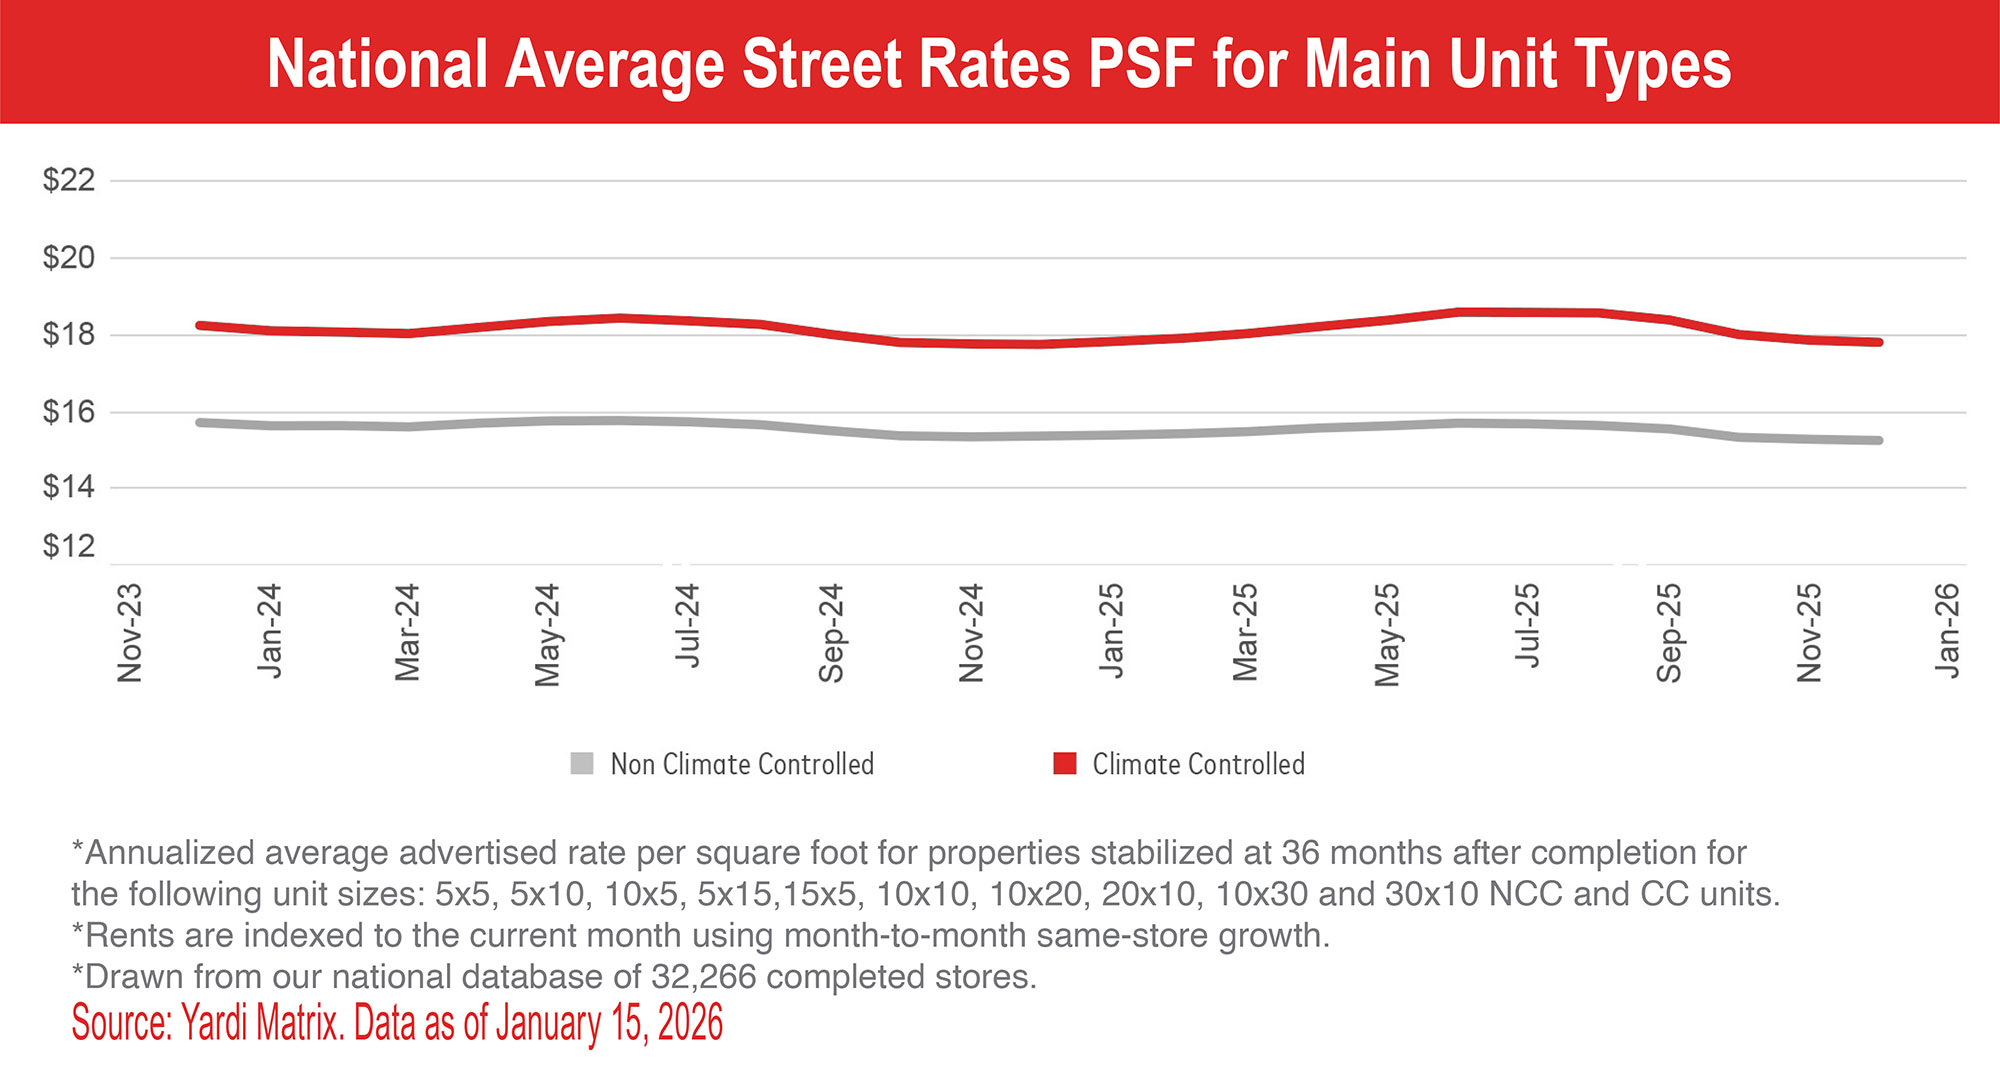
Rates continue to rise annually, but growth moderates further in December. Nationally, advertised rents increased 0.3 percent year over year in December, extending the trend of annual growth. However, this pace reflects a slowdown from earlier in the fourth quarter, when rents rose 0.6 percent in both October and November. In December, the national average rent reached $16.32 per square foot across all unit sizes and types.
Roughly half of Yardi Matrix’s top 30 metros posted lower annual rate growth in December than November. Same-store advertised rates for non-climate-controlled (NCC) units increased in 15 of the top 30 metros. For climate-controlled (CC) units, rates increased in 23 of the top 30 metros year over year.
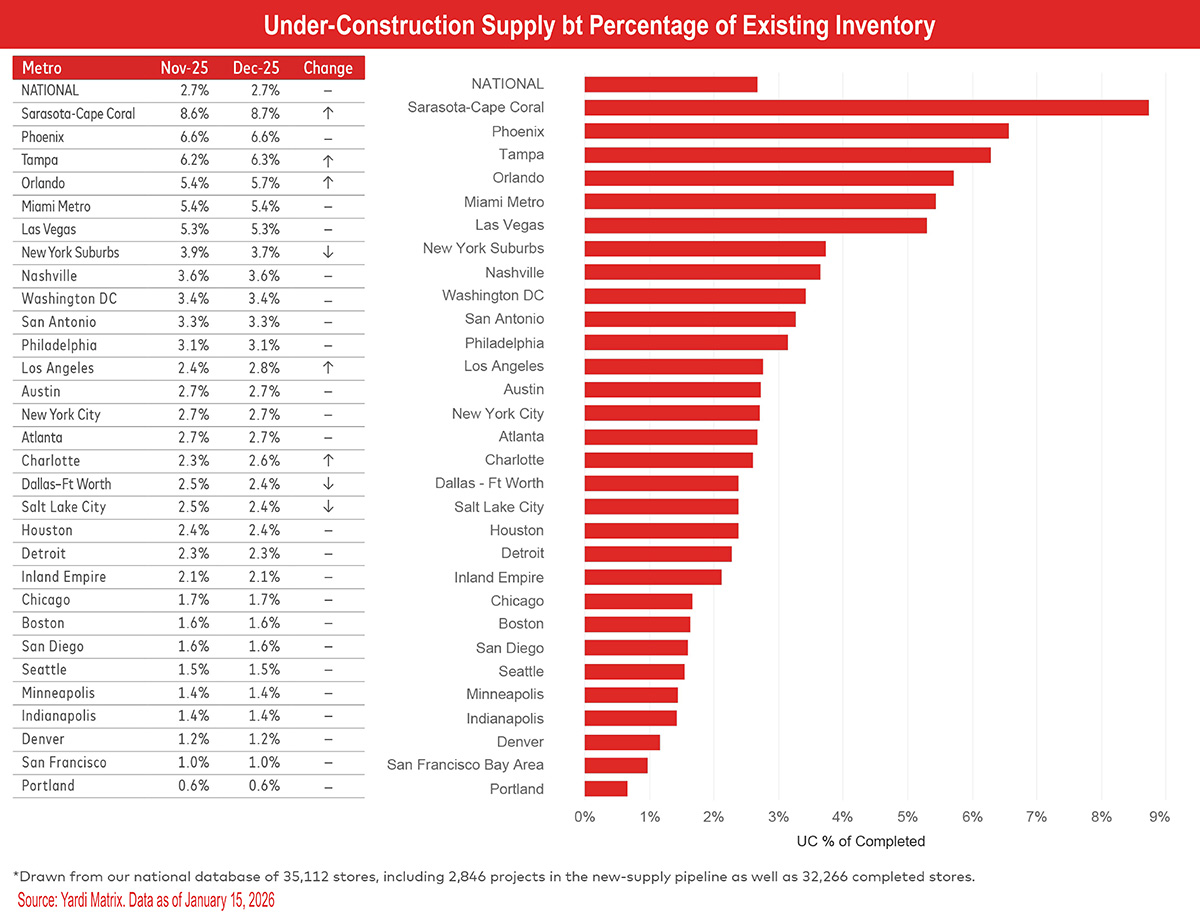
Nationally, Yardi Matrix tracks a total of 2,846 self-storage properties in various stages of development, including 730 under construction, 1,796 planned, and 320 prospective properties. The share of projects (net rentable square feet) under construction nationwide was equivalent to 2.7 percent of existing stock through December, unchanged from November.
Yardi Matrix also maintains operational profiles for 32,266 completed self-storage facilities in the U.S., bringing the total dataset to 35,112. We are happy to announce the expansion of our existing Little Rock, Ark., storage market, now available to Yardi Matrix customers on the subscriber portal.
While CC units once again outperformed NCC units in December, both unit types saw a deceleration in annual growth compared to last month. NCC asking rates decreased 0.1 percent year over year, a slowdown from November’s increase of 0.2 percent, while CC rates rose 0.9 percent year over year, down from 1.0 percent in November.
Advertised rents at stabilized properties among all self-storage REITs were up 1.4 percent year over year versus -0.2 percent for their non-REIT competitors in the same markets nationwide. However, REIT rent growth has also slowed over the past two months, down from 2.2 percent in November and 2.0 percent in October, as operators pulled back on pricing amid weaker leasing conditions.
See December 2025 Year-Over-Year Rent Change for Main Unit Sizes.
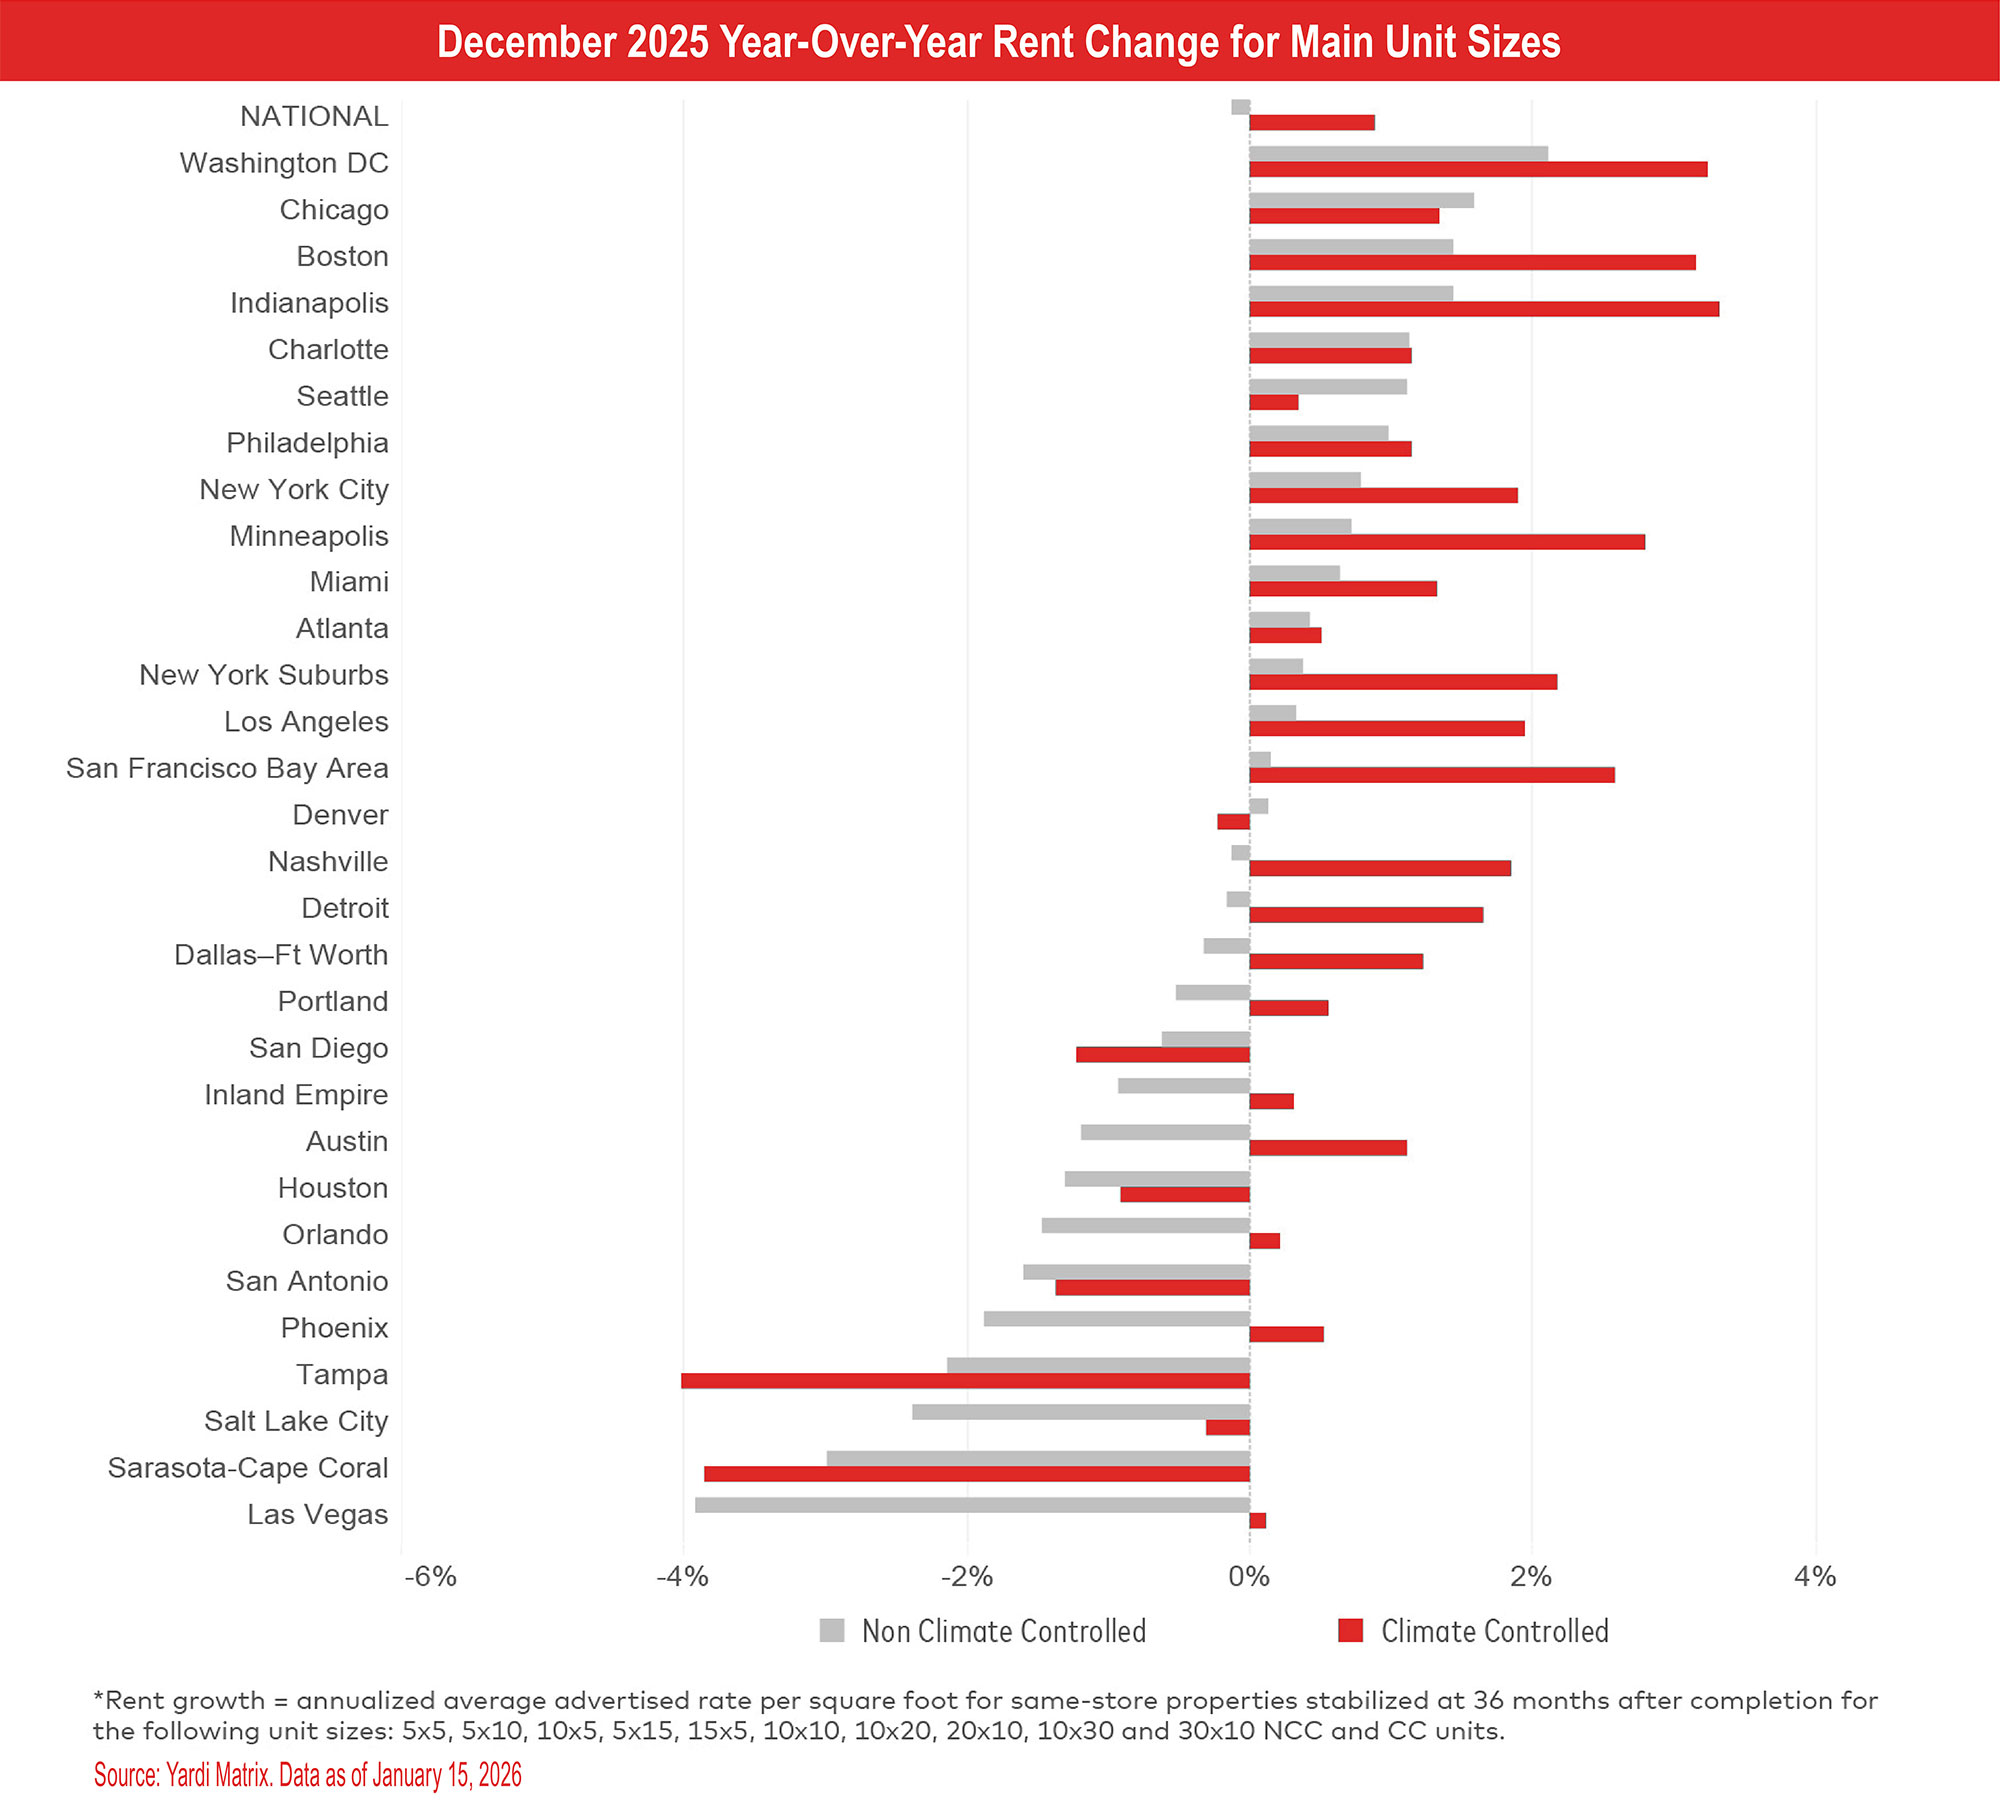
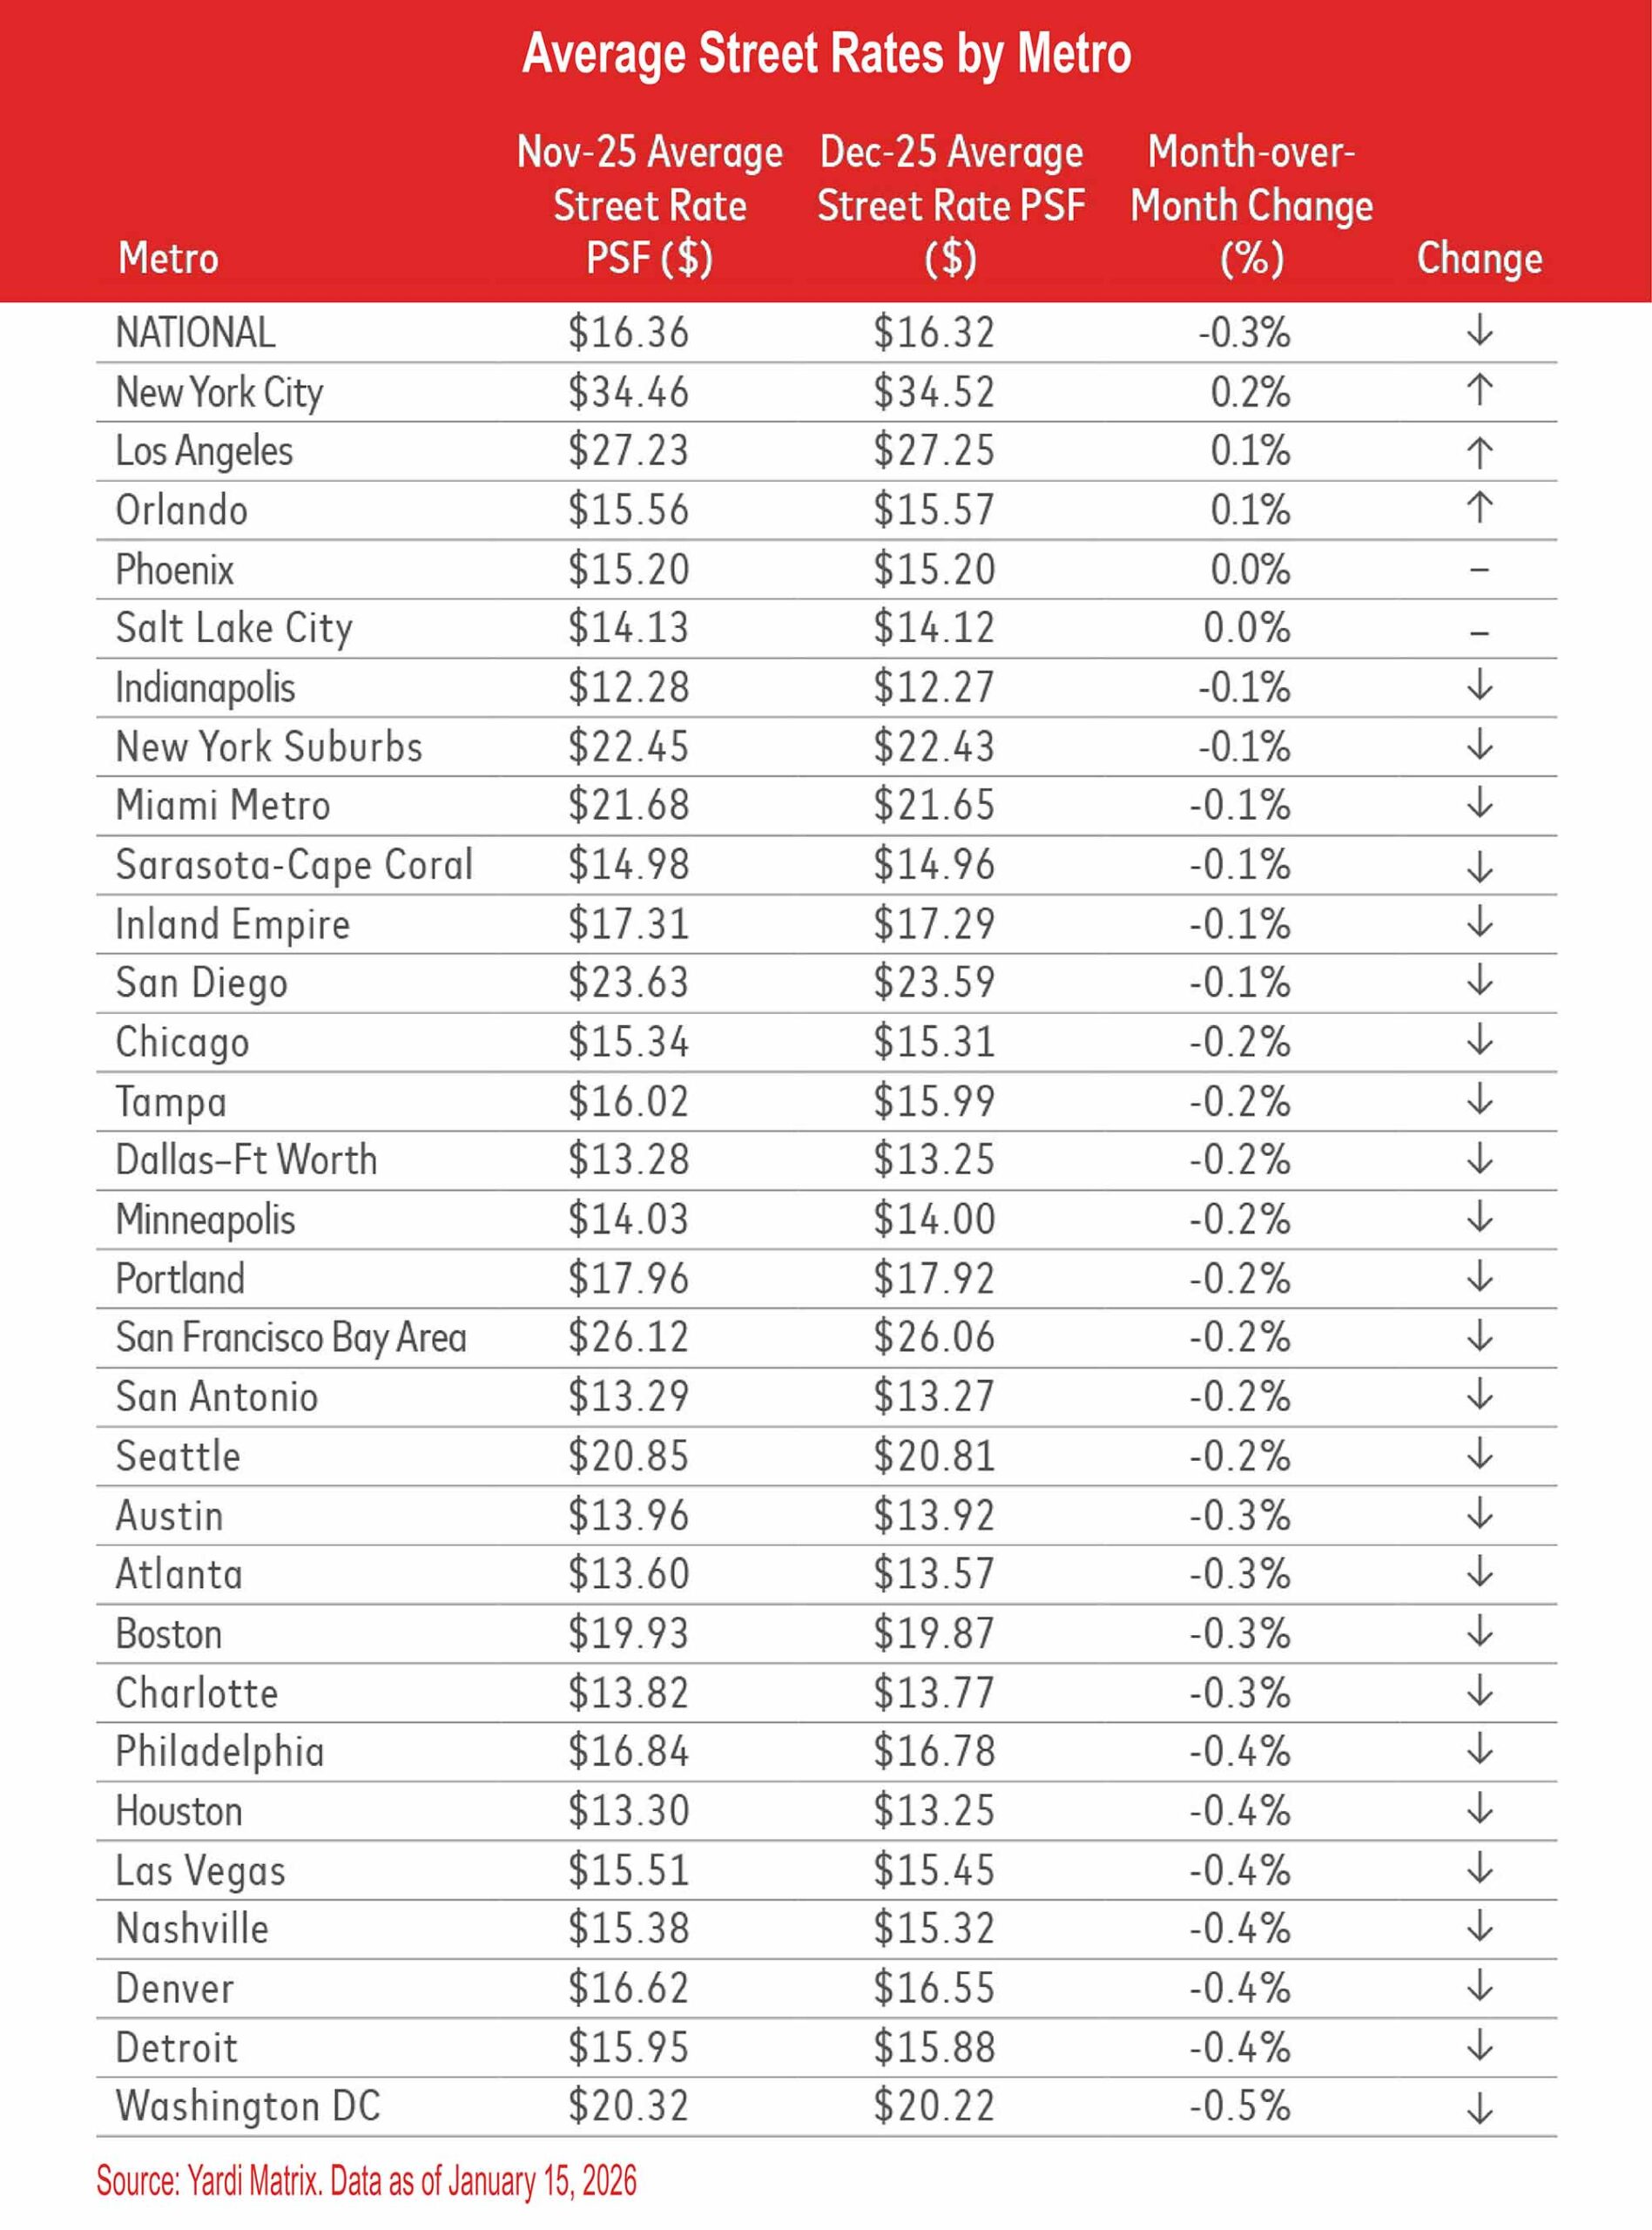
Advertised rents fell month over month in 25 of the top 30 metros in December. New York City saw rent growth month over month in December for the second year in a row, marking a shift in momentum from -0.8 percent growth in November.
Despite leading in year-over-year advertised rate growth, Washington, D.C., posted one of the largest month-over-month decreases (-0.5 percent), signaling a seasonal slowdown in demand. This trend is not supply-driven but reflects weaker winter demand patterns, typical for this market due to factors like reduced intern activity outside peak summer months.
See Average Street Rates by Metro Table and National Average Street Rates PSF for Main Unit Types Chart.
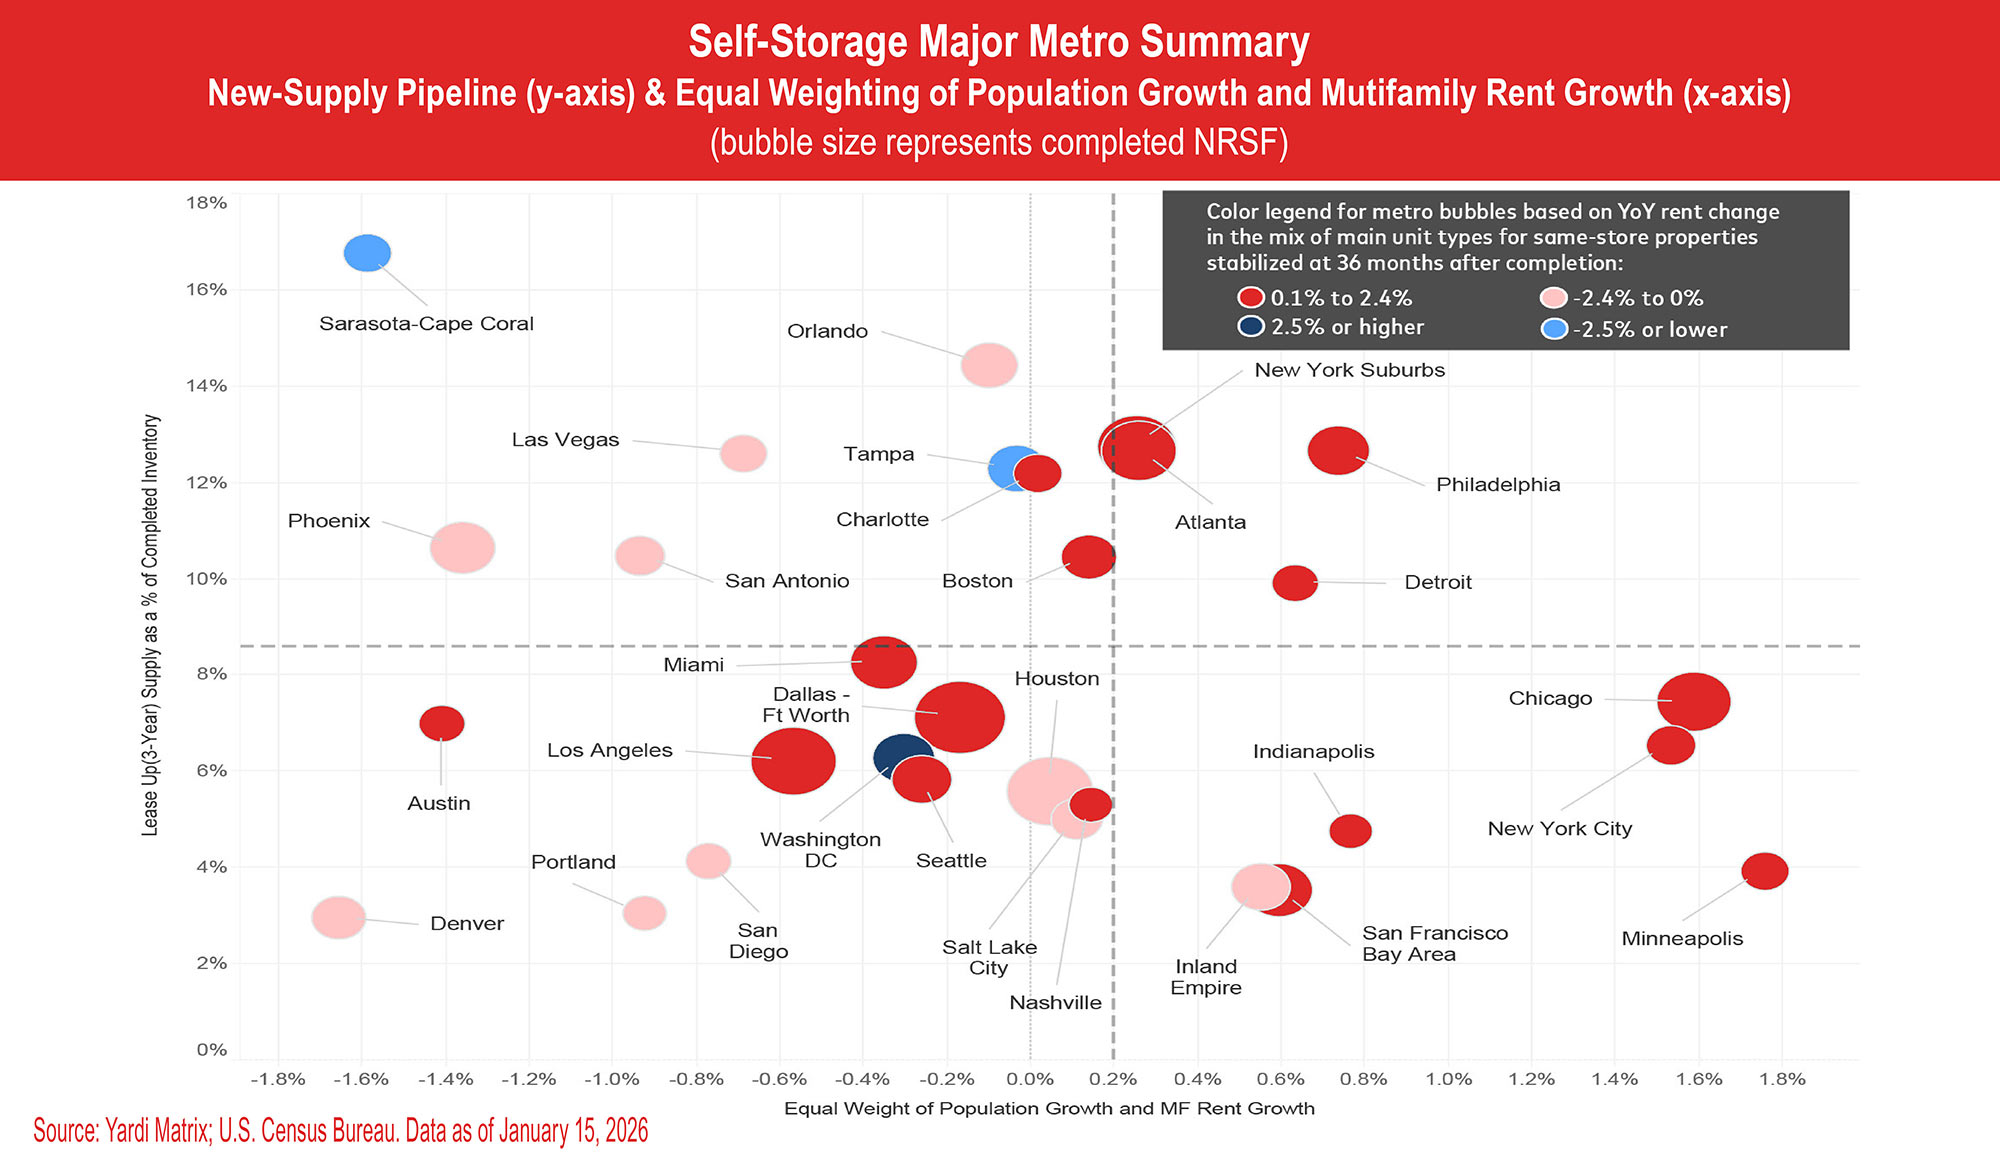
Meanwhile, top metros including Denver, Portland, and San Diego are clustered in the lower-left portion of the chart, reflecting weaker population growth and slower multifamily rent growth. These markets continue to see weaker advertised rates even when new supply is limited.
Overall, the chart underscores that future rate growth is likely to remain uneven, with stronger performance concentrated in markets supported by sustained multifamily demand rather than those benefiting only from slower supply growth.
See Self-Storage Major Metro Summary Chart.
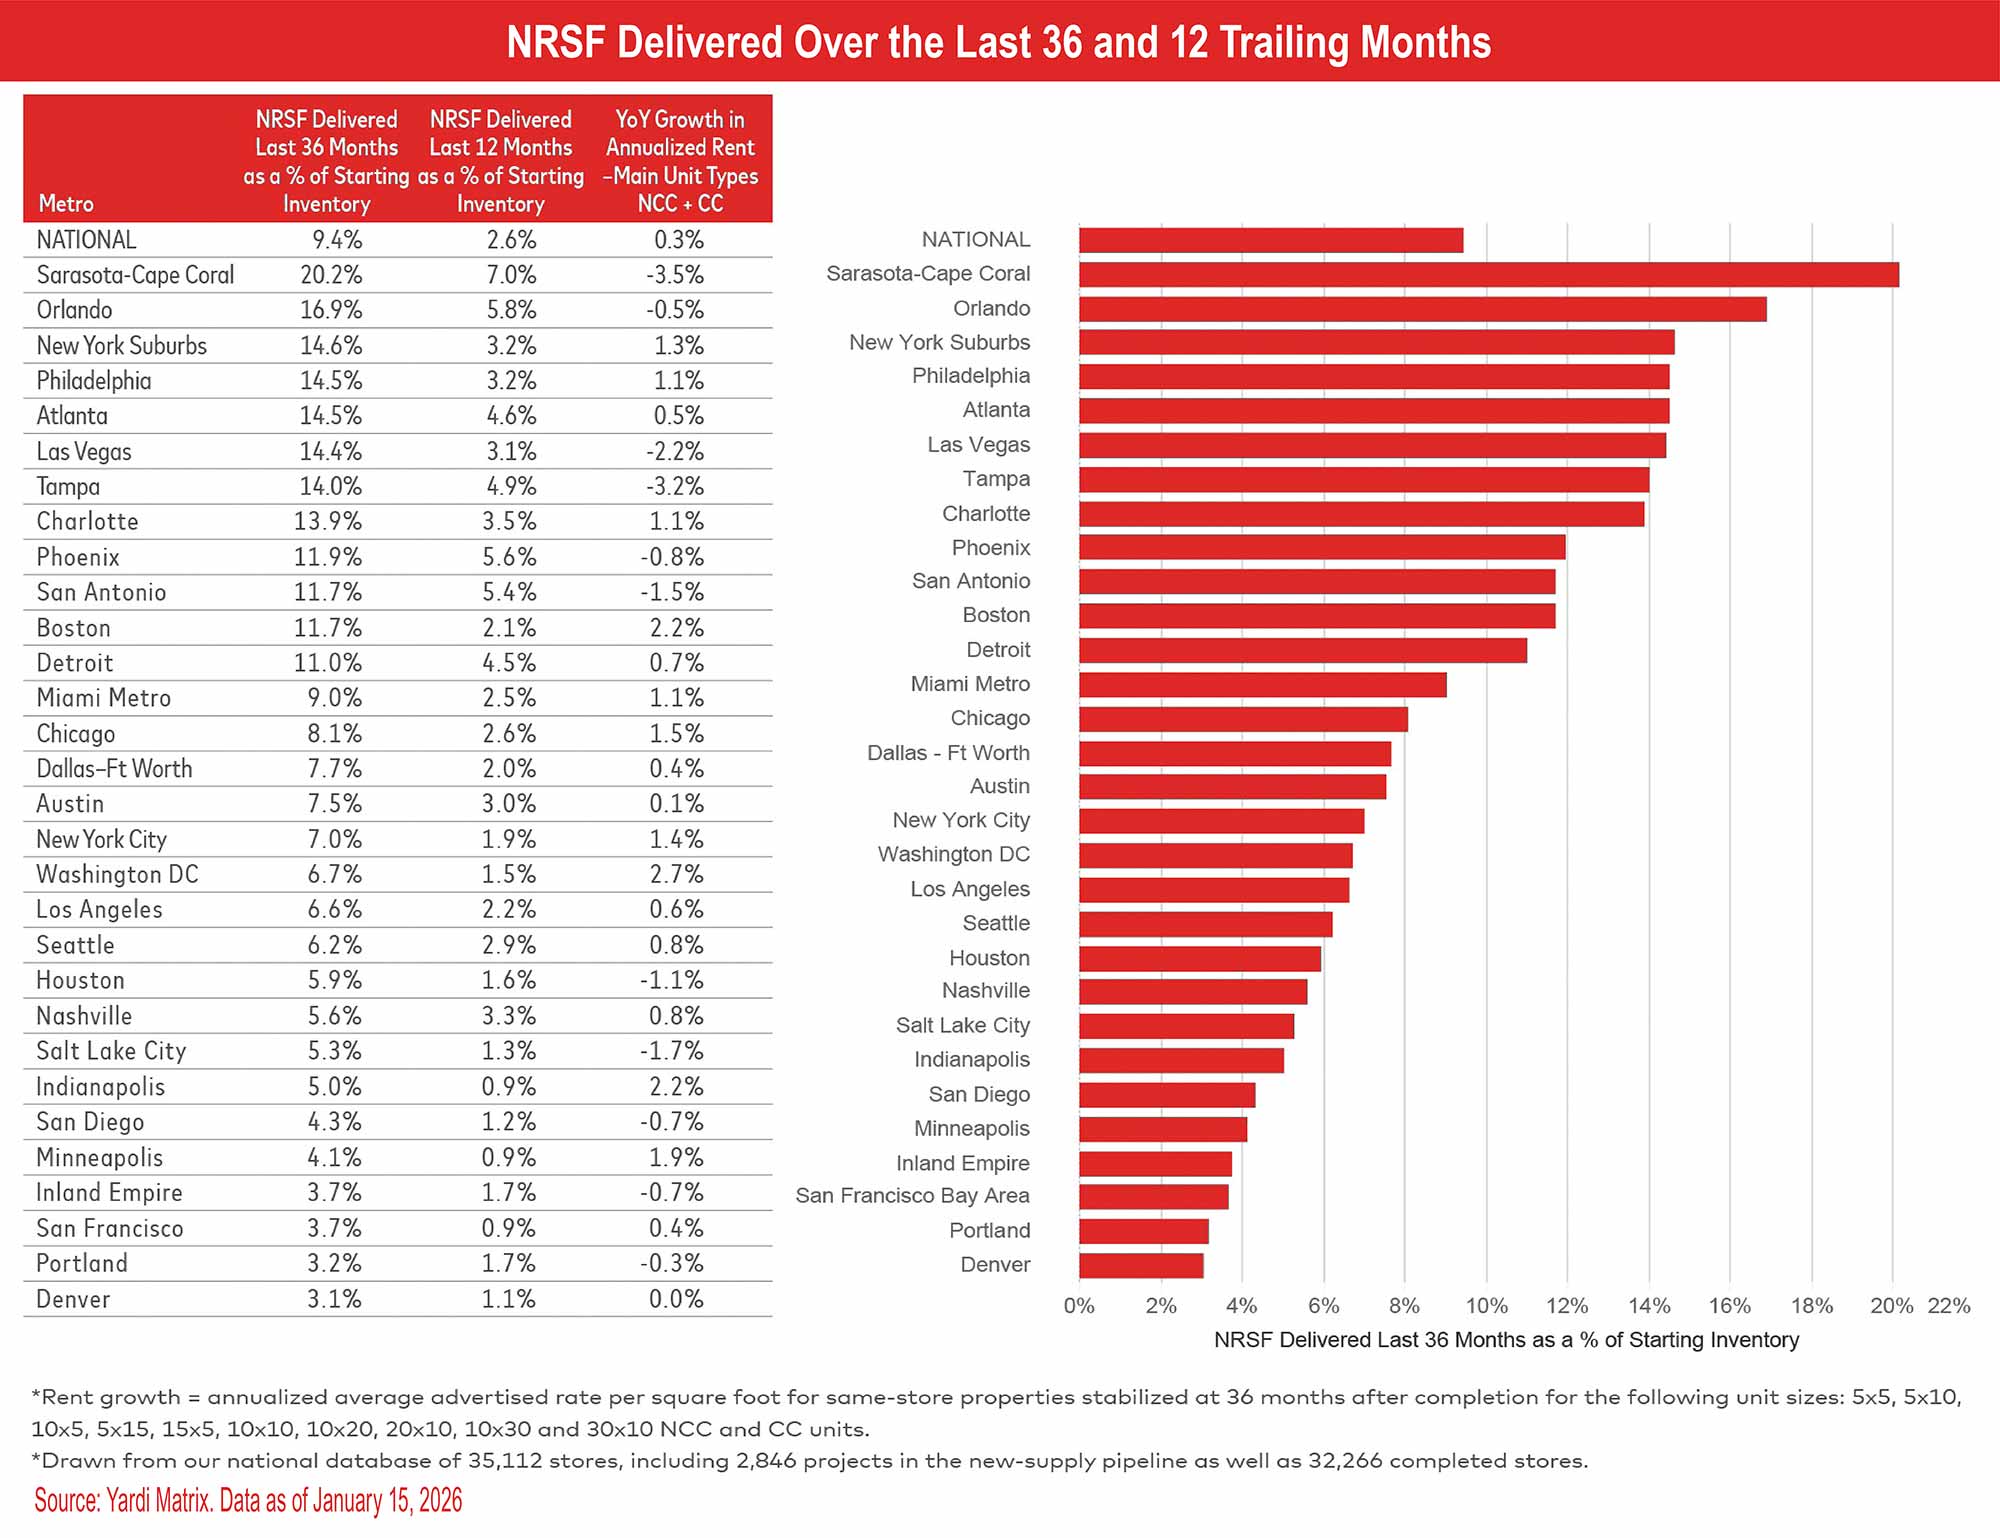
At the metro level, 16 of Yardi Matrix’s top 30 metros had more lease-up supply in December 2025 compared to December 2024, led by Orlando, San Antonio, and Detroit.
Despite having one of the highest trailing three-year supply levels, the New York suburbs continue to post above-average advertised rent growth, supported by historically undersupplied conditions and robust demand fundamentals. Recent supply deliveries have been concentrated in Northern New Jersey, while areas like Westchester County and Long Island remain relatively constrained, contributing to sustained strength in advertised rate performance.
See NRSF Delivered Over the Last 36 and 12 Trailing Months Table and Chart.
Compared with December of last year (2.8 percent), under-construction activity is essentially flat. This stability likely reflects longer construction timelines and slower winter building activity.
While national supply levels remain steady, metro-level trends are mixed. Several top metros, including Nashville, San Antonio, Philadelphia, New York City, Atlanta, Detroit, and Seattle, have seen notable declines in under-construction supply over the past year. Conversely, top metros such as Miami, Las Vegas, Salt Lake City, Washington, D.C., and Tampa recorded increases.
Several Sun Belt markets continue to exhibit elevated construction pipelines, even as development has become more expensive and harder to underwrite. Miami, Tampa, Phoenix, Sarasota-Cape Coral, and Las Vegas stand out for maintaining or increasing under-construction supply, reflecting continued developer interest.
See Under Construction Percent of Existing Inventory Table and Chart.