he total value of U.S. self-storage real estate declined to approximately $432 billion in 2025, representing a roughly 2 percent decrease year over year. Slower demand recovery, muted rate growth, and elevated operating costs continued to pressure valuations across the sector.
After years of outsized growth, 2025 marked another period of normalization for self-storage. While fundamentals remain structurally sound long term, near-term performance has yet to fully rebound. In Table 1, TractIQ breaks down how we estimate the total value of the industry and what the data signals for owners, investors, and brokers in 2026.
See Table 1.
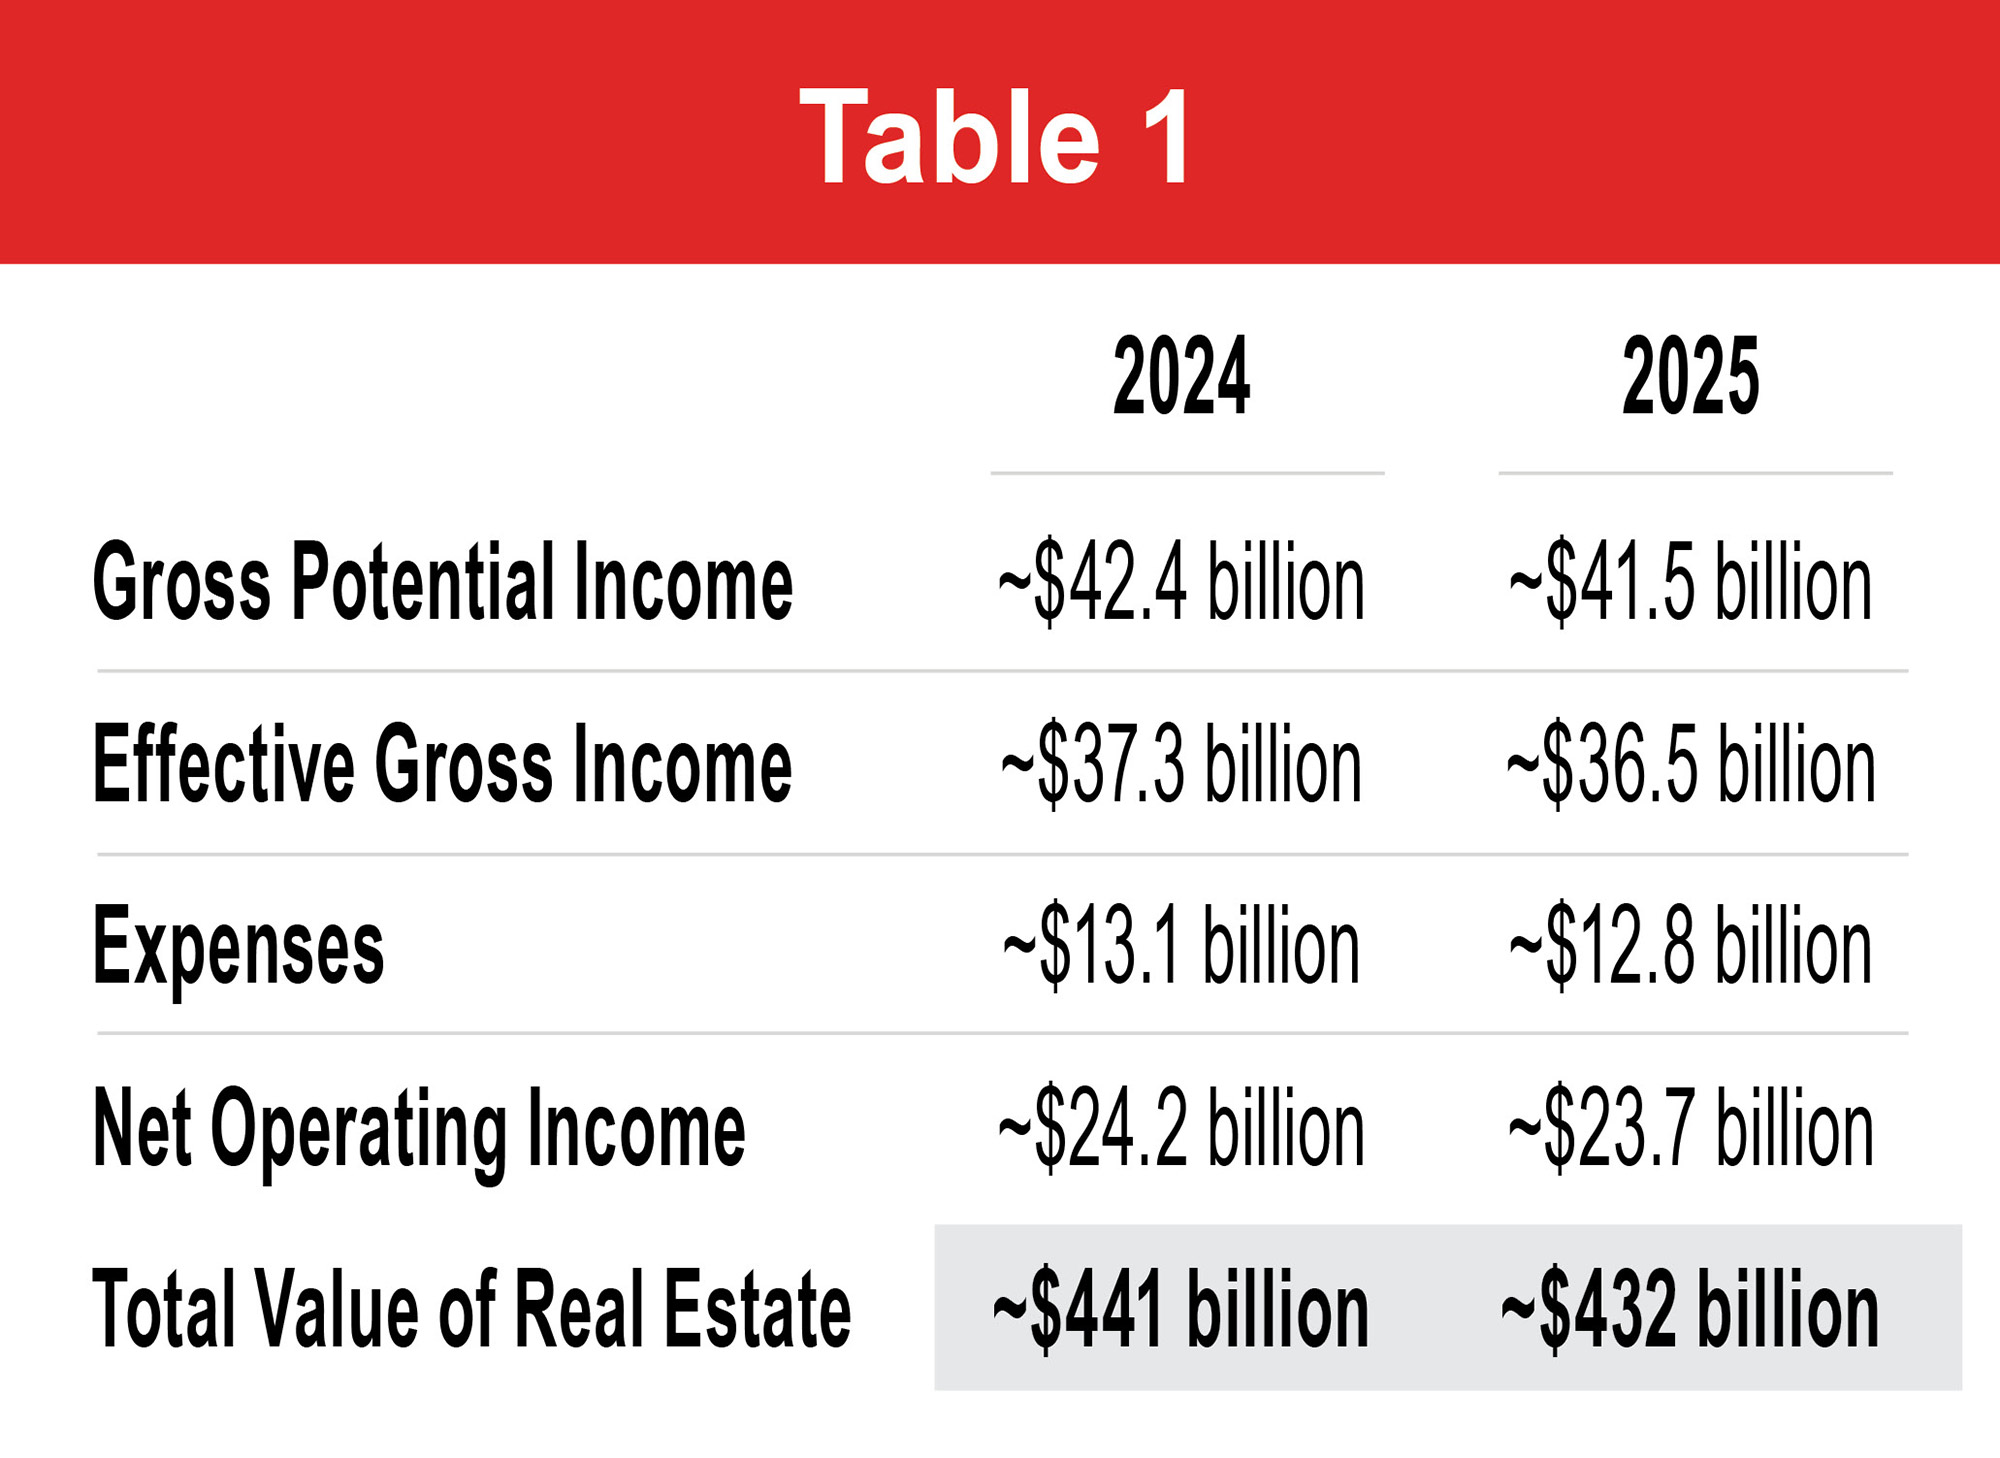
GPI also includes ancillary income from administrative fees, tenant insurance, billboards, retail sales, and other non-rent revenue streams. Based on Q3 2025 public filings, ancillary income for the five major publicly traded self-storage REITs ranged from approximately 3.8 percent to 13.0 percent of rental income. Because REITs represent a minority of total industry square footage, we conservatively applied a 3 percent ancillary income assumption across the broader market.
In 2025, achieved rates often exceeded street rates due to existing customer rent increases. According to TractIQ’s Q3 2025 Self-Storage REIT Report, achieved rates averaged 3.7 percent higher than advertised street rates. We intentionally excluded an achieved rate premium from this analysis due to the difficulty of consistently applying it across non-REIT operators. Including this premium would increase estimated industry value.
Effective Gross Income (EGI): This is the net revenue generated by the industry after applying vacancy and collection loss to GPI. For reference, the publicly traded storage REIT’s average occupancy rates for Q3 2025 ranged from 84.5 percent to 93.7 percent. We’ve used an 88 percent occupancy rate in our analysis to account for collection loss in addition to physical vacancy.
Operating Expenses: Operating expenses include property taxes, insurance, payroll, management fees, utilities, marketing, repairs, and administrative costs. We applied a 35 percent operating expense ratio to EGI. For reference, the publicly traded storage REIT’s expense ratios for Q3 2025 ranged from 24.4 percent to 33.6 percent.
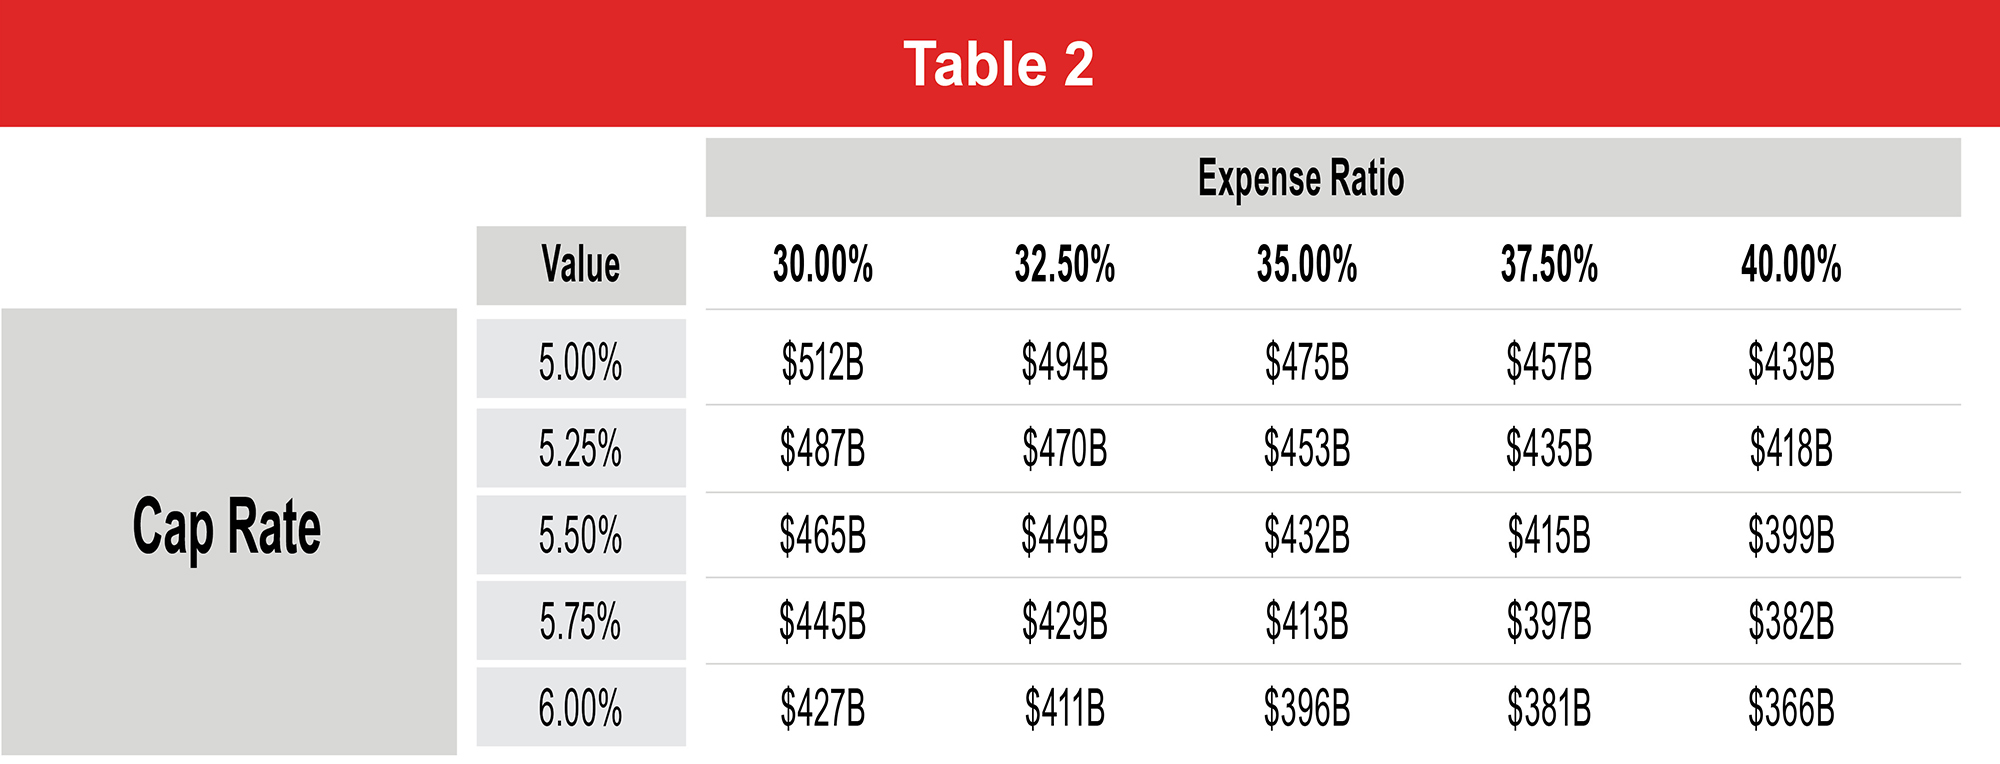
Net Operating Income (NOI) and Total Value of Real Estate: Net operating income is calculated as effective gross income minus operating expenses. To estimate total real estate value, we applied a 5.5 percent capitalization rate to industry-wide NOI. Table 2 illustrates how valuation changes across different cap rate and expense ratio scenarios.
See Table 2.
- Slowing new supply deliveries in oversaturated markets;
- Street rate stabilization following years of softness;
- Expense normalization, particularly insurance and payroll;
- Cap rate movement tied to interest rate policy; and
- Greater reliance on verified operating performance rather than proxy data.
In an environment where small changes in rates, occupancy, or expenses materially impact value, access to accurate facility-level data has never been more important. TractIQ remains focused on delivering the most comprehensive and transparent self-storage intelligence platform as the industry moves into its next phase.