
egative annual rate growth spreads across all top metros. A Yardi team recently attended the SSA Spring Conference in San Antonio and ISS World Expo in Las Vegas. The tone was more subdued than in recent years, reflecting muted performance to start the year. Few near-term catalysts for a meaningful turnaround in demand are evident, as a historically weak housing market and ongoing development continue to pressure rental rates, especially in Sun Belt markets already struggling to absorb excess supply. One bright spot is increased investment activity, with a wave of portfolio deals in recent months culminating in Public Storage’s $10.7 billion acquisition of National Storage Affiliates. Yardi Matrix analysis of the 1,000-plus property portfolio indicates the deal will raise Public Storage’s management share to 16 percent of net rentable square footage nationally, expanding its footprint in existing markets and adding exposure to 20 smaller MSAs. The transaction also underscores continued sector consolidation and the growing importance of scale.
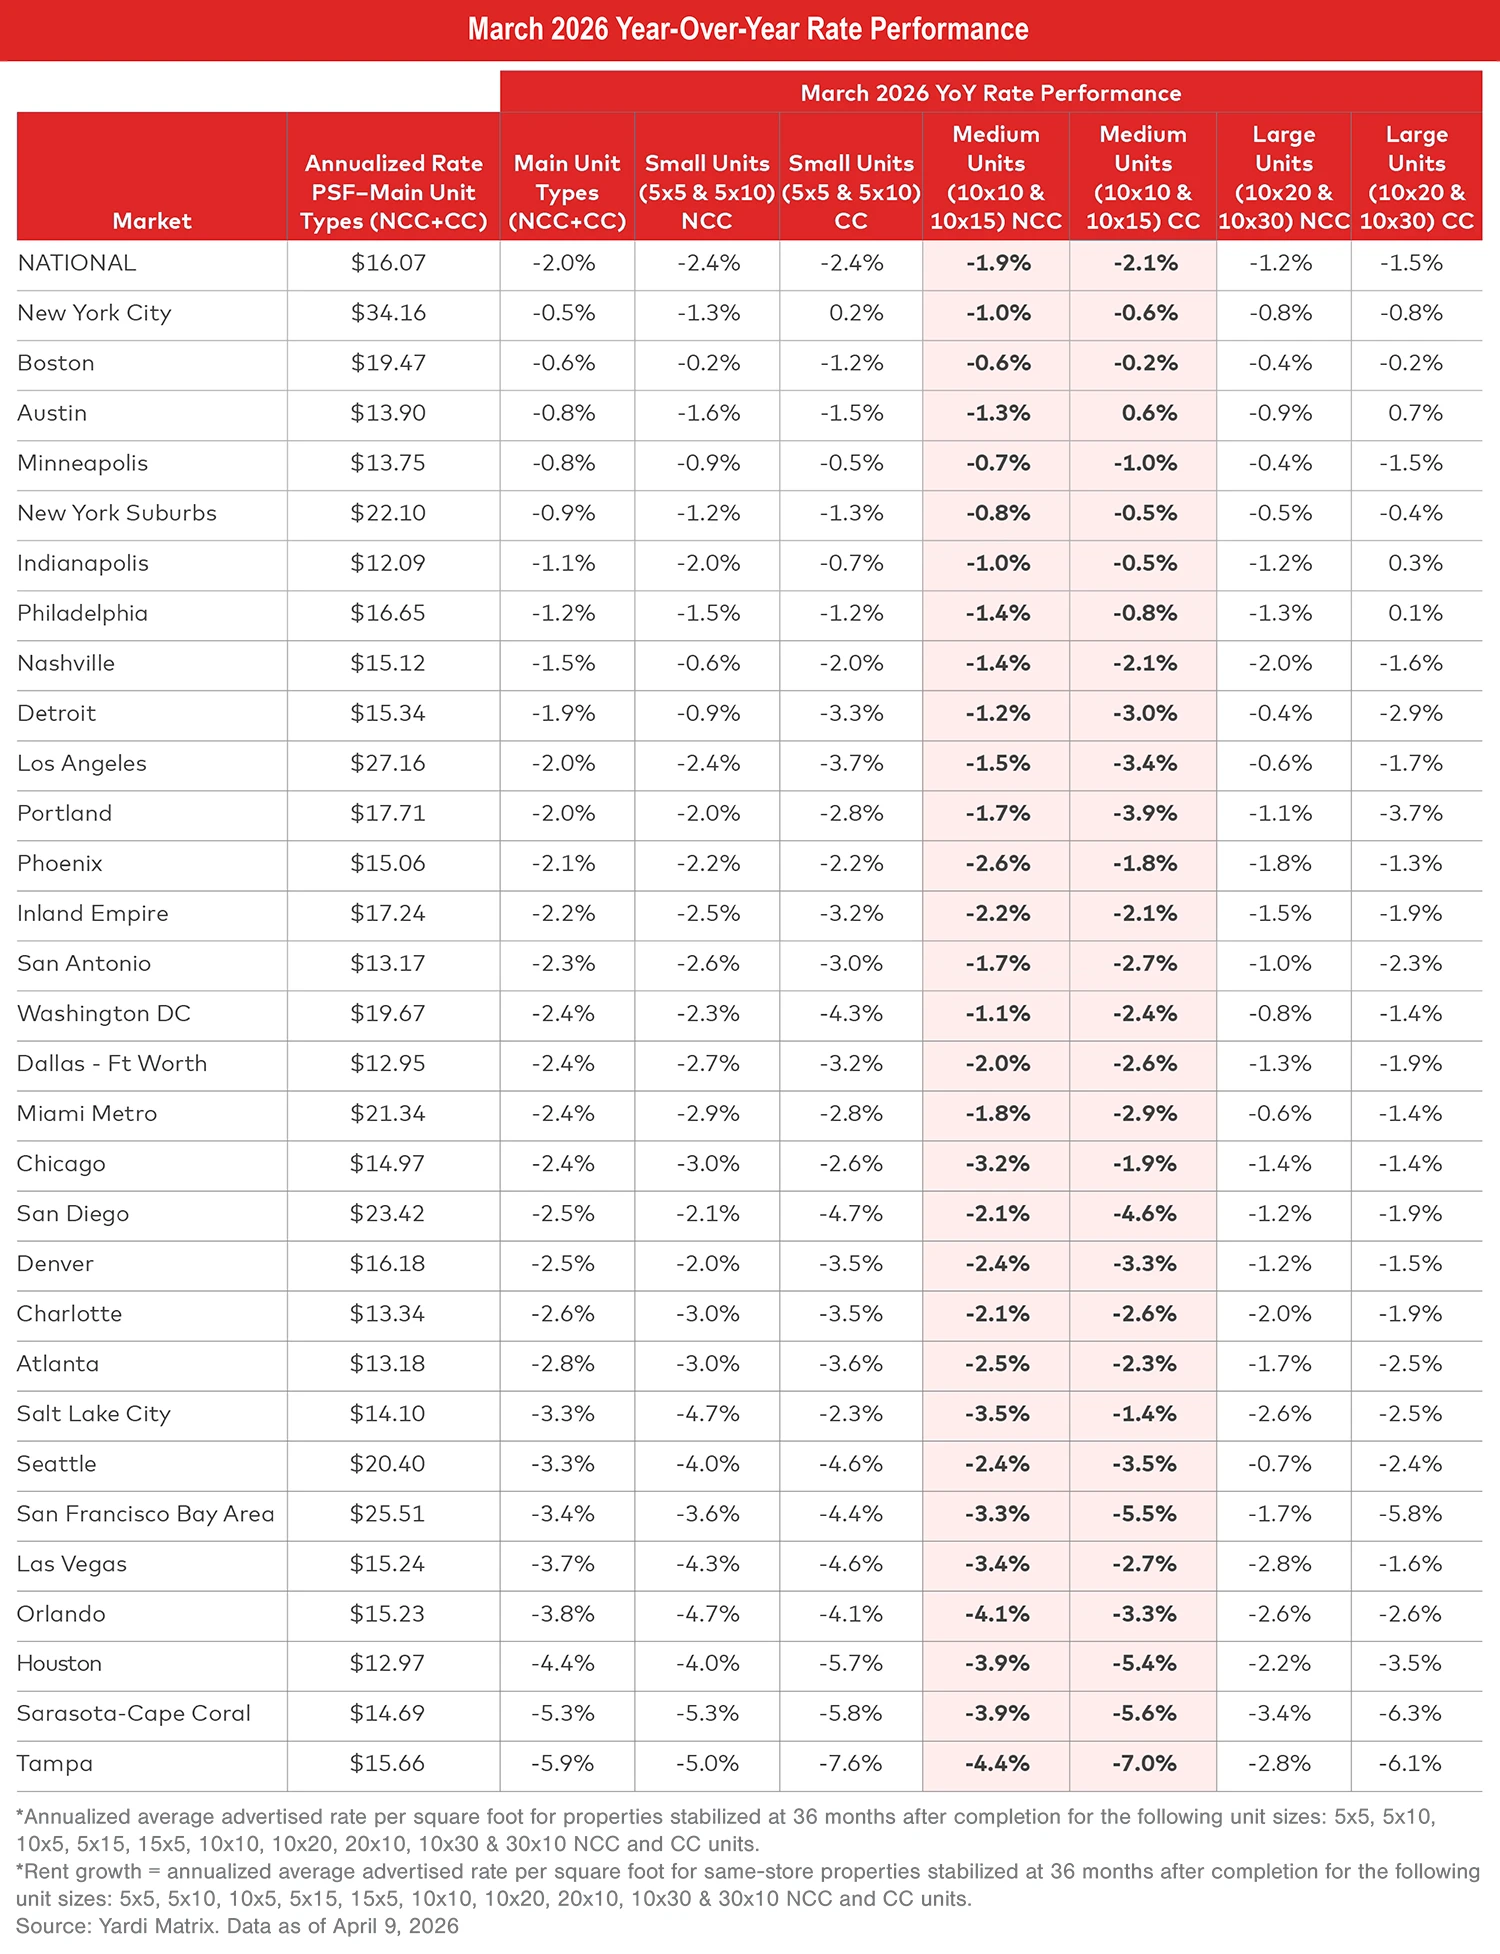
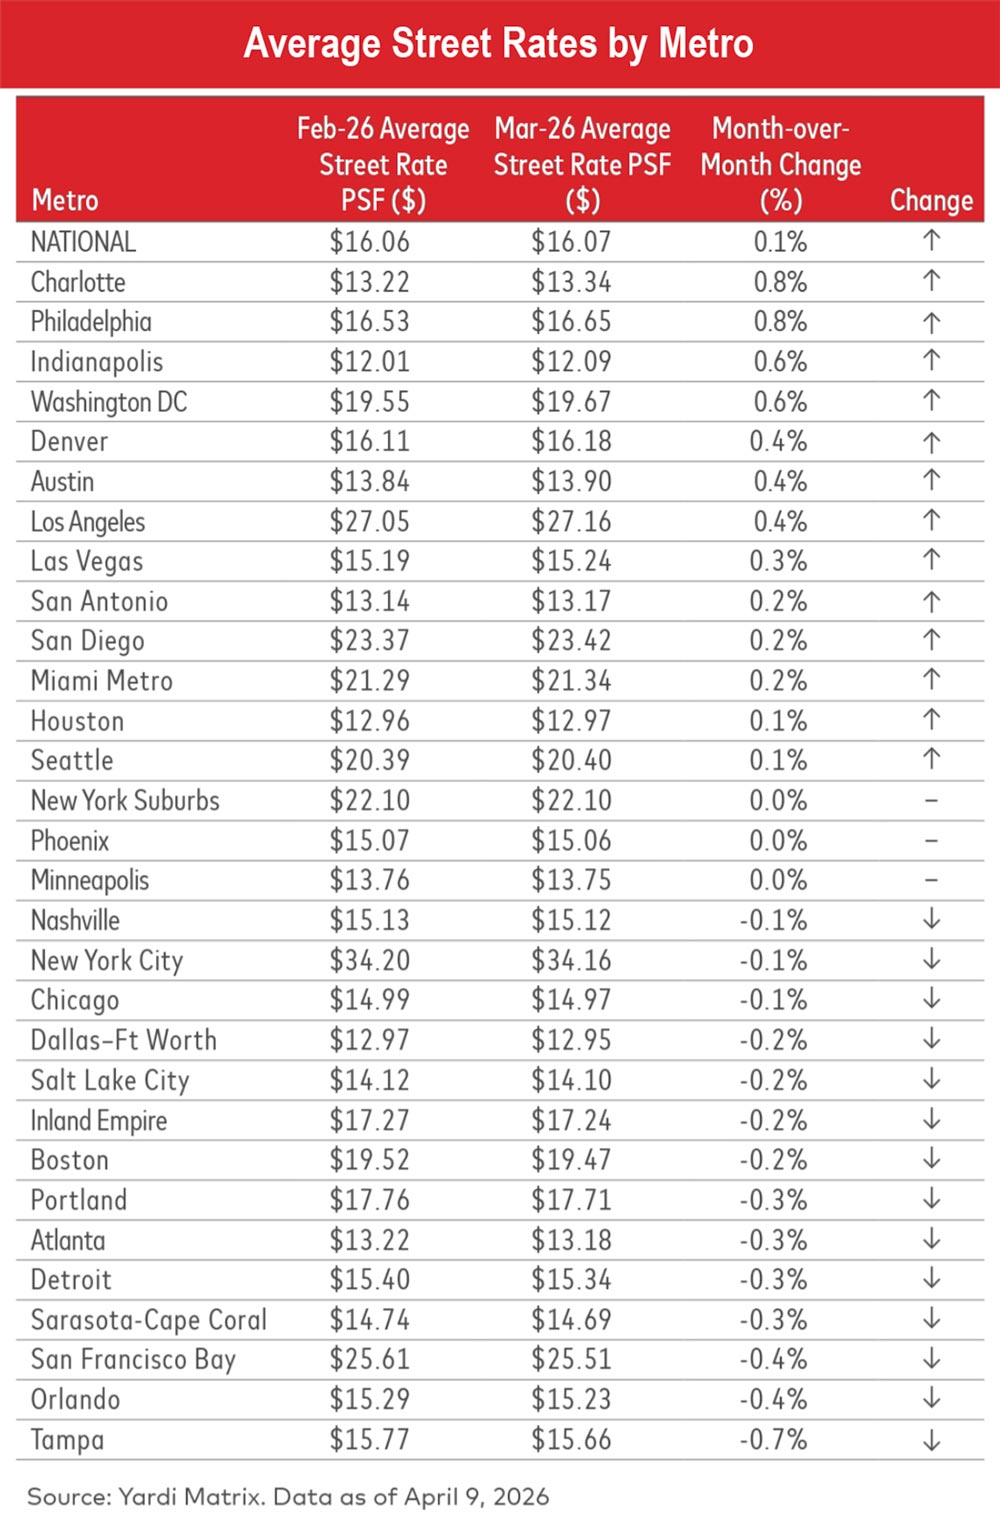
Advertised rates decline further as annual growth continues to slow. Annual growth for advertised rates decelerated further in March. Nationally, advertised rates decreased 2.0 percent in March, down from -1.2 percent in February and -0.4 percent in January. The national average rate for March was $16.07 per square foot across all unit sizes and types. Nearly all of Yardi Matrix’s top 30 metros had lower year-over-year rate growth in March compared to February, with all top metros experiencing negative annual growth. Same-store advertised rates for both non-climate-controlled (NCC) and climate-controlled (CC) units across all 30 top markets decreased compared to last year.
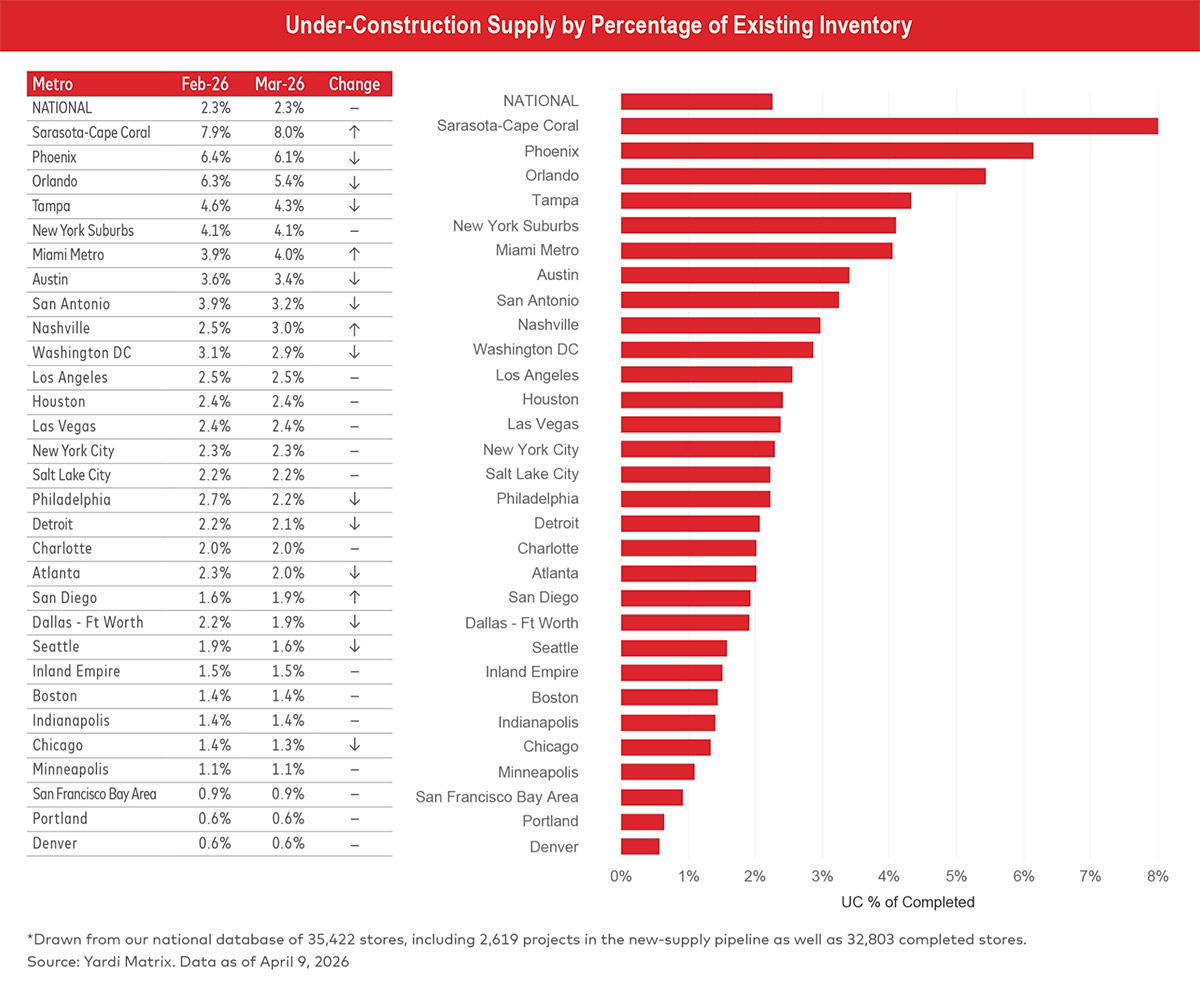
Nationally, Yardi Matrix tracks a total of 2,619 self-storage properties in various stages of development, including 622 under construction, 1,704 planned, and 293 prospective properties. The share of projects (net rentable square feet) under construction nationwide was equivalent to 2.3 percent of existing stock through the end of March, unchanged month over month.
Yardi Matrix also maintains operational profiles for 32,803 completed self-storage facilities in the U.S., bringing the total dataset to 35,422. We are pleased to announce the release of our new Terre Haute, Ind., and Redding, Calif., storage markets, now available to Yardi Matrix customers on the subscriber portal.
Self-storage REITs saw a sharp deceleration in March, with advertised rents declining 4.0 percent year over year, down from -2.2 percent in February. The REITs’ revenue management models seem to be most reactive to demand shifts, and weak move-in volume in Q3 and Q4 2025 could be causing a drag on rates now. They also started pushing rates up in March 2025, leading to more difficult comparison year over year.
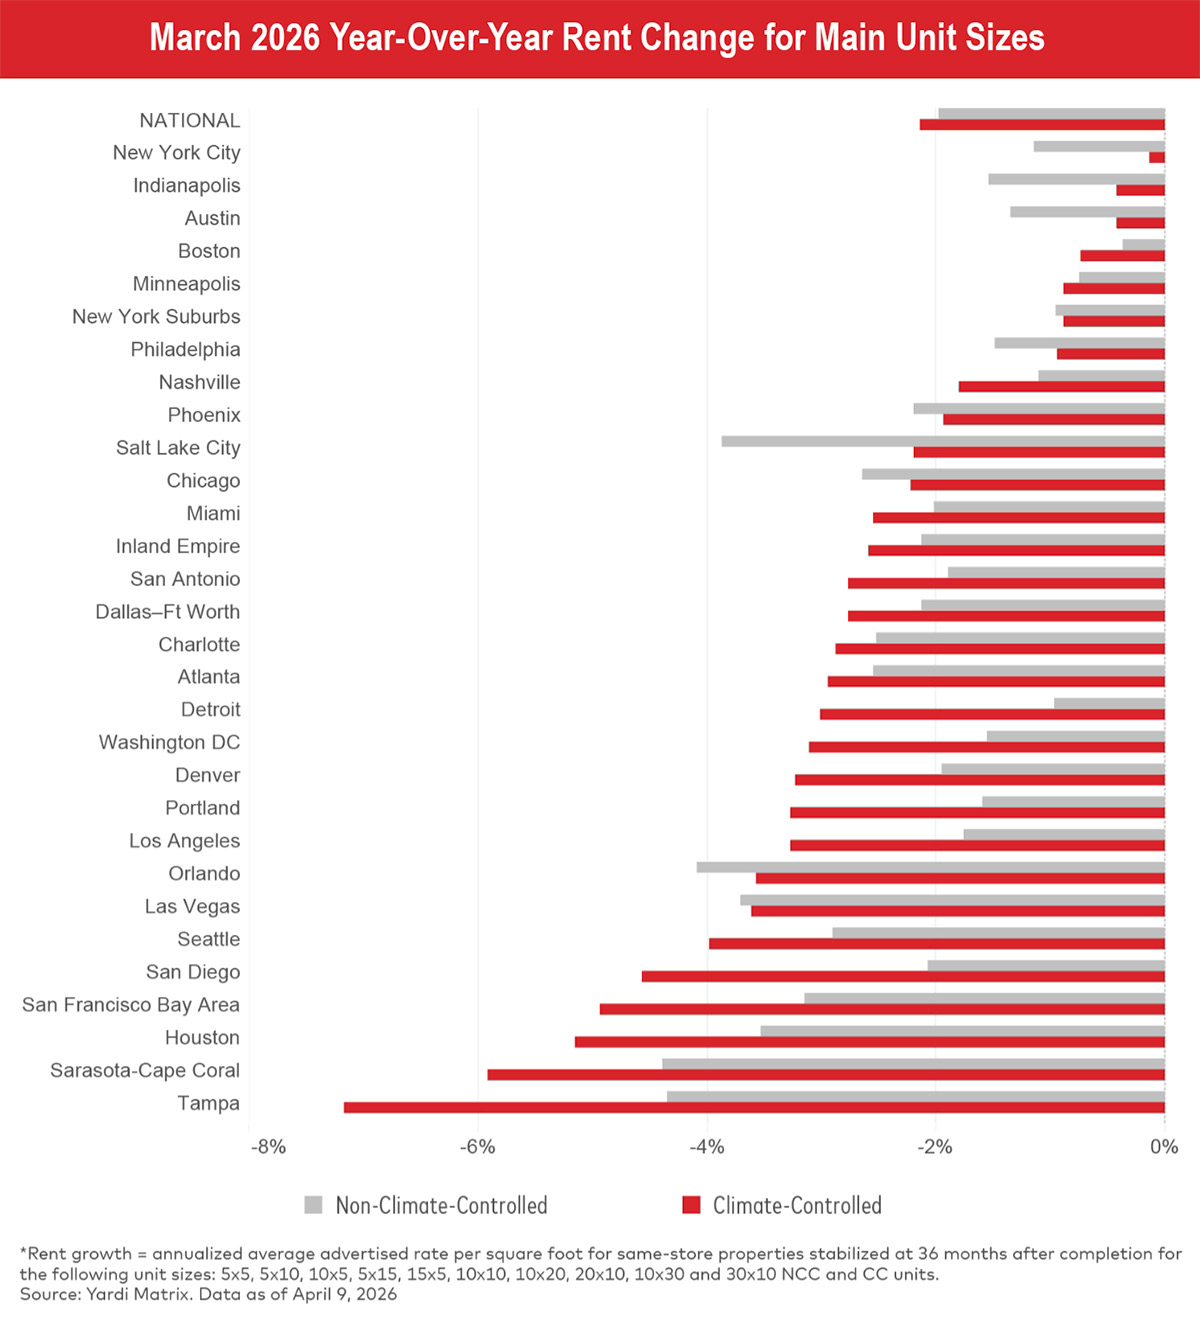
See March 2026 Year-Over-Year Rent Change for Main Unit Sizes chart.
At a metro level, advertised rates rose month over month in 13 of the top 30 markets. However, slightly more saw a slowdown, with rates decreasing sequentially in 14 of the top metros.
Tampa’s performance weakened notably in March, posting the largest month-over-month decline in asking rates at -0.7 percent, down from -0.1 percent in February, as the market continues to absorb a significant wave of new supply, forcing operators to offer more aggressive discounts to maintain occupancy and putting sustained downward pressure on rates.
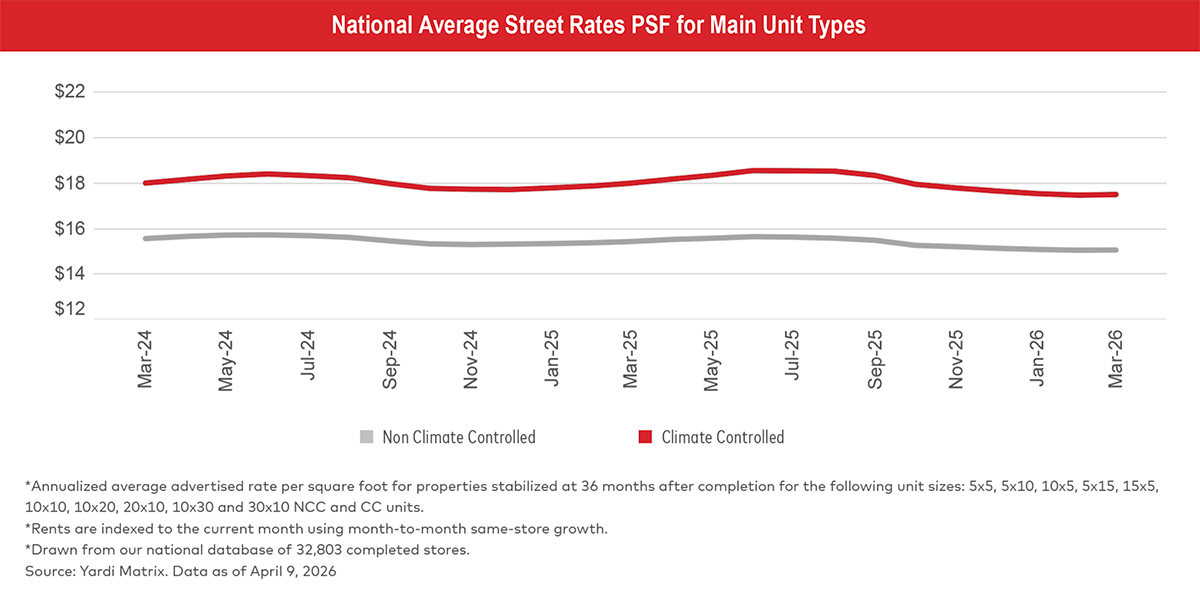
See National Average Street Rates PSF for Main Unit Types chart and Average Street Rates by Metro table.
Street Rates And New Supply
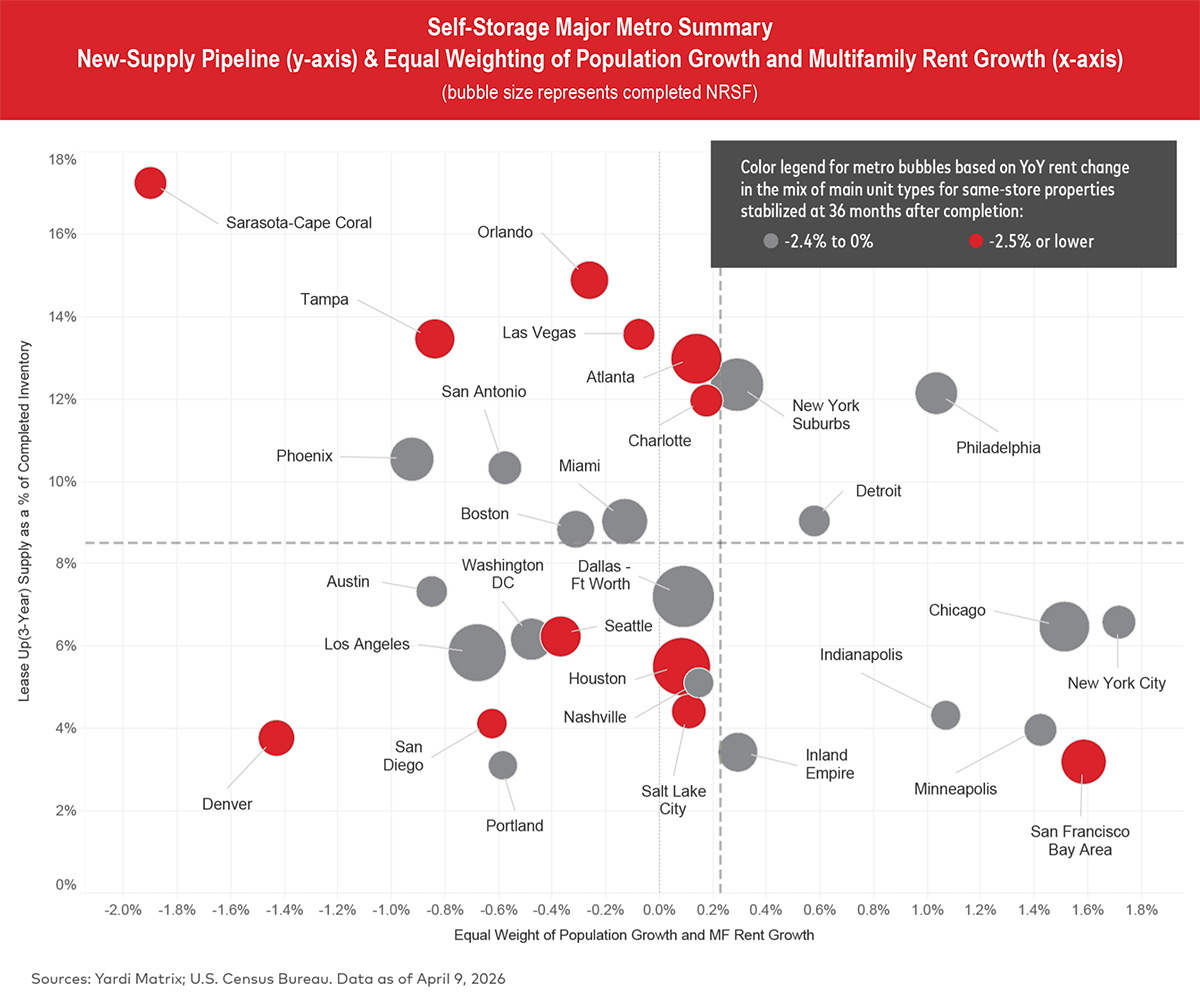
The San Francisco Bay Area stands out in the bubble chart for its relatively favorable supply-demand positioning, with low lease-up supply and stronger underlying demand indicators, yet the metro continues to experience weak advertised rate growth. This disconnect suggests that local factors, such as mass layoffs in the tech sector, may be dampening demand and limiting operators’ ability to push rates despite constrained supply.
See Self-Storage Major Metro Summary chart.
Lease-Up Supply
Although both New York City and the New York suburbs are still managing elevated levels of new lease-up supply, the past year has brought notable declines. In the New York suburbs, the three-year supply rate fell to 14.1 percent, a 350-basis-point decrease from March 2025. Similarly, New York City saw its three-year supply drop to 7.1 percent, down 230 basis points year over year. New York City and its suburbs remain among the strongest-performing markets, supported by relatively solid demand and constrained new supply, which has helped limit rent declines compared to other regions.
See NRSF Delivered Over the Past 36 and 12 Trailing Months table and chart.
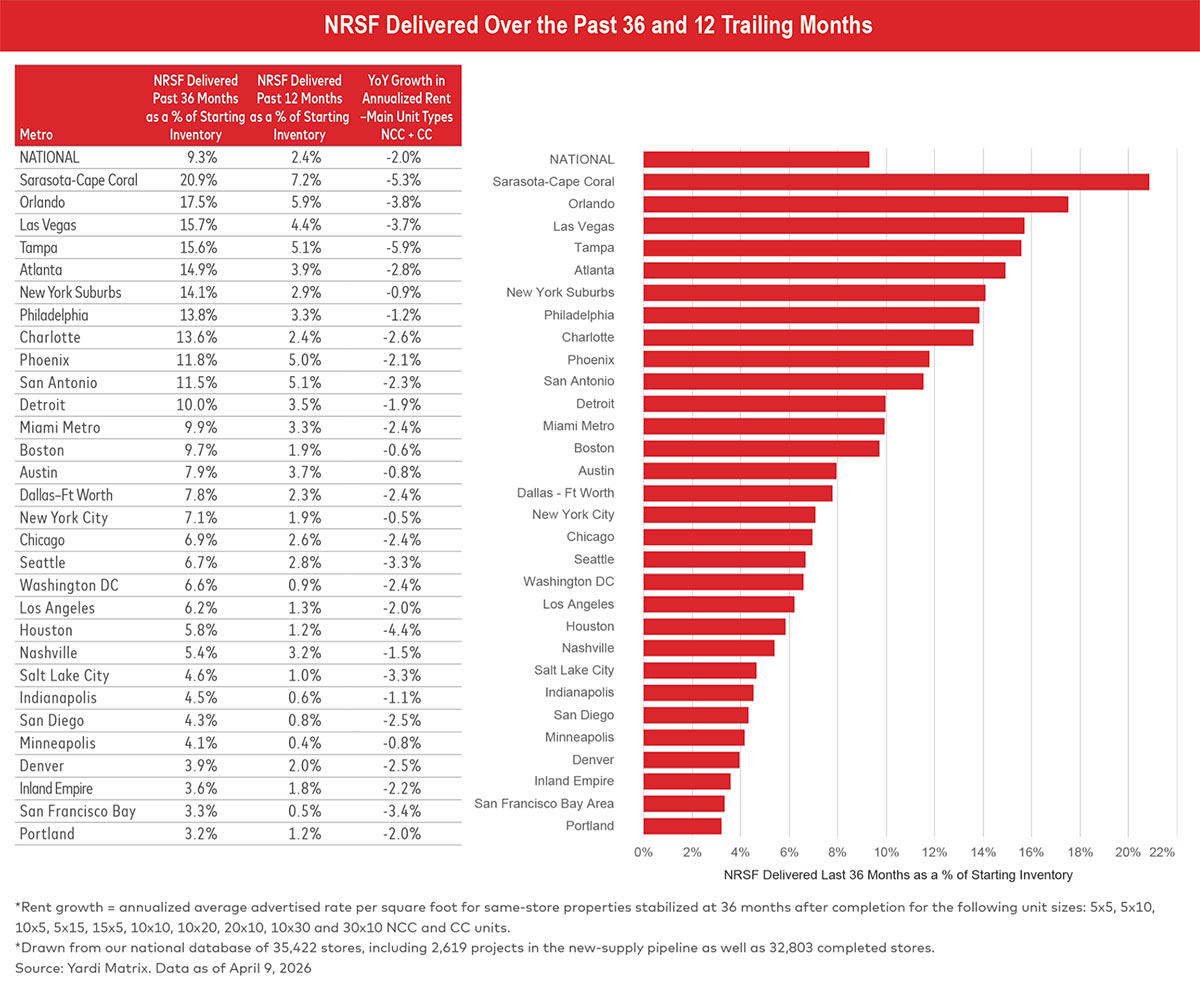
Sarasota–Cape Coral leads all top metros in under-construction supply, with projects totaling 8.0 percent of existing inventory as of March. Although this share has declined from 9.7 percent a year ago, the drop reflects project completions rather than a slowdown in new starts. Lease-up supply remains elevated, continuing to place downward pressure on asking rates in the metro.
Las Vegas reported no change in under-construction supply month over month but recorded the largest year-over-year decline, down 2.5 percent. Although this has coincided with an increase in lease-up supply, the pullback in construction signals a more favorable outlook for future rate performance.
See Under-Construction Supply by Percentage of Existing Inventory table and chart.