M icon
Stats By Starr
Stats By Starr
The Cancellation Graveyard And The Inactive Pipeline
By Noah Starr
T

he self-storage industry has spent the better part of the last two years talking about a development slowdown. It makes sense when cost of construction is up, rates are down, and getting projects approved is harder than ever.

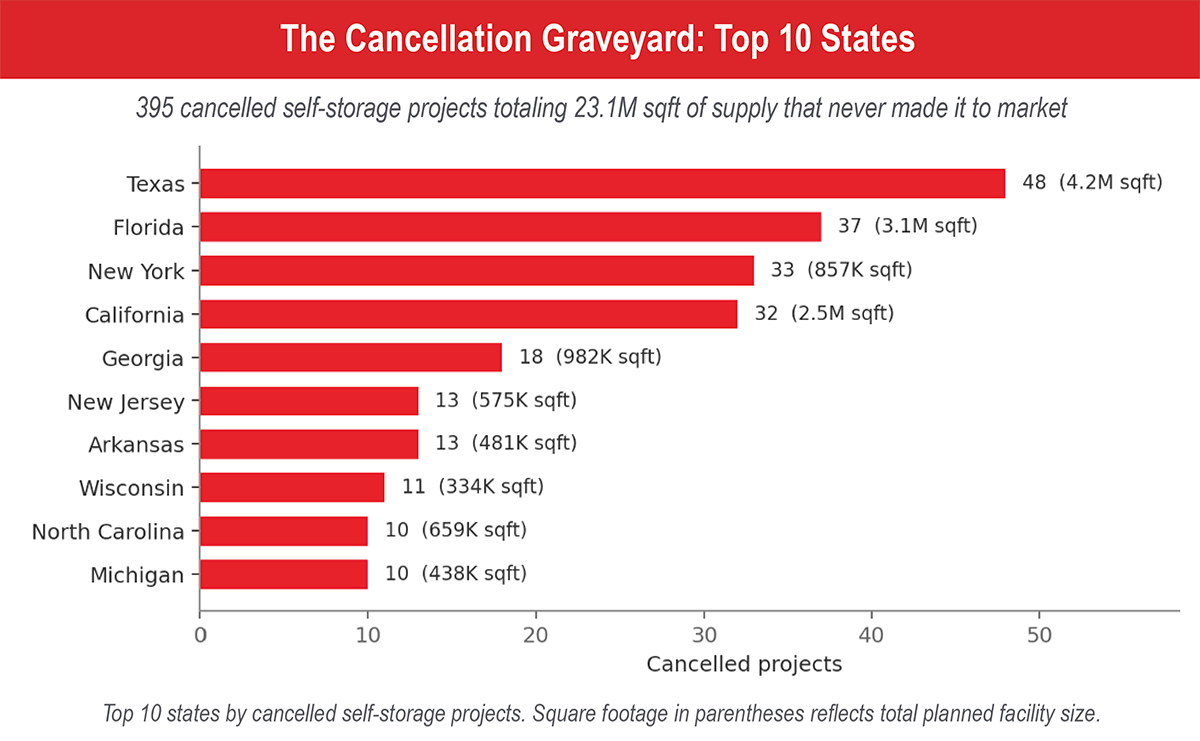
TractIQ currently tracks 395 self-storage projects with an official “Cancelled” status, representing roughly 23.1 million square feet of supply that was announced but never built. Sitting alongside that graveyard is a second larger population: 476 projects we’d call “inactive.” These projects are still listed as active in the pipeline yet show every sign of being abandoned.

Where Cancellations Cluster
The cancellation graveyard isn’t randomly distributed. Five states account for 168 of the 395 (43 percent) cancelled projects that TractIQ tracks: Texas, Florida, New York, California, and Georgia. That’s not surprising on its face, but the absolute supply volume is striking. Texas alone walked away from 4.2 million square feet of announced storage, more than the total existing stock of many mid-sized MSAs.

See The Cancellation Graveyard: Top 10 States chart.

The Cancellation Graveyard: Top 10 States chart
What’s interesting is the size profile of what got killed. Cancellations span every facility size class, from sub-30,000-square-foot drive-up products to over-120,000-square-foot urban builds. The median cancelled project would have been a roughly 70,000-square-foot facility.

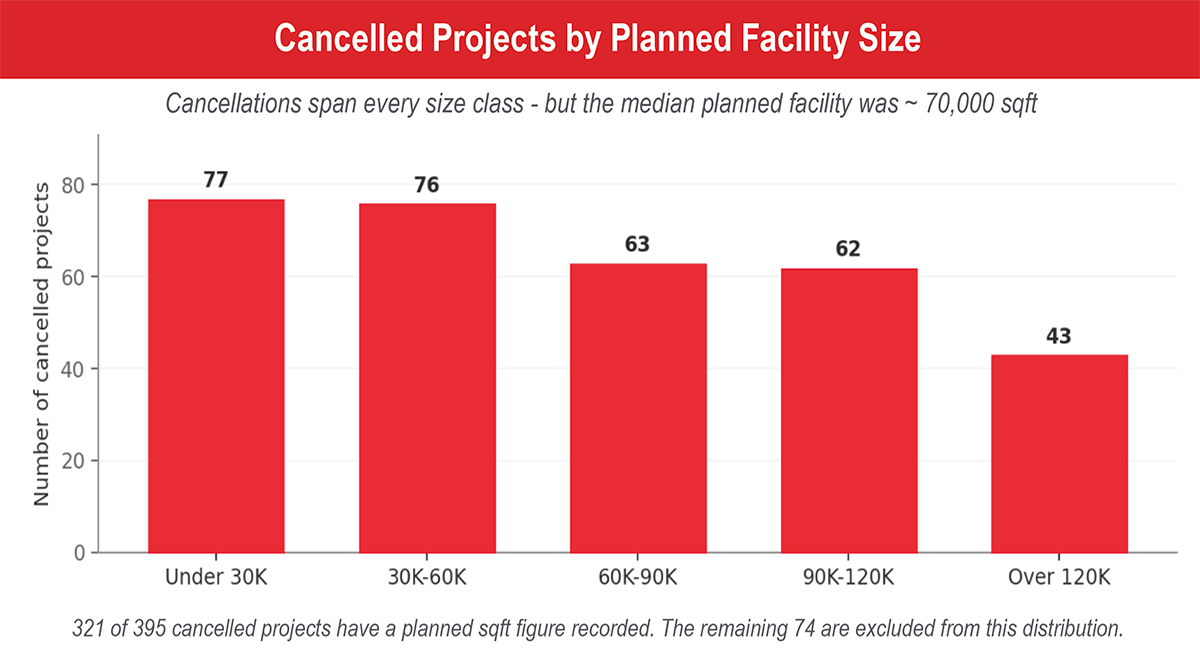
See Canceled Projects by Planned Facility Size chart.

Canceled Projects by Planned Facility Size chart
The Inactive Pipeline Is Bigger Than The Graveyard

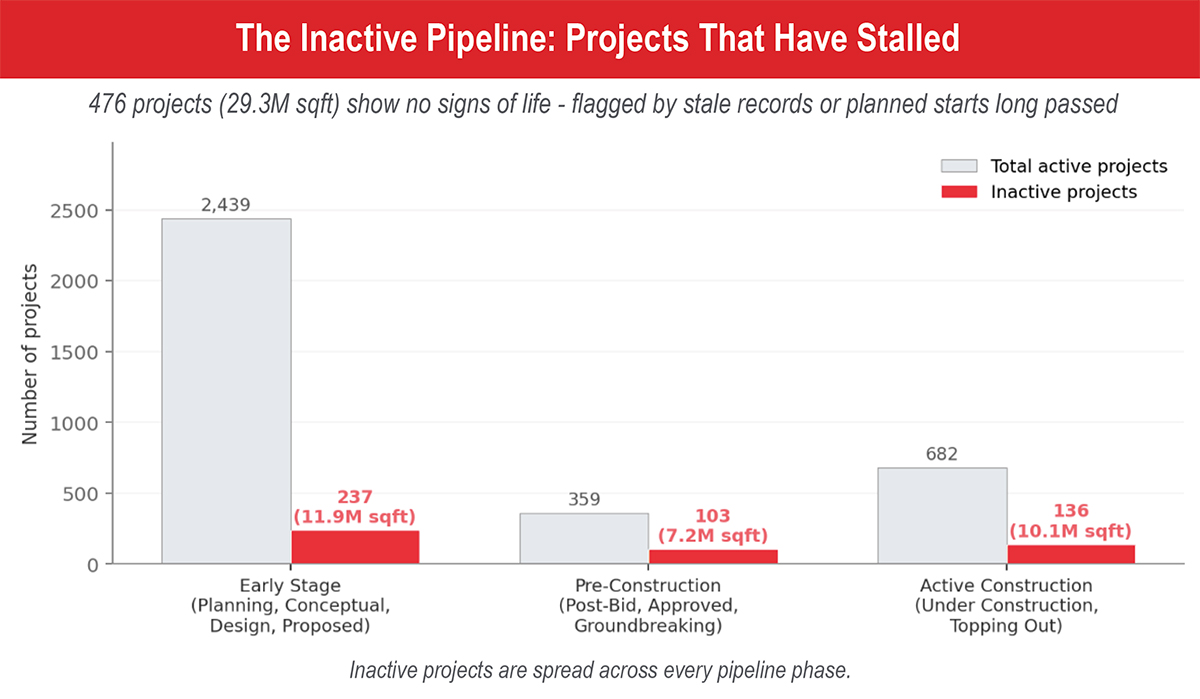
If the cancellation graveyard captures projects that have formally been pulled, the inactive pipeline captures something messier: projects that are technically still in the pipeline but show no measurable signs of life. We flagged a project as inactive if either its TractIQ record hasn’t been touched in 18-plus months, or its planned start date passed more than a year ago without progression. By that definition, 476 active-pipeline projects qualify. This equals 29.3 million square feet, which is actually larger than the cancellation graveyard.

See The Inactive Pipeline: Projects That Have Stalled chart.

The Inactive Pipeline: Projects That Have Stalled chart
State-Level Rollup
The states that lead the cancellation graveyard also tend to lead the inactive pipeline, and the parallel concentration tells you something about where development pressure has been most acute over the last cycle.

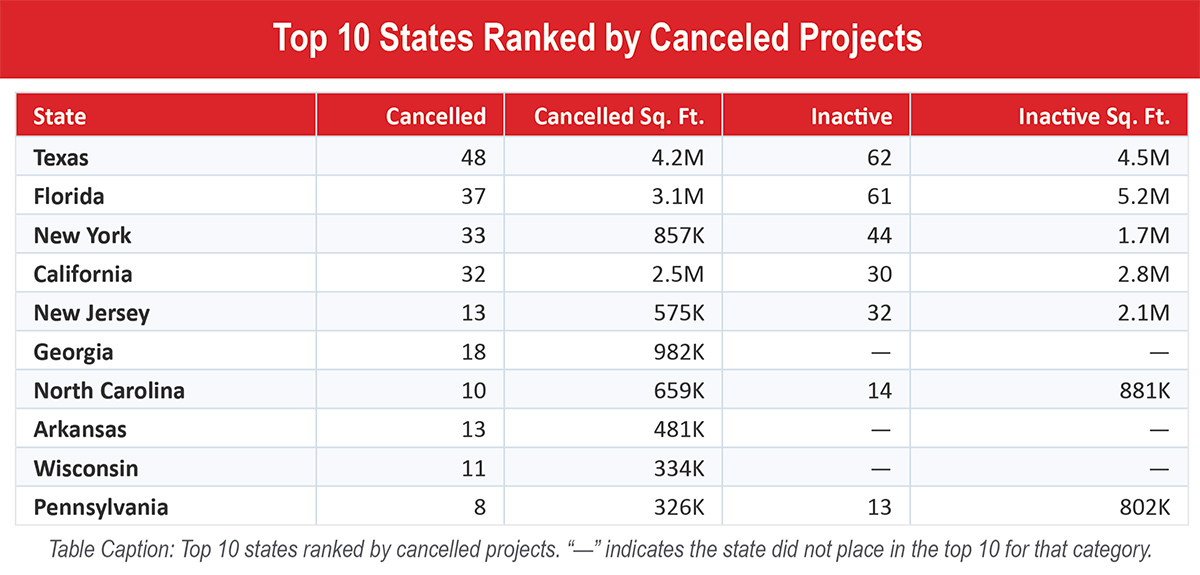
See Top 10 States Ranked by Canceled Projects table.

Top 10 States Ranked by Canceled Projects table

Data & methodology: All figures sourced from TractIQ’s self-storage pipeline database, queried May 2026. “Cancelled” projects are those explicitly marked with project status = “Cancelled.” “Inactive” projects are active-pipeline projects (excluding Cancelled) flagged by one of two signals: (1) record not updated in 18-plus months, or (2) a planned start date that has passed by more than 12 months.

The Takeaway
Industry forecasts of forward supply lean heavily on what’s currently in the announced pipeline. But TractIQ’s data suggests that a meaningful chunk of that announced pipeline, particularly in Texas, Florida, and the Northeast, is functionally dead, even if it hasn’t been declared so. For operators evaluating new market entry or expansion, that’s actually good news: The competitive supply on the horizon may be smaller than the spreadsheet suggests. For developers, it’s a reminder that announcing a project and finishing one are two very different things, and the gap between them has rarely been wider.

Noah Starr is the CEO of TractIQ.