
usiness decisions based on data are superior to those based on a gut feeling or intuition. The latter can point you in the right direction, but only the data can help you pinpoint the answers you need. But how do you find it? And when you do, how do you know it’s accurate? Is it fact, or is it fake?
You can probably find data to support any point you want to make, even that the earth is flat. But what you need is accurate data to help you solve your problem. So let go of preconceived notions and ulterior motives. Find what you need—not what you want—so you don’t mislead yourself and your colleagues and ultimately lose money, along with your integrity and your stakeholders.
Next, you must know what you are seeking. Define your goal so you can formulate the right question(s).
- Business goals vary over time. Do you want to maximize revenue, maximize profit, gain market share, prepare for sale of the business, or something else?
- Facility improvement goals depend on your needs. What are your weaknesses or opportunities? Who or what is your competition?
- Market entry goals to buy or build a self-storage business depend on many factors. How much money do you have available? Do you want to buy or build? How should you run it? Where should it be located?
Having clarified your goal and formulated the most relevant questions, you can hunt for the data you need.
First published in 1992, the Self-Storage Almanac has a 32-year history of providing reliable data on every aspect of the industry. Year after year, it reports the data on a consistent set of topics relevant to any self-storage business, from how many facilities are in the U.S. to rental rates in every region, from marketing metrics to operational KPIs (key performance indicators), and more. When I entered the self-storage industry writing business plans for self-storage in Asia, the developer handed me the 2002 Self-Storage Almanac. He told me he reads it cover to cover every year. He still does, and so do I. This practice gives you an internal database, helps you recognize trends, and gives you vision to see where the market is going.
The Almanac explains its methodology throughout. For instance, 2023’s “Industry Numbers” section explains how the Almanac team worked with Newmark and Radius+ to reach a total of 51,206 facilities in the U.S. (52,301 in 2024). Many different facility counts are reported elsewhere, but only the Almanac has been counting and reporting that data in a consistent way over three decades. As the industry matures, so does the data. Publisher Poppy Behrens notes, “It is essential to understand that the past eight years have been transitional for industry data.” So, the data is getting better all the time.
The second seminal resource is the SSA’s Self Storage Demand Study. There are six studies dating back to 2005. The methodology is explained in the introduction and appendices. The 2023 study states, “More than 11,000 households and businesses were contacted and asked if they currently or recently rented a self-storage unit or planned to in the next year.” It continues, “… we did not include recent renters in the calculation of rental penetration among U.S. households.”
Like the Almanac, the SSA Self Storage Demand Study evolves over time with the consumer, society, and technology. This study is known throughout the industry for its rigor and professionalism. The 2023 study was conducted by C+R Research, specializing in qualitative and quantitative market research. The SSA’s study uses the same basic approach over time, so the data on consumer penetration is worthy of serious consideration. Since the first demand study was published in 2005, penetration has increased from 9 percent to 11.1 percent (i.e., 11.1 percent of U.S. consumers were renting self-storage when the survey was conducted).
If you Google how many Americans use self-storage, the top result is usually StorageCafé data reporting 38 percent. That’s a far cry from 11.1 percent! But what is this data reporting? StorageCafé, owned by Yardi, a commercial real estate software and data provider serving the self-storage industry (among others), ran a survey and collected 17,000 respondents. StorageCafé’s Aug. 15, 2022, blog explains, “Our findings are based on a survey that ran on the online real estate platforms rentcafe.com and propertyshark.com [both owned by Yardi] for a period of one month among 16,900 respondents in the United States.”
StorageCafé clearly indicates that it:
- Ran a survey on their platforms.
- Asked one question: Have you used or plan to use self-storage in the near future?
- Reported “Roughly 38 percent of American respondents have used or plan to use self-storage in the near future.”
The SSA’s Self Storage Demand Study reports that it:
- Contacted 11,000 households and businesses.
- Asked three questions:
- Did you use self-storage in the past five years?
- Are you using self-storage now?
- Will you use self-storage in the next 12 months?
- Reported 11.1 percent of households were renting self-storage at that time.
Both seem to report reasonable data, but they report different data.
- One measures individuals, while the other measures households.
- One includes current rentals and future intentions; the other is limited to current rentals.
- One survey appeared on commercial real estate platforms owned by the reporting company and collected responses from people who searched for and used those platforms online; the other was conducted by a professional market research company that reached out directly to households and businesses.
- One reports 38 percent; the other reports 11.1 percent.
Both interesting points, but different data! Woody Allen said it best when he modified Business Professor Aaron Levenstein’s quote: “Statistics are like a bikini. What they reveal is interesting, but what they conceal is essential.”
The warning is clear: “Be suspicious of all statistics, especially those you want to be true,” according to Dr. James McGrath in The Little Book of Big Management Wisdom. To find the data you need, always search out what is actually being reported. Drill down into what the data is based on, how it was collected, what it is reporting, and other relevant factors so you do not misinterpret it. Many bad decisions are made based on wrongly reported or misinterpreted data.
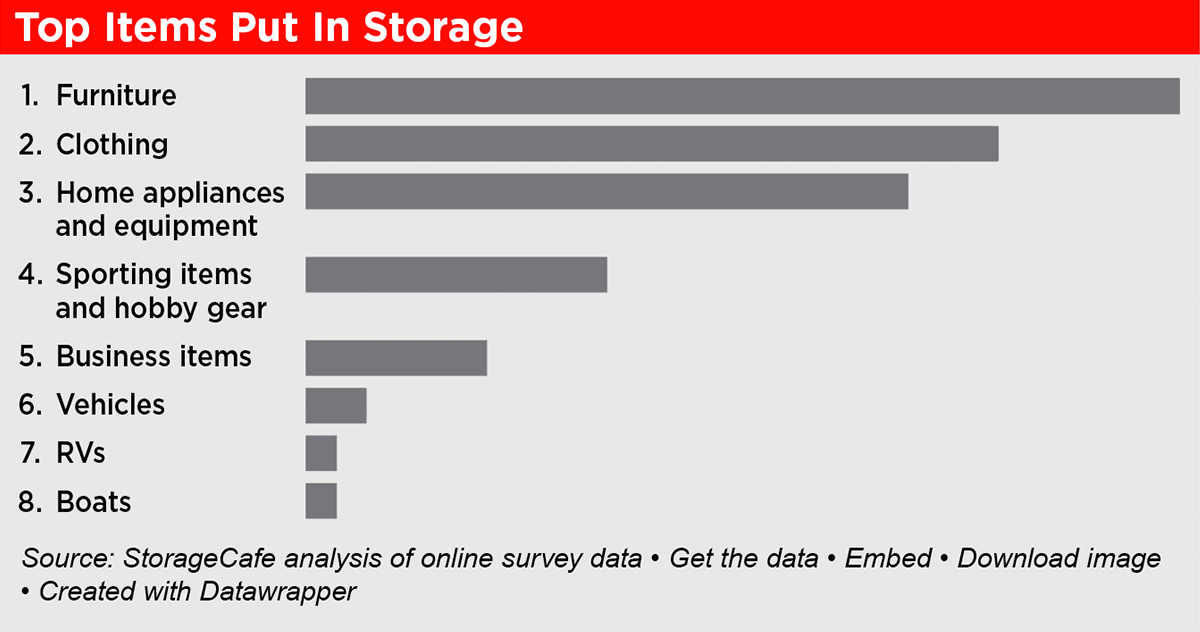
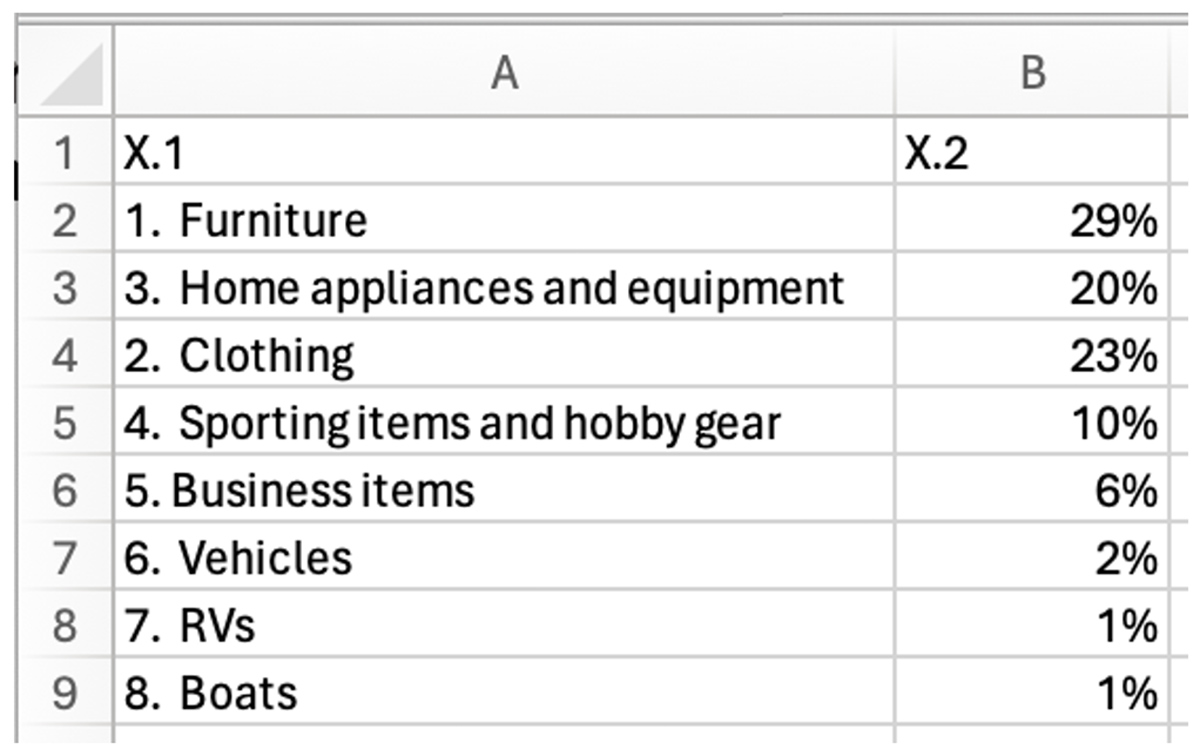
- “Get the data” enables you to download a CSV file. The image below shows how the data that generated the chart looks when opened in Excel.
- “Embed” enables you to copy the actual code so you can embed the data visualization (the chart), which is particularly helpful if you want to display it on a website. The experts say that is a good choice because it offers a more engaging, informative, and user-friendly experience, compared to static images like our screenshot. But often a simple screenshot is sufficient, especially if it is in a document such as a business plan.
- “Download image” is an even better option for a business plan. It gives you a pristine PNG file to paste into your documents, complete source citation (StorageCafé analysis of online survey data) and how it was created (by Datawrapper, an online tool to create data visualization, i.e., graphics like Chart 2), but not the other options, such as downloading the data.
If you want to design the optimal unit mix for a new development, look at your data.
- Which units generate the most revenue per square foot?
- Which size rents quickest?
- Which unit size has a waiting list?
Drill down into your reports over time (at least a full year so you can see trends) to answer these and other questions so you can design the best unit mix for your new facility.
If you want to see what marketing tactic generates the most rentals, do A/B testing. The point is, use your own data. You have more data than you think. You know how it was collected and maintained. You should be able to trust your own data more than any other source.
Then, talk to colleagues. The self-storage industry is known for its “coopetition,” Travis Morrow’s combined word for “cooperation” and “competition.” In fact, as CEO of Storelocal, Morrow is a great resource to talk to about how to drill down into your data.
Happy hunting for the data you need, carefully sorting through tempting nuggets that may not be true. It’s the best foundation for solid, successful business decisions.