

elf-storage rate pressure is easing, but supply remains a drag. Tyson Huebner, Yardi Matrix’s director of research, recently presented at the Texas SSA Executive Retreat in Grapevine, Texas. The presentation, available upon request, covered supply and demand trends, operating performance, and investment market conditions, with a focus on Texas. Home to the nation’s two largest self-storage markets, Texas serves as a useful case study for broader industry trends. Strong migration and home sales during 2021 and 2022 fueled record self-storage performance, particularly in Austin, Dallas, and San Antonio. Developers responded by building aggressively in high-growth areas, such as the northern suburbs of Dallas and western San Antonio, while elevated property values accelerated consolidation as large operators, investors, and REITs acquired smaller owners. Conditions have since shifted dramatically. Home sales have fallen to multi-decade lows, leaving many migration-dependent submarkets facing excess supply and weaker demand. Increased competition for fewer tenants has pressured rents and returns, challenging the underwriting assumptions that supported acquisitions and development during the recent boom. In Texas, advertised rates were down 2.5 percent year over year in May 2026, 13.3 percent below their 2022 peak and 3.1 percent below May 2020. Although performance is beginning to stabilize as new supply moderates, recovery remains uneven and could take years in some markets.
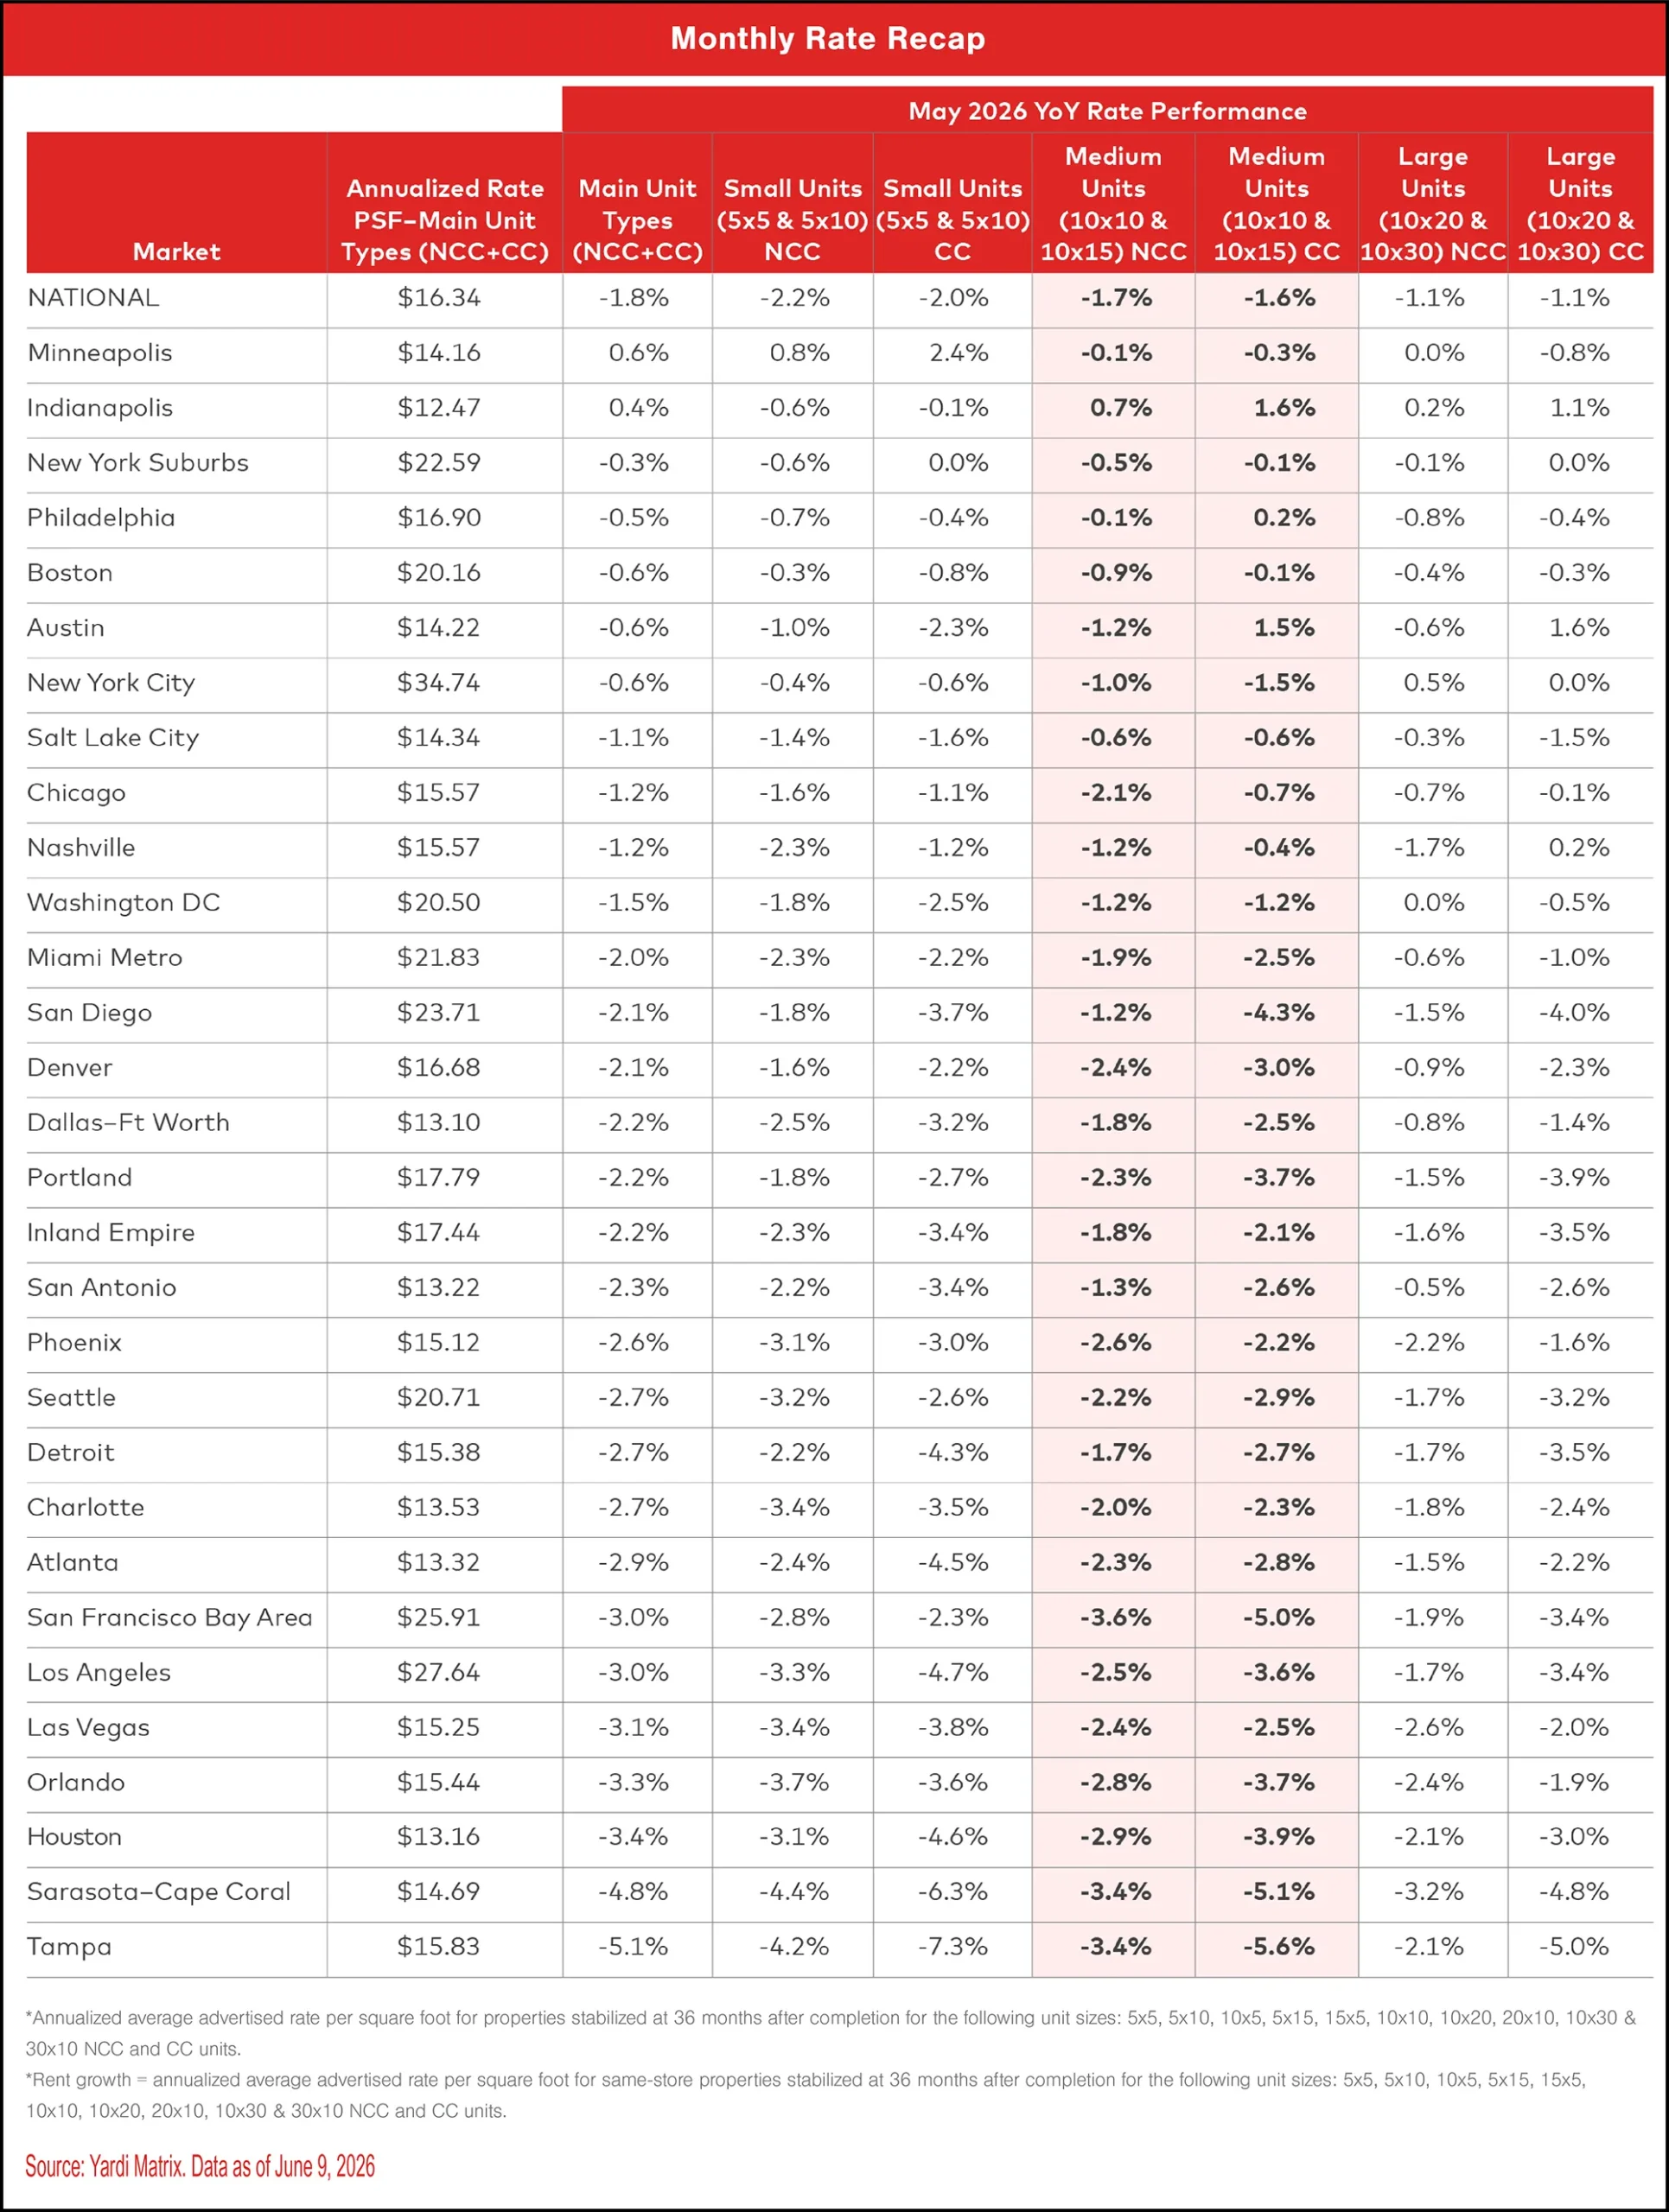
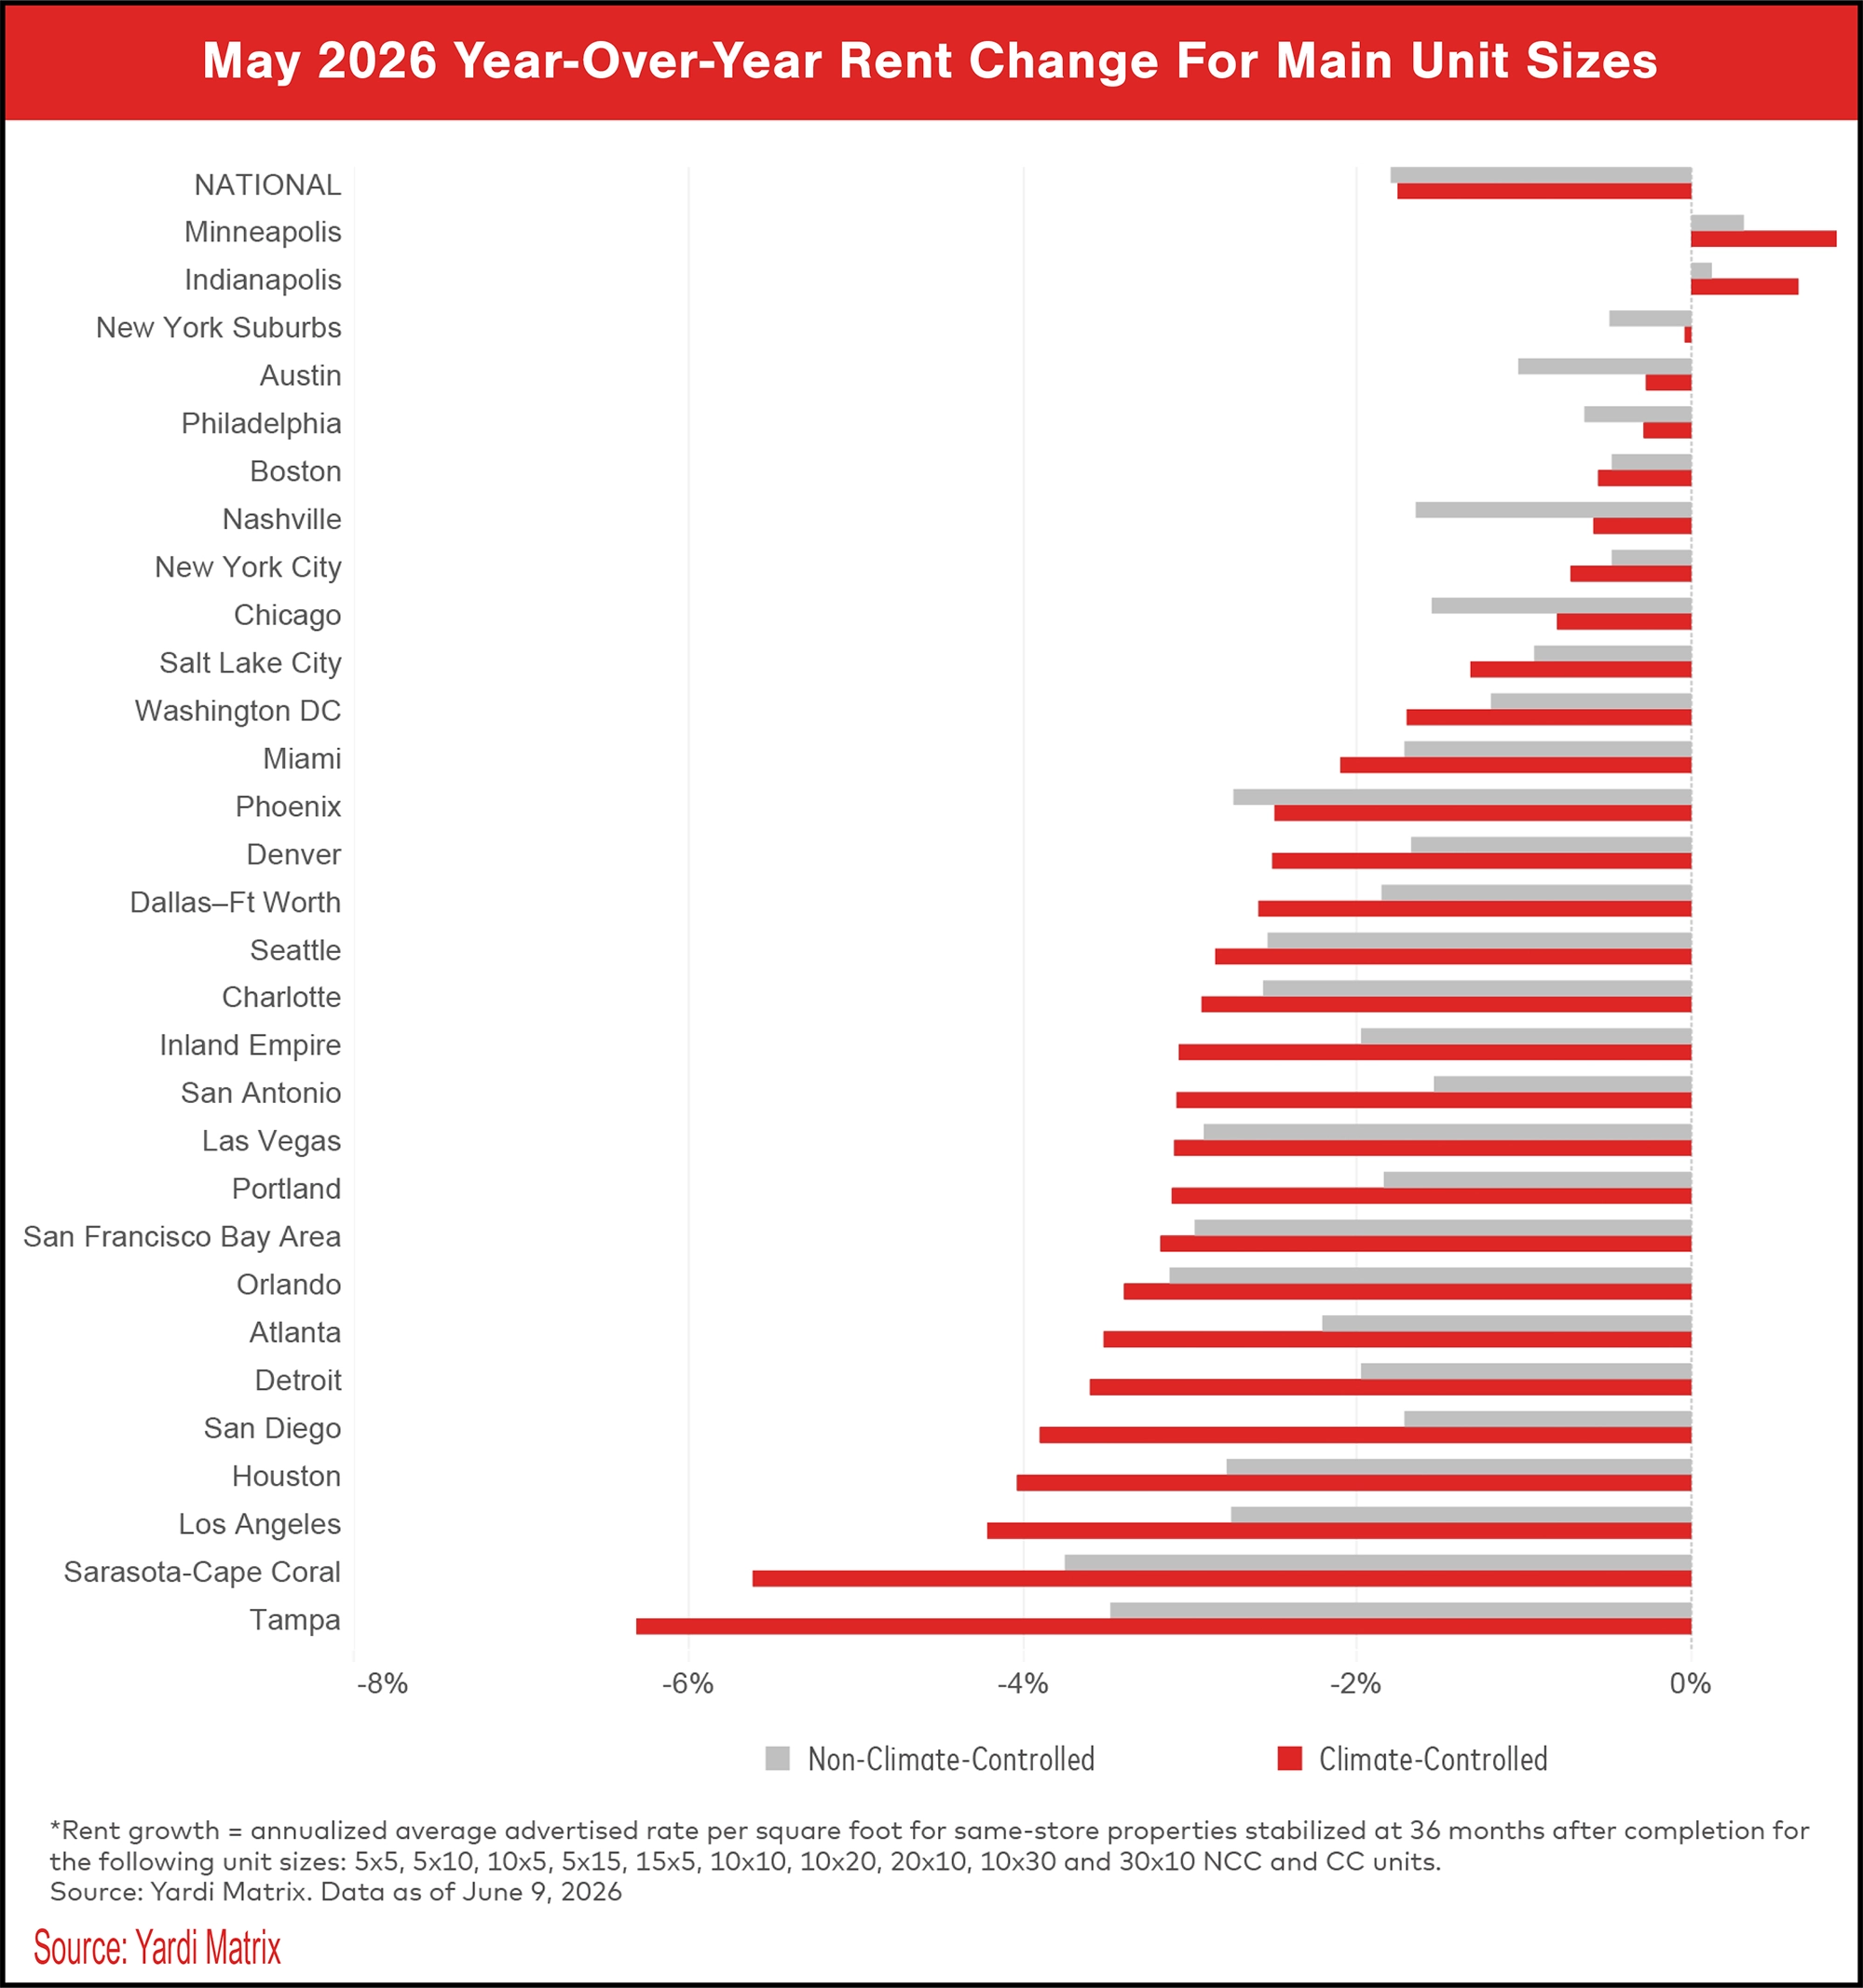
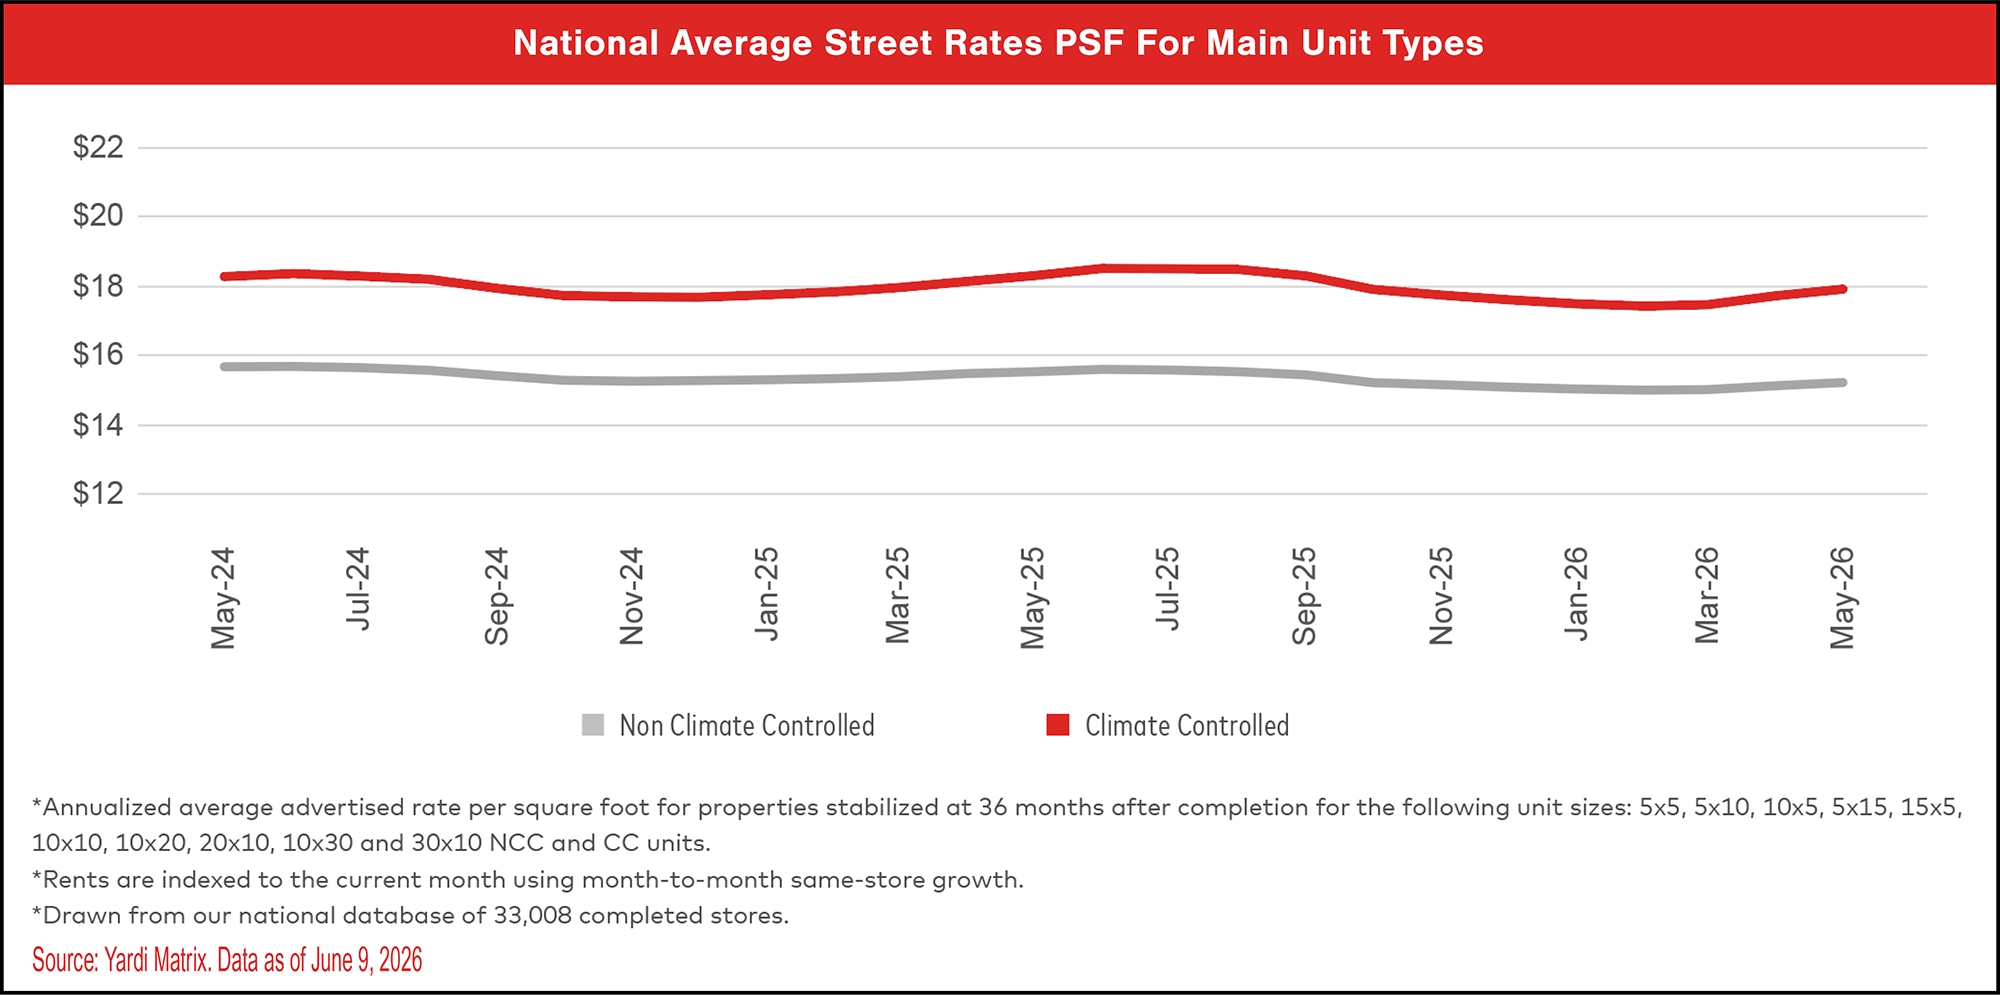
Year-over-year rate pressure eases but remains broad-based. Advertised rates continued to face year-over-year pressure in May, though the pace of decline moderated compared to prior months. Nationally, advertised rates decreased 1.8 percent in May, a minor improvement from -1.9 percent in April and -2.0 percent in March. Same-store advertised rates for non-climate-controlled (NCC) units increased in only two of the top 30 metros. Similarly, rates for climate-controlled (CC) units increased in two of the top metros year over year.
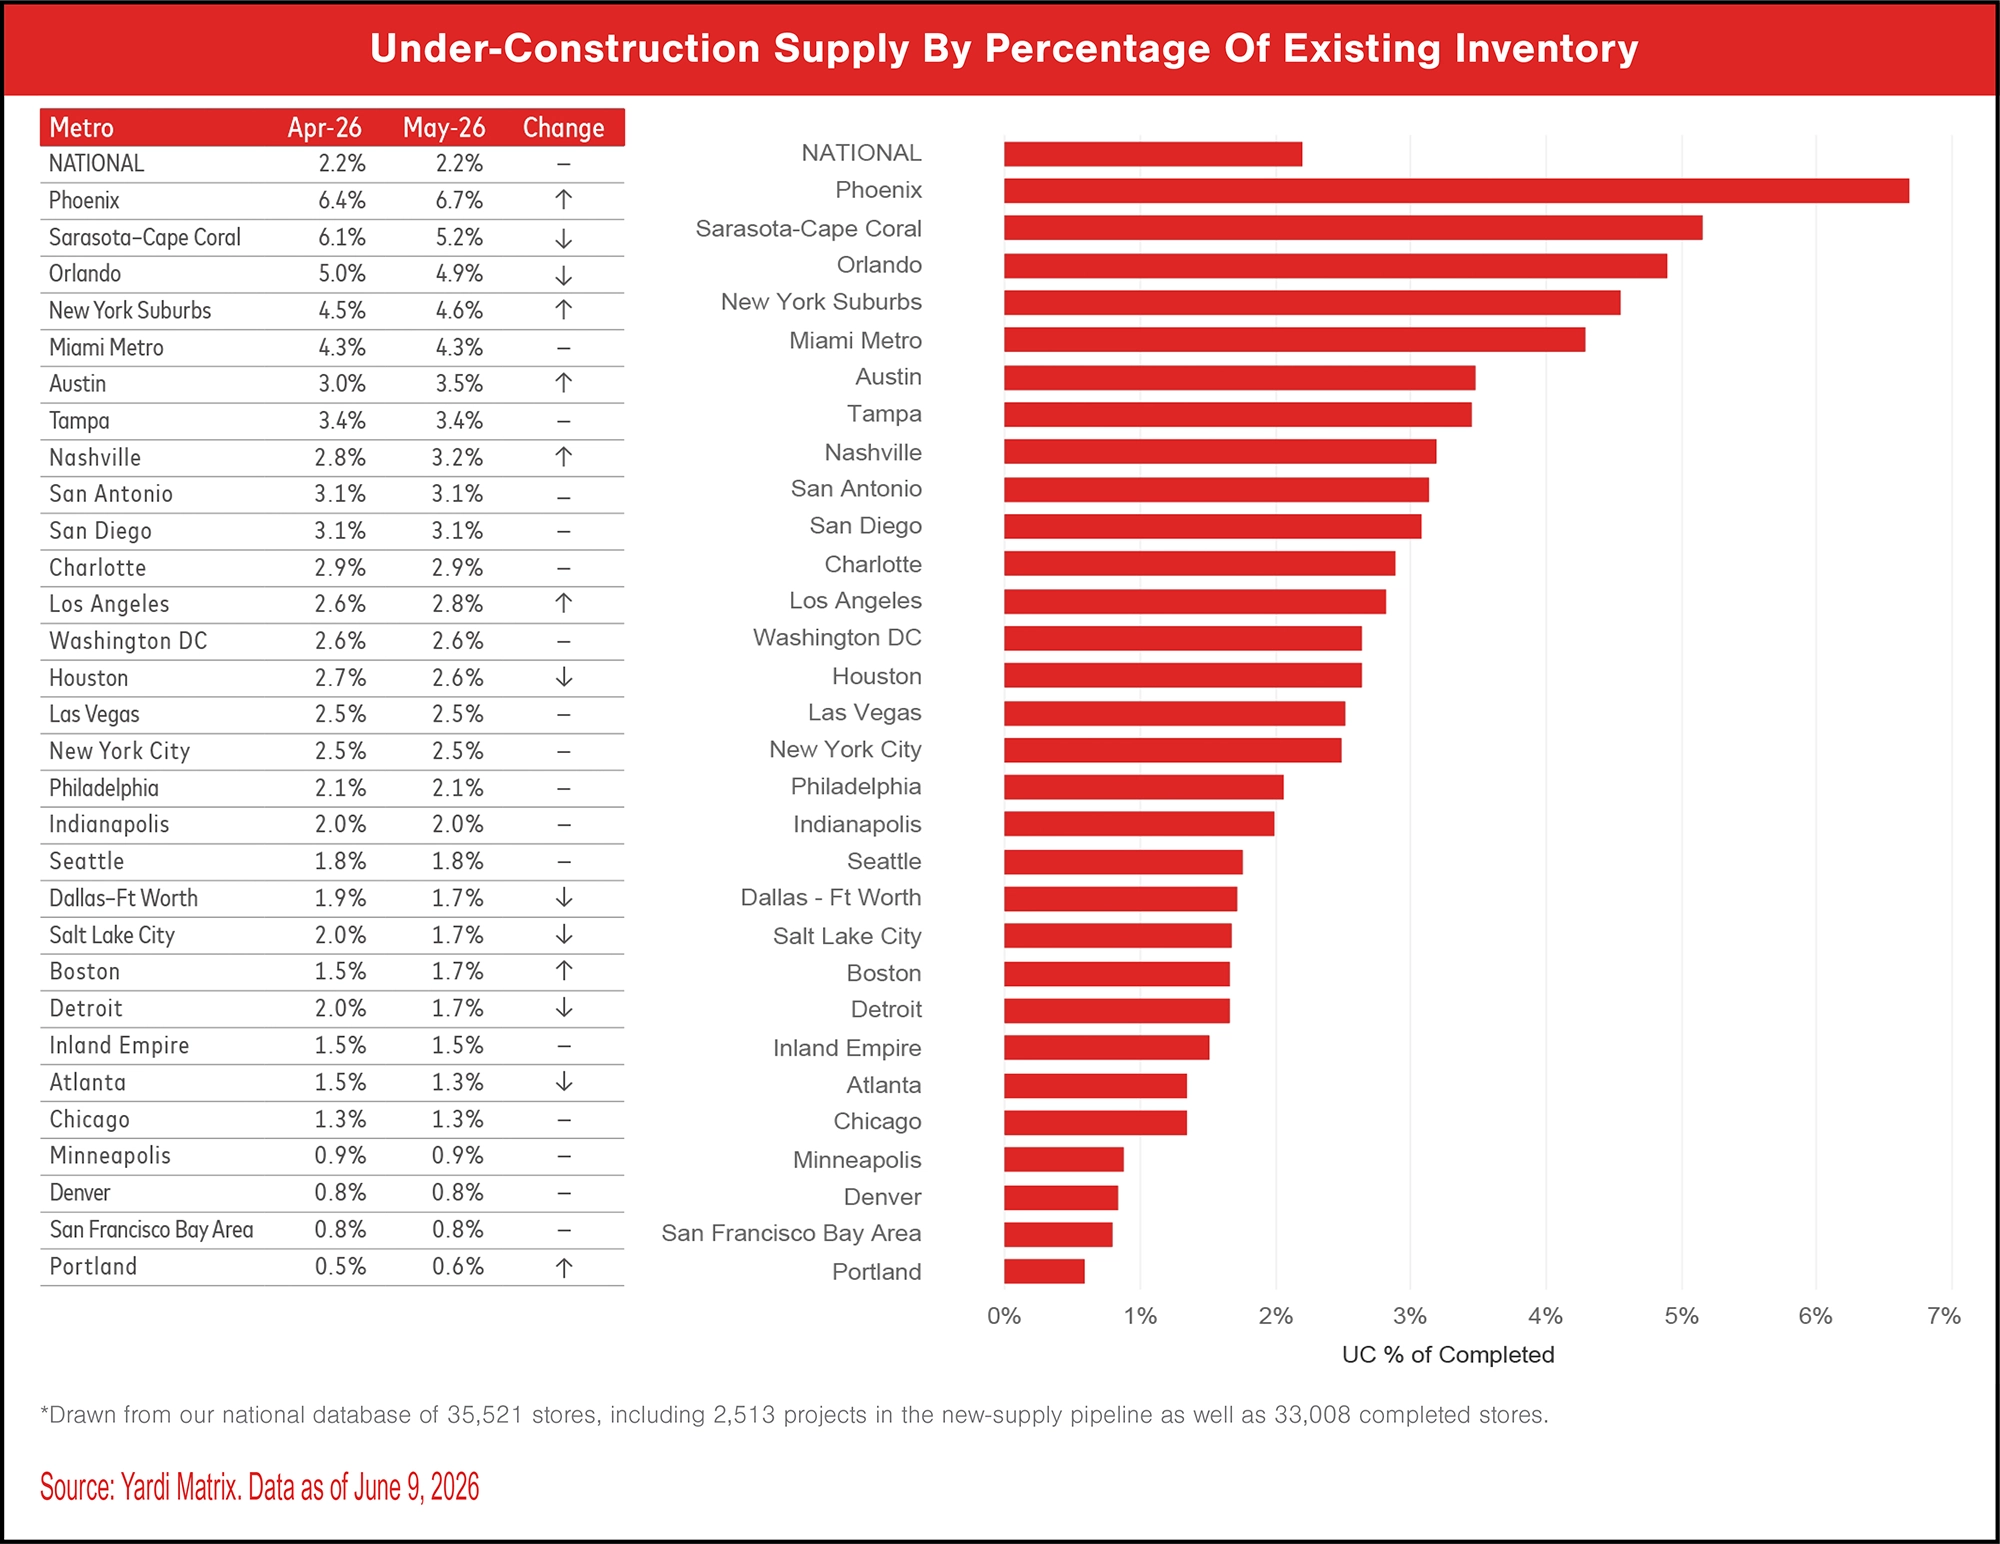
Nationally, Yardi Matrix tracks a total of 2,513 self-storage properties in various stages of development, including 612 under construction, 1,603 planned, and 298 prospective properties. The share of projects (net rentable square feet) under construction nationwide was equivalent to 2.2 percent of existing stock through the end of May, unchanged month over month.
Yardi Matrix also maintains operational profiles for 33,008 completed self-storage facilities in the U.S., bringing the total dataset to 35,521.
Self-storage REITs posted stronger month-over-month asking-rate growth than the broader market, as REIT operators typically increase rates more aggressively during the spring and summer leasing seasons. However, REIT rents remain negative year over year, declining 3.1 percent nationally, indicating that recent gains are more reflective of seasonal catch-up than a full demand-driven recovery.
See May 2026 Year-Over-Year Rent Change For Main Unit Sizes table.
Sequential rate growth was broad-based, with 26 of the top 30 metros reporting month-over-month gains.
Many of the strongest month-over-month performers were markets with more pronounced seasonal patterns, including those with colder winter climates. Markets such as Boston, Washington, D.C., Indianapolis, and other winter-weather metros typically experience more seasonal demand.
See National Average Street Rates PSF For Main Unit Types chart and Monthly Average Street Rates By Metro table.

Elevated new supply continues to limit rate growth in several metros, particularly where newly delivered properties are still in lease-up. This pressure remains most visible in high-supply Sun Belt and Florida markets, including Tampa, Sarasota–Cape Coral, Orlando, and Las Vegas.
However, supply does not tell the full story. Some metros with moderate new supply, including Houston and Los Angeles, still have trade areas with concentrated new deliveries, creating localized pricing pressure that can weigh on broader metro-rate performance. Both metros may also face demand pressure, given their recent reliance on international migration for demand growth.
See Self-Storage Major Metro Summary chart.
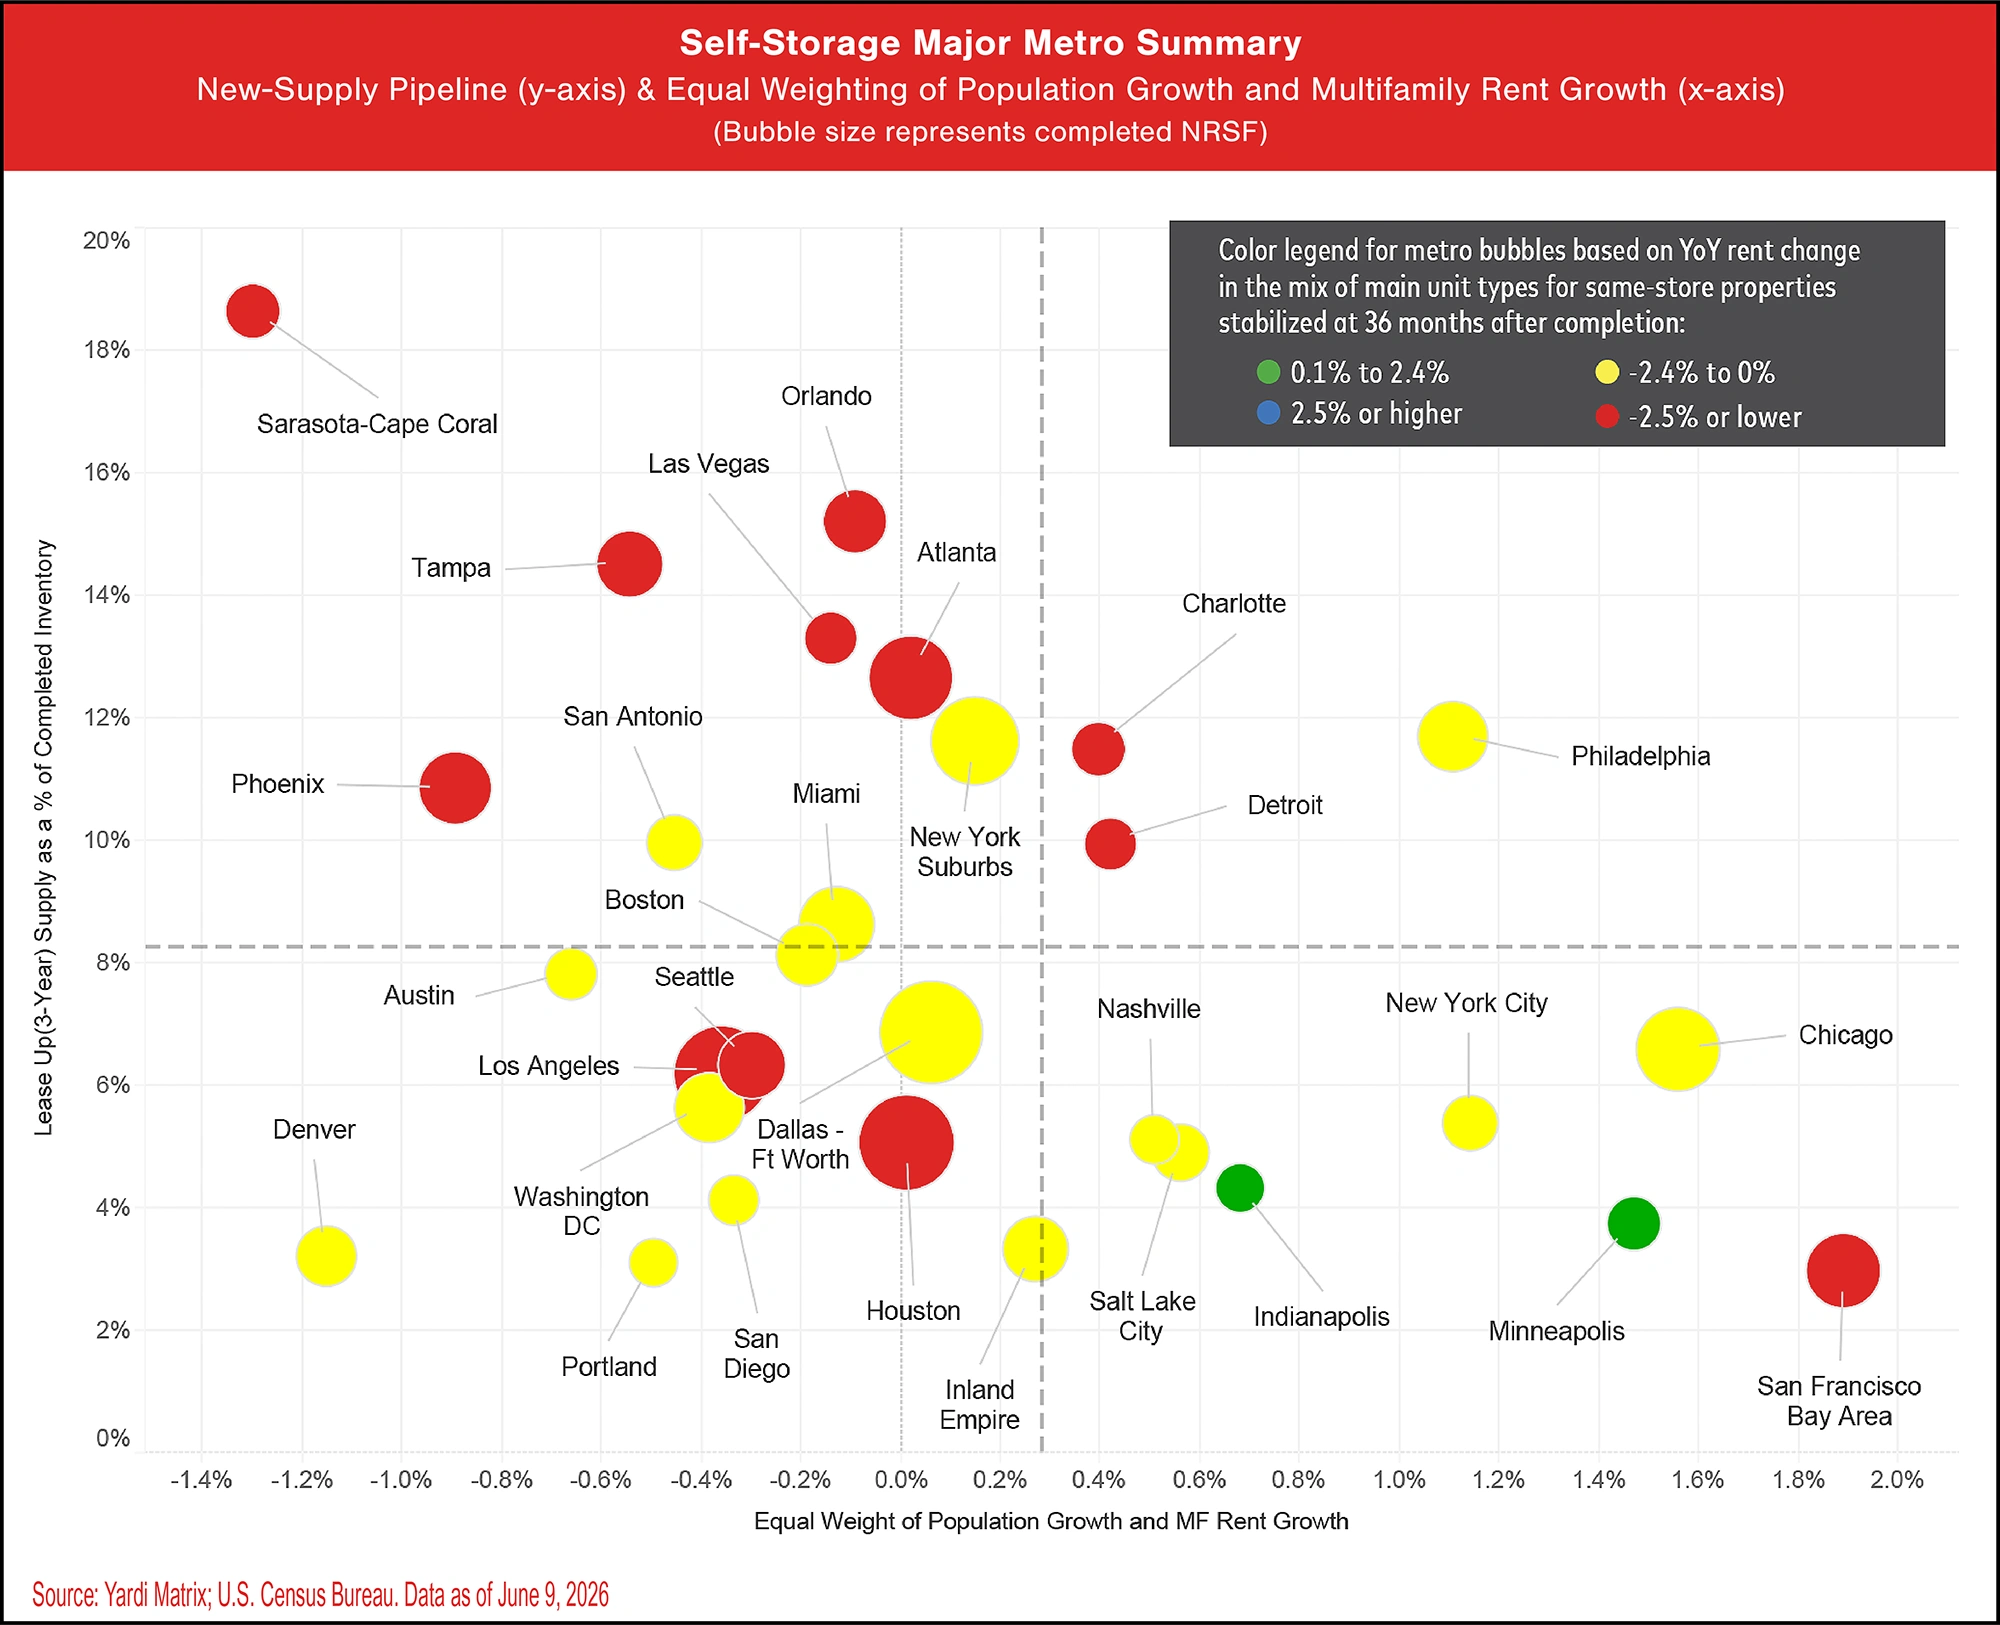
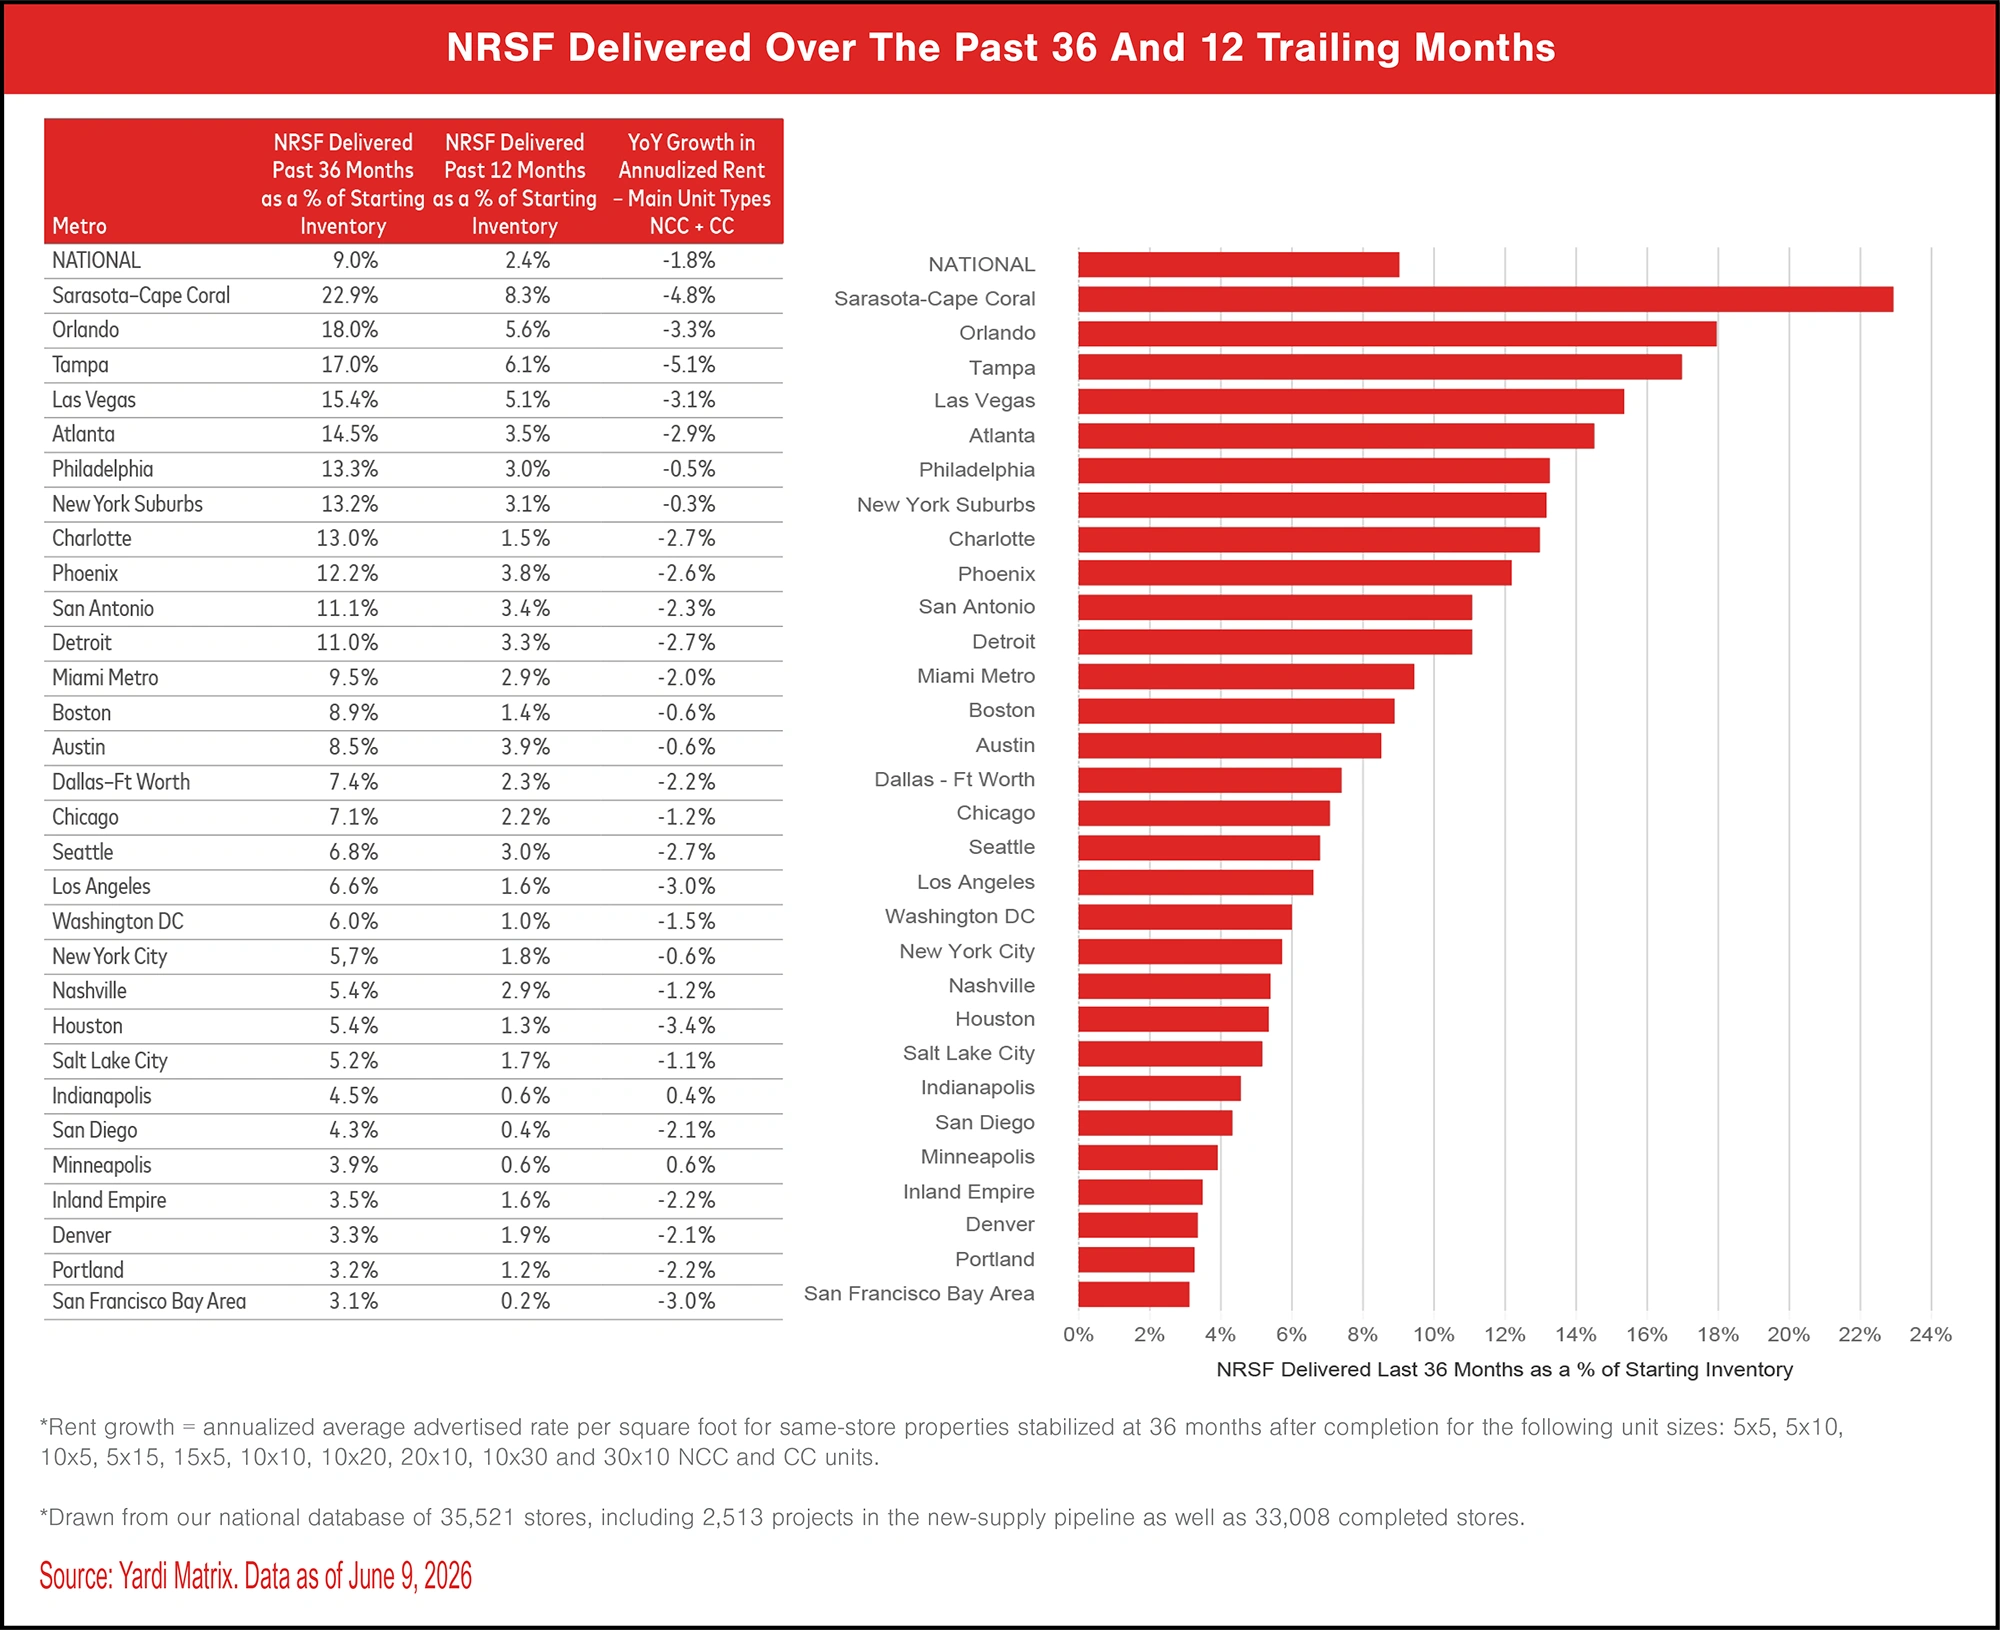
Florida markets stand out among those with elevated recent supply, with Sarasota–Cape Coral, Orlando, and Tampa ranking among the most supply-heavy metros. All three metros are still in lease-up.
have more trailing one-year and three-year supply than a year ago; as a result, they have seen some of the largest decelerations in advertised rate growth. In metros such as Orlando and Tampa, recent deliveries appear broadly distributed across the market; in other metros, new supply is more concentrated in specific trade areas. Sarasota–Cape Coral, also known as Southwest Florida, has seen notable recent supply in areas such as Fort Myers, which may be contributing to softer rate conditions in the broader area.
See NRSF Delivered Over The Past 36 And 12 Trailing Months table and chart.
Phoenix remained one of the most notable markets for active development, ranking near the top for under-construction supply for the second consecutive month. The market’s pipeline is now meaningfully ahead of most other top metros, indicating that operators will face ongoing supply-side pressure, especially as recently delivered projects continue to lease up.
See Under-Construction Supply By Percentage Of Existing Inventory table and chart.