



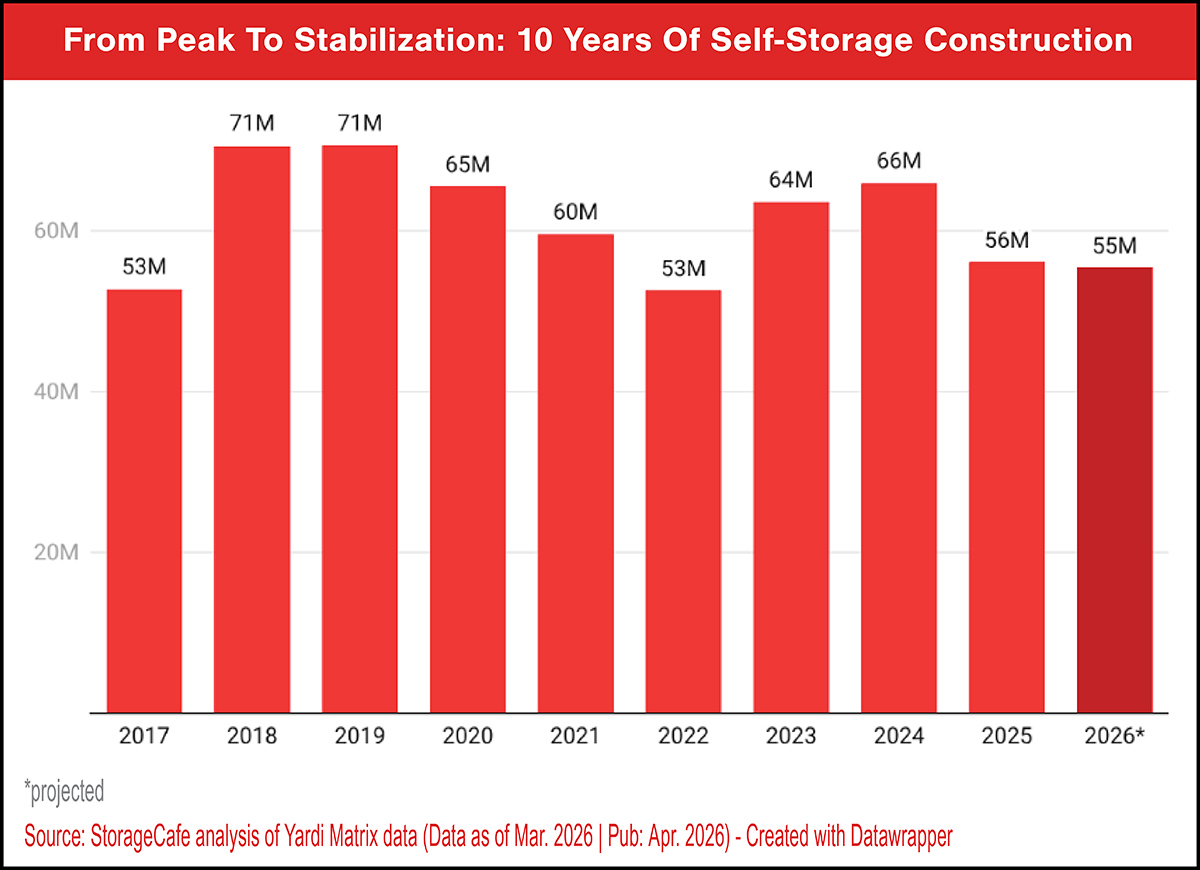
or most of the past decade, the self-storage industry ran hot. Construction crews raced to meet seemingly insatiable demand, annual deliveries surpassed 70 million square feet in both 2018 and 2019, and developers who hesitated watched their competitors capture markets first. That era of sprint or fall behind is over. What has replaced it is something more interesting, and ultimately more durable: a market that has learned to grow with discipline.
According to StorageCafe’s analysis of self-storage supply deliveries projected for 2026, approximately 55.4 million square feet of new self-storage space is projected to come online this year, a figure that closely mirrors 2025 and represents roughly 2.6 percent of the nation’s existing inventory. By the frantic standards of the late 2010s, that is a deceleration. By any other standard, it is a healthy, sustained expansion from an industry that has matured without stagnation.
See From Peak To Stabilization: 10 Years Of Self-Storage Construction chart.
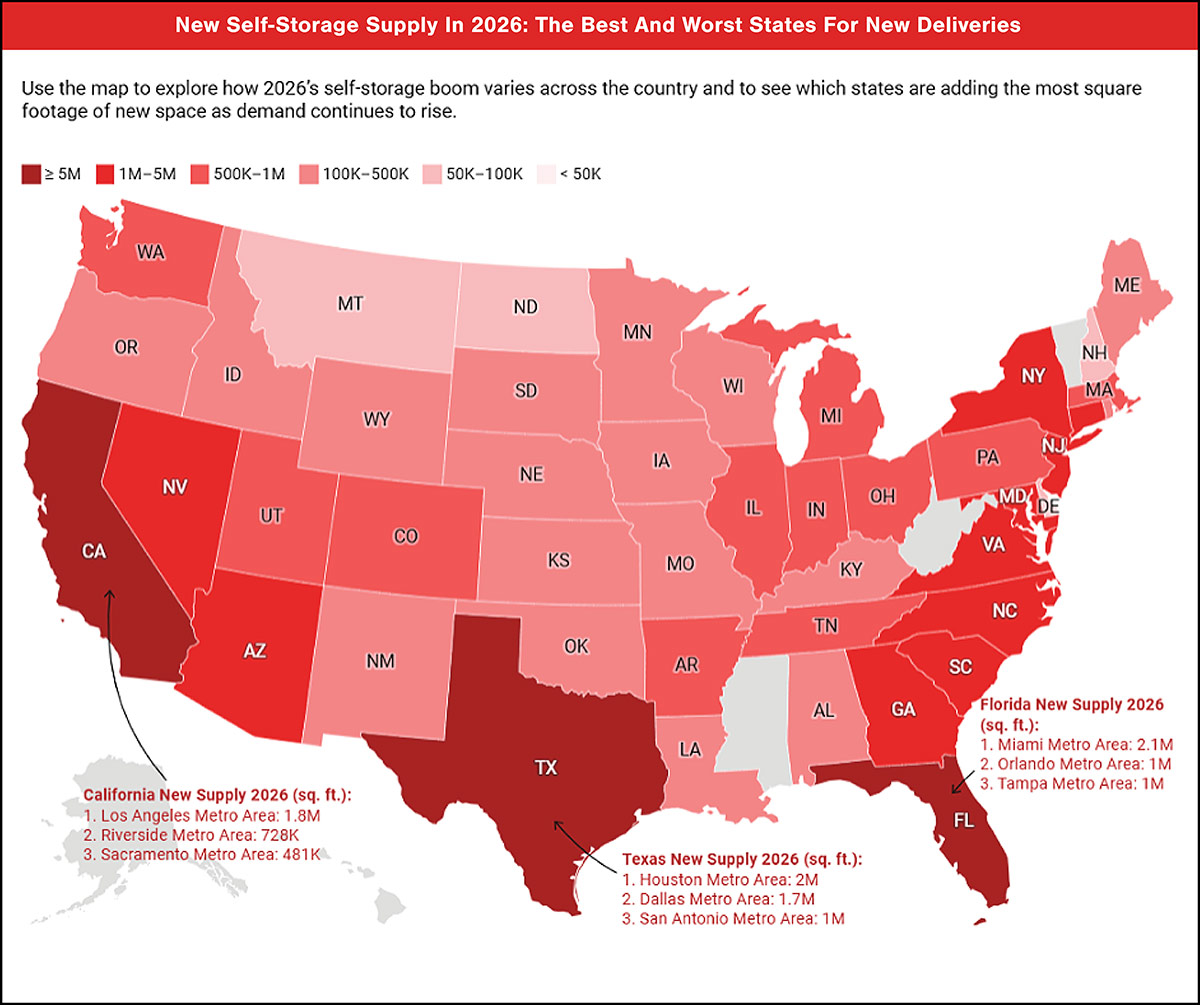
See New Self-Storage Supply In 2026: The Best And Worst States For New Deliveries map.
Net in-migration continues to underpin demand, though at more moderate levels than during the pandemic peak years. The state’s large retiree population, seasonal residents, and a housing market characterized by frequent turnover all contribute to durable storage usage. Statewide rents have declined 2.8 percent year over year, and several Gulf Coast markets face the steepest rent corrections in the country.
Meanwhile, Texas added 6.9 million square feet in 2026, a meaningful volume but spread across a state with one of the largest inventory bases in the country. Houston and Dallas-Ft. Worth each hold inventory bases that exceed 80 million square feet, which gives both metros the absorption capacity to accommodate new deliveries without the same proportional pressure Florida faces. Texas rents declined only 1.7 percent year over year, roughly half of Florida’s correction.
The New York metro alone has 3.2 million square feet scheduled for delivery this year, which places it first nationally in absolute volume. And yet, despite that lead, the metro remains the most undersupplied market among the top 20 for deliveries. Thanks to its high self-storage demand and low per-capita inventory, New York is the only metro in the top 10 where street rents are still on the rise, modestly at 0.6 percent year over year, but upward nonetheless. Meanwhile, New Jersey also has low per-capita availability, persistent demand, and new facilities that enter a market that has historically outpaced available space.
Connecticut has 1.1 million square feet of projected 2026 deliveries, which represents a 6 percent inventory expansion, a number that would be unremarkable in Florida but is genuinely notable in a dense, historically constrained Northeastern market.
The contrast with supply-constrained coastal cities is sharp. New York at 4.05 square feet per capita, Boston at 5.05, and Los Angeles at 5.1 all absorb new inventory as fast as it arrives, which leaves rents flat or on an upward path. These markets have spent years, in some cases decades, with demand that has consistently outrun supply.
These numbers reflect a broader structural shift: Self-storage demand has spread well beyond dense urban cores. What began as a product closely tied to small-apartment urban life has moved decisively into feeder markets, suburban corridors, and smaller regional hubs. Population growth, household formation, and lifestyle changes create genuine storage needs. Lumberton’s expansion serves not only local residents but a broader area of southeastern North Carolina, where recent manufacturing and health care investments have produced a positive outlook for household formation.
Farther south, Savannah, Ga., is seeing 17.5 percent inventory growth projected in 2026. Savannah attracts operator interest because of port activity, an industrial base on the rise, and a population profile that blends long-term residents with seasonal and transient layers. That combination of stable core demand plus variable auxiliary demand is the kind of demand structure that sophisticated storage operators actively seek.
See Big Swings In Small Markets: Where Inventory Is Jumping Most table.

In most major metros, new supply adds 2 percent to 5 percent to existing inventory. That is growth, but it is measured growth. The markets where proportional expansion runs higher (Phoenix at 7 percent, Cape Coral at 12 percent, parts of Florida’s secondary markets in the 10 percent to 14 percent range) are the same markets where price pressure is most visible. That is exactly the signal a well-functioning market should send.
Self-storage spent the better part of a decade set to grow as fast as capital and labor would allow. In 2026, it grows as fast as demand requires. That is a sign of maturity.