



Quarterly Download
he transition into 2026 appears to be trending towards a fundamental maturation of the self-storage sector, shifting away from pandemic-driven anomalies toward a more disciplined, structural rebalancing. The industry is finally showing signs of a perceived breakdown in the “lock-in effect” that previously froze residential mobility. As life events begin to outweigh the financial inertia of low-interest mortgages, there appears to be a steady thaw is restoring the traditional flow of demand. Based on this shift, the market appears to be trending towards a new operational baseline where success is defined by recalibrating strategies for a consistent interest rate environment rather than waiting for a return to historical peaks.
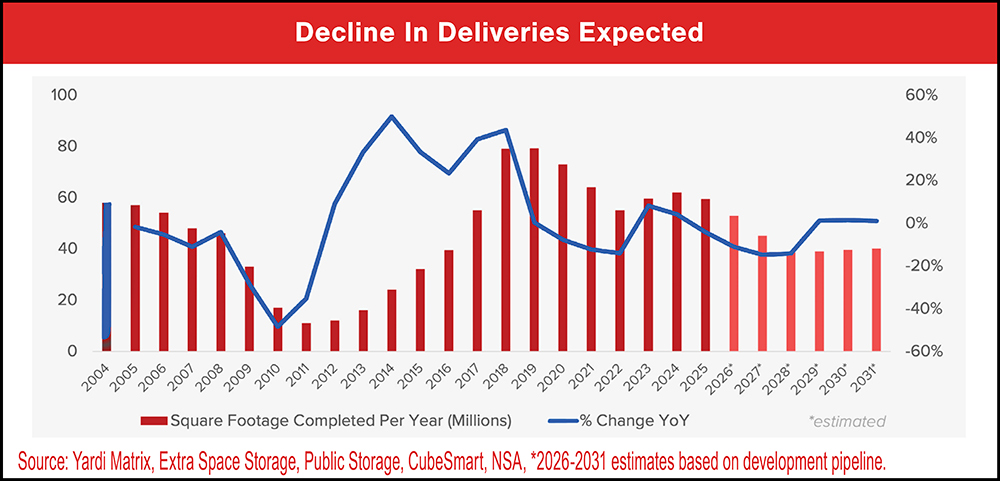
Simultaneously, the industry is showing signs of institutional consolidation, where massive, tech-enabled platforms are redefining competitive advantage. The recent surge in mega-mergers and strategic joint ventures suggests that self-storage has graduated to a core institutional staple, dominated by operators who leverage sophisticated data analytics to optimize performance. This structural evolution is supported by an aggressive contraction in the supply pipeline, which often acts as a strategic reset. By stemming the flow of new deliveries, the self-storage sector shows signs that it is allowing existing inventory to be absorbed, clearing the path for renewed pricing power and long-term yield stability in a more consolidated landscape.
Public Storage converged their web and in-store rates into a single price point. By eliminating the traditional “teaser” discount, this likely signaled an all-out push for volume during the slowest leasing months of the year. It’s a calculated bet: lower the barrier to entry in winter in order to capture necessity-driven renters; then, hope for longer stays and higher lifetime value.
See The Gap Widens Between Achieved Rates And In-Storage Asking Price chart.
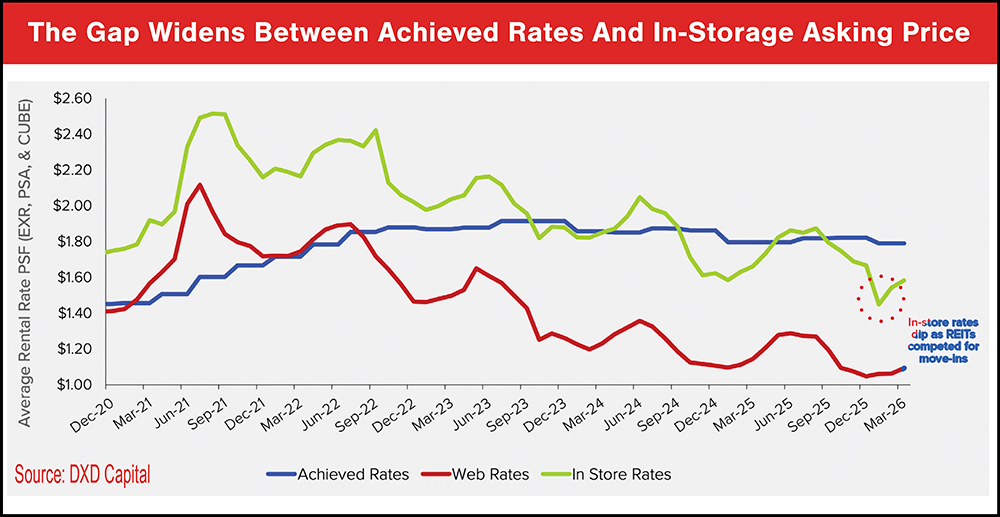
The tactical push to buy occupancy through lower entry rates has not been enough to offset persistent demand weakness in the housing market. Without meaningful home transaction volume, the relocation-driven demand that typically keeps the sector buoyant is simply absent. As we head into the spring leasing season, it seems the question is no longer when occupancy returns to the mid-90s—the question now likely whether 91.5 percent marks the cyclical trough or the beginning of a longer stay in the low 90s.
See Occupancy Rates Fall In The Last Quarter chart.

See Decline In Deliveries Expected chart.
Despite the cyclical reset of early 2026, Extra Space has maintained resilient fundamentals, helping to support the sector, even as weighted occupancy fell to a new low of 91.5 percent. The company’s continued investment in scaling its third-party management platform, combined with a disciplined acquisition approach, reinforces its position as one of the sector’s primary growth engines and a benchmark for institutional-quality operational execution in self-storage.
See Total Return chart and REIT infographics.

See Self-Storage REIT Returns Hold Strong chart.

See Distressed Rates By Property Type chart.

The problem is the gap between the number of buyers and sellers. With roughly 470,000 more sellers than buyers, transaction volume has not reached the critical mass needed to break the current occupancy stalemate. Until active listings convert into closed deals and actual moves, weighted occupancy is likely to remain anchored near 91.5 percent.
See Estimated Number Of U.S. Homebuyers And Sellers Actively In The Market chart.


See Net Rentable Square Feet Under Management chart.

See Stabilized Storage Sales and Lease-Up Storage Sales tables.
