o succeed in the self-storage investment world, it’s important to understand all the different “rates” and what they mean. Someone breaking into the industry would likely be confused by the terms “web rates,” “street rates,” and “achieved rates.”
- Why are there three different rates?
- What do they mean?
- What is their relationship to each other?
- Which rate should I use in my underwriting?
There are complicated answers to these questions, but the data we will look at in this column will shed some light on the subject. To begin, let’s look at some simple definitions.
Web Rates – The rates advertised online, often discounted to attract price-sensitive shoppers. These typically include short-term promotional pricing.
Street Rates – The street rate for a particular unit is the rate that a customer would be charged if they were to walk in off the “street” and rent a unit in person at the facility. Given that customers are less likely to price-shop in this scenario, the street rate is typically higher than the web rate.
Achieved Rates – The actual rates paid by existing tenants, which can be lower or higher than street rates. Achieved rates are the best rates to use when underwriting deals since they are actual rates that tenants pay. However, it’s difficult to find this data on a large scale and most operators are unwilling to provide this data, especially to potential competitors.
Luckily, the publicly traded self-storage REITs provide helpful data in their public filings. In this column, we’ve combined publicly available achieved rate data along with TractIQ’s street rate data to uncover interesting trends for you to consider in your underwriting.
First, let’s jump into some street rate data and achieved rate data from Extra Space Storage.
See the Extra Space Achieved and Extra Space Street chart.
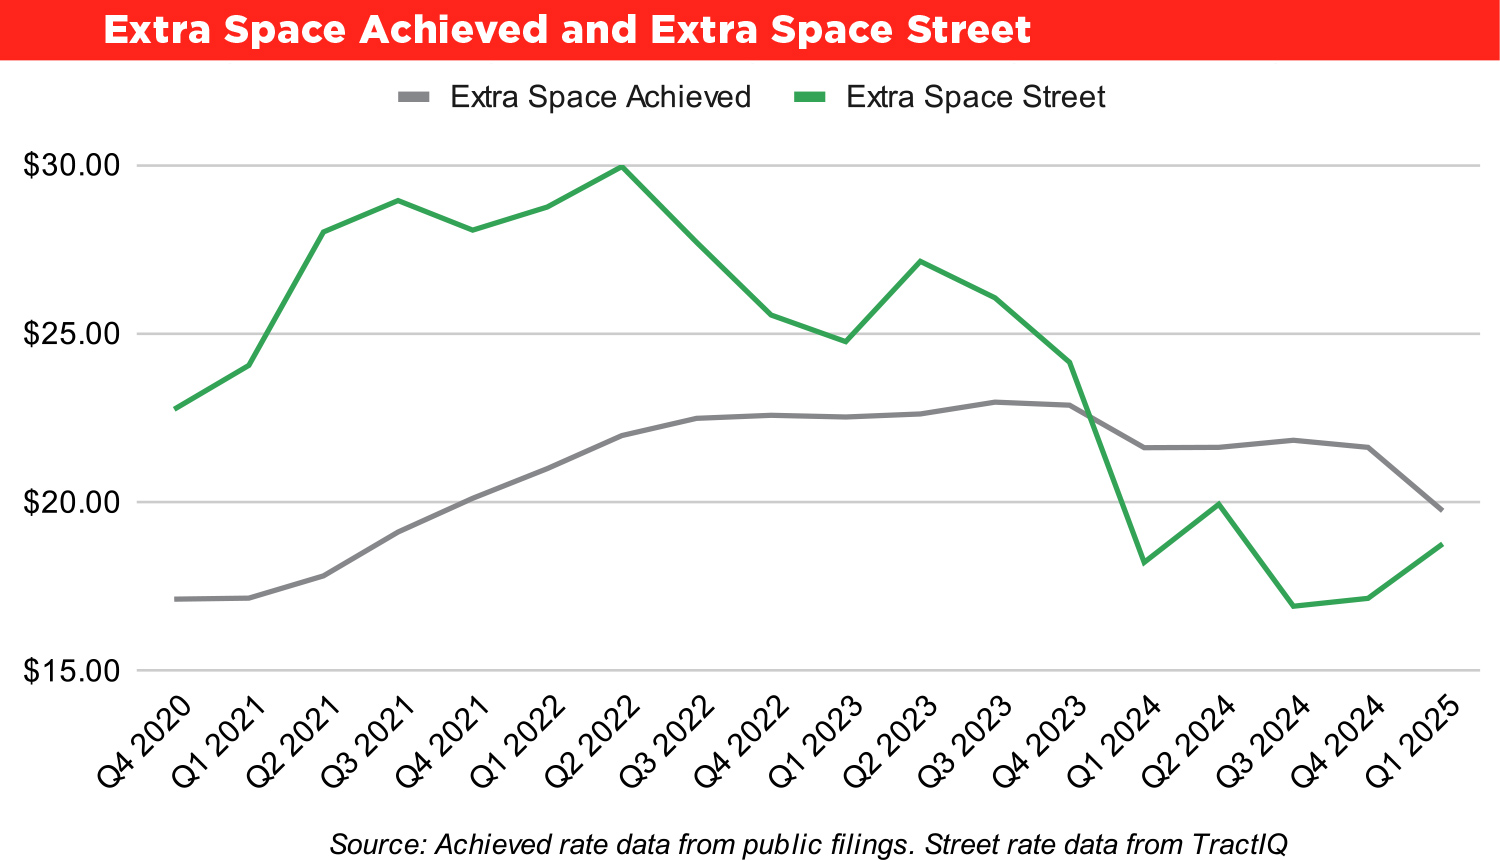
By the way, the reason street rates were higher during this time was mainly due to high demand. Operators had more pricing power because demand was heightened during a time of high mobility and low interest rates caused by the COVID pandemic.
Now, let’s look at the trend since 2023. As interest rates spiked and mobility decreased starting in 2023, demand for storage also decreased. This is supported by data in the chart; you can see operators losing pricing power and street rates starting to decrease. By 2024, discounting practices were widespread and street rates being below achieved rates became the new trend.
However, something interesting has happened in the first quarter of 2025. As you can see from the chart, street rates and achieved rates are nearly identical. The spread between street rates and achieved rates is only 5.2 percent as of Q1 2025. Compare this to Q2 2021, when the spread was 36.3 percent.
This data suggests that pricing power for operators and general self-storage demand may be returning to the industry. Only time will tell if this trend continues, but it is at the very least a positive sign. This data also shows what a unique time we may be in for underwriting deals. Now more than ever, street rates are more useful in predicting achieved rates since the spread between the two is so narrow.
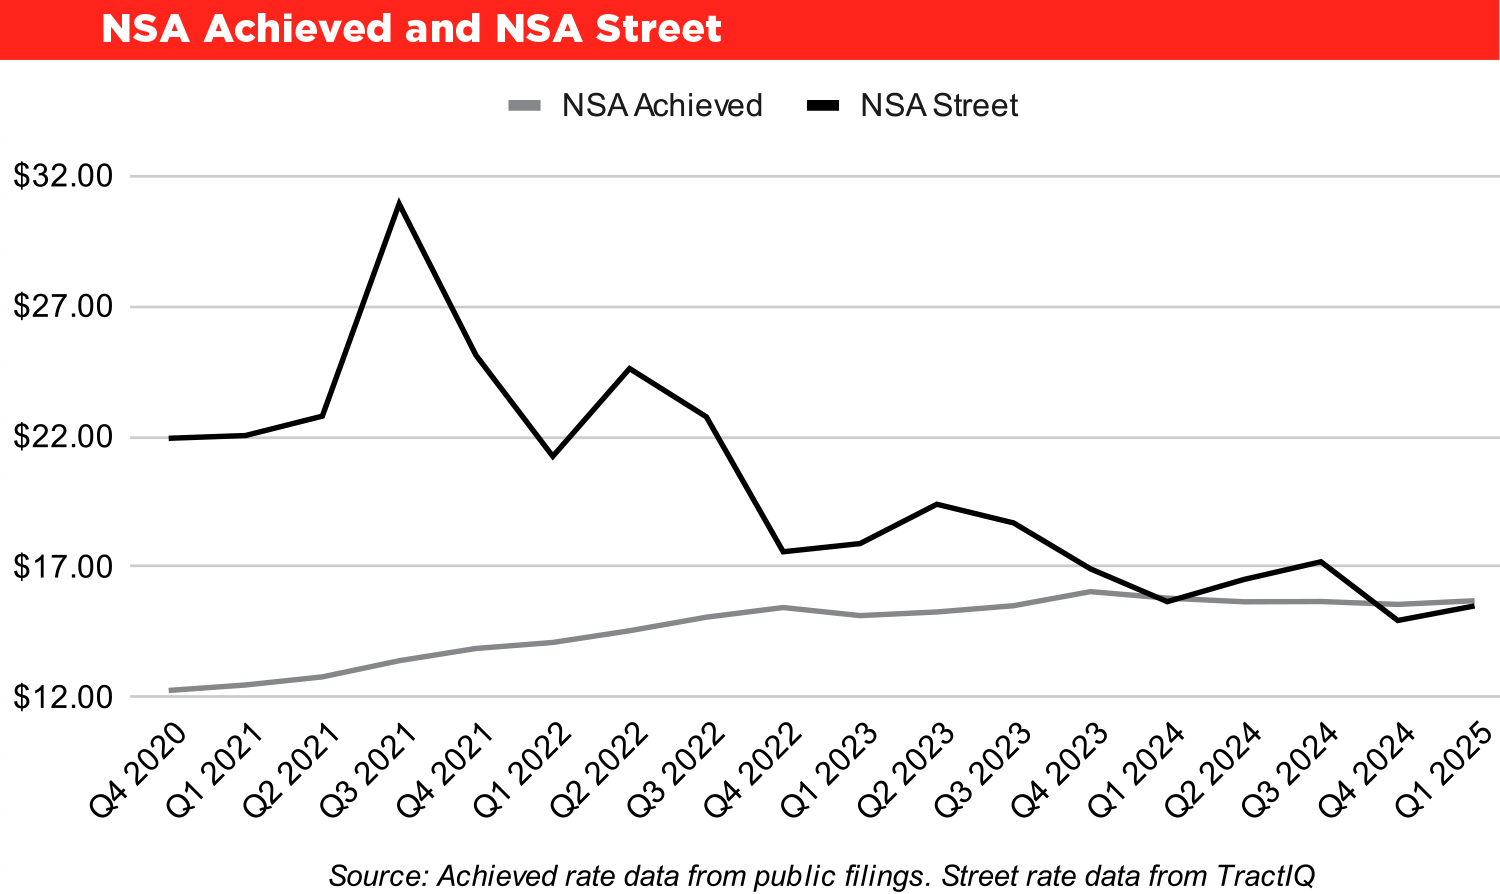
Please keep in mind that the previous data and commentary only apply to Extra Space Storage. However, other publicly traded REITs are showing similar trends. Let’s look at CubeSmart next.
See the CubeSmart Achieved and CubeSmart Street chart.

See the NSA Achieved and NSA Street chart.
See the Public Achieved and Public Street chart.

In conclusion, the data is showing that now is a unique time for self-storage investors. If the REITs are a good indicator of the broader market, then using street rates to predict achieved rates has never been easier in recent years. Using the best data to make the best decisions is vital to succeeding in a tumultuous self-storage real estate market.