M icon
Data
What’s In The Pipeline?
Yardi Matrix Q4 2023 Self-Storage Supply Forecast
By Ben Bruckner
T

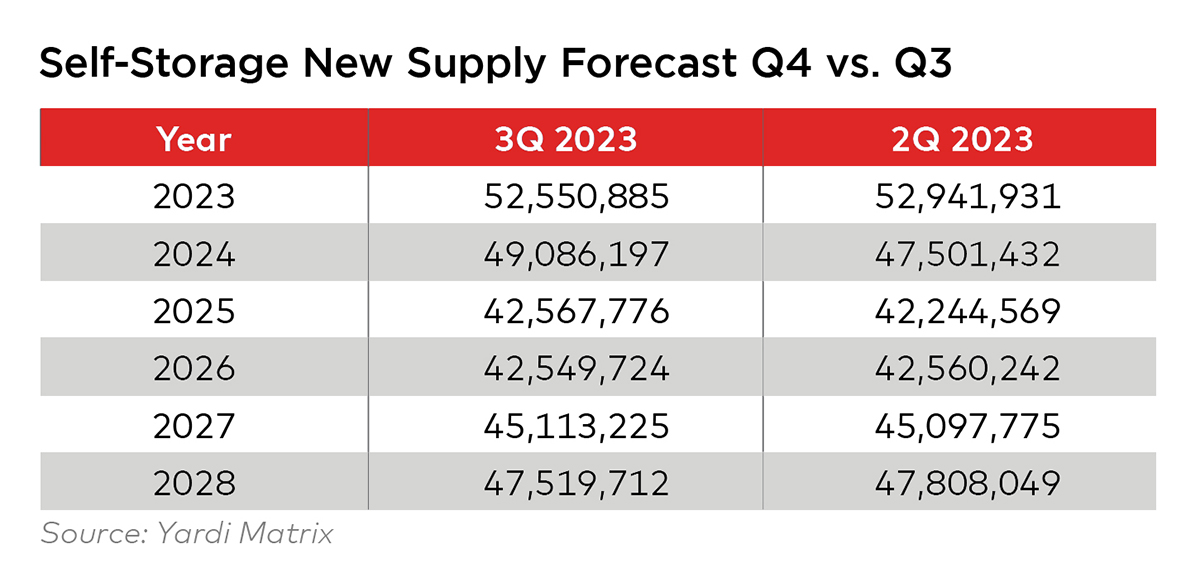
he Q4 2023 Self-Storage Supply Forecast update by Yardi Matrix has increased forecast deliveries for 2024. For all other years, the forecast is relatively unchanged from the previous quarter’s forecast.
(see Self-Storage New Supply Forecast Q4 vs. Q3 table)

Self-Storage New Supply Forecast Q4 vs Q3
Near-Term Forecast: 2023 To 2025
The near-term forecast is relatively unchanged for 2023 and 2025 but has been increased by 3.3 percent for 2024.

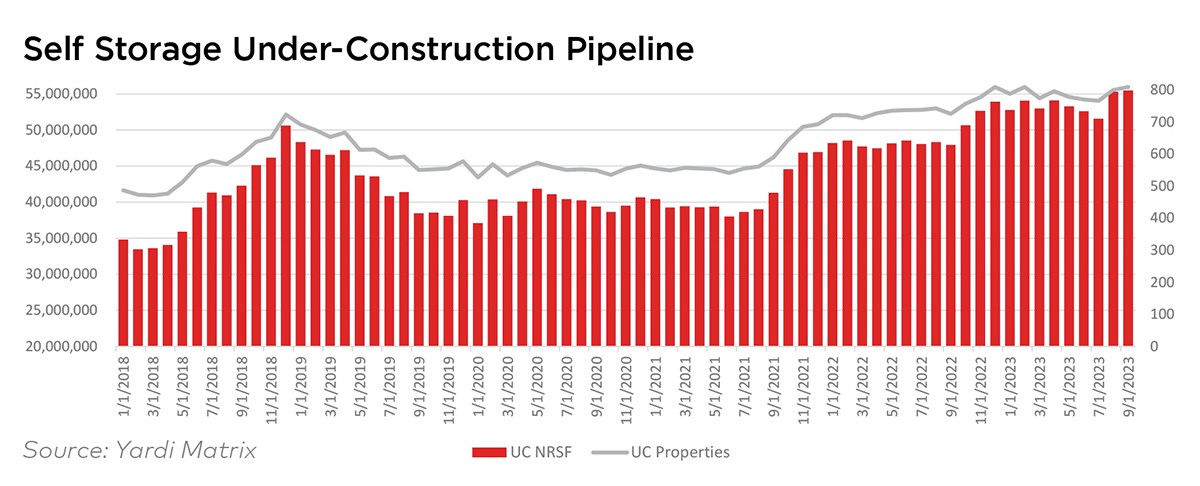
For the first half of 2023, the under-construction pipeline averaged 53.3 million rentable square feet (RSF). In Q3, however, the pipeline expanded modestly to 55.5 million RSF. This represents a 5.5 percent increase quarter over quarter and a 15.7 percent increase year over year. The modest Q3 expansion in the under-construction pipeline is the main rationale behind this forecast update’s increased 2024 supply.
(see Self-Storage Under-Construction Pipeline chart)

Self Storage Under-Construction Pipeline
The Q3 under-construction pipeline expansion was driven by an increase in construction starts that began in Q1 2023 and continued into Q2. Since Q1 2021, the trailing four-quarter average for construction starts has roughly stayed in a range between 10.5 and 11.5 million RSF. Q1 2023 construction starts totaled 14.1 million RSF, while Q2 construction starts currently total 13.5 million RSF. The Q2 2023 trailing four-quarter average is 12.8 million RSF.

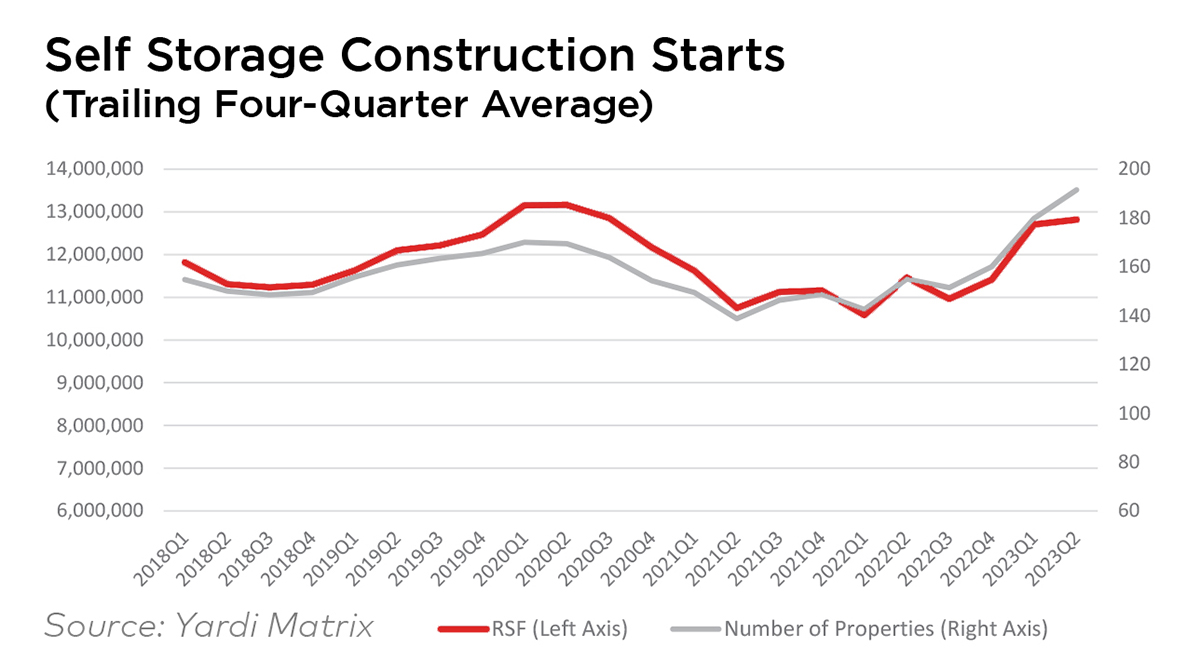
Our longer-range forecast anticipates tightening credit conditions will depress new construction activity in the latter half of 2023 and into 2024. How new construction starts evolve is something our entire research team is closely monitoring.
(see Self-Storage Construction Starts chart)

Self Storage Construction Starts
Days in construction continues to moderate. The post-pandemic surge in completion times contributed to the under-construction pipeline’s expansion. However, this trend looks to be reversing. In Q3 2023, our database identified 103 property completions that on average took 377 days to complete. This is below the current trailing four-quarter average of 405 days.
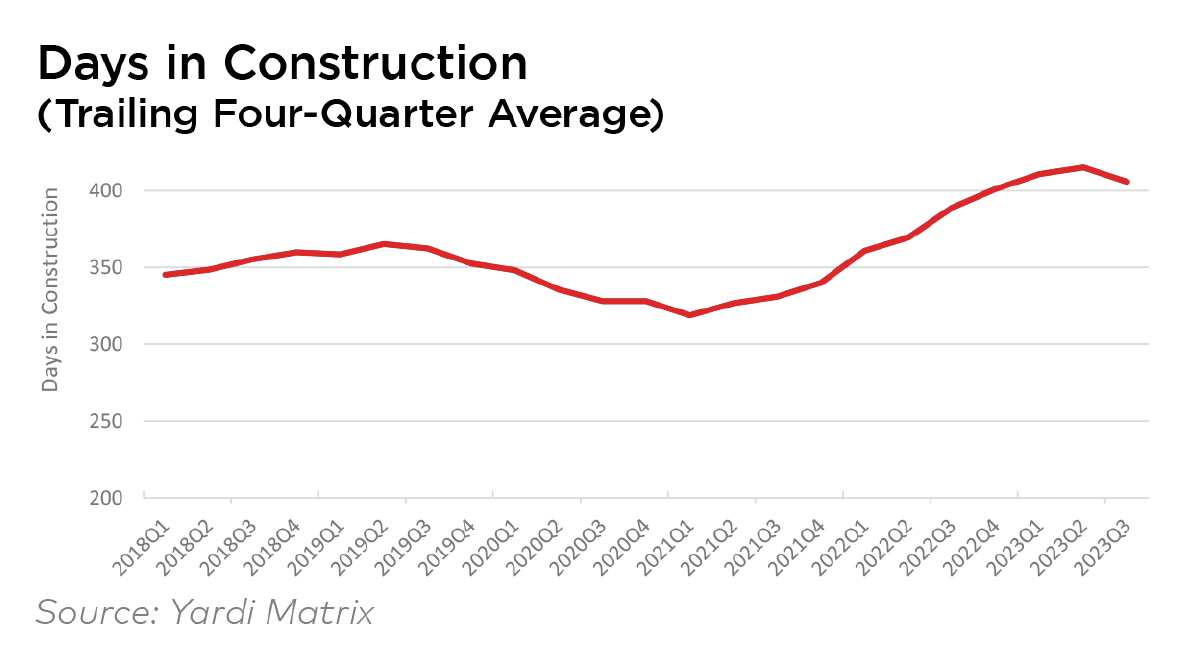
(see Days in Construction chart)
Days in Construction
Long-Term Forecast: 2026 To 2028
Compared to the Q3 2023 forecast update, the Q4 update is substantially unchanged for the latter half of the forecast horizon. The forecast continues to contemplate a combination of a difficult financing environment and a late-2023 or early-2024 recession that will negatively affect self-storage development fundamentals. The combination results in a slowdown in new construction starts that lasts through 2024. As a result, completions will bottom in 2026 at around 42.5 million RSF, with a modest rebound taking hold thereafter.
“For the first half of 2023, the under-construction pipeline averaged 53.3 million RSF.”

-Ben Bruckner
For the first time since early 2022, the planned pipeline did not expand in Q3 2023. The planned pipeline currently contains 111.0 million RSF, which represents a 0.1 percent decline quarter over quarter and a 20.3 percent increase year over year.
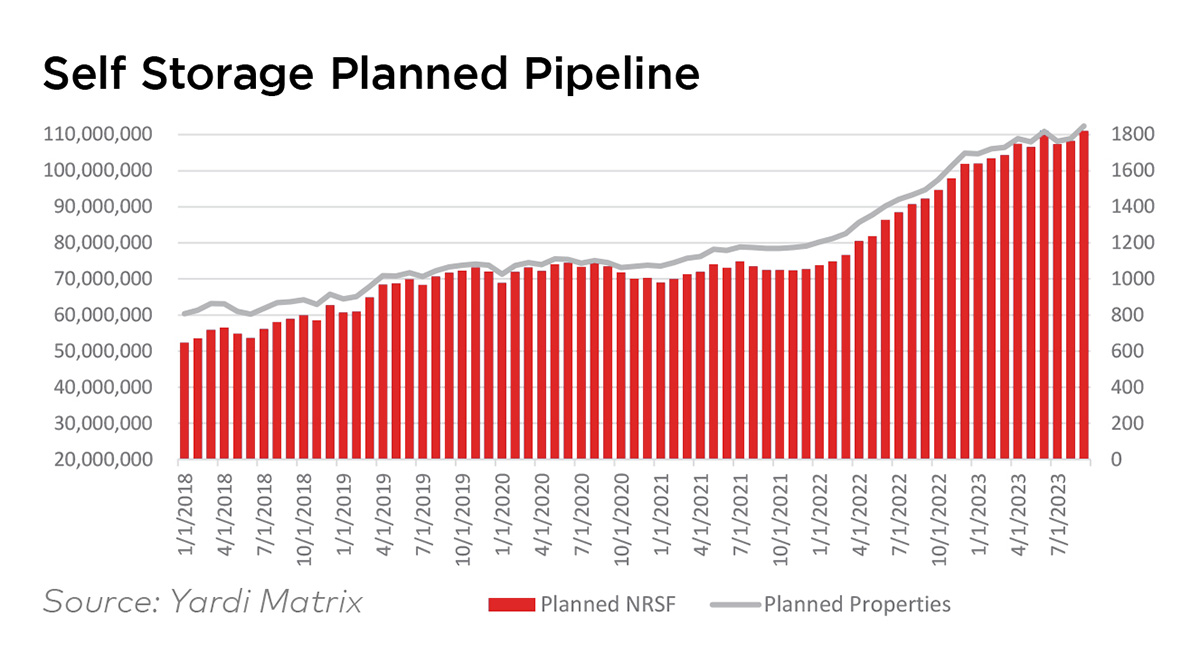
(see Self Storage Planned Pipeline chart)
Self Storage Planned Pipeline
Days in planned increased significantly post-pandemic and then plateaued around 400 days through Q2 2022. The initial increase was likely caused by supply constraints that slowed completions and delayed construction starts. However, since Q4 2022, days in planned has materially increased. Current Yardi Matrix data identifies 86 properties that started construction in Q3 2023. These properties spent an average of 547 days in the planned phase.
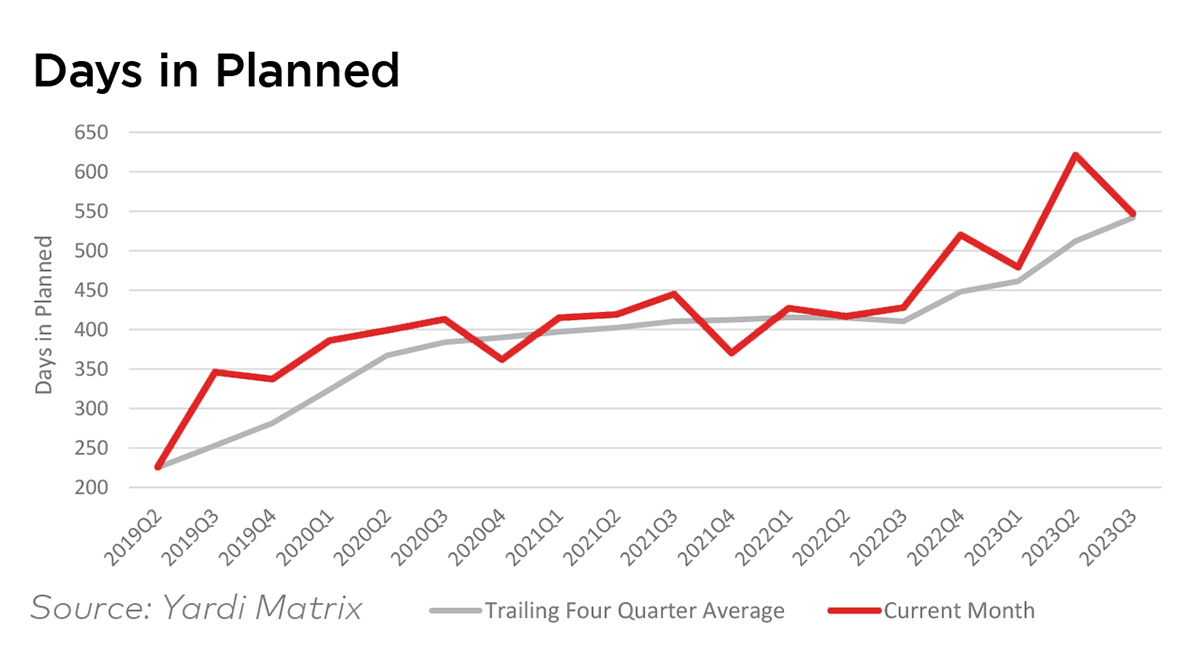
(see Days in Planned chart)
Days in Planned
Currently, the trailing four-quarter average stands at 541 days. The surge in days in planned suggests developers are facing increasing headwinds in starting new projects in 2023. Like the planned pipeline, the prospective pipeline declined modestly in Q3 2023. Currently, the prospective pipeline stands at 43.9 million RSF, a 1.3 percent decrease quarter over quarter and a 26.6 percent increase year over year. After expanding noticeably in late 2022, the prospective pipeline has been on a bumpy plateau for the better part of 2023.
“Expansion in both the planned and prospective pipelines has plateaued …”

-Ben Bruckner
The Yardi Matrix database has also identified an increasing number of projects with an abandoned status since mid-year. In September, 31 projects were categorized as abandoned, with the three-month moving average increasing to 27 properties. This data series bottomed in the summer of 2022.
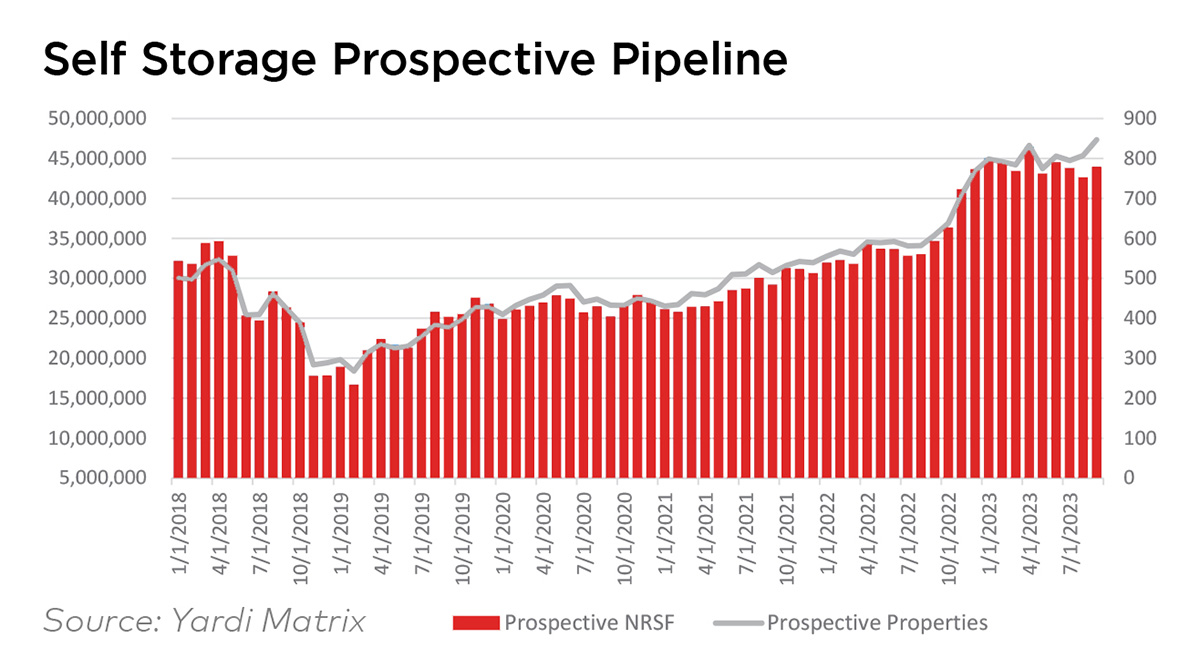
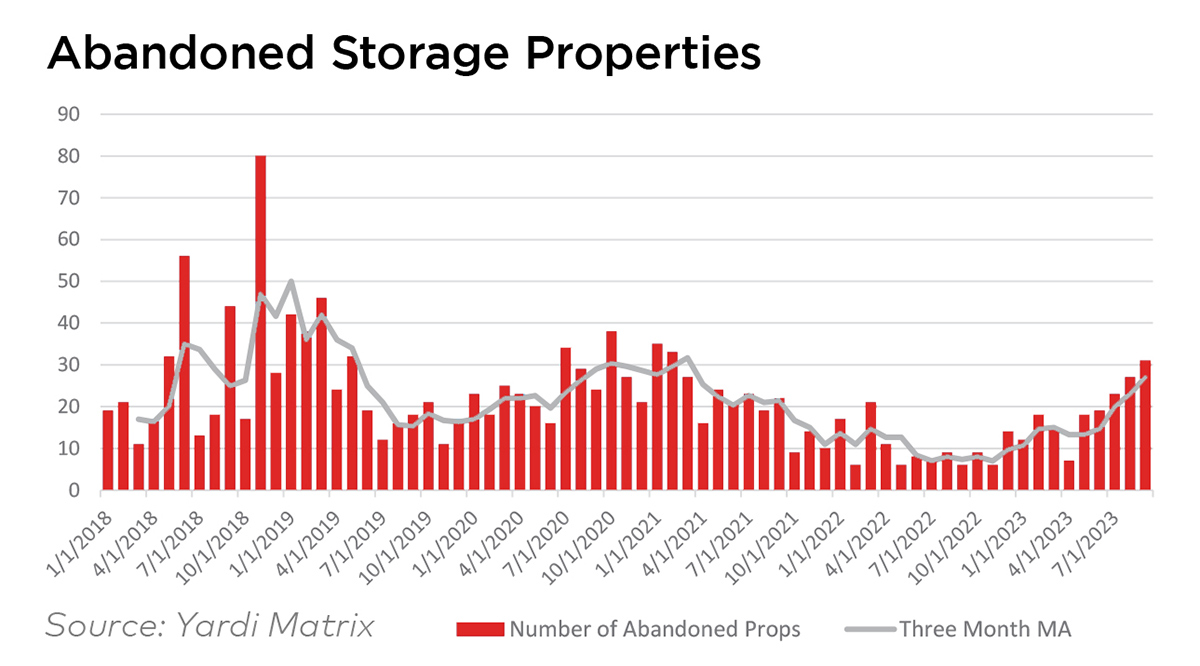
(see Self-Storage Prospective Pipeline and Abandoned Storage Properties charts)
Self Storage Prospective Pipeline
Abandoned Storage Properties
Bottom Line
Construction starts increased in the first half of 2023, driving an expansion in the under-construction pipeline. As a result, the supply forecast has increased for 2024, while other years remain unchanged.

The forecast continues to assume that a combination of tight financial conditions and a mild downturn in the national economy will depress construction starts in the second half of 2023 through 2024. This will dampen completions in 2025 and 2026, with a rebound taking hold in 2027 and 2028.

Several data points from Q3 2023 suggest the above thesis is beginning to play out. Expansion in both the planned and prospective pipelines has plateaued, days in planned remains at historically high levels, and the number of abandoned projects has increased since mid-year.

Ben Bruckner is Yardi’s senior research analyst.