
magine you have found the perfect self-storage facility to invest in. Buying right is only half the equation to a successful deal. Now it’s time to execute on the business plan and produce a profitable investment. How do you decide the best way to operate a facility? When it comes to managing self-storage properties, investors have a few options:
- Self-manage,
- Remote management, or
- Outsource to a third party.
So, which management solution is right for you? It depends on your goals. There isn’t a one-size-fits-all approach to every situation. Are you looking to scale and grow your self-storage investment business? Third-party management might be right for you. Are you looking to maximize profits and stay small? Perhaps self-management is something you should consider.
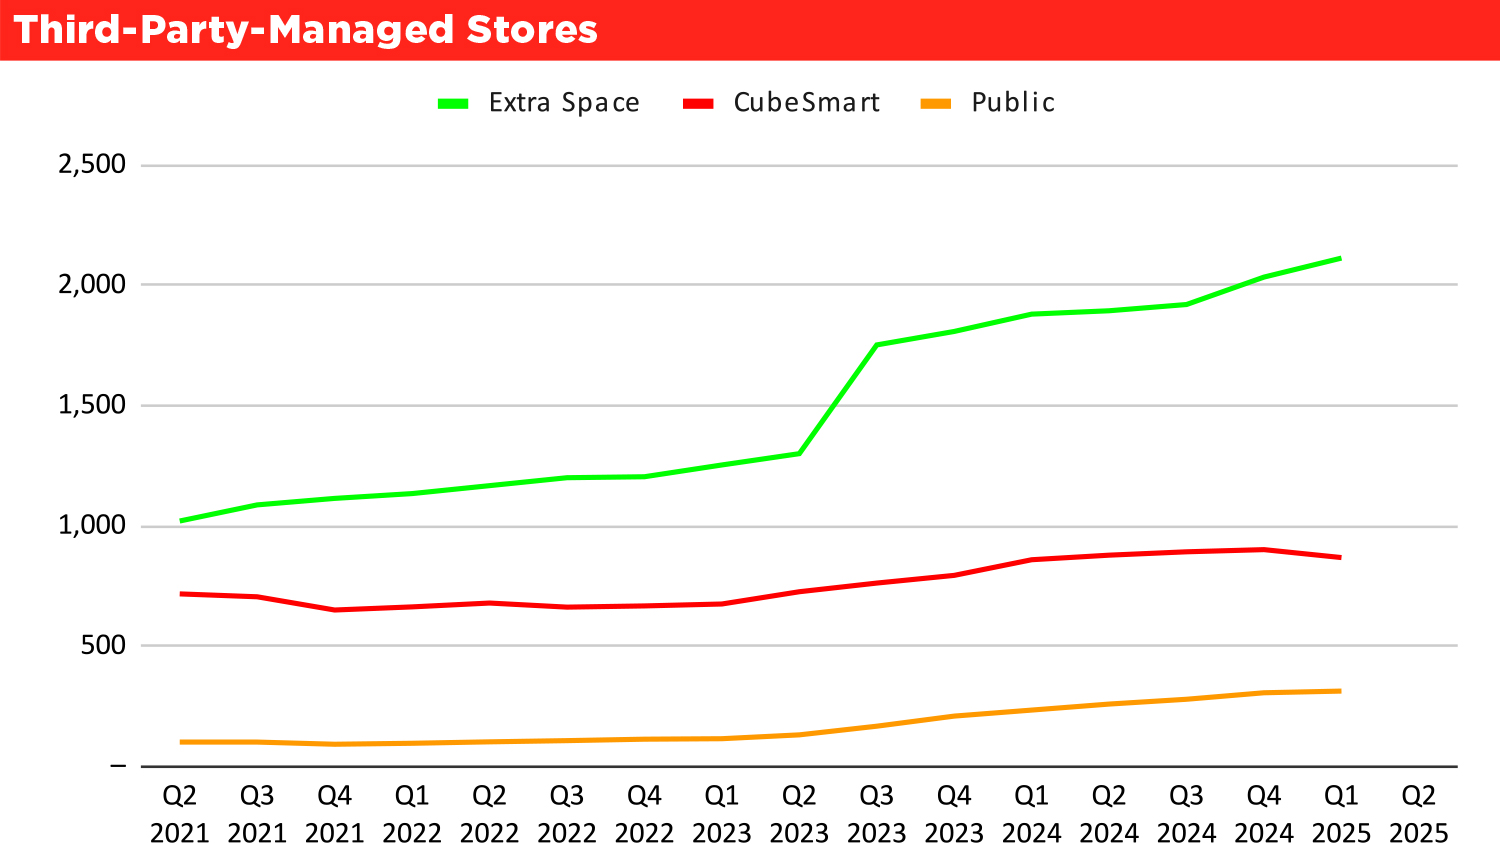
The top three publicly traded REITs in the industry (Extra Space Storage, CubeSmart, and Public Storage) manage hundreds of facilities on behalf of other owners. The chart Third-Party Managed Stores shows how many facilities each REIT manages.
See the Third-Party-Managed Stores chart.
Having the most third-party managed stores doesn’t necessarily lead to the best performance. Have you ever wondered if one REIT outperforms the others in a given market? Which REITs have the highest achieved rates in a given MSA? Should this factor into your decision when choosing a REIT to manage your facility?
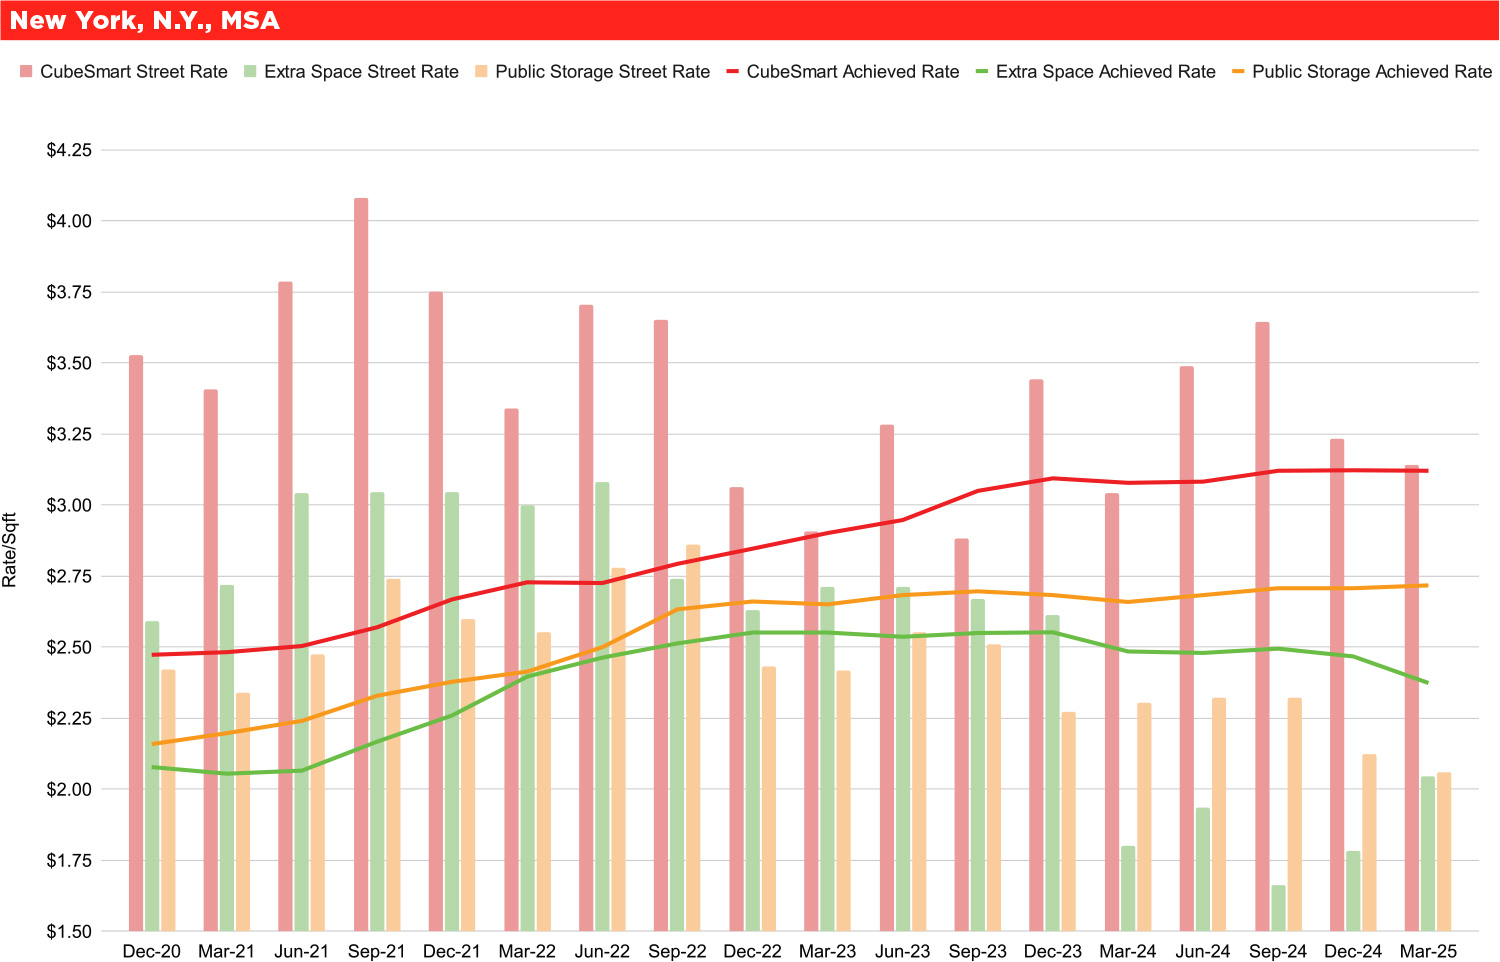
The bar graph compares REIT achieved rates and street rates for the New York, N.Y., MSA going back to Q4 2020.
See the New York, N.Y., MSA chart.
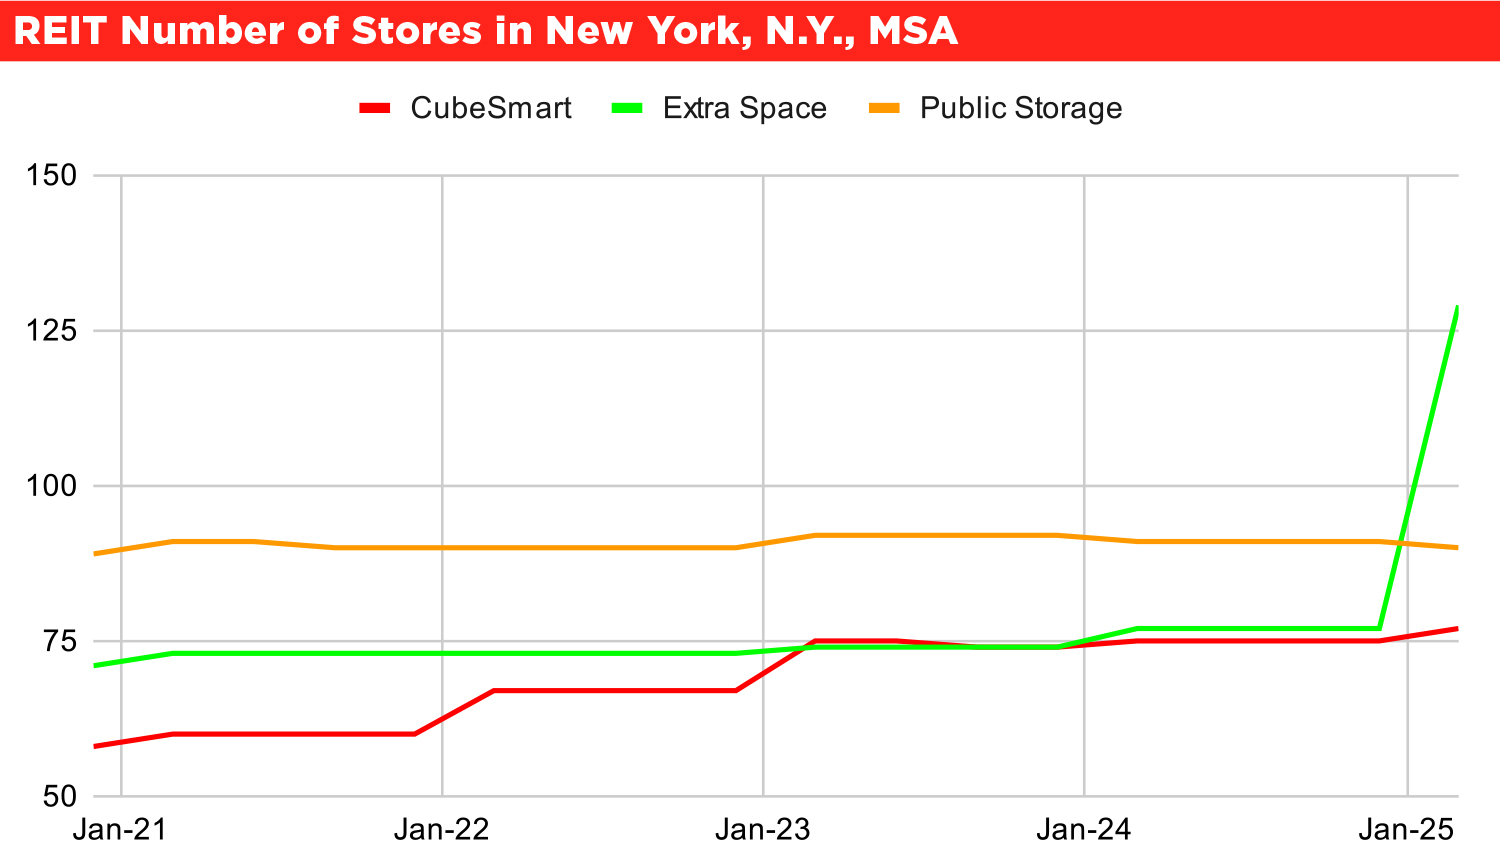
Why is CubeSmart achieving such better rates in this MSA? Does it have something to do with scalability and the number of stores owned in the market?
See the REIT Number of Stores in New York, N.Y., MSA chart.
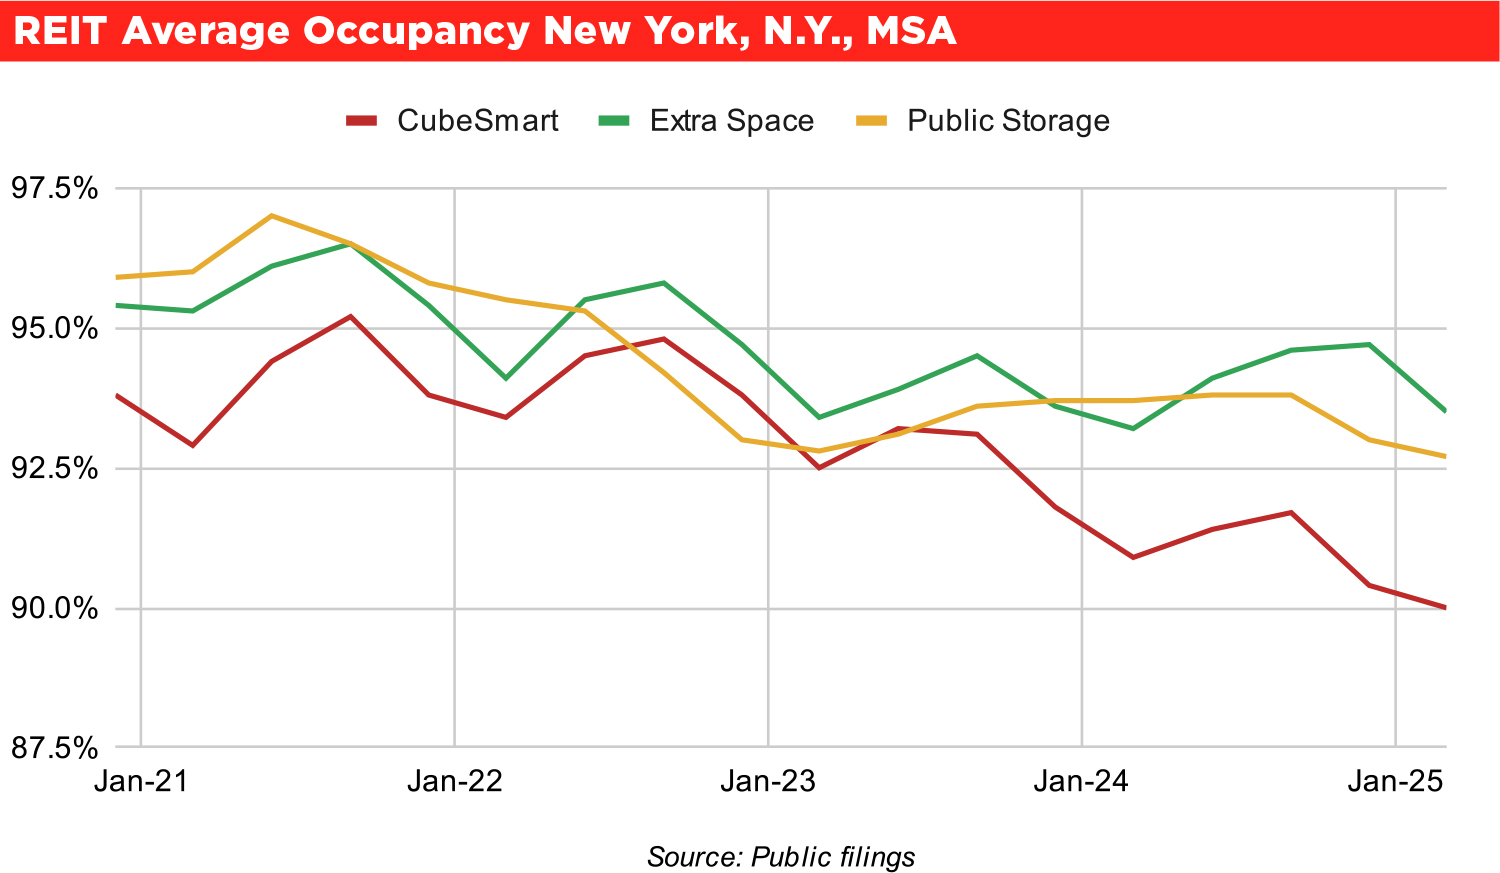
What does the occupancy story tell us?
See the REIT Average Occupancy – New York, N.Y., MSA chart.
You will notice in the first chart that CubeSmart has taken a contrarian approach in this market. CubeSmart’s street rates (advertised rates) are currently slightly higher than their own achieved rates. Compare this to Public Storage and Extra Space, which currently have street rates lower than achieved rates. This hasn’t always been the case for Public Storage and Extra Space. Previous to 2023, advertised rates for Public Storage and Extra Space were higher than achieved rates, and only recently that trend has reversed. This is likely an attempt to entice new customers in a market with lower demand.
CubeSmart has largely maintained their unique pricing strategy since Q4 2020. In fact, since Q4 2020 CubeSmart’s street rates have, on average, been 20.9 percent higher than their achieved rates. Extra Space’s street rates have, on average, been 7.6 percent higher than their achieved rates since Q4 2020. Public Storage’s street rates have actually, on average, been 2.7 percent lower than their achieved rates since Q4 2020.
By keeping advertised rates higher than competitors, CubeSmart captures higher revenue from the first day a new customer rents a unit. This boosts overall move-in revenue and achieved rates. In fact, from Q4 2020 to Q1 2025, CubeSmart has increased achieved rates by 26.1 percent, the highest compared to Extra Space (14.2 percent increase) and Public Storage (25.8 percent increase). In CubeSmart’s Q3 2024 earnings call, CubeSmart commented on attracting the highest quality customers who are willing to pay “premium rates.” CubeSmart also commented that these higher quality customers “tend to stay longer and are less sensitive to price increases.” The data we are seeing (higher street rates from CubeSmart) supports CubeSmart’s commentary on the subject. On the flip side, CubeSmart isn’t attracting price sensitive customers due to higher initial rates, so naturally CubeSmart’s occupancy will suffer compared to competitors with lower advertised rates. Extra Space is implementing the opposite strategy than CubeSmart in the market (lower advertised rates leading to lower achieved rates and higher occupancy).
Even though occupancy for all three REITs has decreased since 2022, achieved rates have stayed the same, or even increased in CubeSmart’s case. The data suggests that CubeSmart’s higher move-in rates have led to higher achieved rates and lower occupancy than competitors in New York.
When comparing the performance of REITs within the New York market, we must talk about expenses. The REIT Expense Ratios – New York, N.Y., MSA table shows expense ratios over the last year for each REIT within the New York MSA.
See the REIT Expense Ratios – New York, N.Y., MSA table.

Let’s analyze a simple hypothetical example using all the data discussed above and look at potential net operating income (NOI) and value of a 50,000 square foot facility for each REIT.
See the Hypothetical REIT Property Valuation Example.
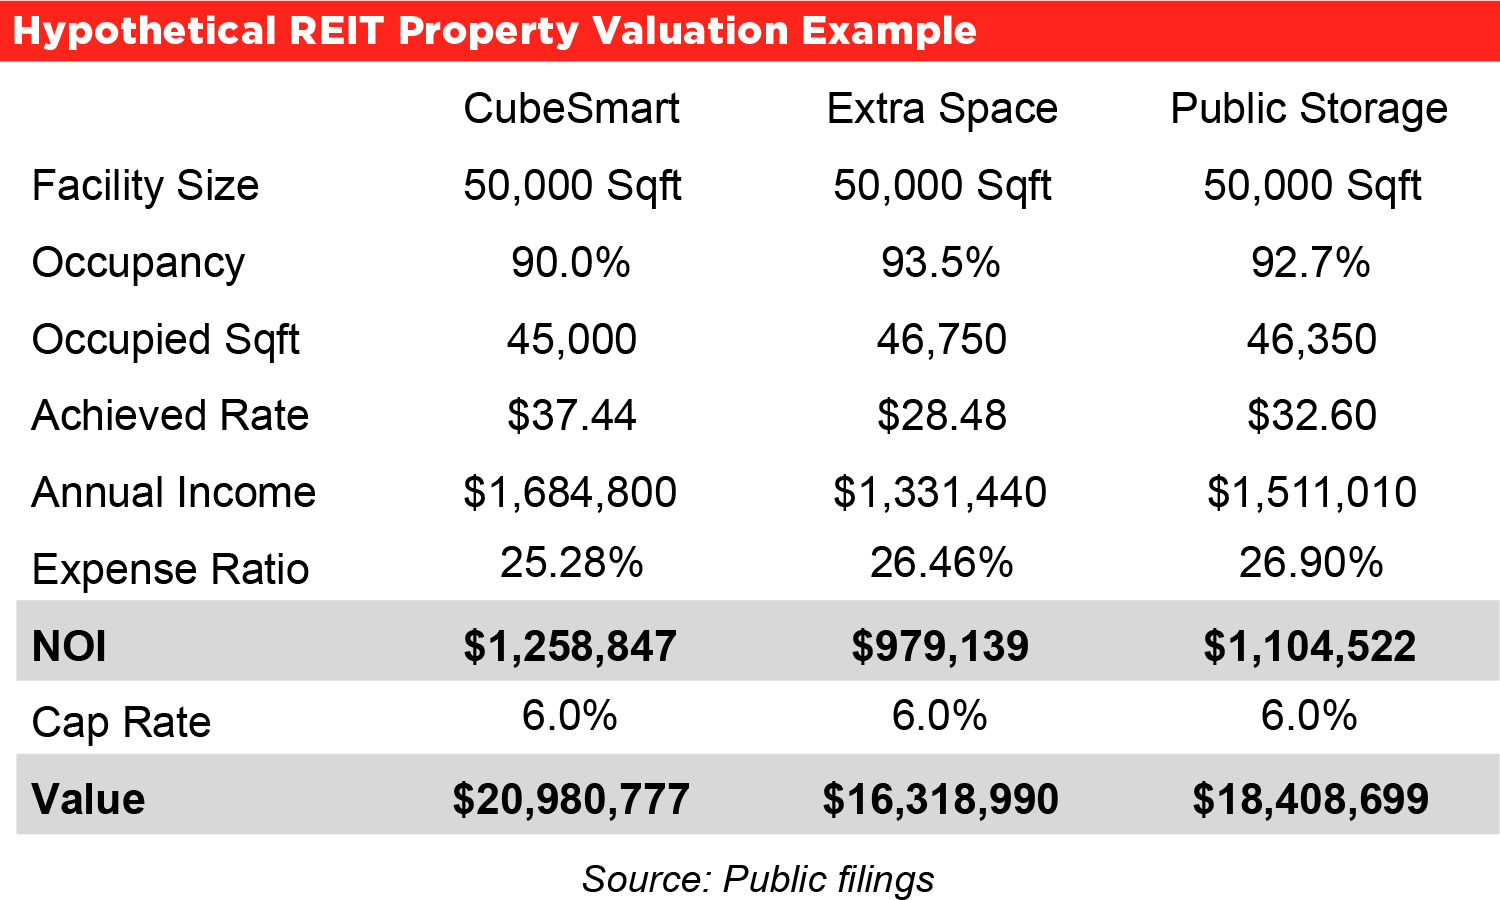
It is worth noting the above analysis doesn’t account for tenant insurance revenue sharing. Each REIT differs in the amount of revenue from tenant insurance, if any, that is shared with the owner when a REIT is hired for management. Tenant insurance revenue sharing is a topic worth discussing when considering hiring a REIT to manage your property.
In conclusion, CubeSmart is achieving the highest rates with the best expense ratio and has outperformed the other REITs since Q4 2020. If you are an active investor in the New York MSA and are considering hiring a REIT to manage your property, CubeSmart has a good argument to make for management.
If you want more data on other MSAs, reach out to support@tractiq.com or visit our website, tractiq.com/reits-compare-across-top-msas, to download your full report.