M icon
feature story
2024 Reader Survey Results
Today’s Challenges, Tomorrow’s Opportunities
By Brad Hadfield
T

he results are in! As those of you who took our recent reader survey know (thank you for participating), MSM did things a little differently this year. Along with asking questions about our publications to help us continuously improve and write about the topics that matter to you, we asked some questions about the state of the industry, challenges and opportunities on the horizon, and more. It’s our pleasure to present to you a summation of what your colleagues in the self-storage universe had to say.

Respondent Demographics
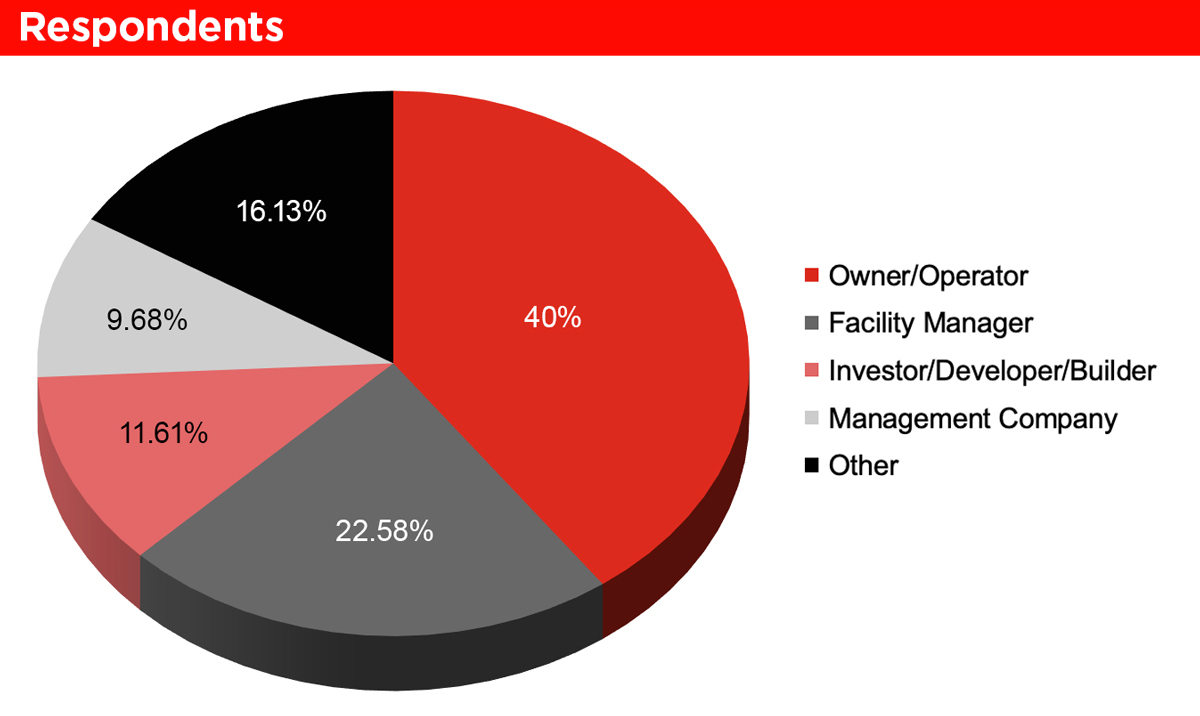
First, let’s take a look at the roles and responsibilities of our various respondents, the number of facilities they’re involved with, and their location. Unsurprisingly, owners and managers made up the bulk of our respondents. (Note: Other category includes architects, vendors, state association directors, brokers, consultants, appraisers, and insurance agents.)

See Respondents pie chart

Respondents pie chart
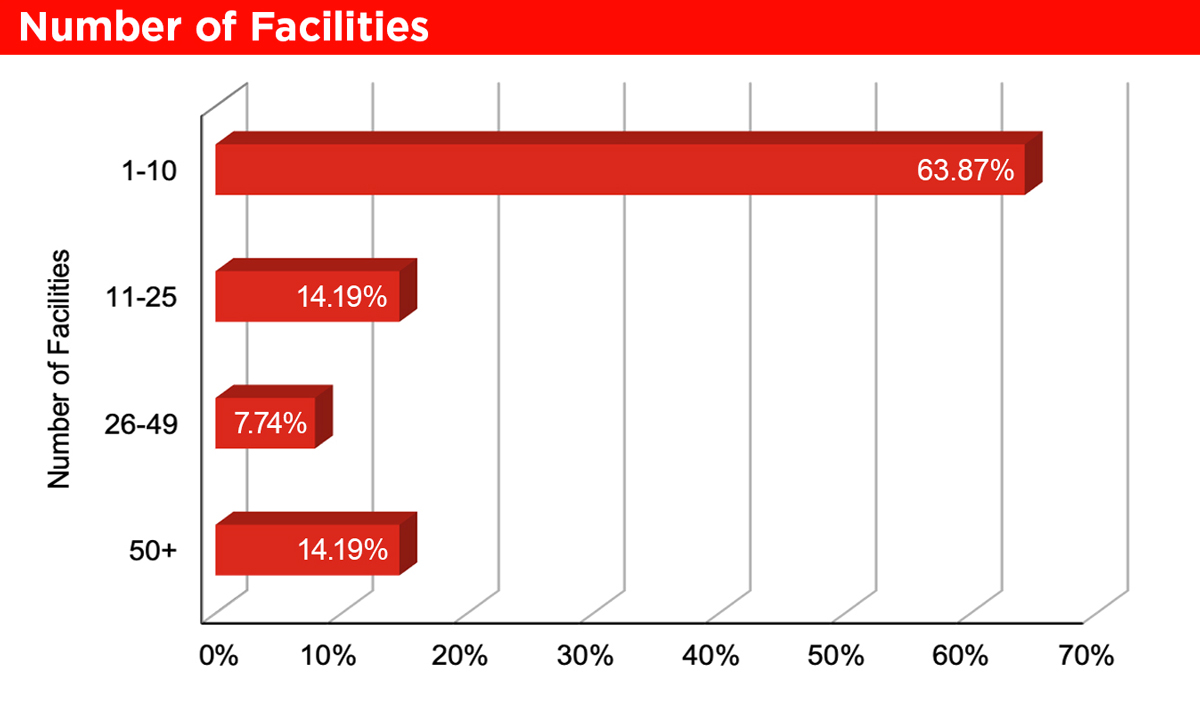
The majority of respondents are involved in the business or operation of one to 10 facilities, with an even split between 11 to 25 and 50-plus facilities. Rounding out the options was those involved in the operation of 26 to 49 facilities.

See Number of Facilities bar graph

Number of Facilities bar graph
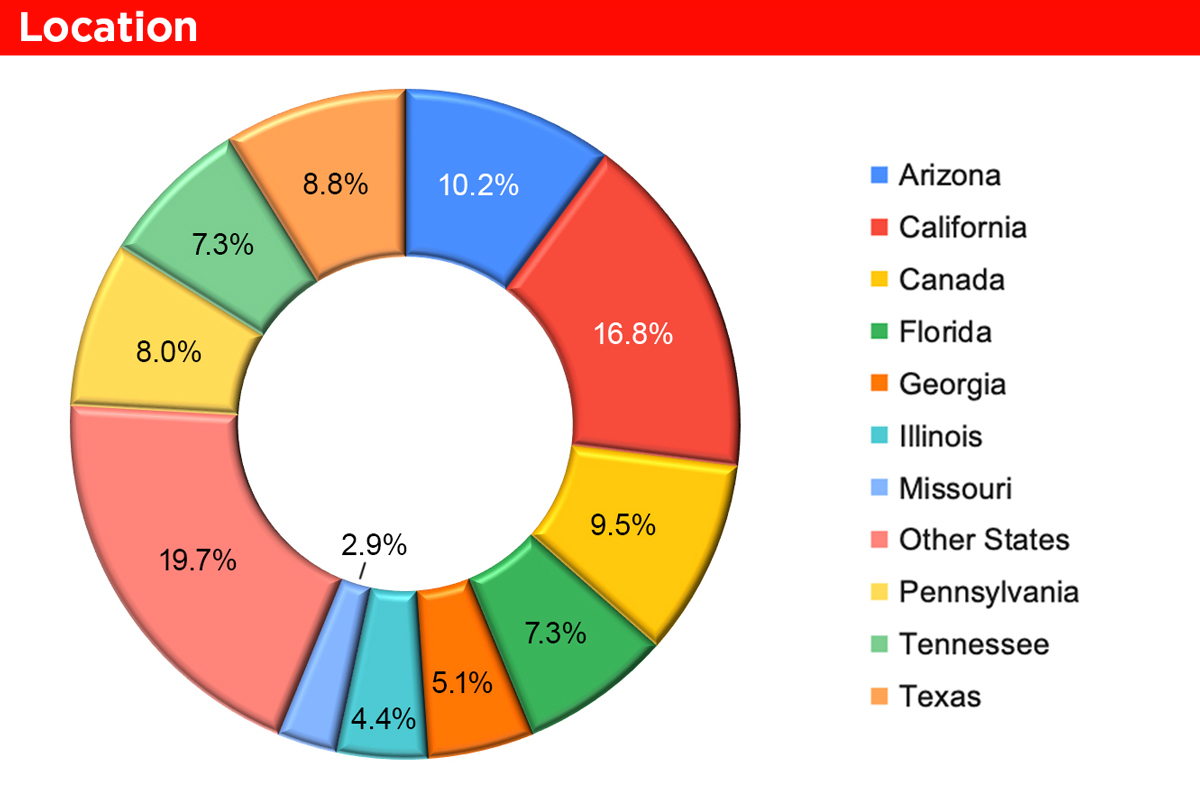
Respondents were spread throughout the country, with the largest number of responses coming from some of the states where the number of self-storage facilities is greatest, such as the Golden State, the Grand Canyon State, and the Sunshine State. We also picked up several respondents from our neighbors to the north in Canada.

See Location chart

Location chart
Industry Headwinds
What are the biggest challenges facing the self-storage industry right now? The majority of respondents believe that aggressive pricing strategies have become an issue, a topic MSM has covered extensively, beginning with a three-part online series about the harm they can cause. Concerns over low web rates being dramatically increased in a short period can be attributed to respondent’s concerns that it makes it difficult for independents to compete, the increased regulation it could usher in, and the damage these strategies can have on people’s perception of the industry. Interest rates and occupancy followed closely behind as top concerns.

See Industry Headwinds bar graph

Industry Headwinds bar graph
Those who cited “other” responded with the following issues: overbuilding/oversupply, moratoriums or bans on self-storage development, land prices, the economy, insurance and taxes, government policies, and keeping seasoned managers current on new technology (AI in particular).
Industry Tailwinds
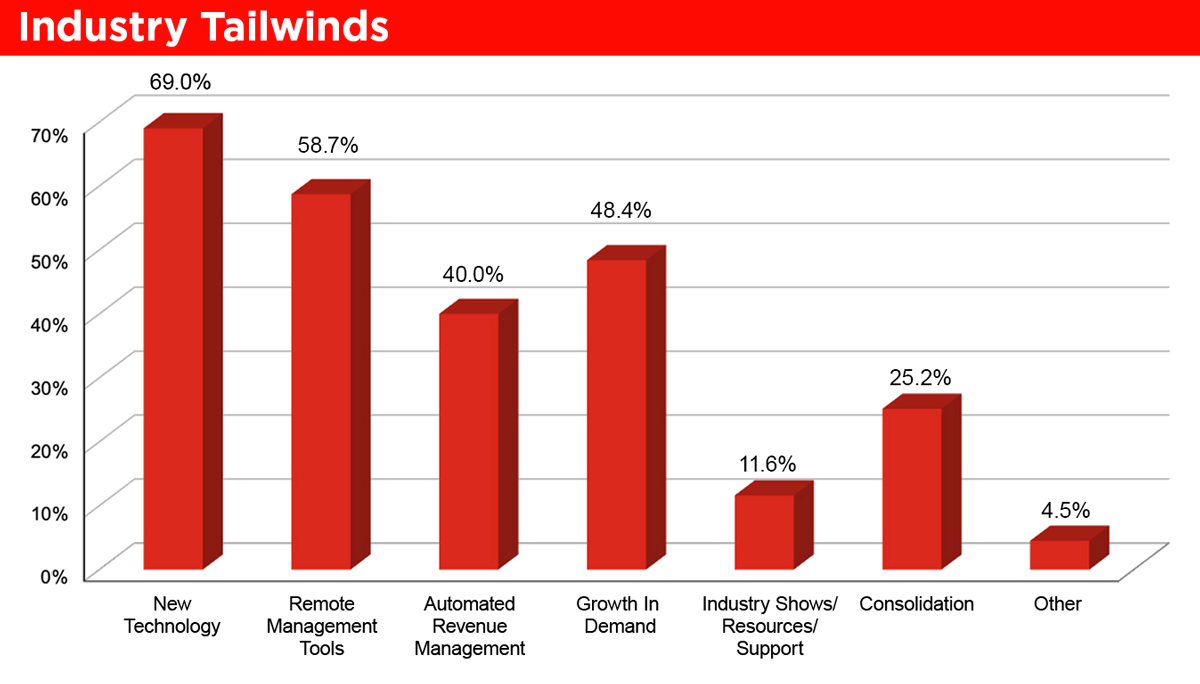
What is pushing the industry forward? The overwhelming majority of respondents believe technology and technology-related solutions such as remote management tools and automated revenue management are buoying the industry. Interestingly, 25 percent of respondents believe consolidation is also beneficial, compared to the 35 percent who considered it a hindrance in the previous question.

See Industry Tailwinds bar graph

Industry Tailwinds bar graph
Those who selected “other” saw opportunity for different reasons or benefits specific to their markets. “Living spaces are getting smaller and more expensive, presenting a need for self-storage,” one respondent commented. “Revenue-boosters like security systems and value-added services,” stated another. “The population increase in Florida is a driver of occupancy,” added another answerer.

AI, a concern for a handful of respondents in the previous question, was mentioned as a plus here: “AI acceptance is growing,” wrote one respondent.

Facility Facts
Our next set of questions asked respondents about how their business is going, their use of automation, and internal struggles. The good news is that nearly half of all respondents (46 percent) anticipate their portfolio’s occupancy to be up at the end of 2024. About 24 percent expect it to remain flat compared to 2023, while approximately 14 percent expect it to be down.

See Occupancy pie chart

Occupancy pie chart
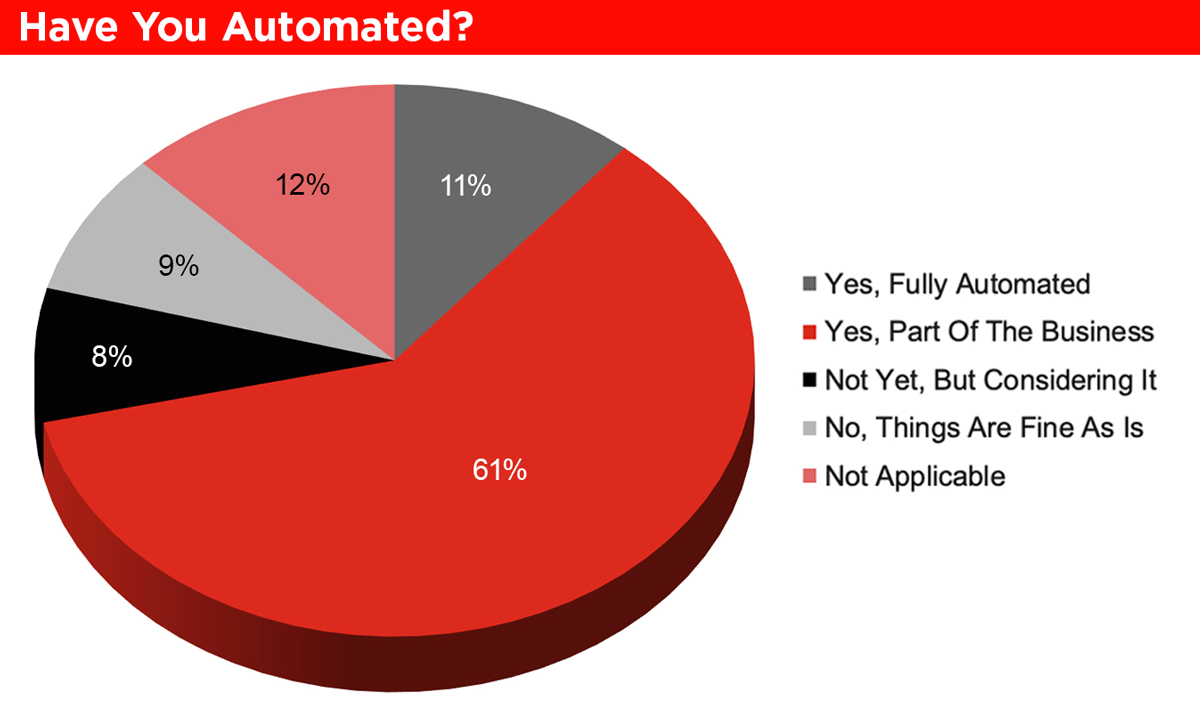
The industry is becoming more tech savvy every year, and automating aspects of the business is becoming more commonplace. An overwhelming 72 percent of respondents say that the business is fully or partially automated, with another 7 percent stating that they’re considering it within the next 24 months. Only 8.5 percent have no plans to automate and “think things are fine the way they are.”

See Automation pie chart

Online rentals and gate access are virtually tied at just over 60 percent each when it comes to the areas of the business that are automated. However, online auctions, revenue management, and door access are not far behind.

See Automations Utilized pie chart
Automations Utilized pie chart
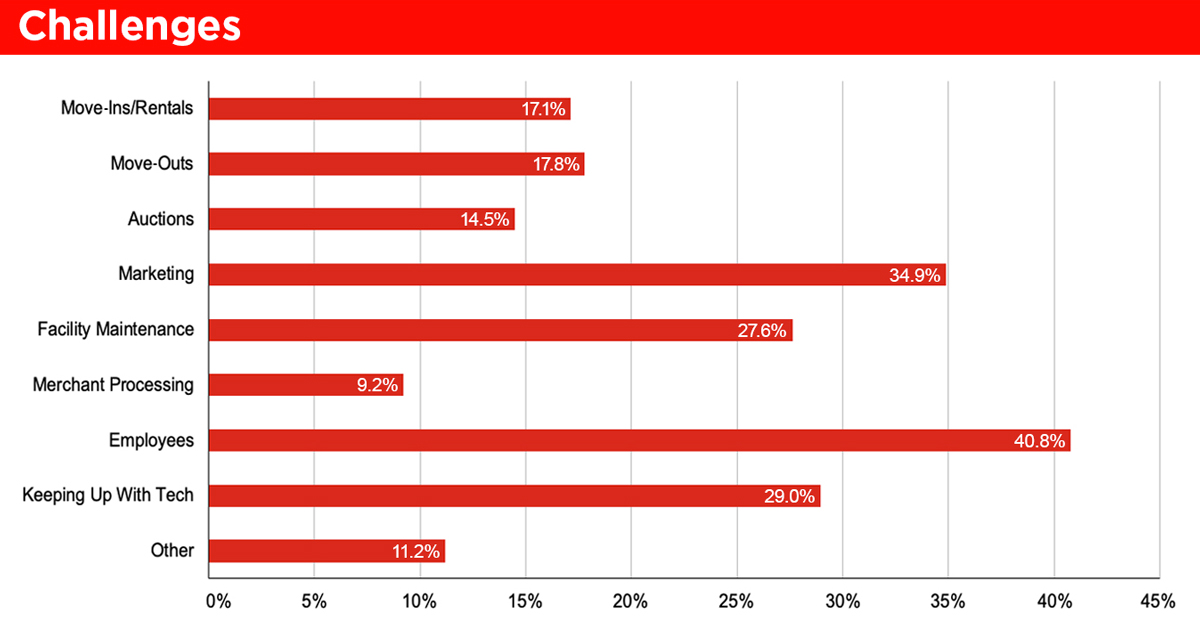
In the final portion of this section, we wanted to know which parts of the business are considered the most difficult to manage. Responses were split across a variety of potential answers, although employees and marketing were the top two challenges for our respondents.

See Challenges bar graph

Challenges bar graph
Of those who answered “other,” challenges included keeping up with rules and regulations, following industry trends, delinquency, vehicle abandonment, hiring good people, and rates and promotions.

When it comes to marketing, one respondent followed up by saying that “SEO and PPC are very expensive to outsource and time-consuming and difficult to keep in house.”

Another respondent found managing tenants to be complicated due to the storing of illegal or unallowed items and demands for refunds. “Unfortunately, customers are going to try to store what they want to and not what is acceptable. Also, if one company offers refunds for unused days, customers think every company is supposed to do that even when the lease states differently,” wrote the respondent.

Finally, one vendor is weary of “unsophisticated clients,” possibly hinting that some operators are not keeping up with technology, as 29 percent of respondents admitting it was a challenge.

The Data Divide
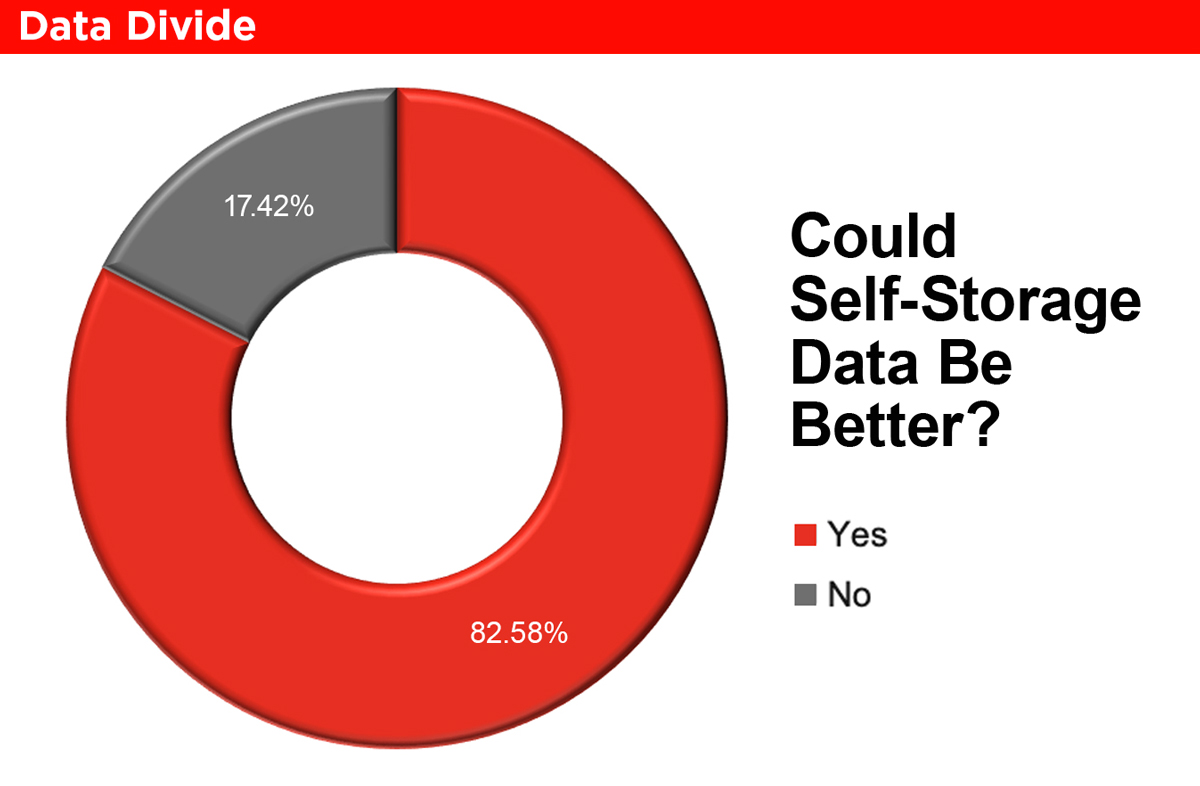
MSM has published numerous features focused on data sharing in self-storage, and our data-sharing survey is still live on our website (You can read the first piece on “The Data Sharing Dilemma” and take the survey by clicking here). First, we wanted to know if those in the industry felt that self-storage data could be better. At almost 83 percent, the response was an overwhelming yes.

See Data Divide chart

Data Divide chart
The consensus ends there, however. To follow up, we asked the following question:

“If you could choose to automatically and anonymously share your data with a secure repository via your property management software to improve the overall industry dataset in exchange for reporting on your market, would you?”

See Sharing Data chart
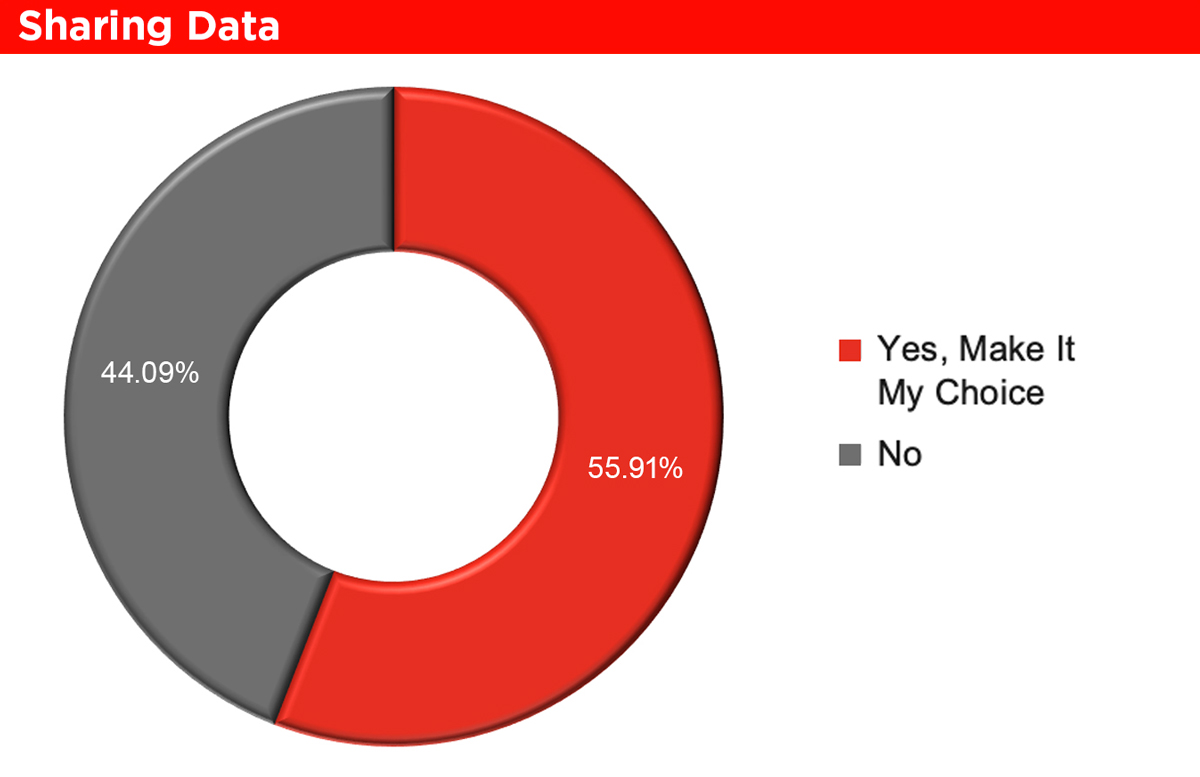
Sharing Data chart
Almost 56 percent of people were willing to share, but 44 percent are unwilling to give up their data. Clearly there is the disconnect between those who think data could be better and those who are willing to share it (at least via their property management software). It tends to boil down to concerns over privacy, or “spilling the beans,” as one respondent put it. Here’s a sampling of write-in responses:

  • It’s not safe; I don’t want to lose my competitive edge.
  • I’d love to see it, but I cannot get unanimous partner consent.
  • I don’t trust any entity to be impartial.
  • Too many people will have access to it.
  • My detail and innovation are my edge, and I don’t want to lose it.
  • I’m happy to share information but not via automation due to personal data exposure.
  • There have been too many data breaches out there.
  • It’s too risky to potentially expose our data.
  • Privacy … It is privileged information.
  • I would want to know who I’m sharing with.

One respondent stated that they don’t use property management software, while another simply wrote, “I don’t want to share.”

We’re not looking to solve the industry’s problems—yet! For now, we’re just presenting the results of our reader survey. However, we’re listening, and we’ll be following up with the stories you want to read and the questions you want answered. Thank you for reading!
card choices pie chart
Thanks From MSM

When it comes to all things MSM, from our monthly Messenger and our annual Self-Storage Almanac to our website, newsletters, and more, we’re averaging four out of five stars! Would we like to have five stars? Absolutely! We know there’s always room for improvement, and it’s something we’re laser-focused on.

We appreciate all your suggestions on how we can make our publications better, and for sharing the topics you’d like to see more coverage on. You can expect to see stories on them in future online and print stories.

Of course, we also enjoy reading all the words of encouragement:

“I love your magazine just the way it is!”

“In the past year, your coverage has expanded wonderfully!”

“Your topics are more in-depth than other industry publications.”

“Keep doing what you’re doing!”

“You’re doing a great job!”

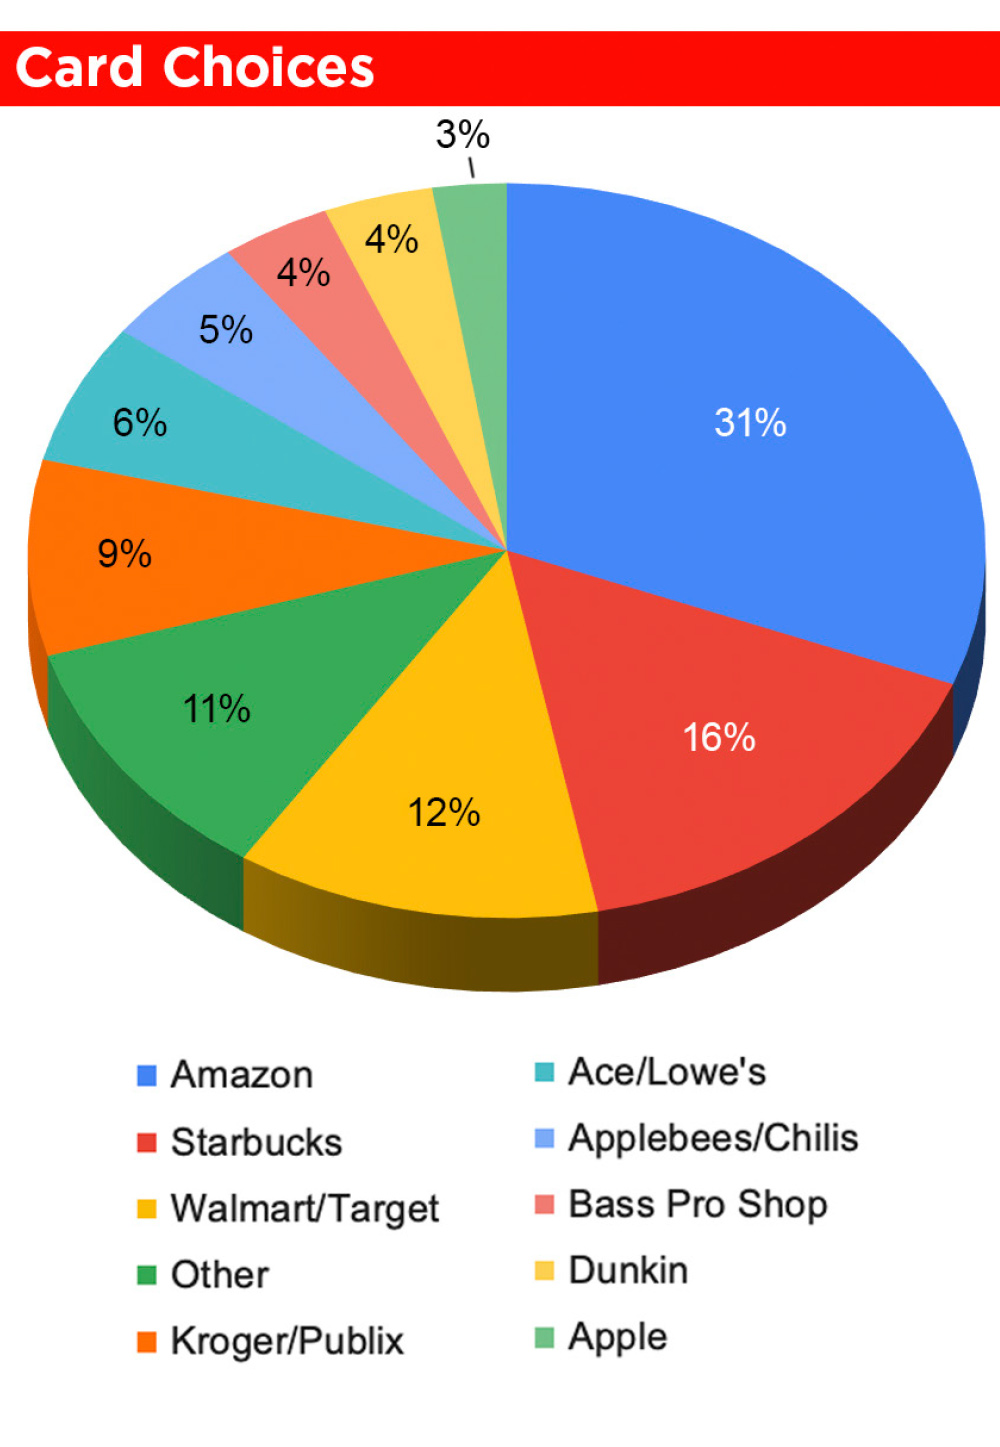
On behalf of all of us at MSM, thank you for your readership and support, and we hope you enjoyed your $5 gift card. Just for fun, here’s one last chart on the card redemptions. Our readers clearly love Amazon and Starbucks!

Brad Hadfield is the web manager and a news writer of Modern Storage Media.