ast year was certainly unique in regard to self-storage rental rates. Continued aggressive use of algorithms and AI-driven revenue management tools by REITs and many other self-storage owner-operators changed the landscape significantly. REITs led the charge by continuing to reduce street rates, buy market share, rent space, increase occupancy, then steadily drive up rates three months after move-in and beyond. Sometimes tenant rates double or even triple within a year’s time.
Several self-storage associations, including the California Self Storage Association and Arizona Self-Storage Association, reported a noticeable increase in complaints from tenants, which were quite infrequent in the past. This increase tracks with attempts in different parts of the country to introduce rent control measures to the self-storage sector at the municipal and state levels.
All in all, the results of aggressive measures to increase in-place rents were diverse.
How to increase revenue in this environment is the question of the year. As Self Storage Association Hall of Fame member Bob Schoff, chairman of National Self Storage, has been saying for years, “You raise rates on an empty space.” So first, you must rent the space. But raising rates for existing tenants is an important way to sustain revenue growth.
An overall review of rental rates over time at the national and regional level is provided by data from Radius+ and past editions of MSM’s annual Self-Storage Almanac. This data shows that today’s prices are quite close to the rental rates in 2017. They are also close to the mid-way point between the high-low COVID price swing.
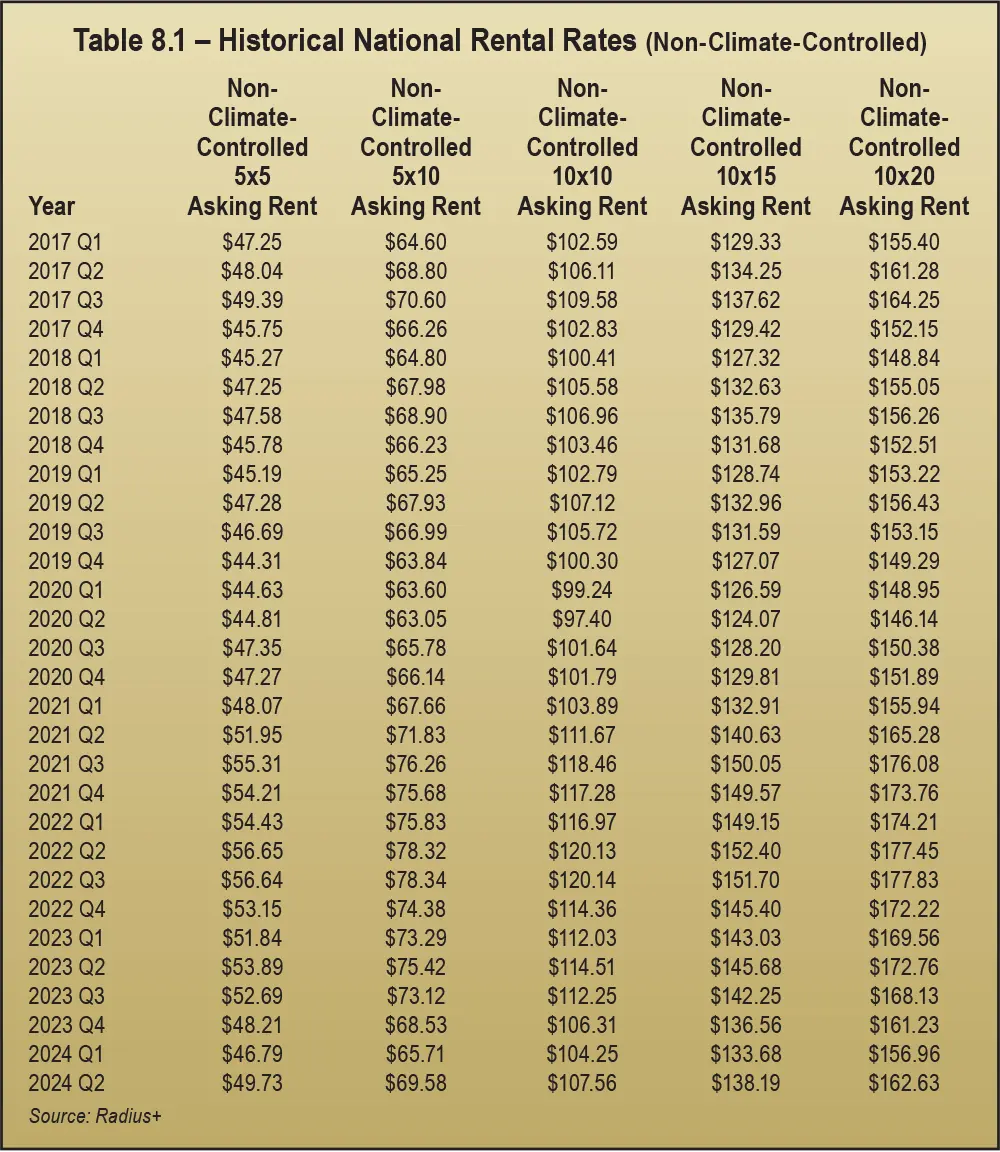
For non-climate-controlled units, Table 8.1 indicates that rental rates were down year over year (YOY) for all five sizes surveyed. Prices dropped by 8 percent for the smaller units and by 6 percent for the largest units; the price for 10-by-20s declined more than $10 from Q2 2023 to Q2 2024.
For the seven-year time frame reported (Q1 2017 to Q2 2024), the lowest rental rates for non-climate-controlled units were seen in Q2 2020, as the COVID pandemic hit full swing, based on both a blended average of all unit sizes and on 10-by-10 units.
Rental rates rapidly rose the following eight quarters until Q2 2022, to a high that was almost $22 higher for non-climate-controlled units than the Q2 2020 low. The biggest quarter-over-quarter jumps were in Q1 and Q2 of 2021.
In Q2 2023, one year after the Q2 2022 high, rental rates were an average of $4.50 lower than the year before. Advance the time frame one more year to Q2 2024, and there is another $7 price drop year over year, leaving current prices about $11.50 below the Q2 2022 high.
However, current rental rates in Q2 2024 are about $10.50 higher than the bottom of the early COVID low in Q2 2020.
At a little over $11.50 below the high and $10 above the low, that puts current rental rates in the middle of the COVID high-low swing. Current rental rates overall are quite close to the Q2 2019 rates before COVID altered the trajectory. At $107.56, the current price of a non-climate-controlled 10-by-10 unit is just $0.44 higher than the Q2 2019 price of $107.12.
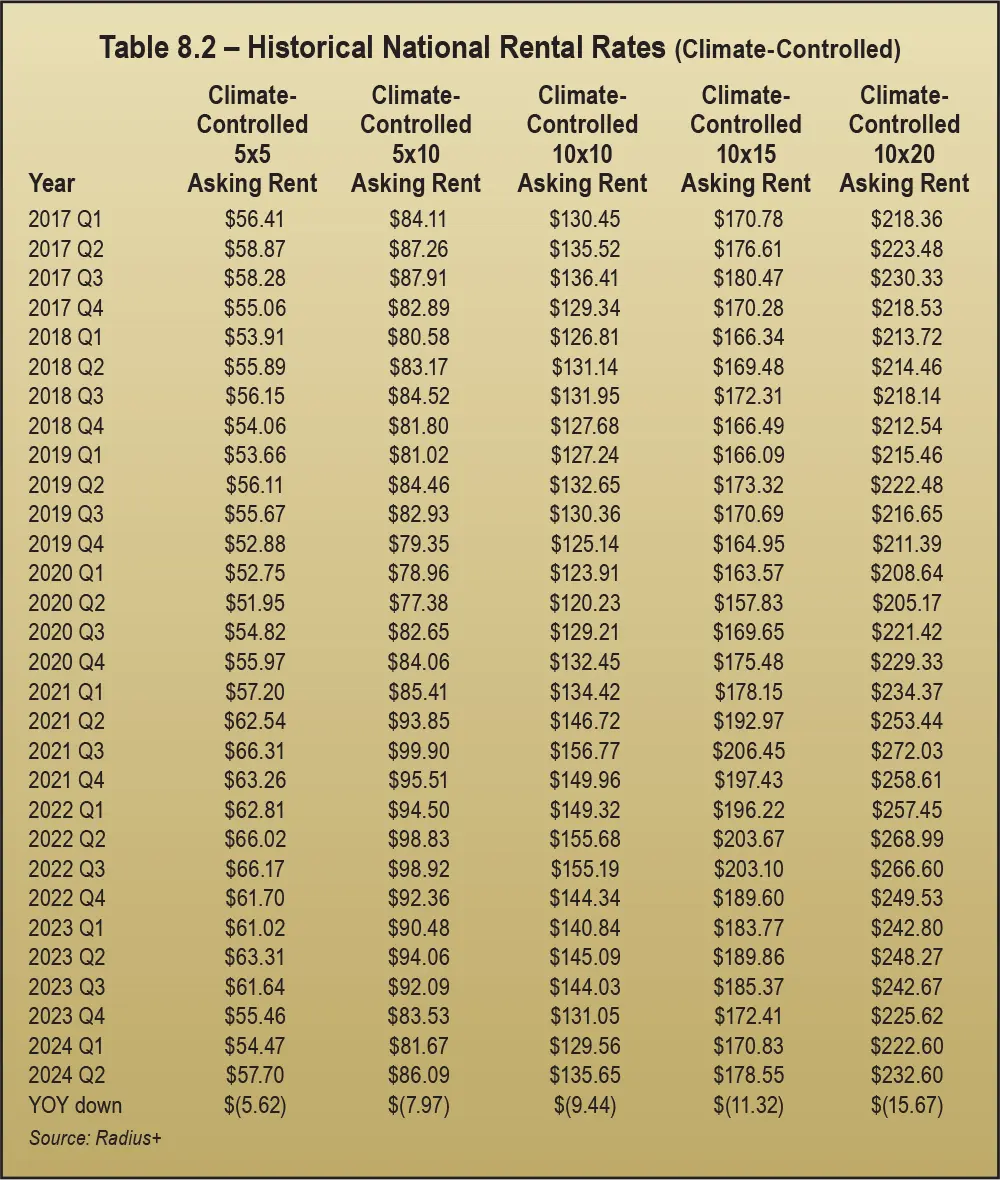
Climate-controlled units, shown in Table 8.2, saw a somewhat larger drop in rental rates than non-climate-controlled units. Comparing Table 8.1 to 8.2, the YOY price drop was more substantial for climate-controlled units (down on average about $10) than non-climate-controlled units (down on average a little less than $7).
As measured by rental rates per unit, the climate-controlled low occurred in the same quarter as the non-climate-controlled units: Q2 2020. However, the high was a little earlier, in Q3 2021. As measured by a blended average, the gap between the high and the low was almost $38. Current rental rates are over $12 off the high, but they are over $25.50 above the low. Climate-controlled unit rental rates reached the mid-way point between the high and low last year in Q1 2023, earlier than the current mid-way point for non-climate-controlled units. So, climate-controlled unit rental rates peaked and fell off the COVID high earlier than non-climate-controlled units.
As for non-climate-controlled units, on average, current rental rates of climate-controlled units are very close to rates in Q3 2017 (about $0.50 lower than the blended average).
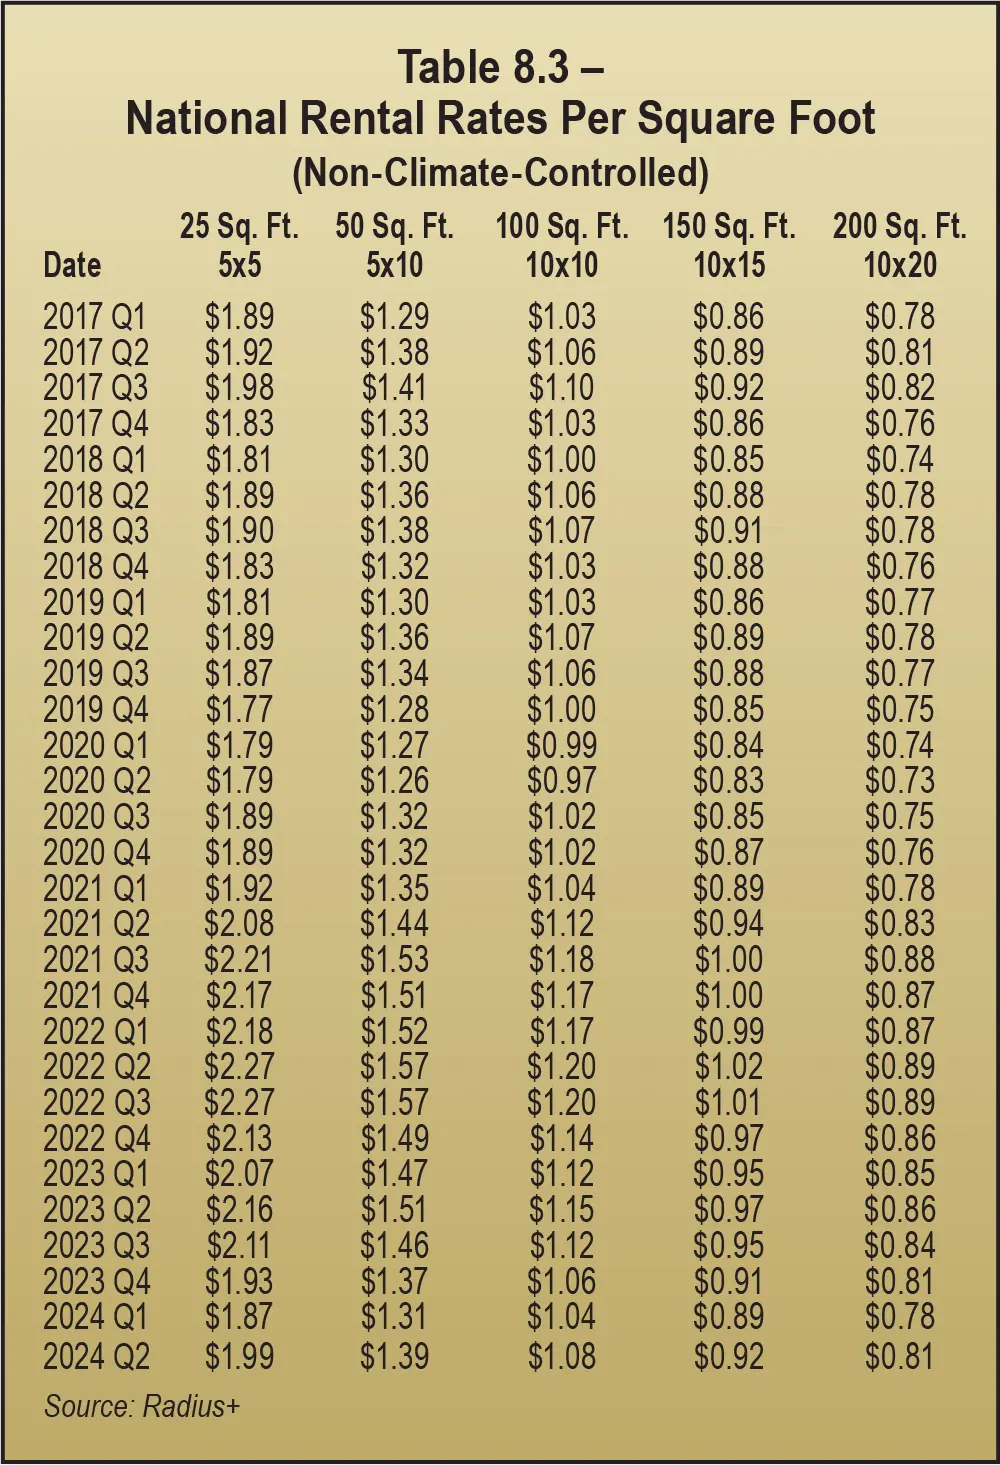
Tables 8.3 and 8.4 share rental rate data on a square-foot basis, as opposed to unit-based measures in Tables 8.1 and 8.2.
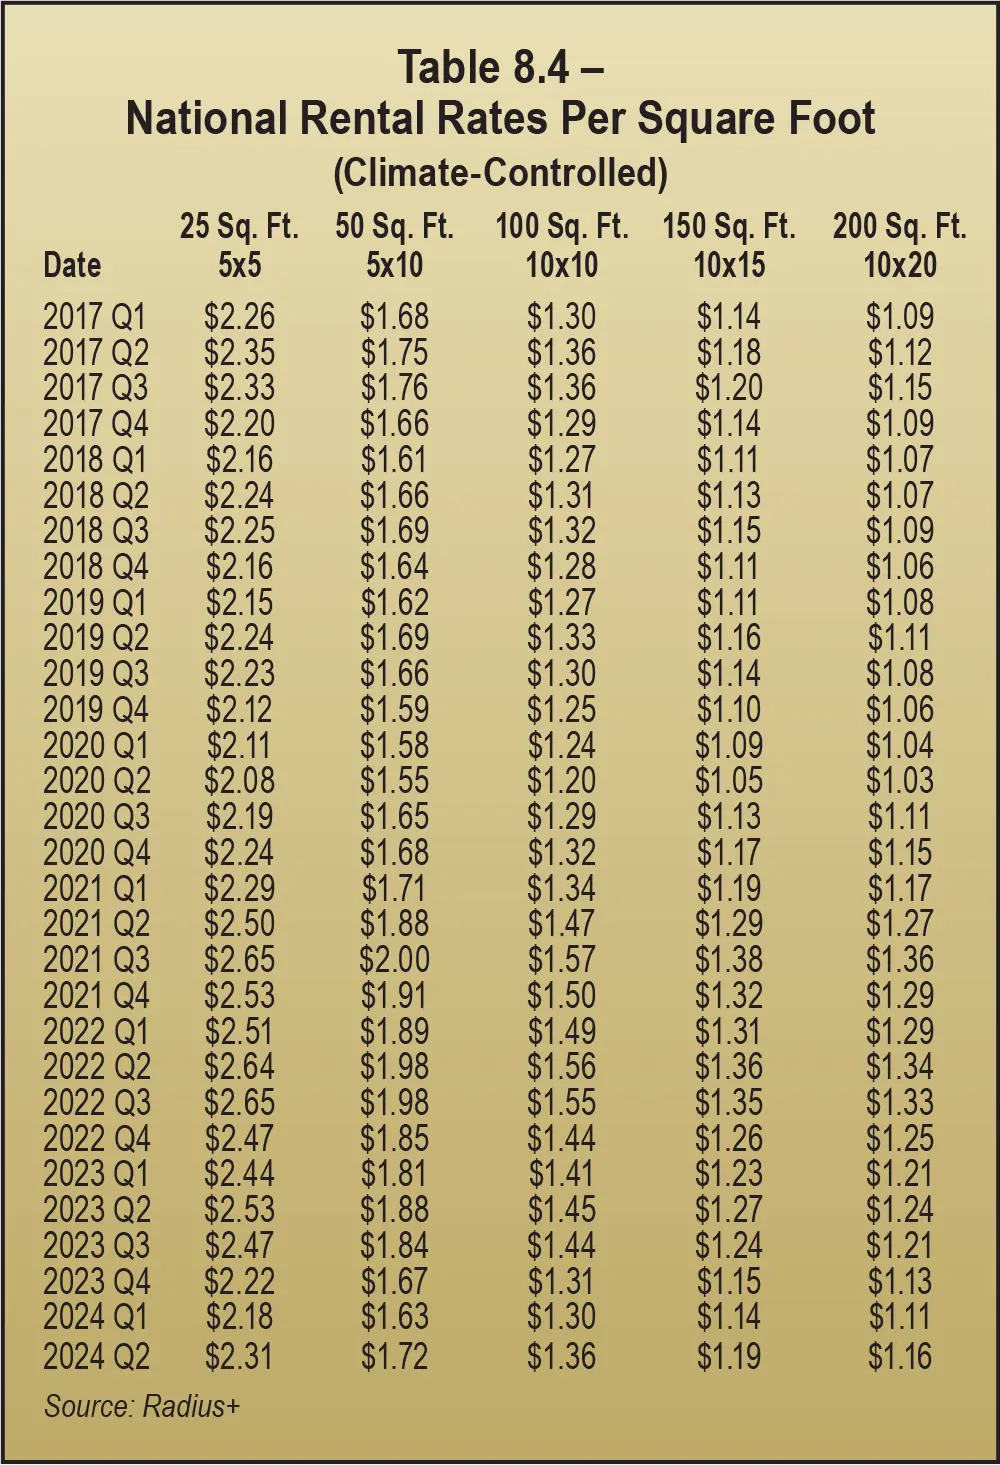
The COVID high-low swing’s average rental rate on a square-foot basis for non-climate-controlled space was $0.27. The Q2 2020 low blended average rental rate per square foot was about $1.12, while the high was $1.39 in Q3 2021.
YOY rental rates per square foot for climate-controlled space are down about $0.13 as a blended average. Prices are down about 9 percent per square foot for the smallest spaces and 6 percent for the largest spaces, for an average decline of about 8 percent.
The average price swing on a square-foot basis for non-climate-controlled space was $0.41 between the COVID high and low. The Q2 2020 low blended average rental rate per square foot was about $1.38, while the high was $1.79 in Q3 2021.
Analyzing the high and low of 10-by-10 non-climate-controlled rental rates shows a $0.37 range, from a low of $1.20 in Q2 2020 to a high of $1.57 in Q3 2021.
The mid-way point between the COVID high and low occurred in about Q1 2023, as measured by rental rates per square foot for non-climate-controlled space.
Current rates are $0.17 higher than the COVID low and $0.24 lower than the COVID high.
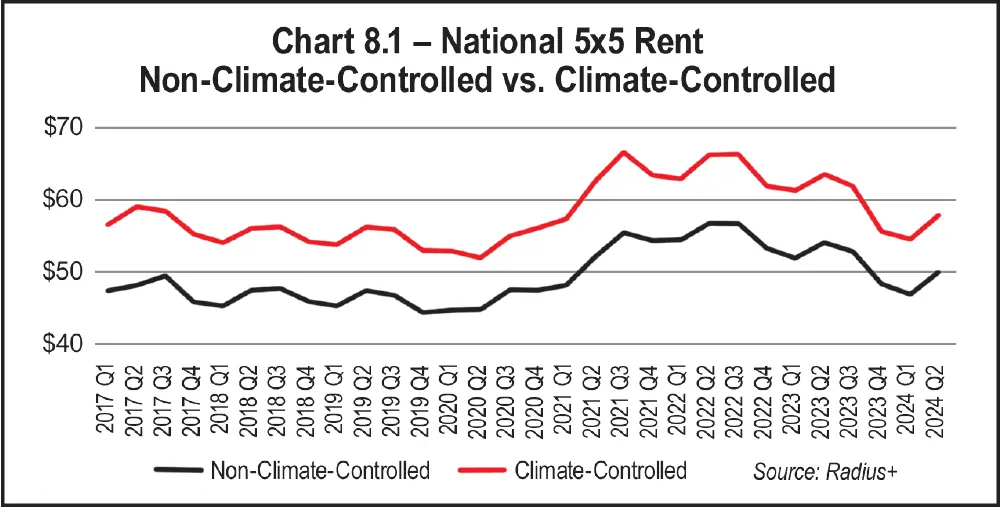
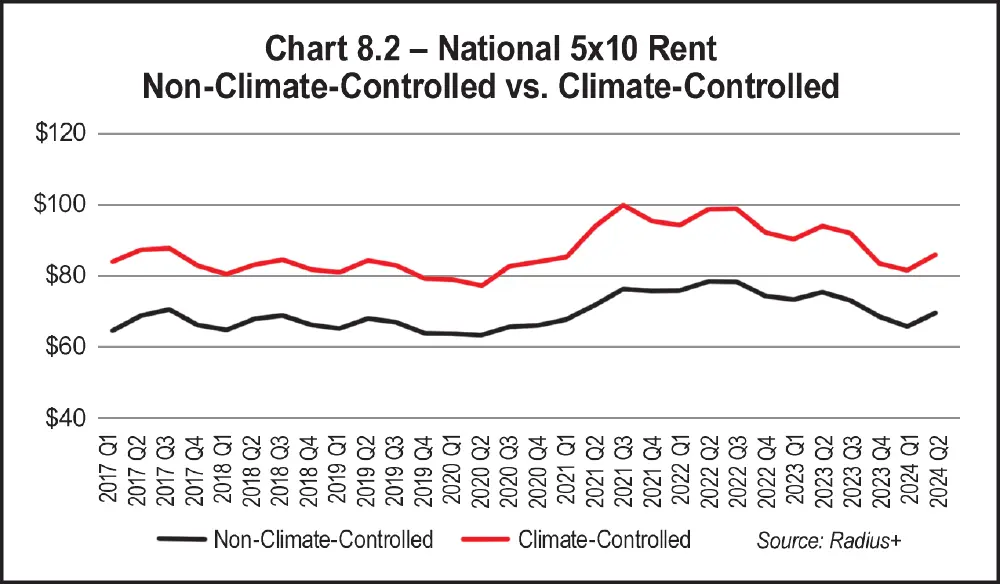
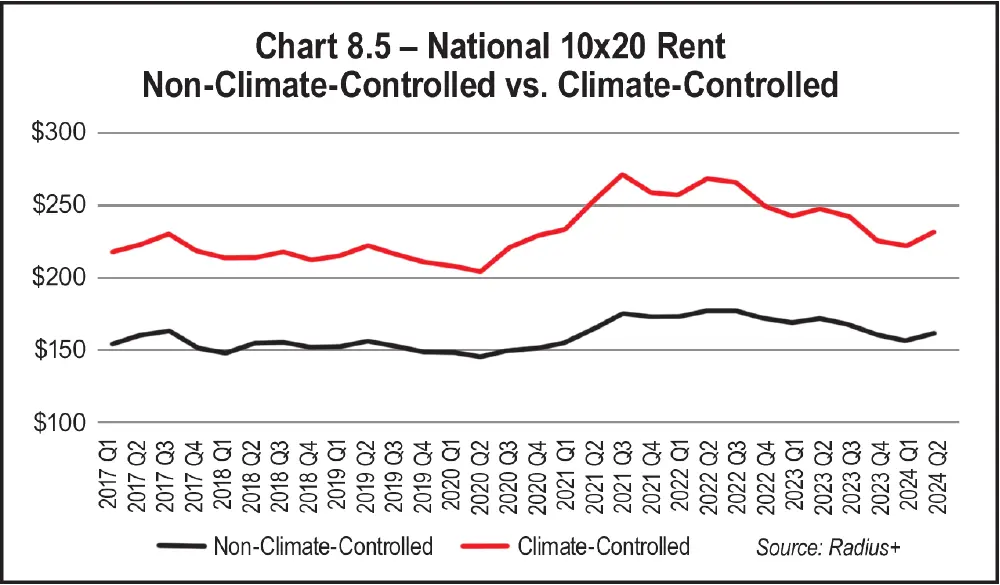
Charts 8.1 through 8.5 show normal bands of rental rates for five different unit sizes for both non-climate-controlled and climate-controlled space over time. Bands of normal pricing are visible for every size unit, with abnormally high pricing for every unit size clearly visible during the 10 quarters from Q2 2021 to Q3 2023.
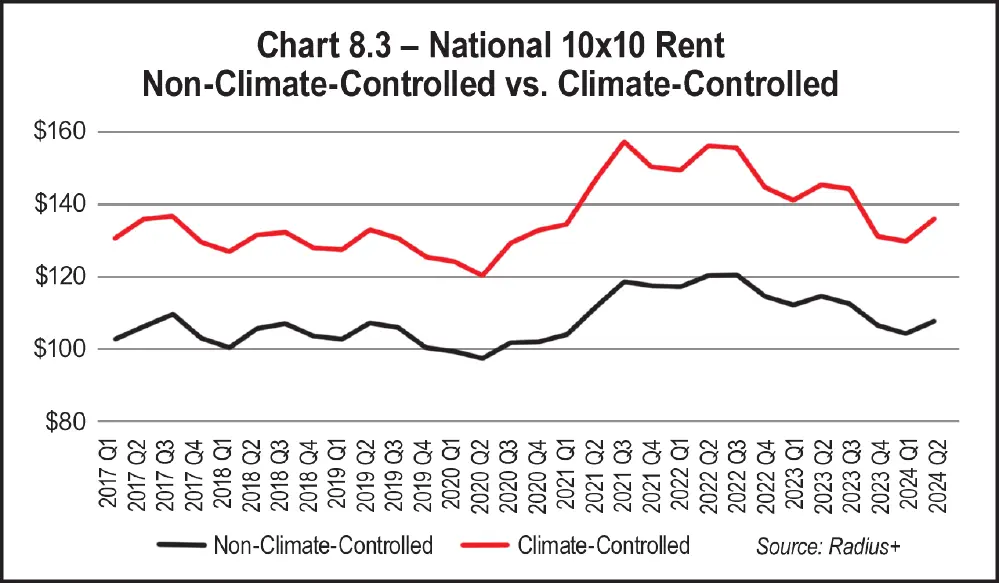
Continuing in like form, Chart 8.3 for 10-by-10s shows the same pattern at $40 higher. Non-climate-controlled 10-by-10s broke the $110 level and climate-controlled 10-by-10s broke the $140 level in Q2 2021. Rental rates remained above the $110 and $140 levels for the following 10 quarters, until Q4 2023, when rental rates went back into the normal range. They continued down until Q1 2024. While they were headed back up again in Q2 2024, they will likely hover below the $110 and $140 range.
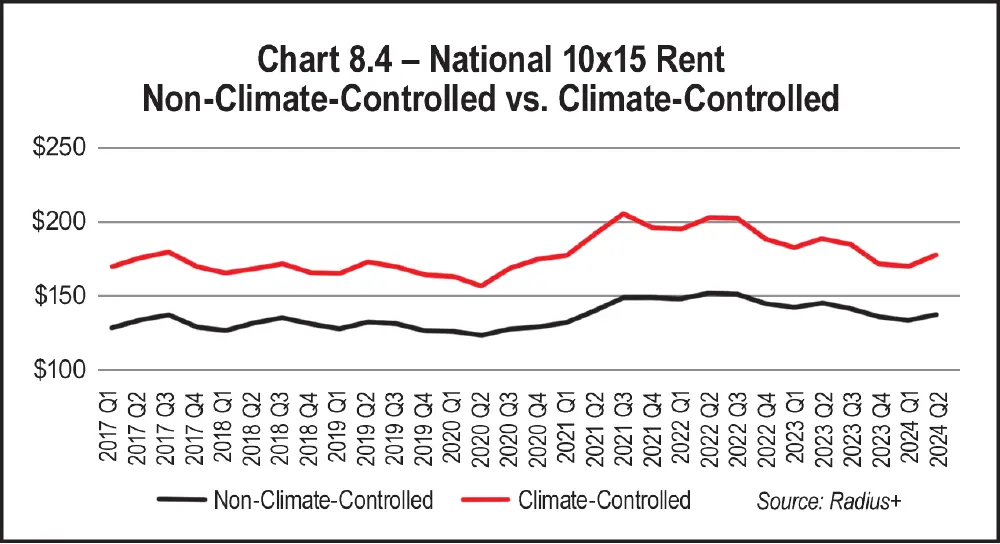
And so, it continues with 10-by-15 units. Chart 8.4 for 10-by-15s repeats the same pattern at $30 higher. Non-climate-controlled 10-by-15s broke the $140 level and climate-controlled 10-by-15s broke the $180 level in Q2 2021. Rental rates remained above the $140 and $180 levels for the following 10 quarters, until Q4 2023, when rental rates returned to the normal range. They continued down until Q1 2024. Although they were once again moving upward in Q2 2024, they will likely remain under the $140 and $180 range.
Rates only dropped 2 percent in the West (Pacific) region but were down 12 percent in the South Atlantic, followed closely by the Midwest (East North Central) and Northeast (Middle Atlantic), both with rate decreases of 11 percent. The rest of the regions experienced rate drops from 5 percent to 7 percent.
States are divided among nine regions:
- Midwest (East North Central) – Illinois, Indiana, Michigan, Ohio, and Wisconsin (east of the Mississippi River)
- Midwest (West North Central) – Iowa, Kansas, Minnesota, Missouri, Nebraska, North Dakota, and South Dakota (west of the Mississippi River)
- Northeast (Middle Atlantic) – New Jersey, New York, and Pennsylvania
- Northeast (New England) – Connecticut, Maine, Massachusetts, New Hampshire, Rhode Island, and Vermont
- South Atlantic – Delaware, Florida, Georgia, Maryland, North Carolina, South Carolina, Virginia, West Virginia, and Washington, D.C.
- South (East South Central) – Alabama, Kentucky, Mississippi, and Tennessee
- South (West South Central) – Arkansas, Louisiana, Oklahoma, and Texas
- West (Mountain) – Arizona, Utah, New Mexico, Montana, Colorado, Idaho, Nevada, and Wyoming
- West (Pacific) – California, Oregon, Washington, Alaska, and Hawaii
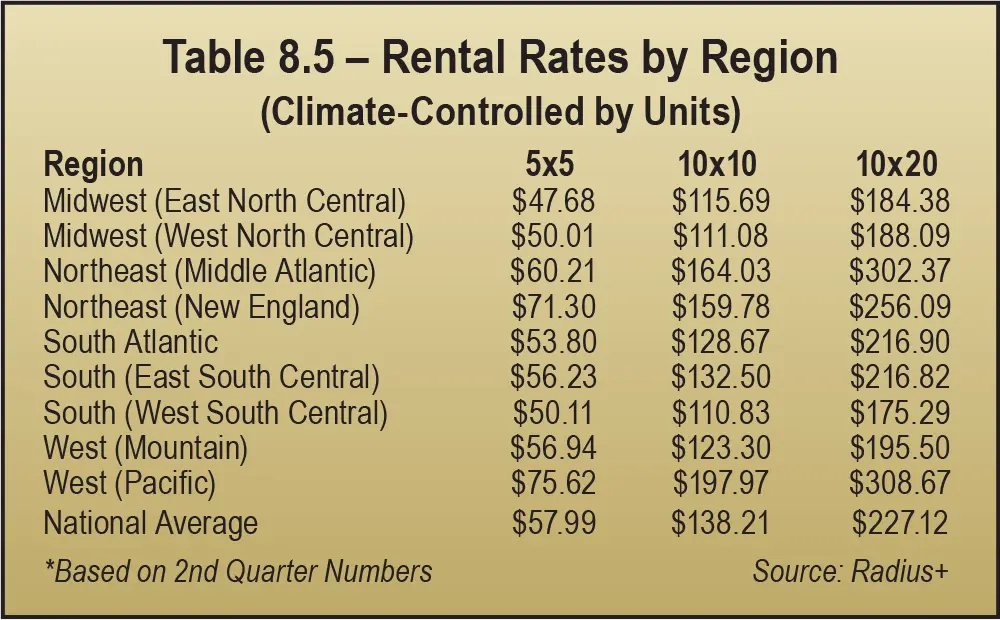
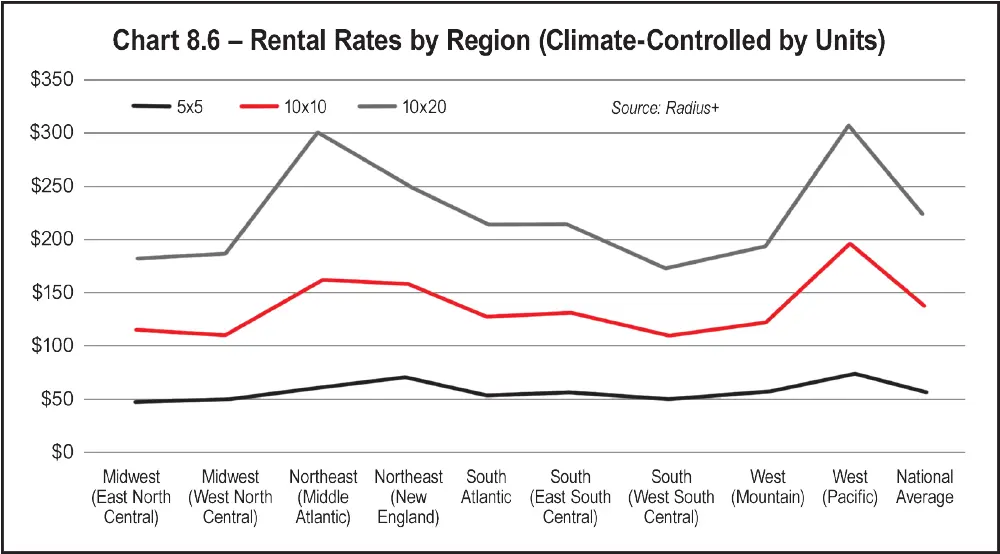
As always, larger units continue to deliver more revenue, because the rent is higher, but smaller units command a higher price per square foot. In 2024, for both unit pricing and square foot pricing, climate-controlled 5-by-5s achieved the highest rent of all unit sizes and types. The regions with the highest 5-by-5 rental rates are the West (Pacific) and the Northeast (New England). See Table 8.5 and Table 8.6.
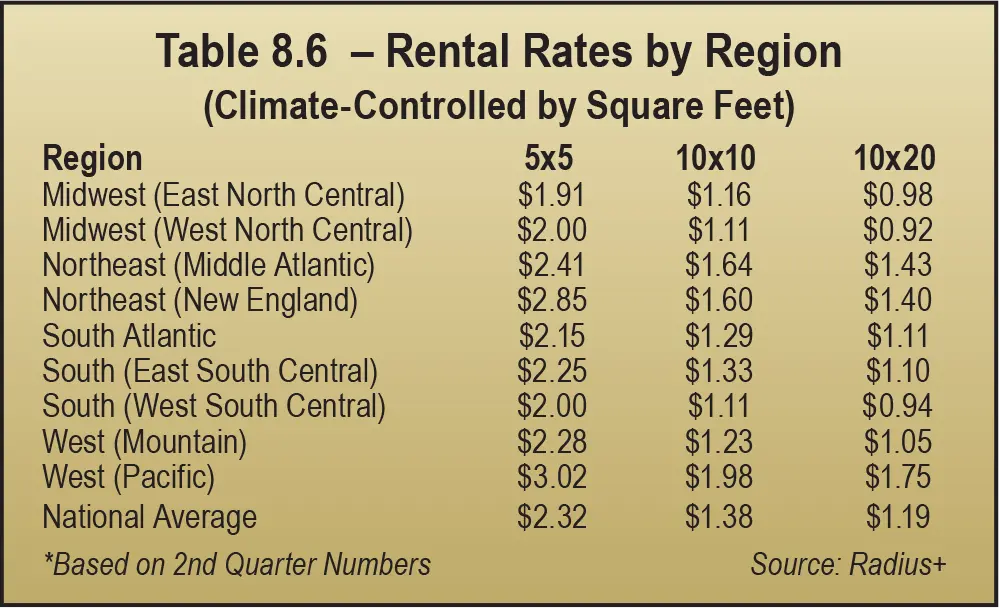
Several regions cluster around the lowest unit pricing for all sizes in 2024: the two Midwest regions (East North Central and West North Central) and South (West South Central).
Based on a blended average of unit pricing, the South (West South Central) region has the lowest rates, whereas the West (Pacific) has the highest. In fact, the West (Pacific) has the highest rates in every size.
The South (West South Central) region has the lowest rates for all unit sizes except 10-by-10s. The Midwest (East North Central) has the lowest rates for 10-by-10s.
Comparing 5-by-5s across the regions in 2024, the Midwest (East North Central) region has the lowest rates. But for medium-sized units (10-by-10) and large units (10-by-20), the South (West South Central) region has the lowest rates. See Table 8.6 and Chart 8.7.
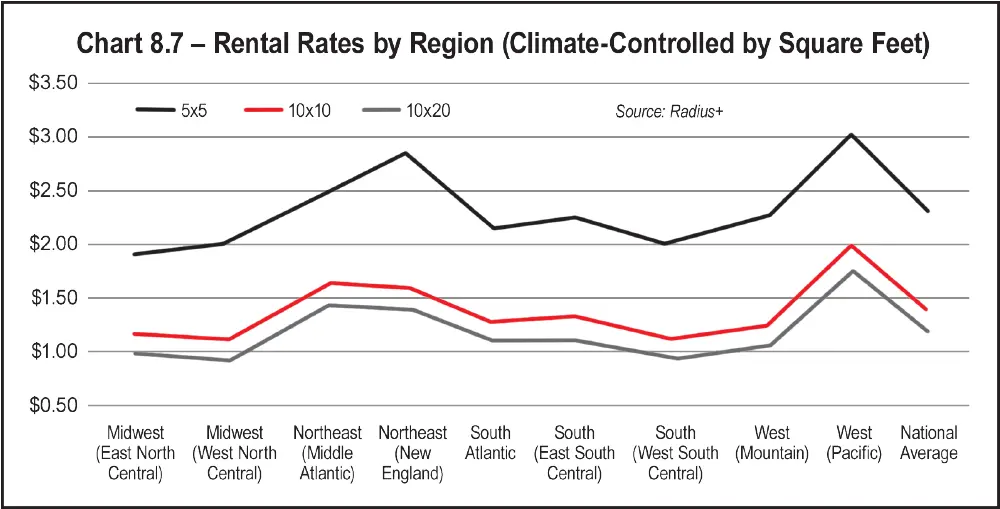
As for unit pricing, the same three regions cluster around the lowest square-foot pricing for all sizes: the two Midwest regions (East North Central and West North Central) and South (West South Central).
Based on price per square foot, the blended average rental rates in the Midwest (West North Central) region were at the bottom in 2024.
Rental rate per square foot for 5-by-5s is lowest in the Midwest (East North Central) region.
Rental rates per square foot for 10-by-10s and 10-by-20s are lowest in the Midwest (West North Central) and South (West South Central) regions.
Measured in unit pricing, YOY rental rates (from Q3 of 2023 to Q2 of 2024) for climate-controlled units were down an average of 11 percent in the Midwest (East North Central) region. Rent for 5-by-5s declined the most at 14 percent. See Table 8.7.
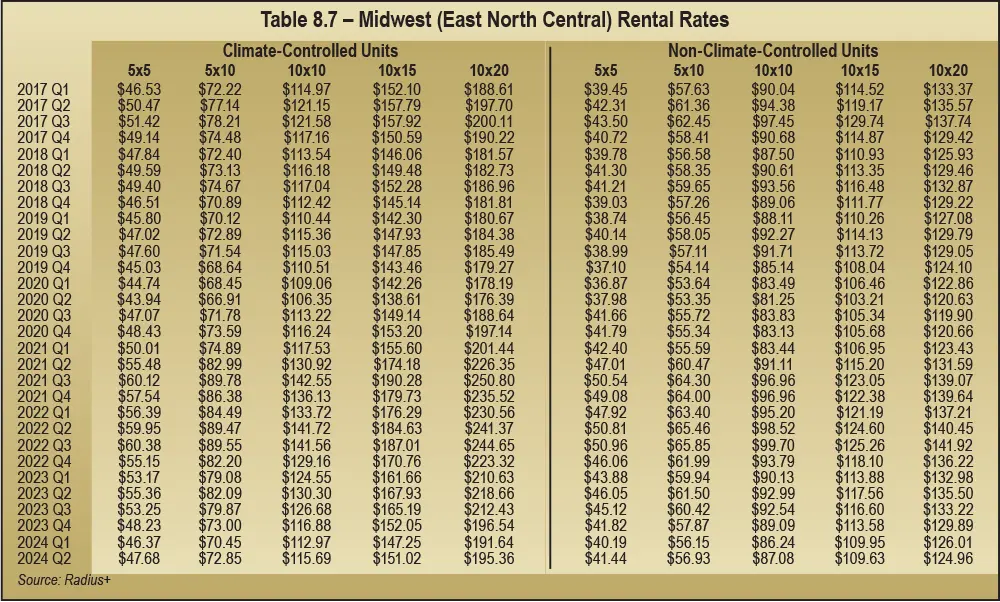
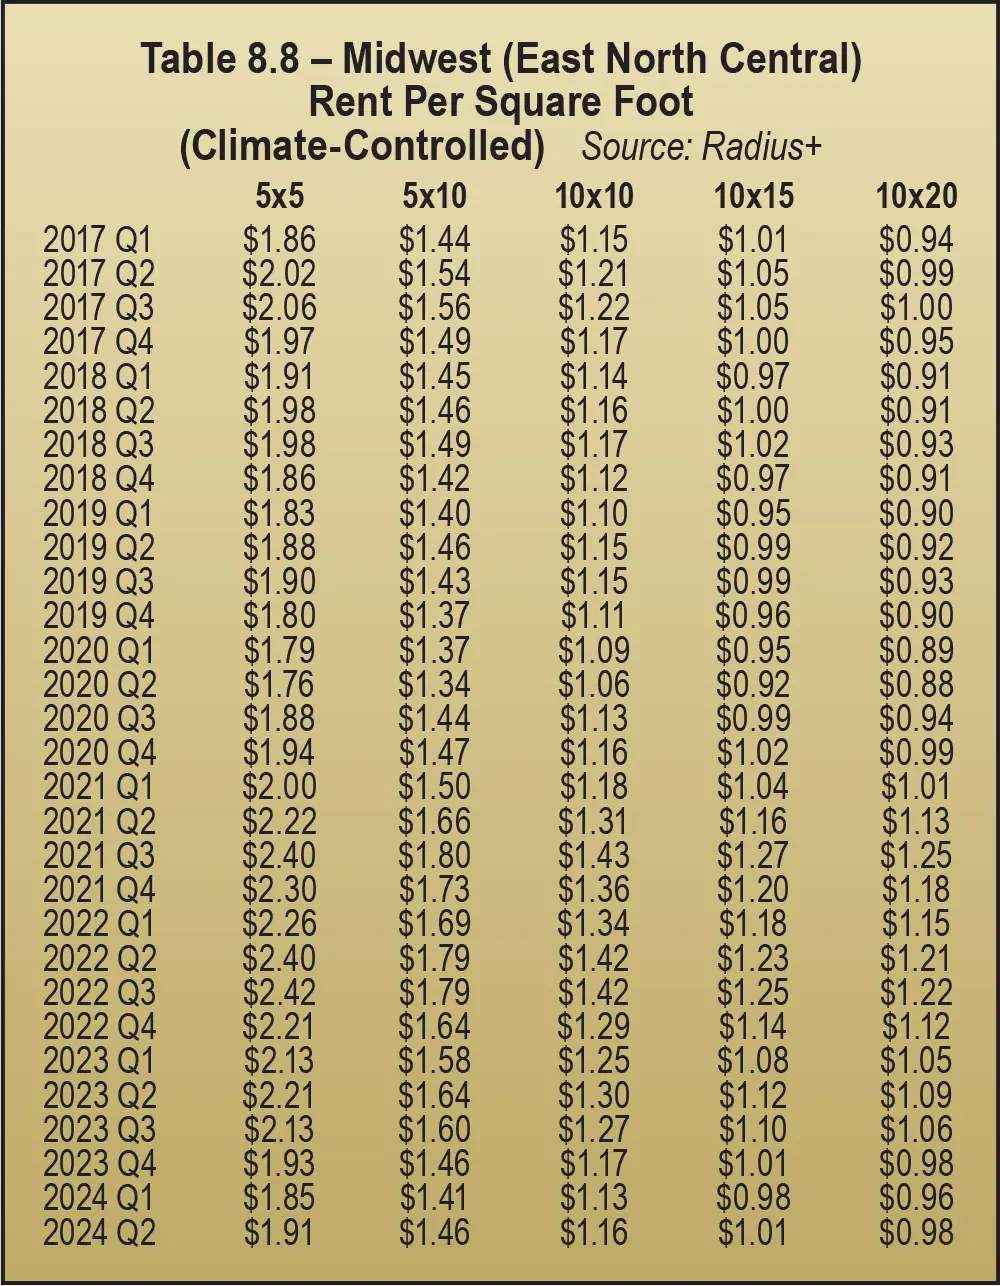
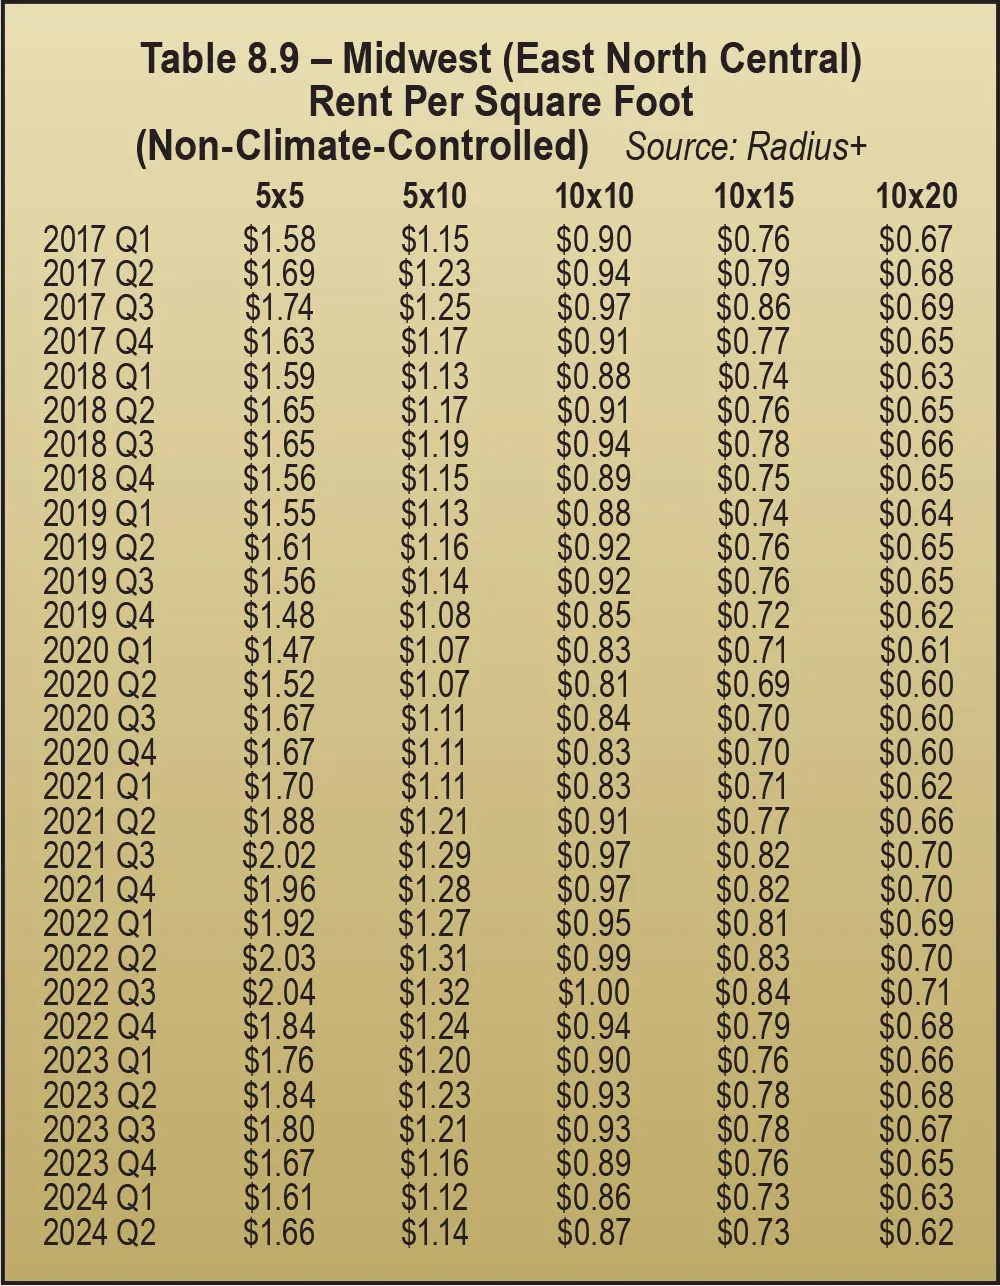
Measured in price per square foot, climate-controlled rental rates in 2024 were down an average of 12 percent YOY in the Midwest (East North Central) region. Rent for 5-by-5s (measured by both units and square feet) declined the most at 14 percent down. See Table 8.8 and Table 8.9.
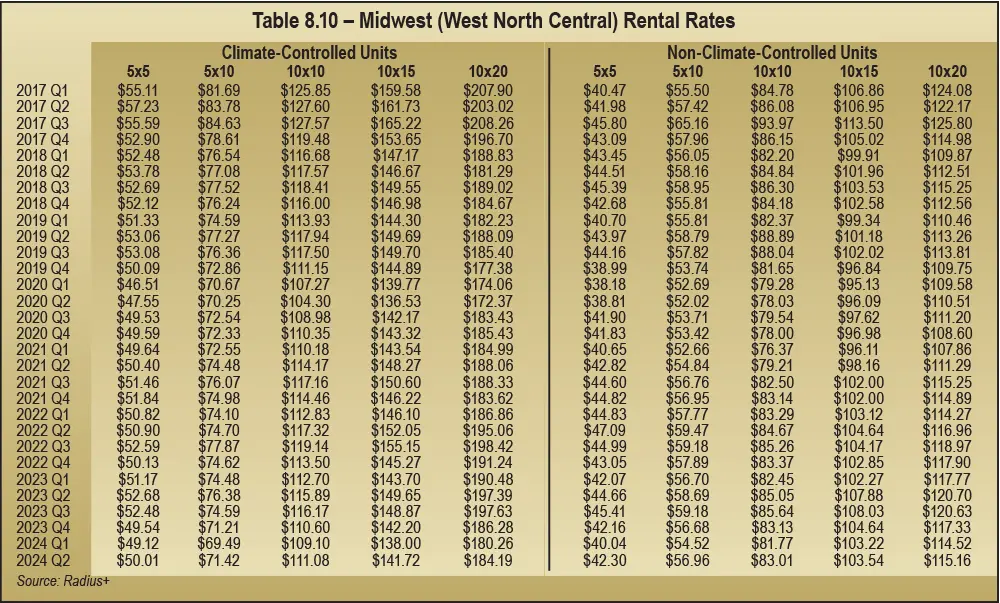
Rental rates in the Midwest (West North Central) region dropped half as much as the Midwest (East North Central) region. See Table 8.10.
Non-climate-controlled rates fared a little better but were still down. YOY rental rates declined an average of 4 percent. The smallest units (5-by-5s) and largest units (10-by-20s) were down the most at 5 percent, but the medium-sized units (10-by-10s) were down the least at 2 percent.
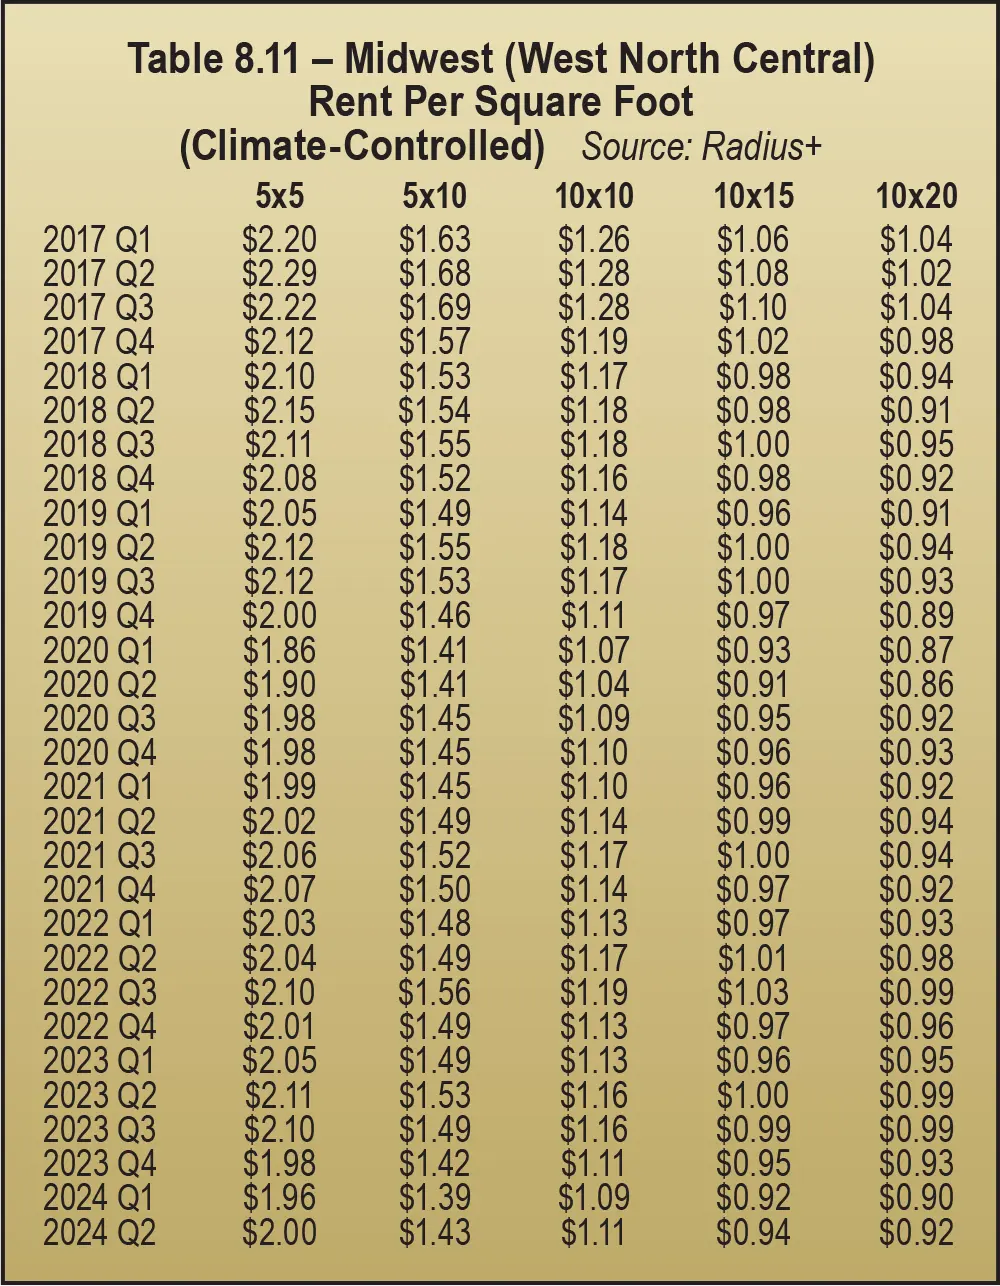
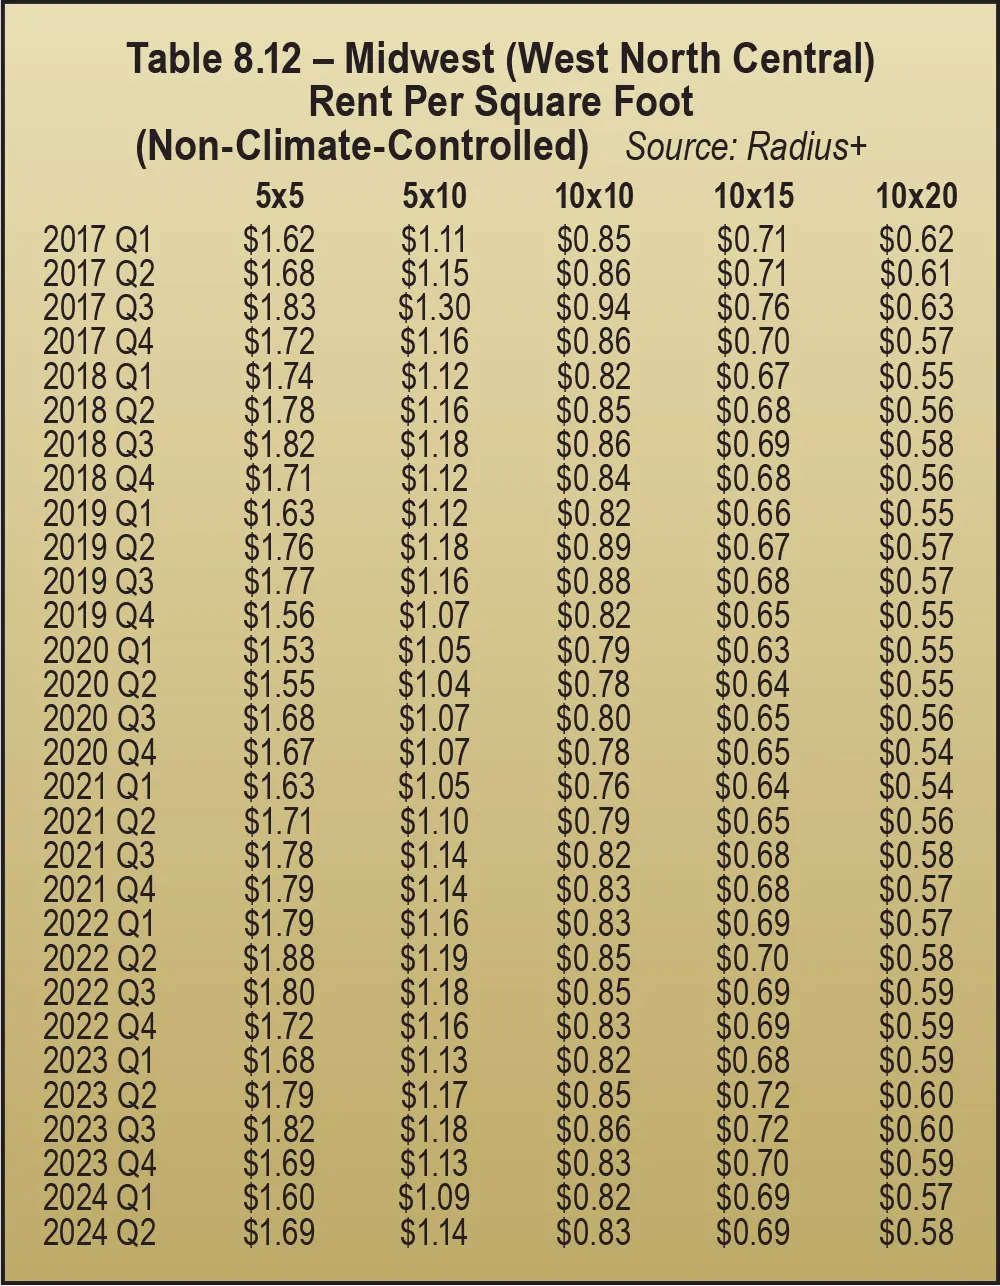
In the Midwest (West North Central) region, prices measured by square foot for climate-controlled space were down an average of 6 percent YOY in 2024. Square foot rent for 10-by-10s dropped less (4 percent); larger units’ rents dropped more (7 percent down for 10-by-20s). See Table 8.11 and Table 8.12.
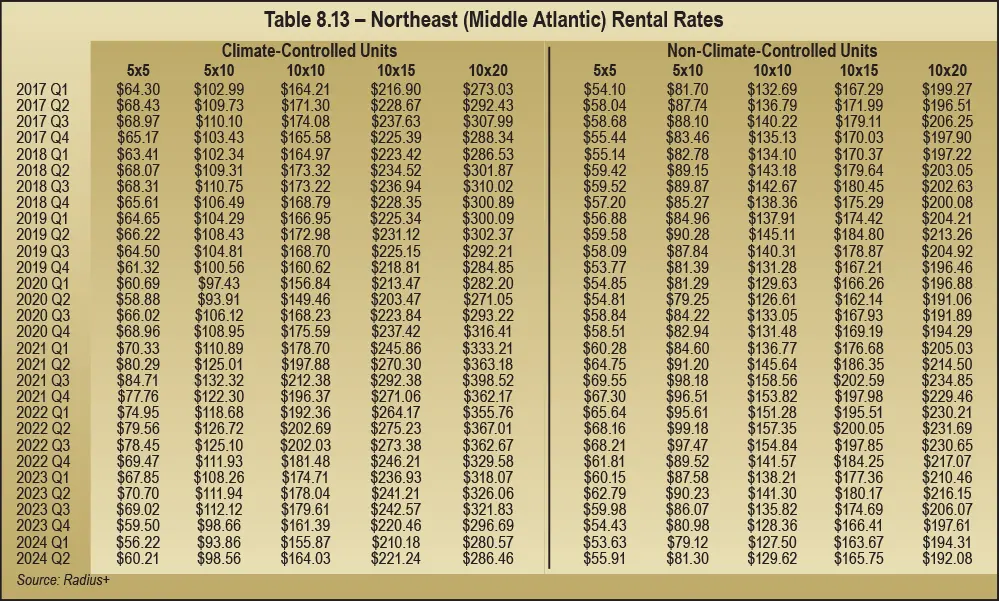
In 2024, measured in unit pricing, YOY rental rates for climate-controlled units were down an average of 11 percent in the Northeast (Middle Atlantic) region. The smallest units (5-by-5s) were down the most at 15 percent. See Table 8.13.
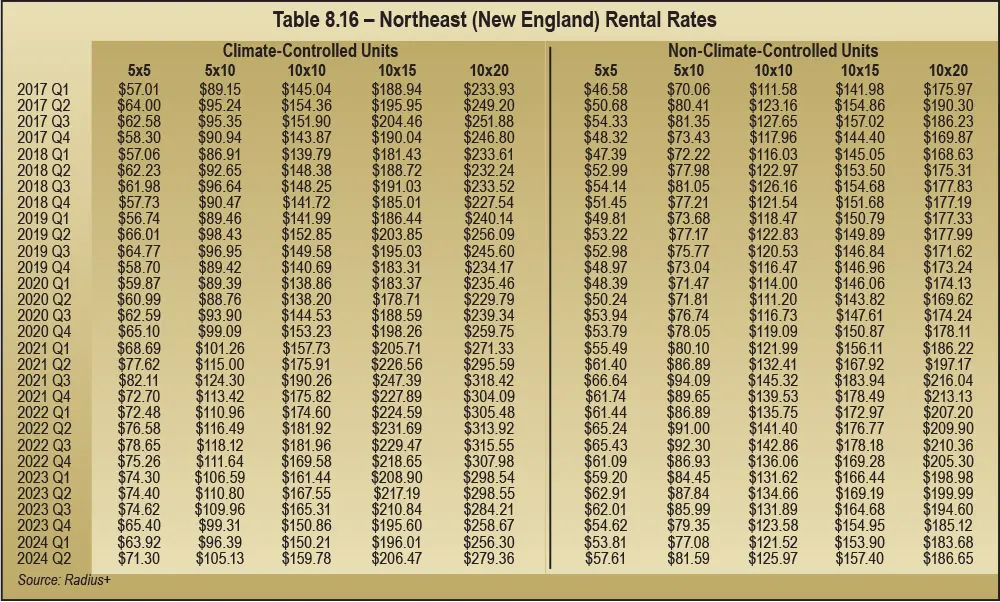
Climate-controlled rental rates in the Northeast (New England) region dropped half as much as rates in the Northeast (Middle Atlantic). Measured in unit pricing, YOY rental rates for climate-controlled units were down on average only 5 percent, and the smallest units (5-by-5s) were down the least (4 percent). See Table 8.16.
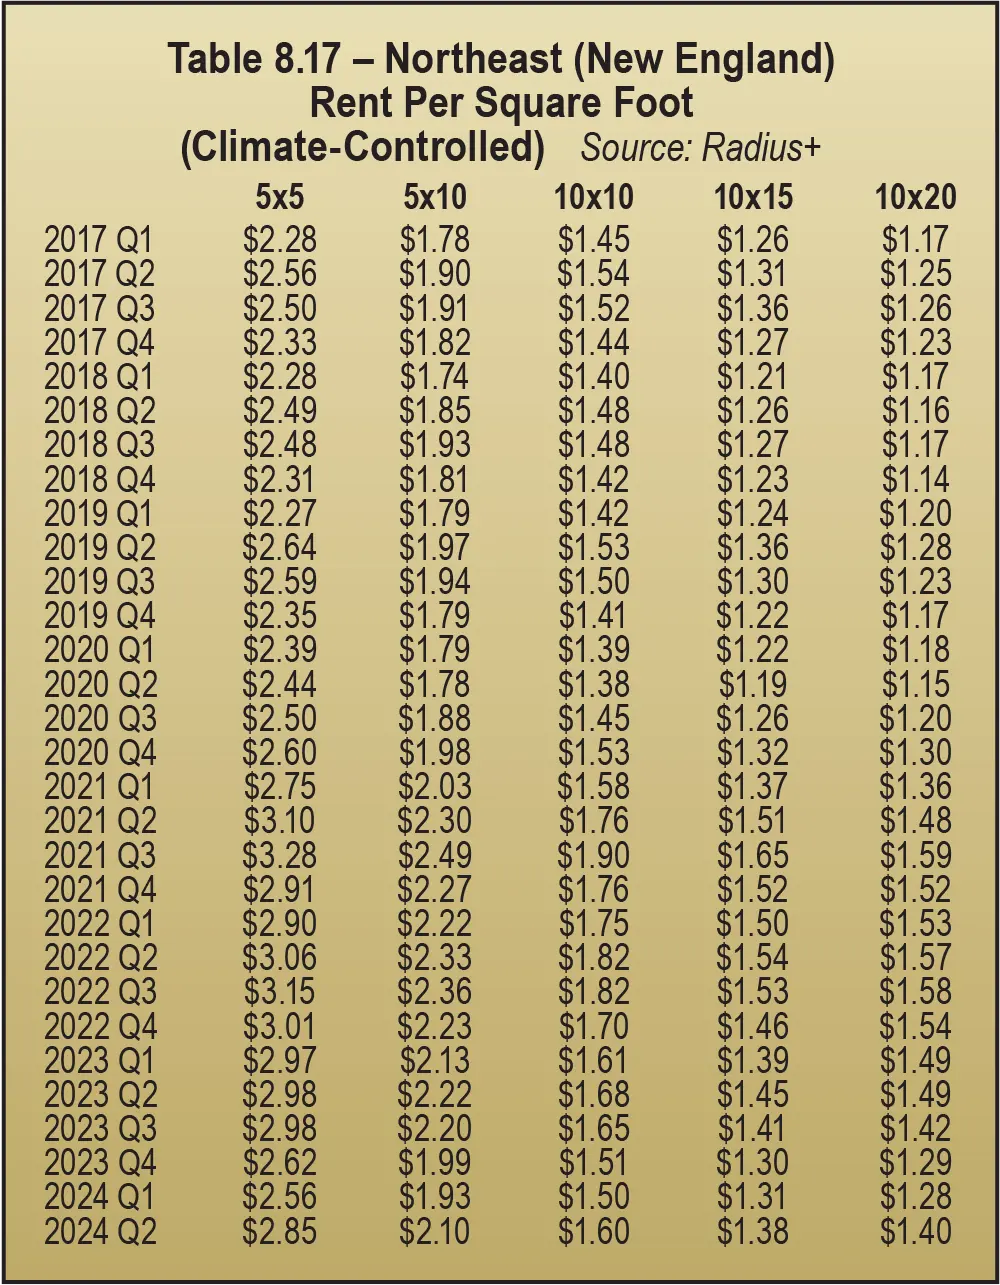
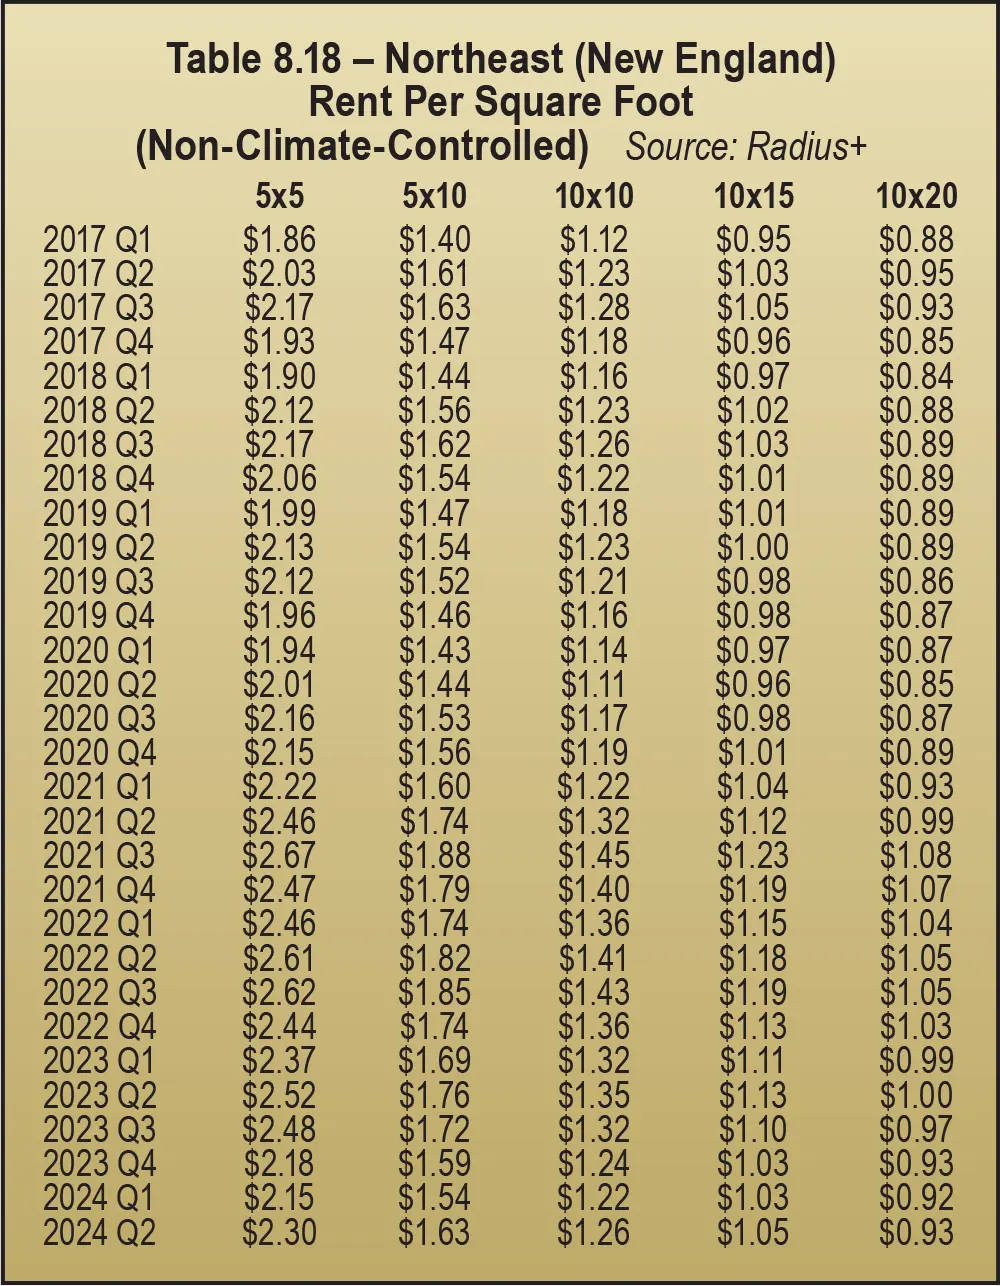
Rental rates in the Northeast (New England) region, measured by square feet for climate-controlled space, also declined an average of 5 percent YOY, fairly evenly down for all unit sizes. See Table 8.17 and Table 8.18.
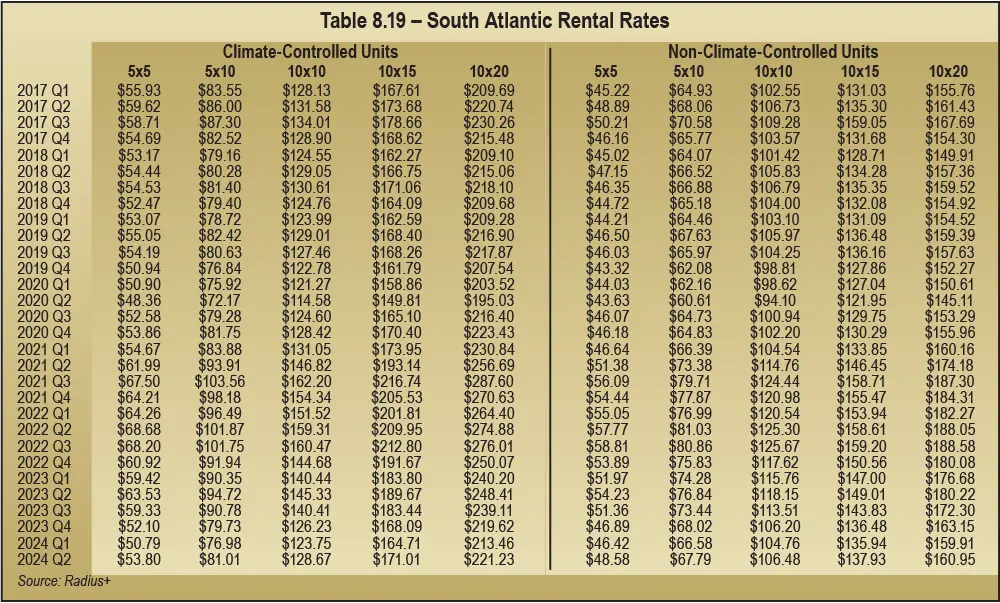
Measured in unit pricing, YOY rental rates for climate-controlled units were down 12 percent on average, the largest regional decline. The smaller units (5-by-5s and 5-by-10s) experienced the most substantial rate drops (15 percent and 14 percent, respectively).
Non-climate-controlled rates dropped a little less (10 percent). Oddly, rates for 10-by-15s were only down 7 percent.
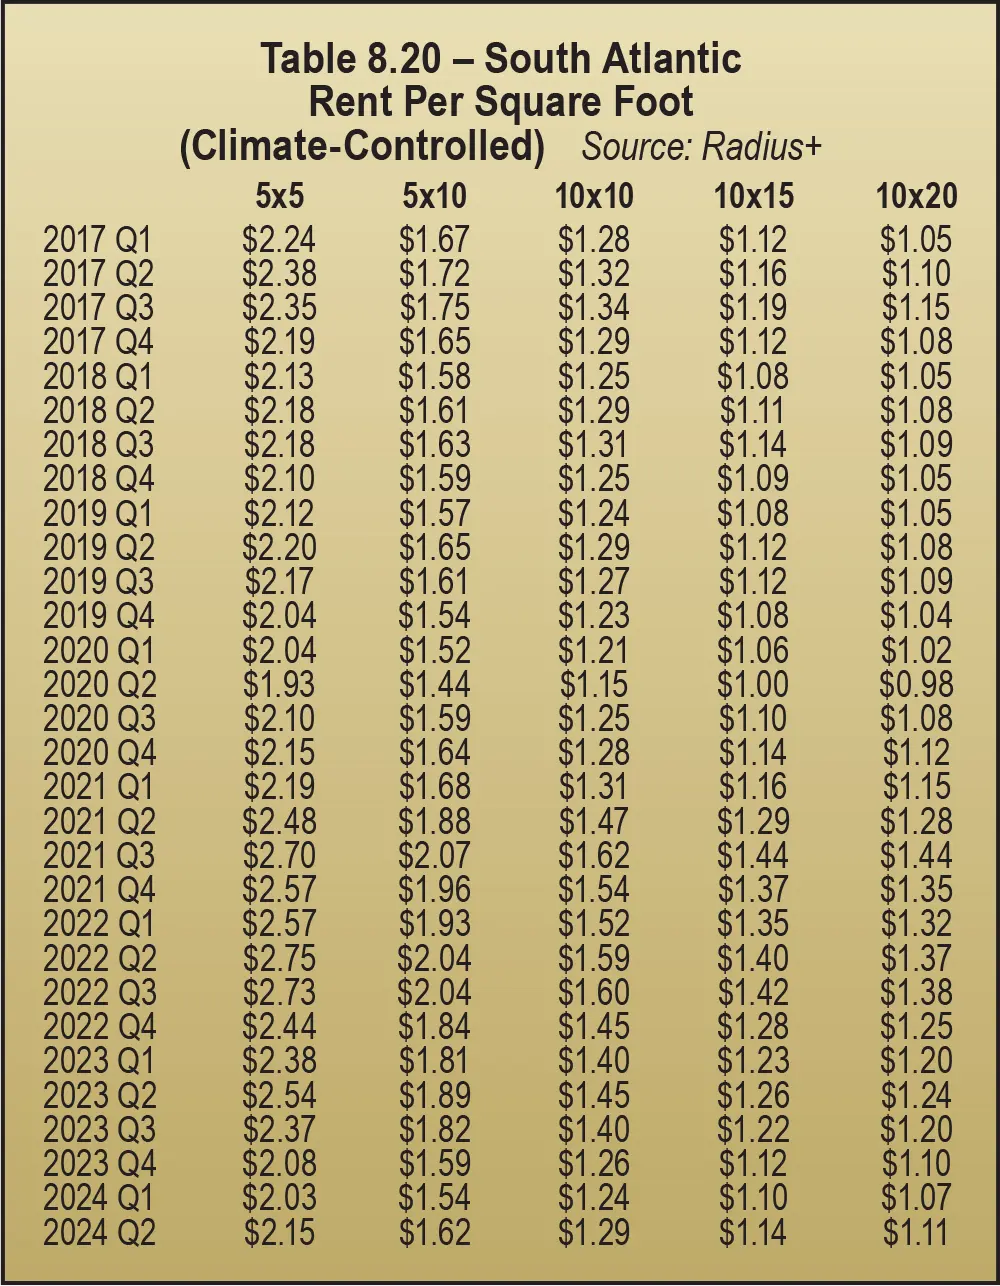
In this region, rental rates measured by square feet for climate-controlled space were down a little more than rental rates by unit. The average decline was 13 percent YOY. Small units (5-by-5s) were down 15 percent and 10-by-15s were down only 10 percent in the South Atlantic region. See Table 8.19.
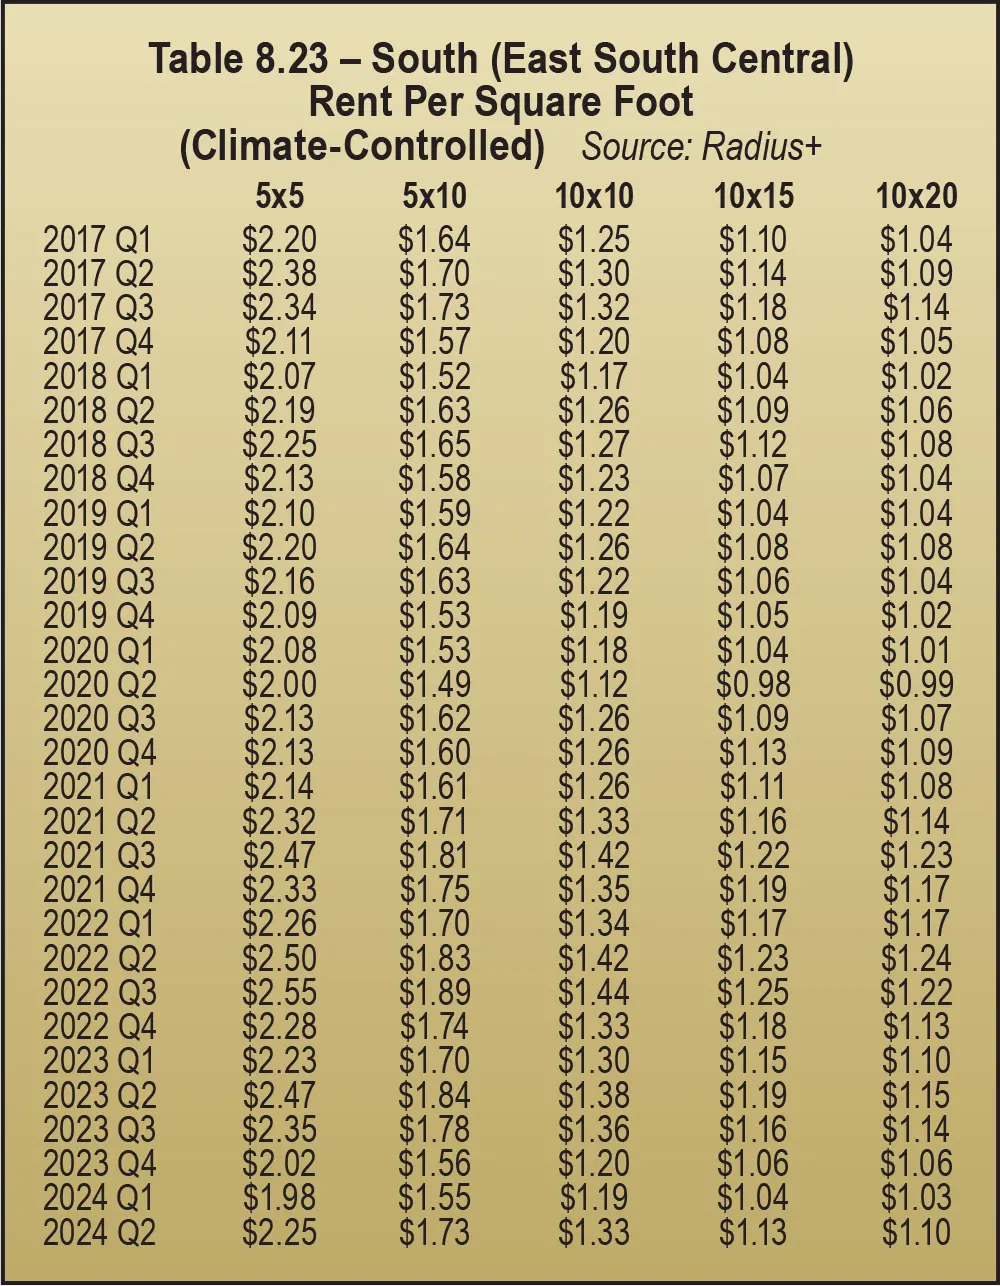
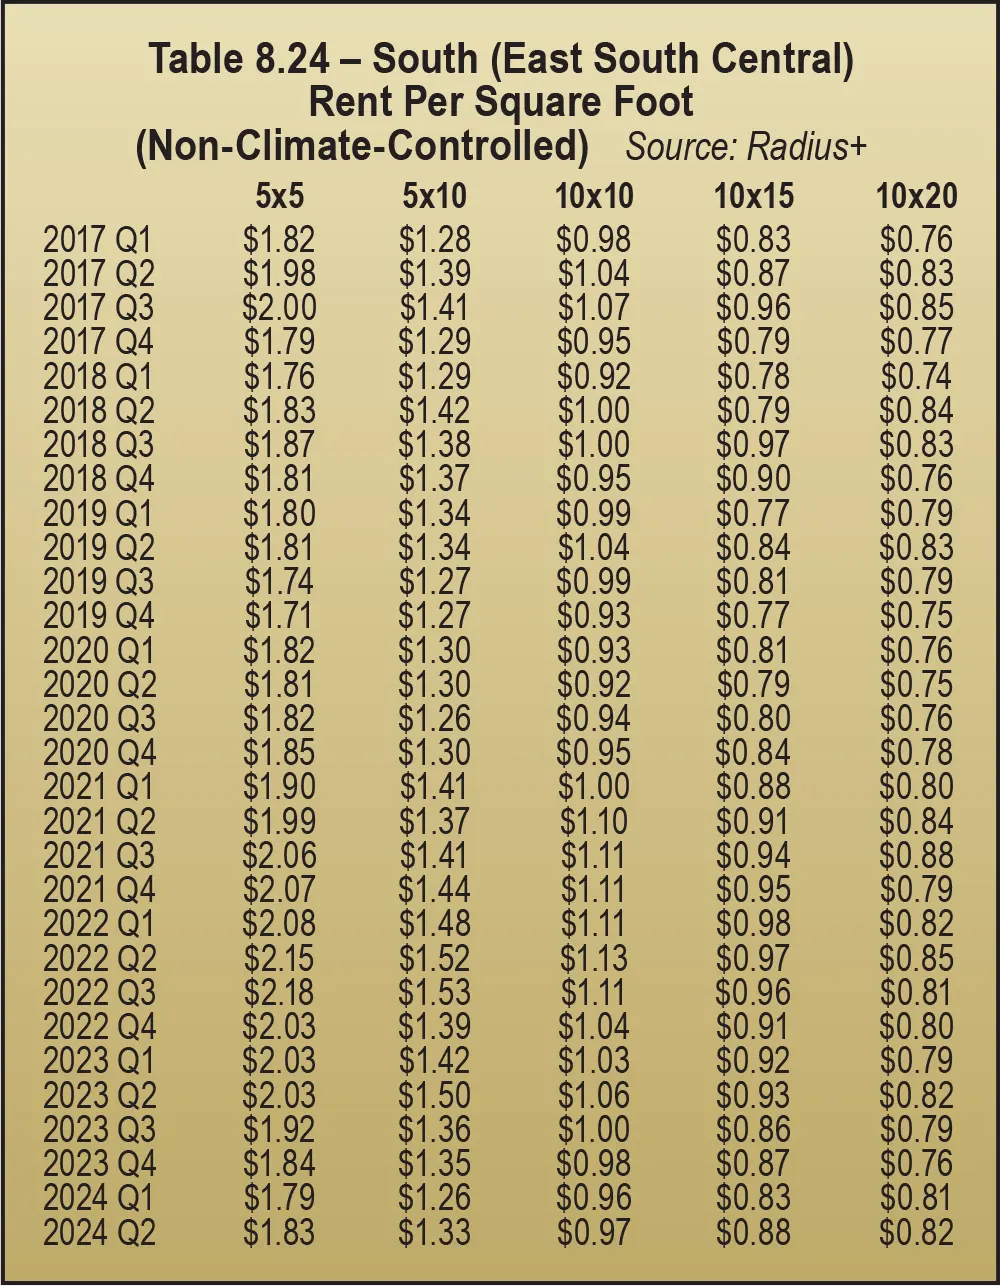
In 2024, in the South (East South Central) region, measured by square feet for climate-controlled space, rates were down 6 percent YOY, with rent for 5-by-5s down 9 percent. See Table 8.23 and Table 8.24.
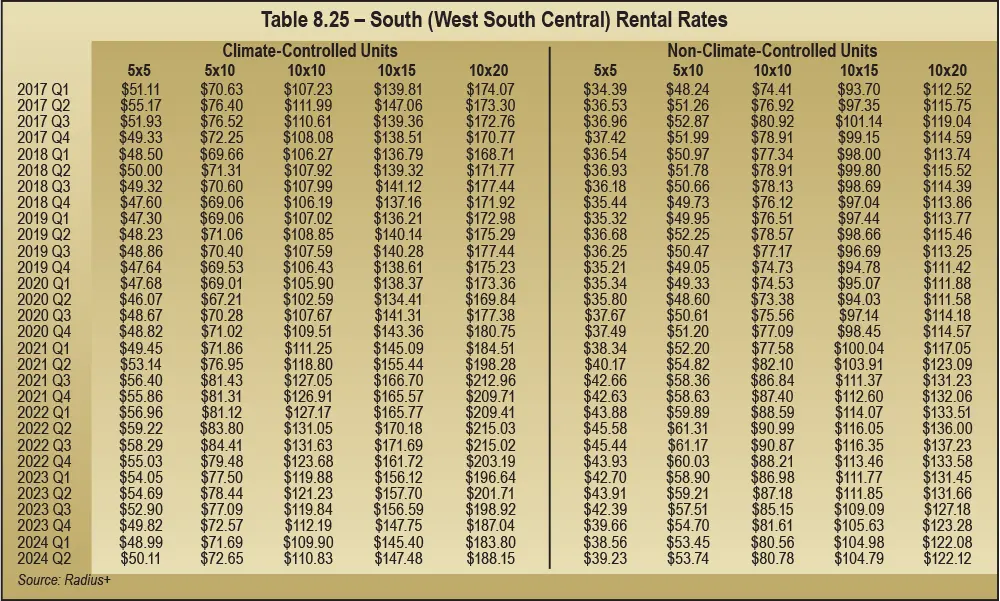
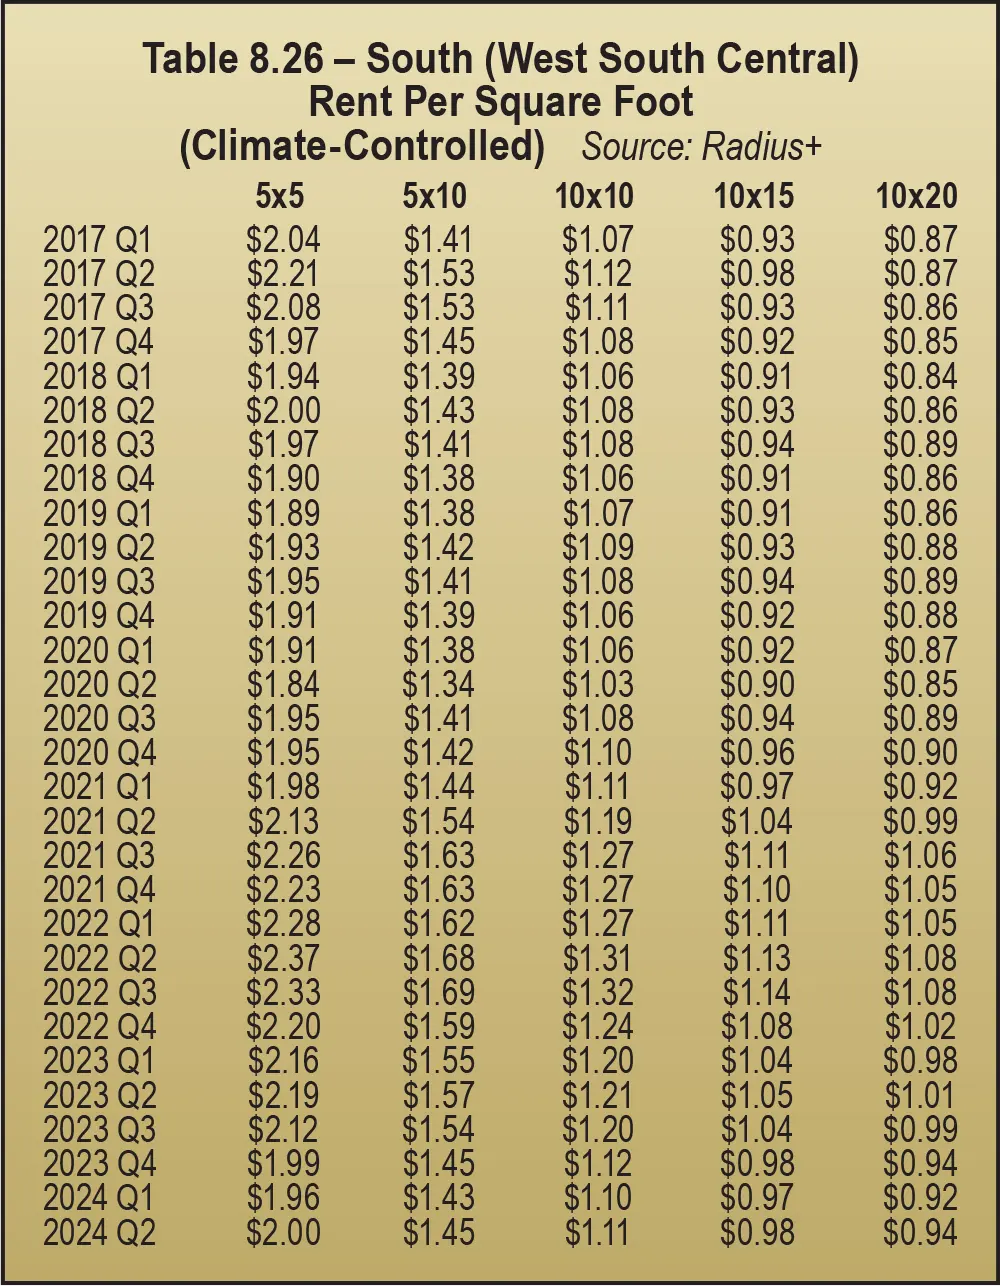
Rental rates in the South (West South Central) region, measured by square feet for climate-controlled space, were down 8 percent YOY, but rates for 10-by-15s decreased the least (6 percent).
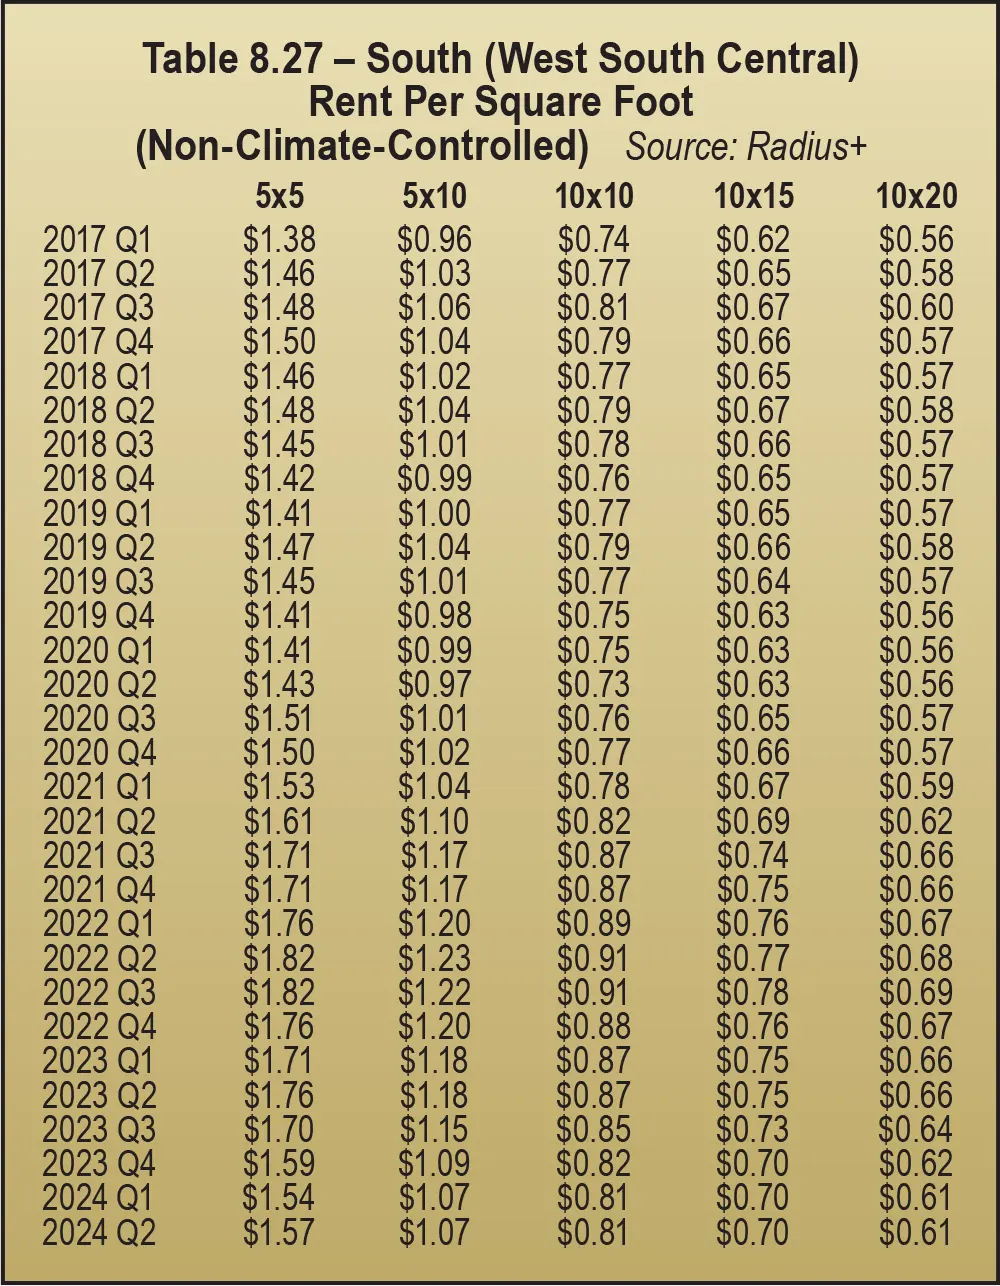
Non-climate-controlled rates measured by square foot dropped a bit more, at 9 percent down. As for climate-controlled space, the smallest units (5-by-5s) saw the largest rental rate decline (11 percent). See Table 8.26 and Table 8.27.
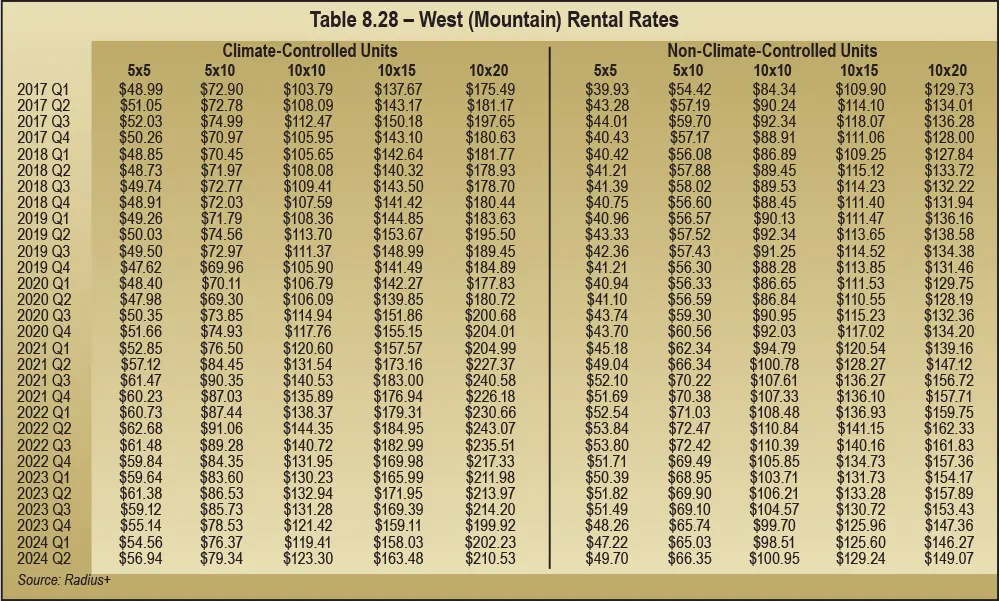
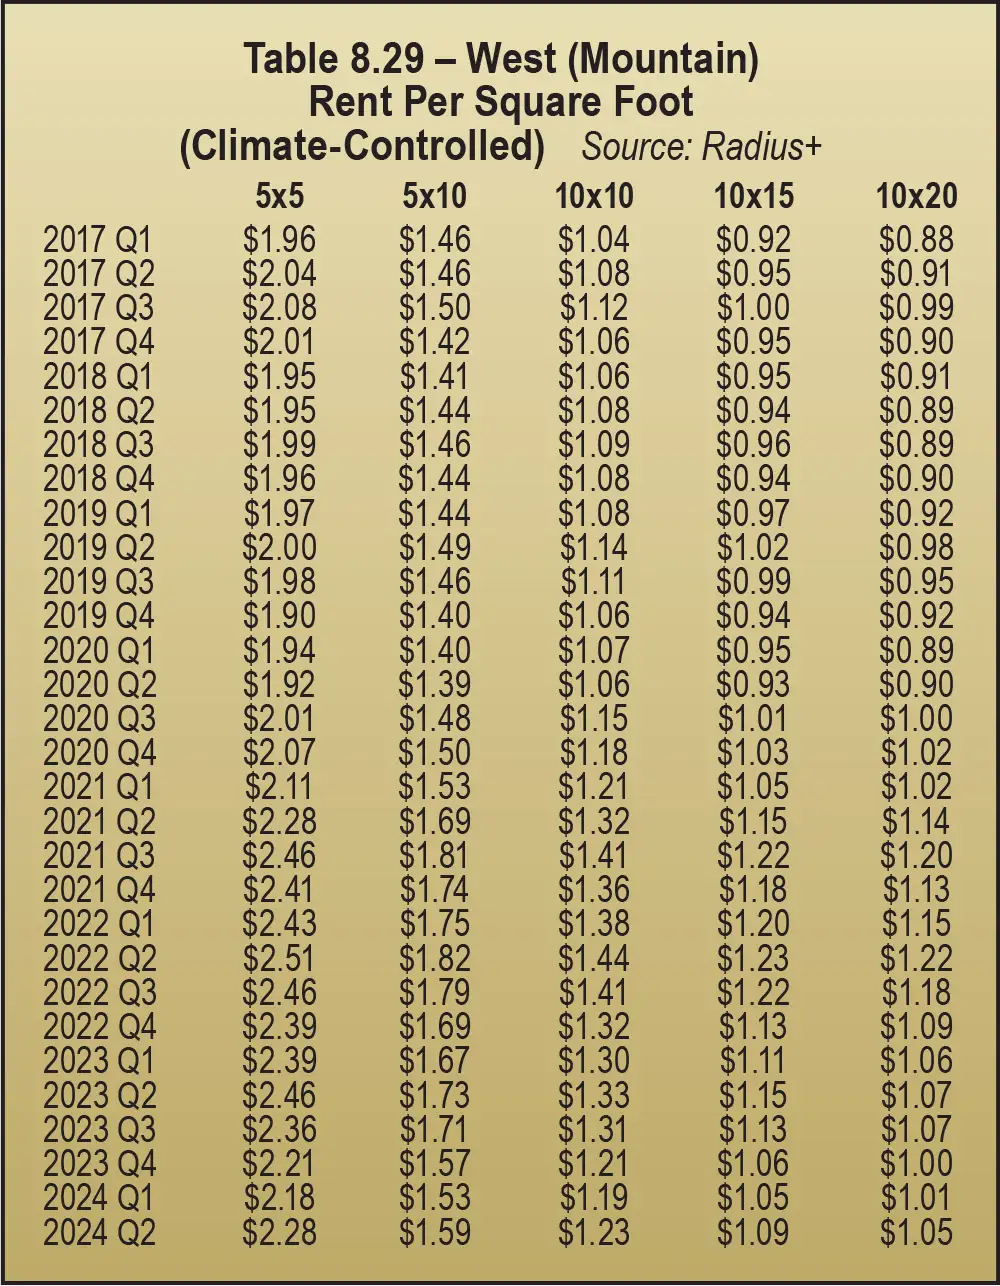
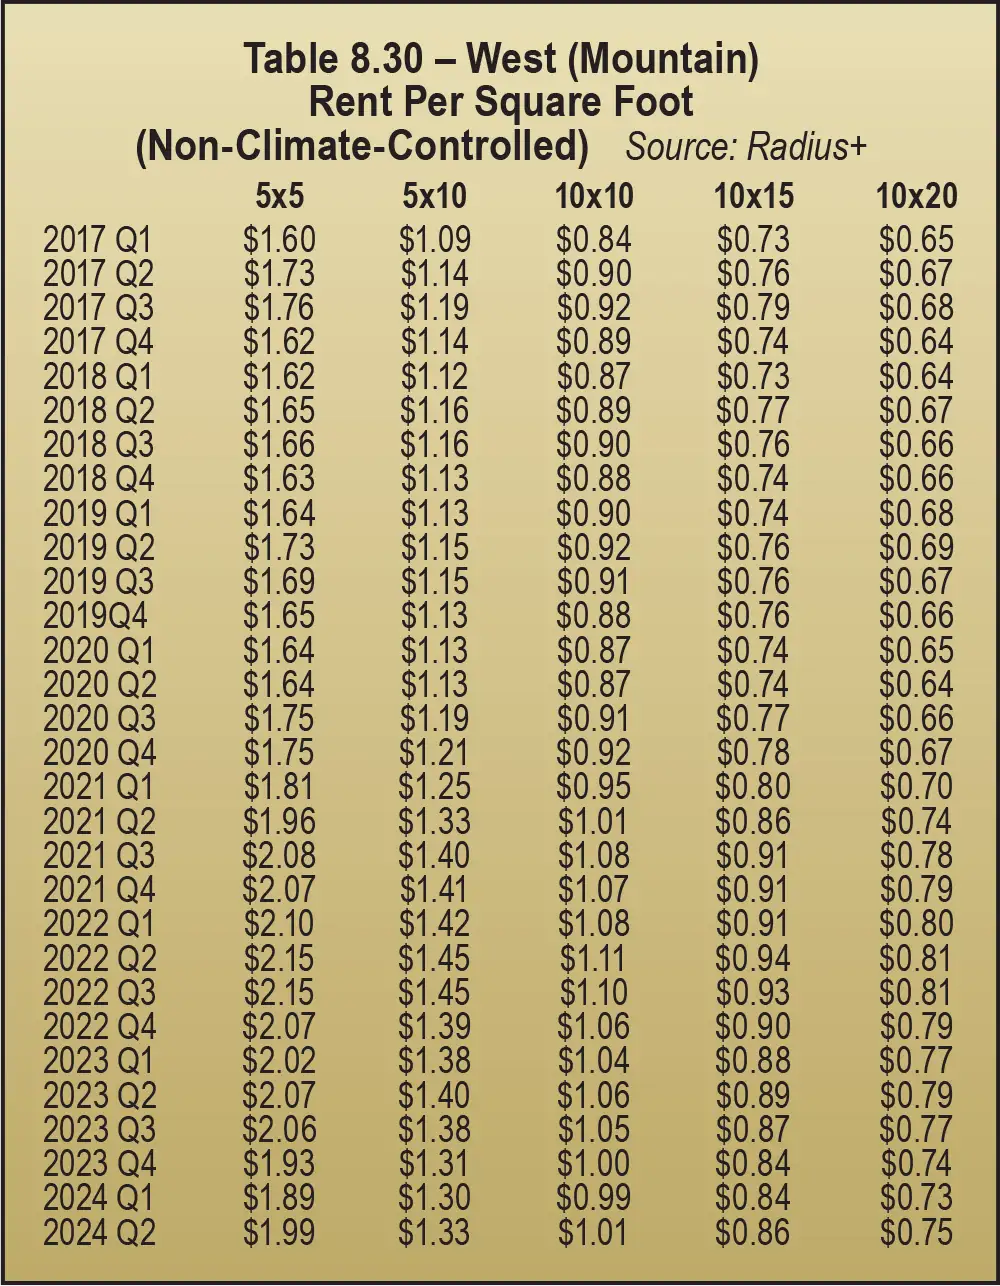
Rental rates in the West (Mountain) region, measured by square feet for climate-controlled space, were down 6 percent YOY, but again 10-by-20s were only down 2 percent. See Table 8.29 and Table 8.30.
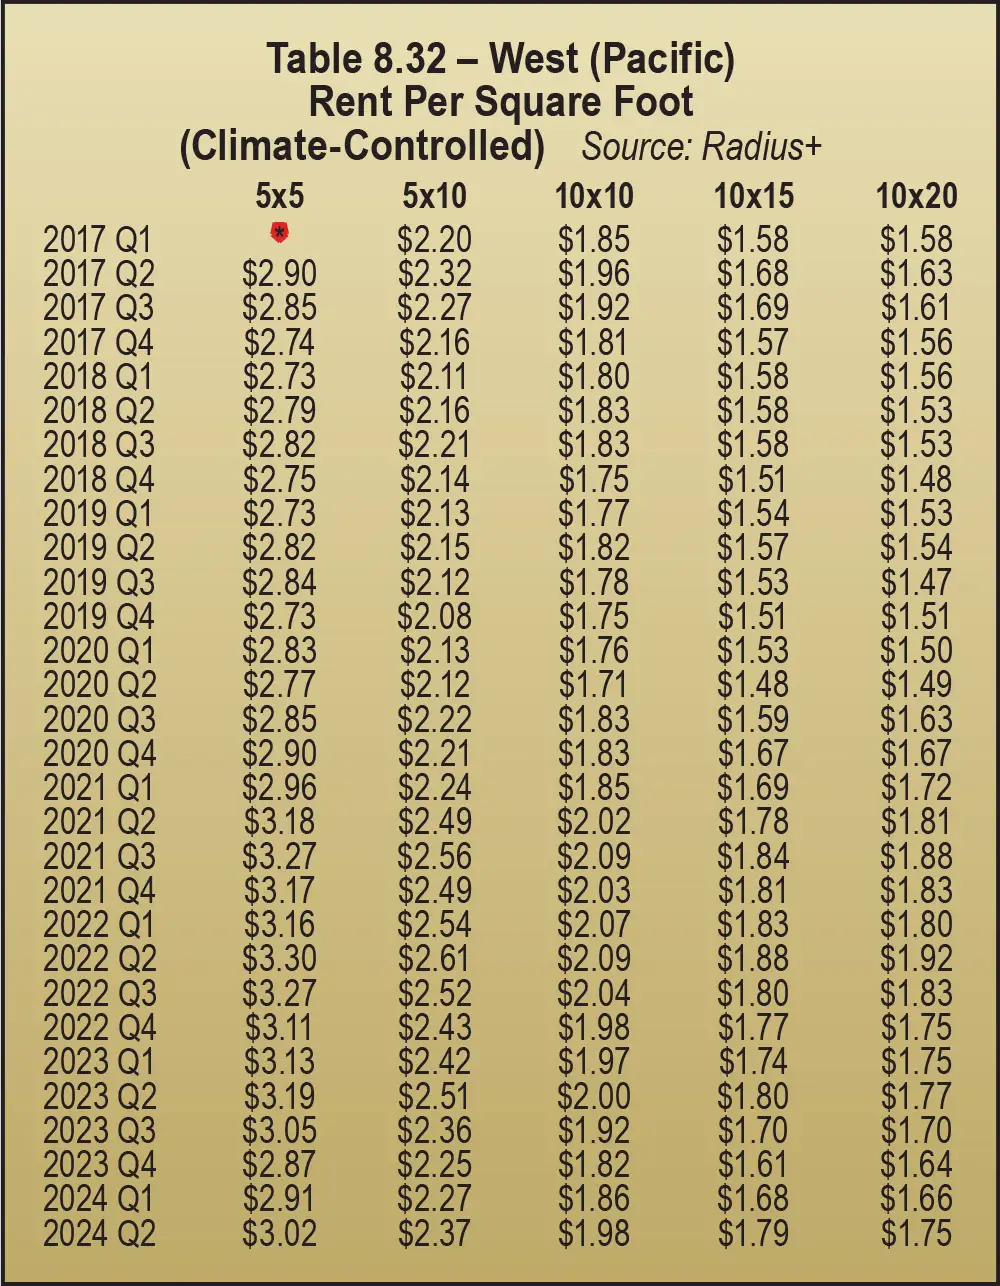
Rates fared best in the West (Pacific) region. Measured in unit pricing, YOY rental rates for climate-controlled units were down only 2 percent on average. Larger units were down little to none: 10-by-10s and 10-by-20s were down 1 percent and 10-by-15s were on par with the previous year with no change in price. See Table 8.31.
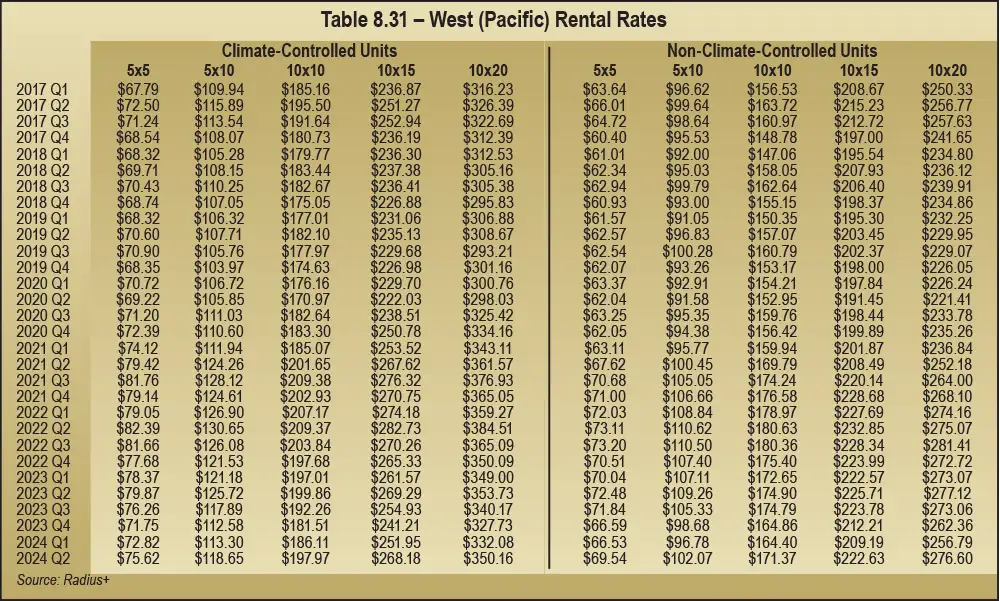
Regions in the West fared the best as far as rental rates go. As a matter of fact, some of the larger unit sizes experienced no price drops at all.
Rental rates in the West (Pacific) region, measured by square feet for climate-controlled space, were down only 3 percent YOY on average, but 10-by-20s were on par with 2023.
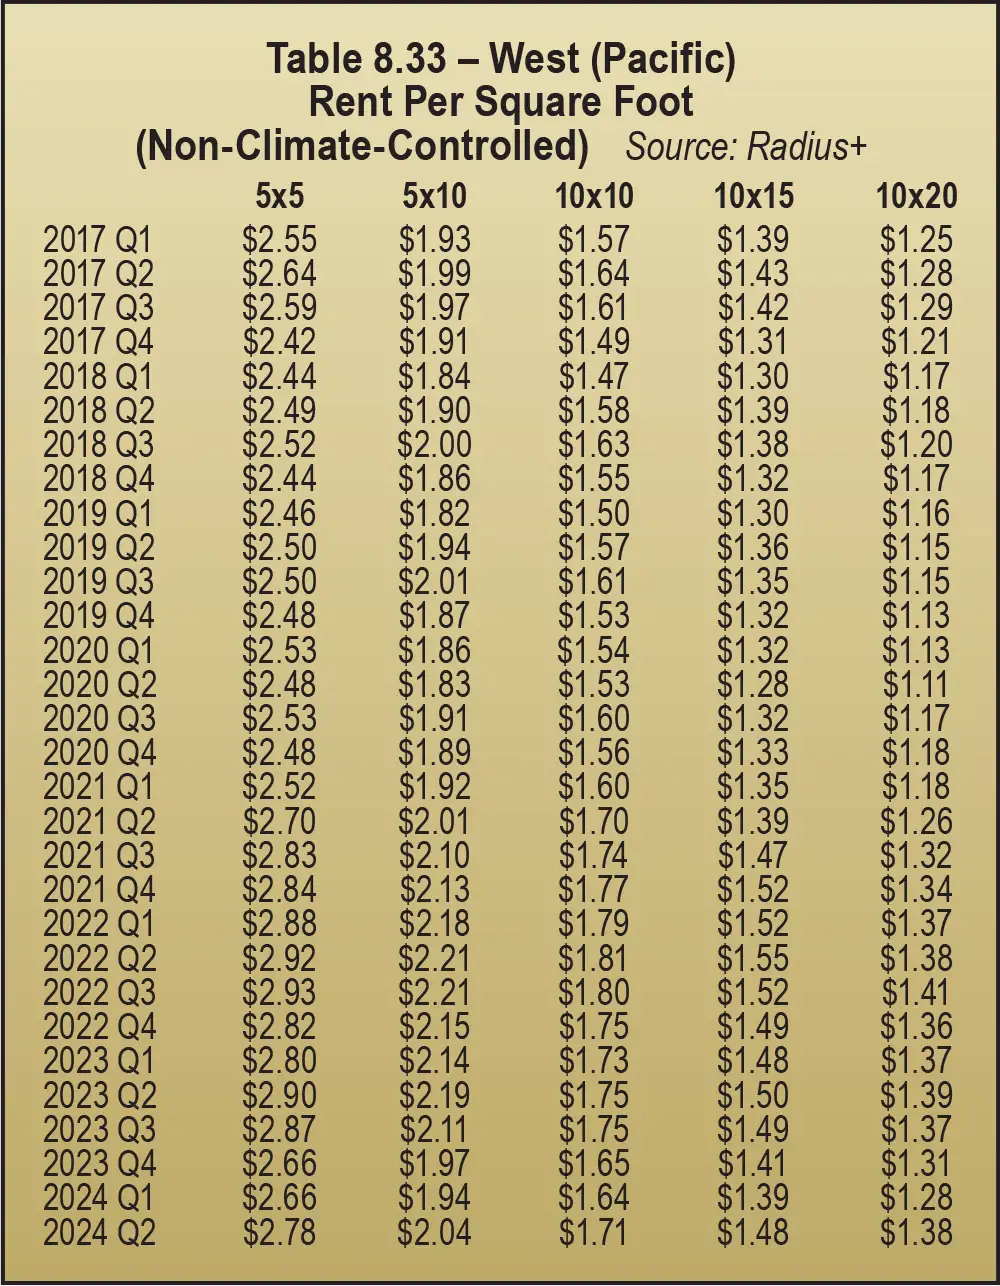
Non-climate-controlled rates measured by square foot were also down 3 percent on average, with 10-by-20s on par with 2023. See Table 8.32 and Table 8.33.