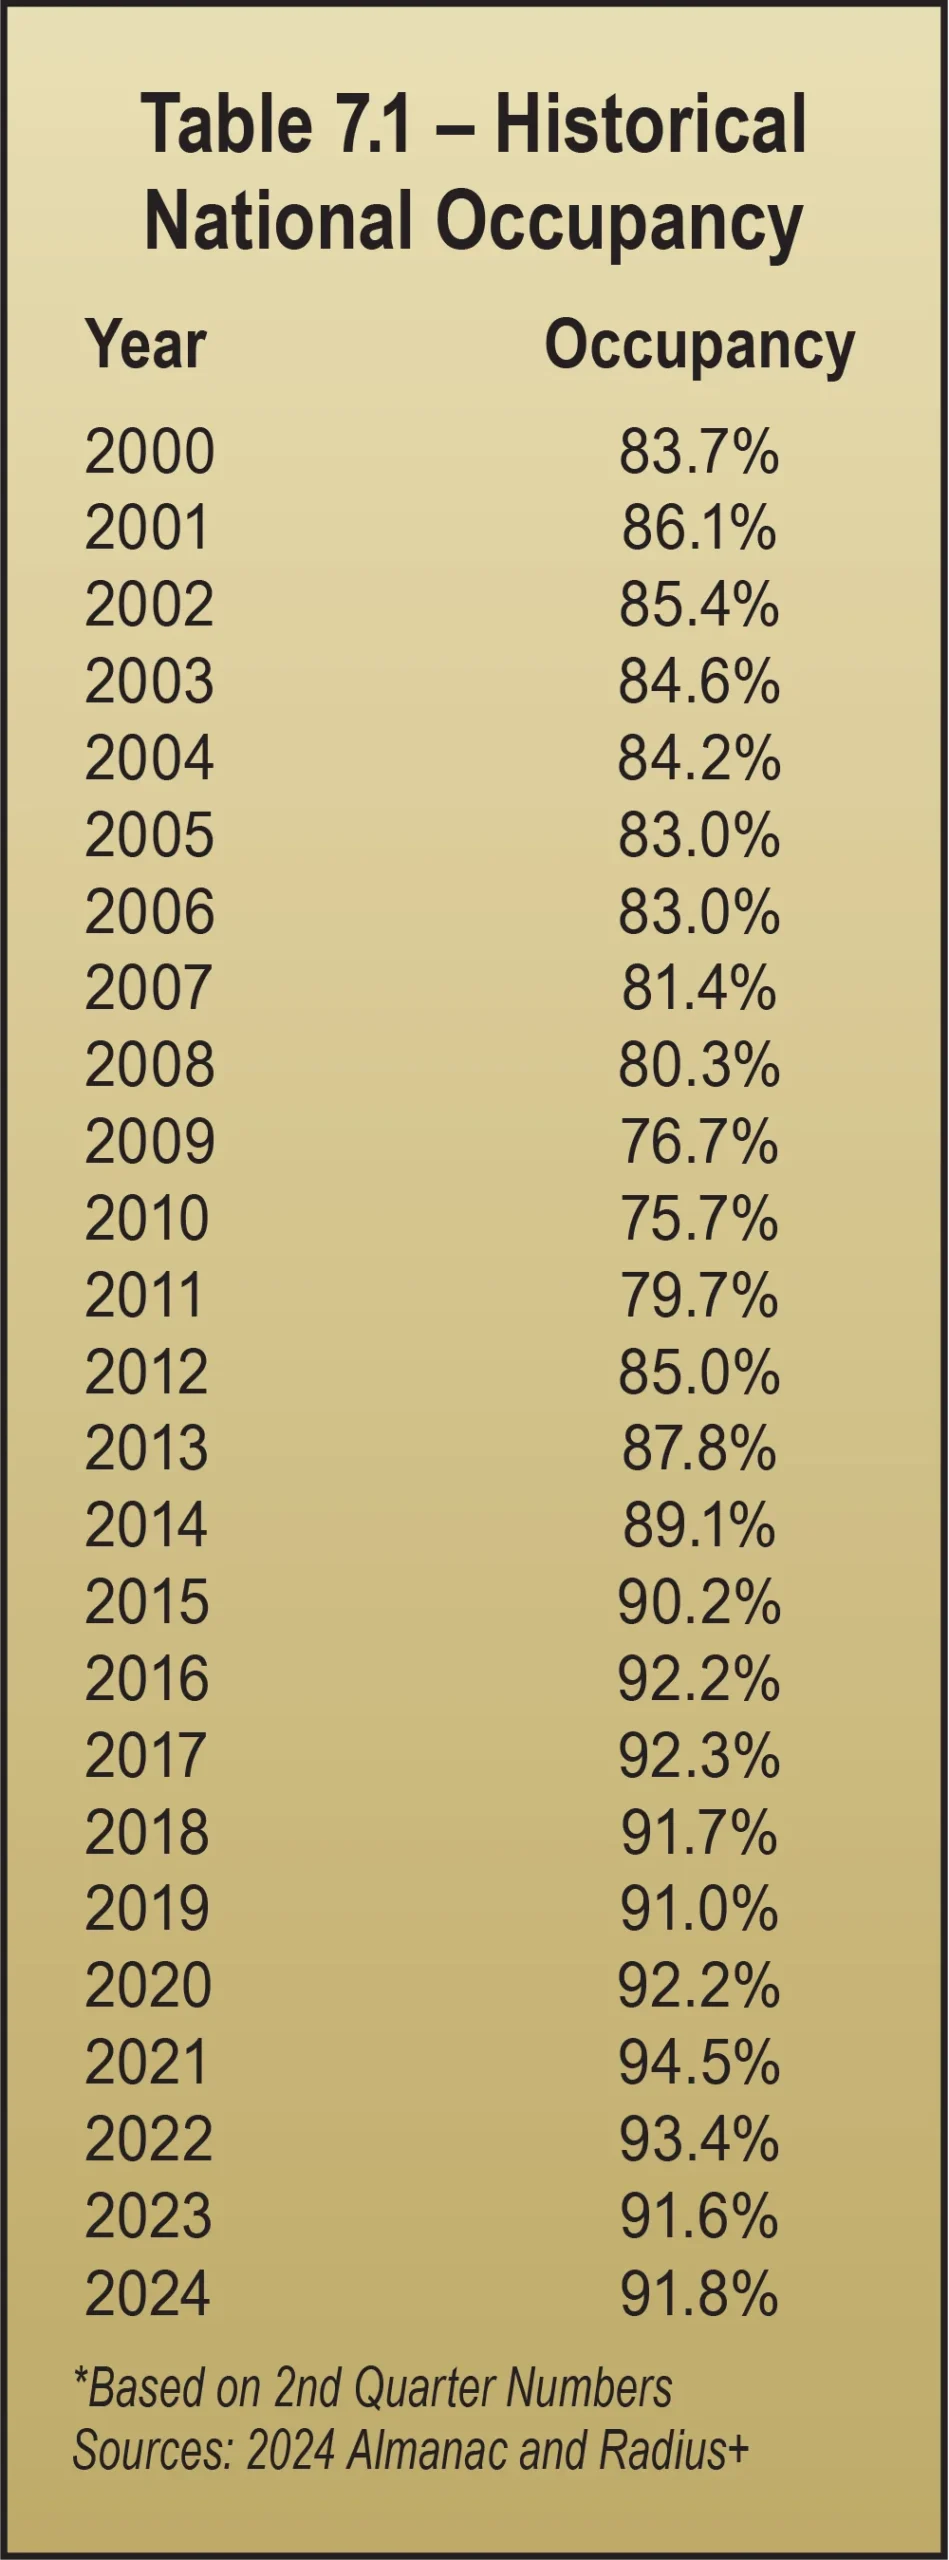
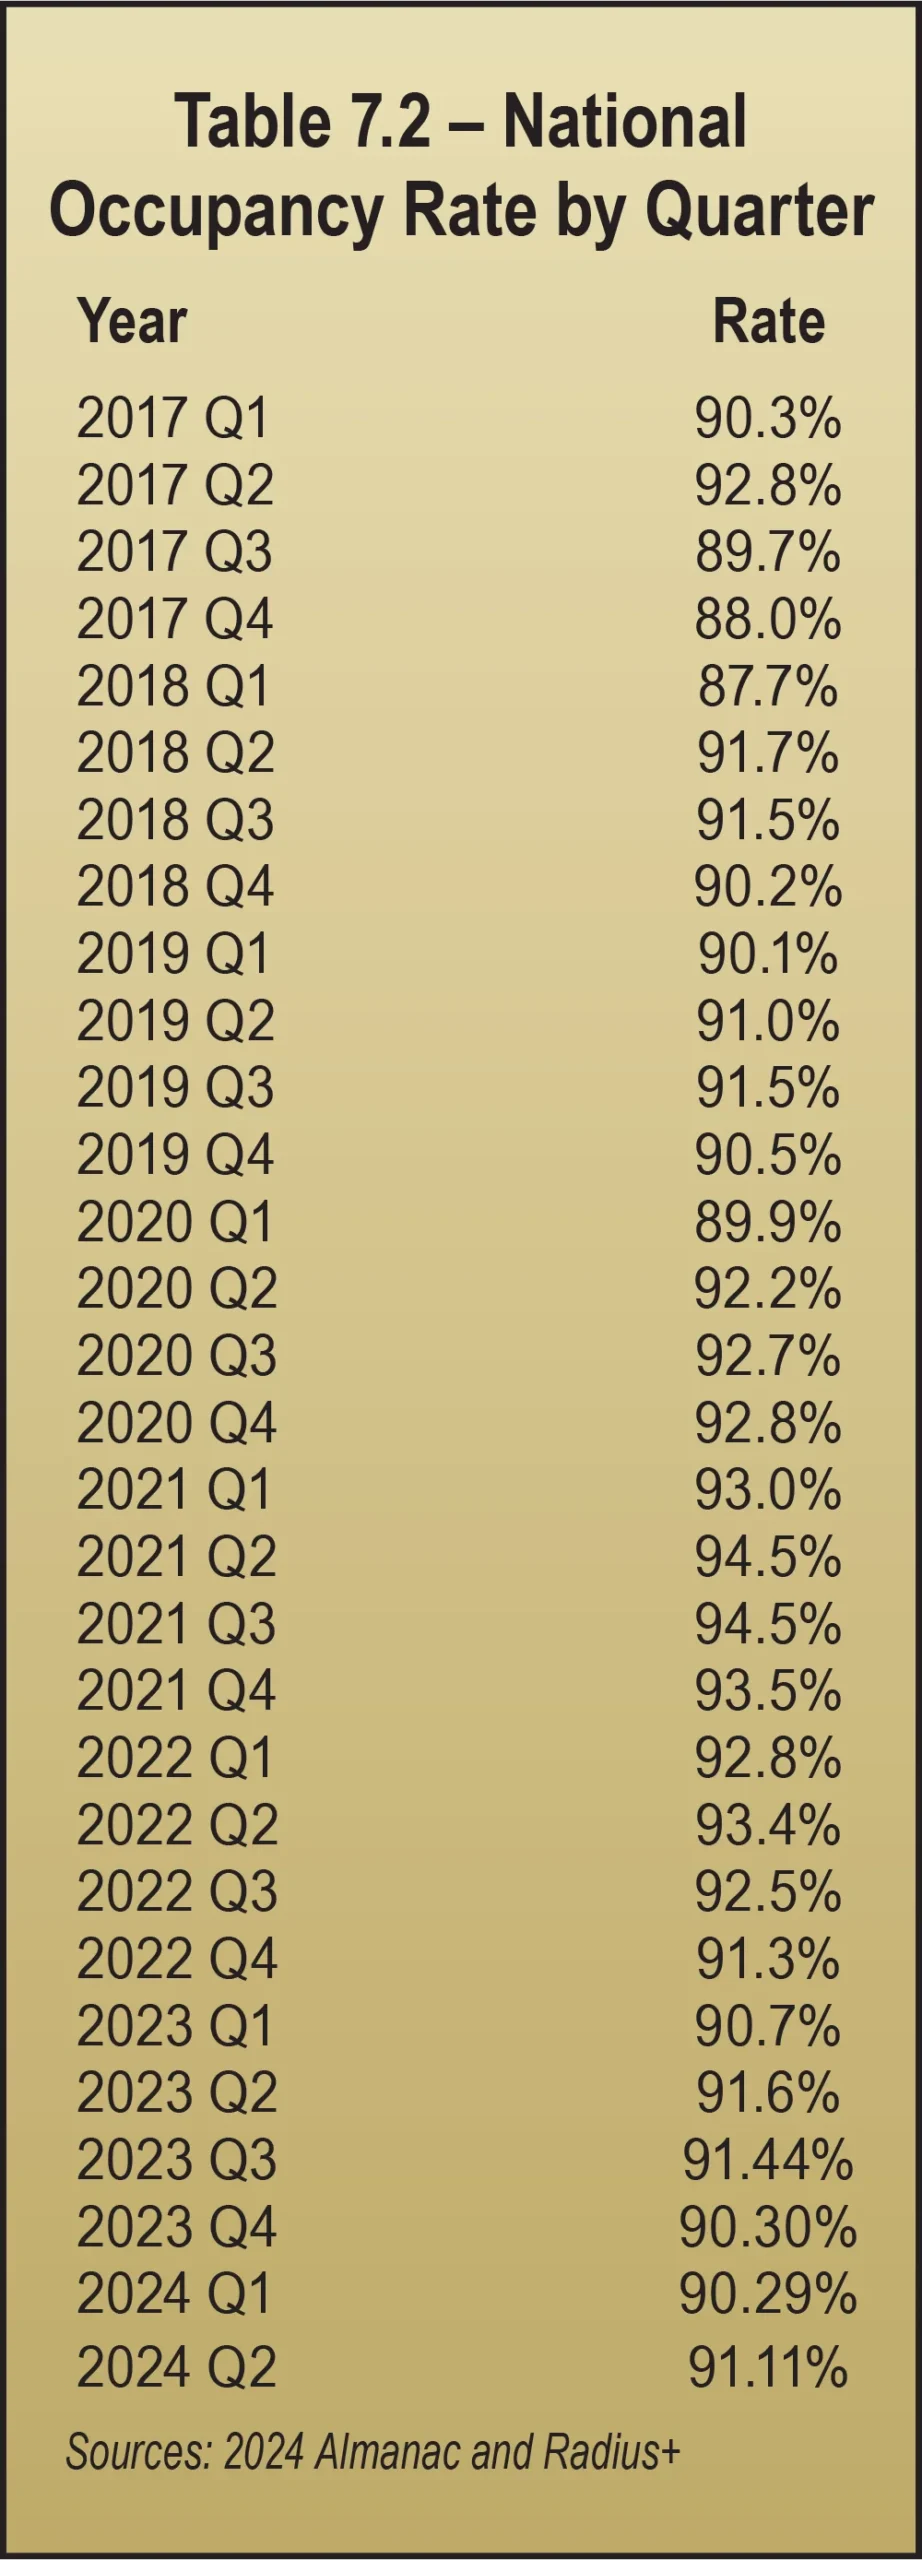
any self-storage professionals evaluate themselves and their business success by occupancy, both physical and economic. The data shown in Tables 7.1 and 7.2, along with Charts 7.1 and 7.2, tells a story of relatively stable occupancy over the past 10 years. During that time, national occupancy hovered near 90 percent to 93 percent, according to Radius+, the main data provider for MSM’s Self-Storage Almanac for the past five years.
Physical occupancy measures how many units are rented. Economic occupancy measures how much revenue they are bringing in. There is often a gap between them. The goal is to have a high percentage of units rented at rates that are as close as possible to your street rates (your target rent), while still having inventory to sell (space to rent), so that when you have leads you can rent units to them at the street rate instead of turning them away. Gross potential revenue (from rent) is what you would receive if you rented every unit at your street rate without any concessions, discounts, or promotions.
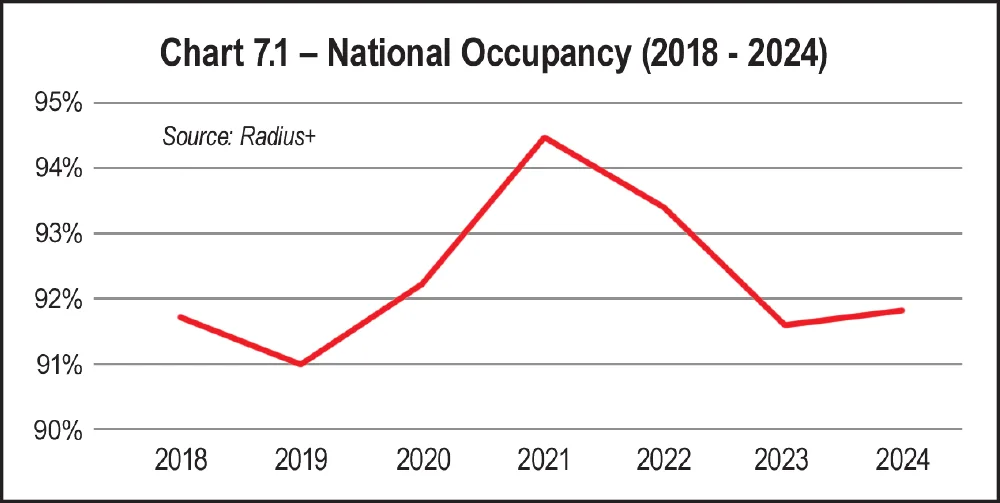
Occupancy hit an all-time high in 2021, climbing to 94.5 percent, and it continued to be quite high in 2022, when the national average was 93.4 percent. Chart 7.1, with data just from 2018 to 2024, clearly shows the spike in occupancy.
- Work at home,
- Population migration from urban centers to locations with lower cost of living,
- Remodeling, which surged while people were house-bound and bored during COVID shutdowns, and
- Fewer move-outs than average, due to shutdowns, with more move-ins than average.
The COVID years are over, and occupancy is returning to normal. In 2024, occupancy reverted to the 90 percent to 93 percent range, at 91.6 percent, and remained there in 2024, at 91.8 percent.
Before COVID, the old norm considered 85 percent occupancy to be a good, solid number, but a lot of things have changed. Even the way the industry uses the term “stabilized occupancy” has changed. It used to mean when expenses were covered, so every additional rental went straight to the bottom line with no increase in expenses. It has come to mean when facilities are achieving other internal goals, such as those shown on the proforma upon which the investments were made.
Investment proformas developed when rates and occupancy were climbing during COVID may call for more rapid lease-ups than are currently being realized at higher rent per square foot. A COVID-era proforma calling for lease-up to 90 percent in three years at a rental rate of $1.70 per square foot may have been achievable between 2020 and 2022, but it’s not feasible in today’s lower occupancy environment with reduced rents of closer to $1.23 per square foot. If such deals were largely financed with debt at a variable interest rate that unexpectedly increased significantly, those projects are in trouble.
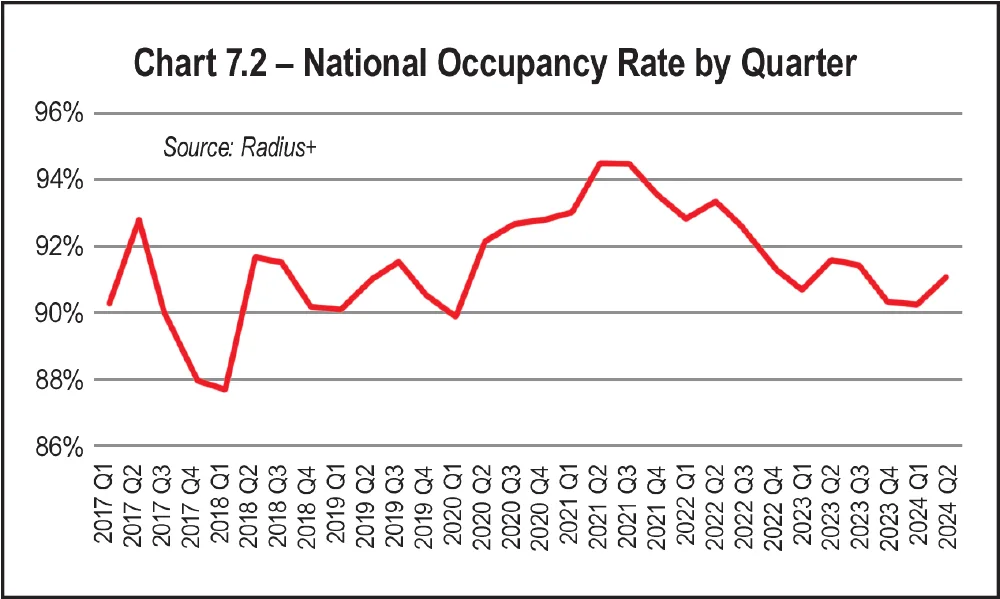
Annual occupancy figures aside, occupancy does vary from month to month throughout the year. Even if a facility fits within this 90 percent to 93 percent occupancy range as an annual average, the monthly averages within that year may vary by as much as 20 percent points or more, meaning an annual average looks quite different from the day-to-day experience.
Several factors explain occupancy fluctuation.
- Seasonality – More rentals occur during the spring and summer than during the fall and winter because people typically move when the weather is warmer and/or students are not in school. Other local market factors also contribute to seasonal occupancy changes. For instance, a facility near a university typically has an even higher volume of summer rentals; that alone can account for a 20 percent surge in occupancy during the summer months, while occupancy in the winter months hovers between 70 percent and 80 percent.
- New supply in the local market – If a new facility opened in your market, or a competitor finished an addition with more units to rent, their lease-up could pull your occupancy down for as much as three years or more, depending on how much new supply is delivered. If your competition is professionally managed by a REIT with a vast digital footprint and marketing reach, the negative affect on your occupancy could be even greater.
- Population mobility – If your self-storage business is in a local market experiencing population growth, there will be more demand. If people are moving out of your local market, they are taking their demand with them, and your occupancy will decline.
- Changes in the housing market – Moving is a major driver for self-storage demand. If transaction volume is down in the housing market and fewer people are buying and selling homes, as was the case in 2023 and 2024, that aspect of self-storage demand declines. People need to rent self-storage when they are moving. If they are not moving, that type of demand goes away.
- General economic conditions – When consumers feel the pinch of higher prices, caused by inflation in 2023 and 2024, some of them change their view of storage from a “need” to a “want,” and they move out.
On a positive note, reflecting on Chart 7.1, occupancy levels in 2018 and 2024 are comparable, but there’s more storage. That means more square feet of rented space. So, demand grew as supply grew. It is encouraging that overall occupancy did not decline below 2018 rates as supply increased.
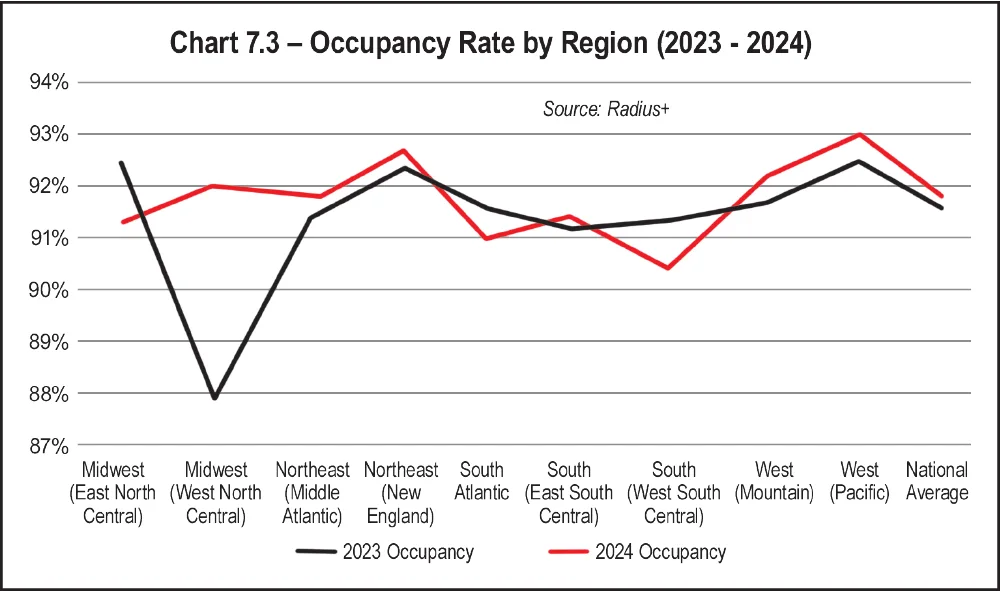
As shown in Table 7.3 and Chart 7.3, average occupancy was up in six regions and down in three regions. The six regions experiencing slight increases in occupancy included:
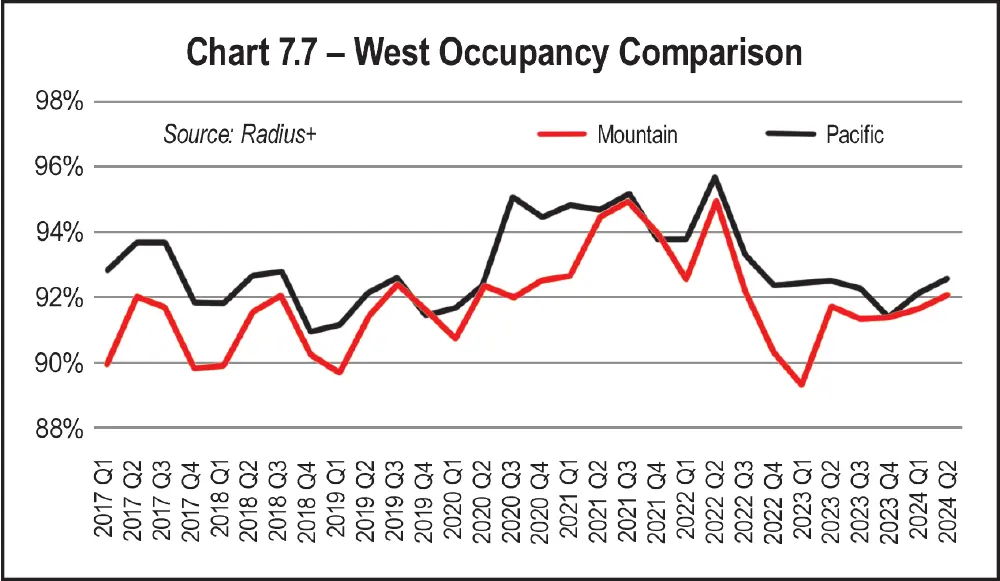
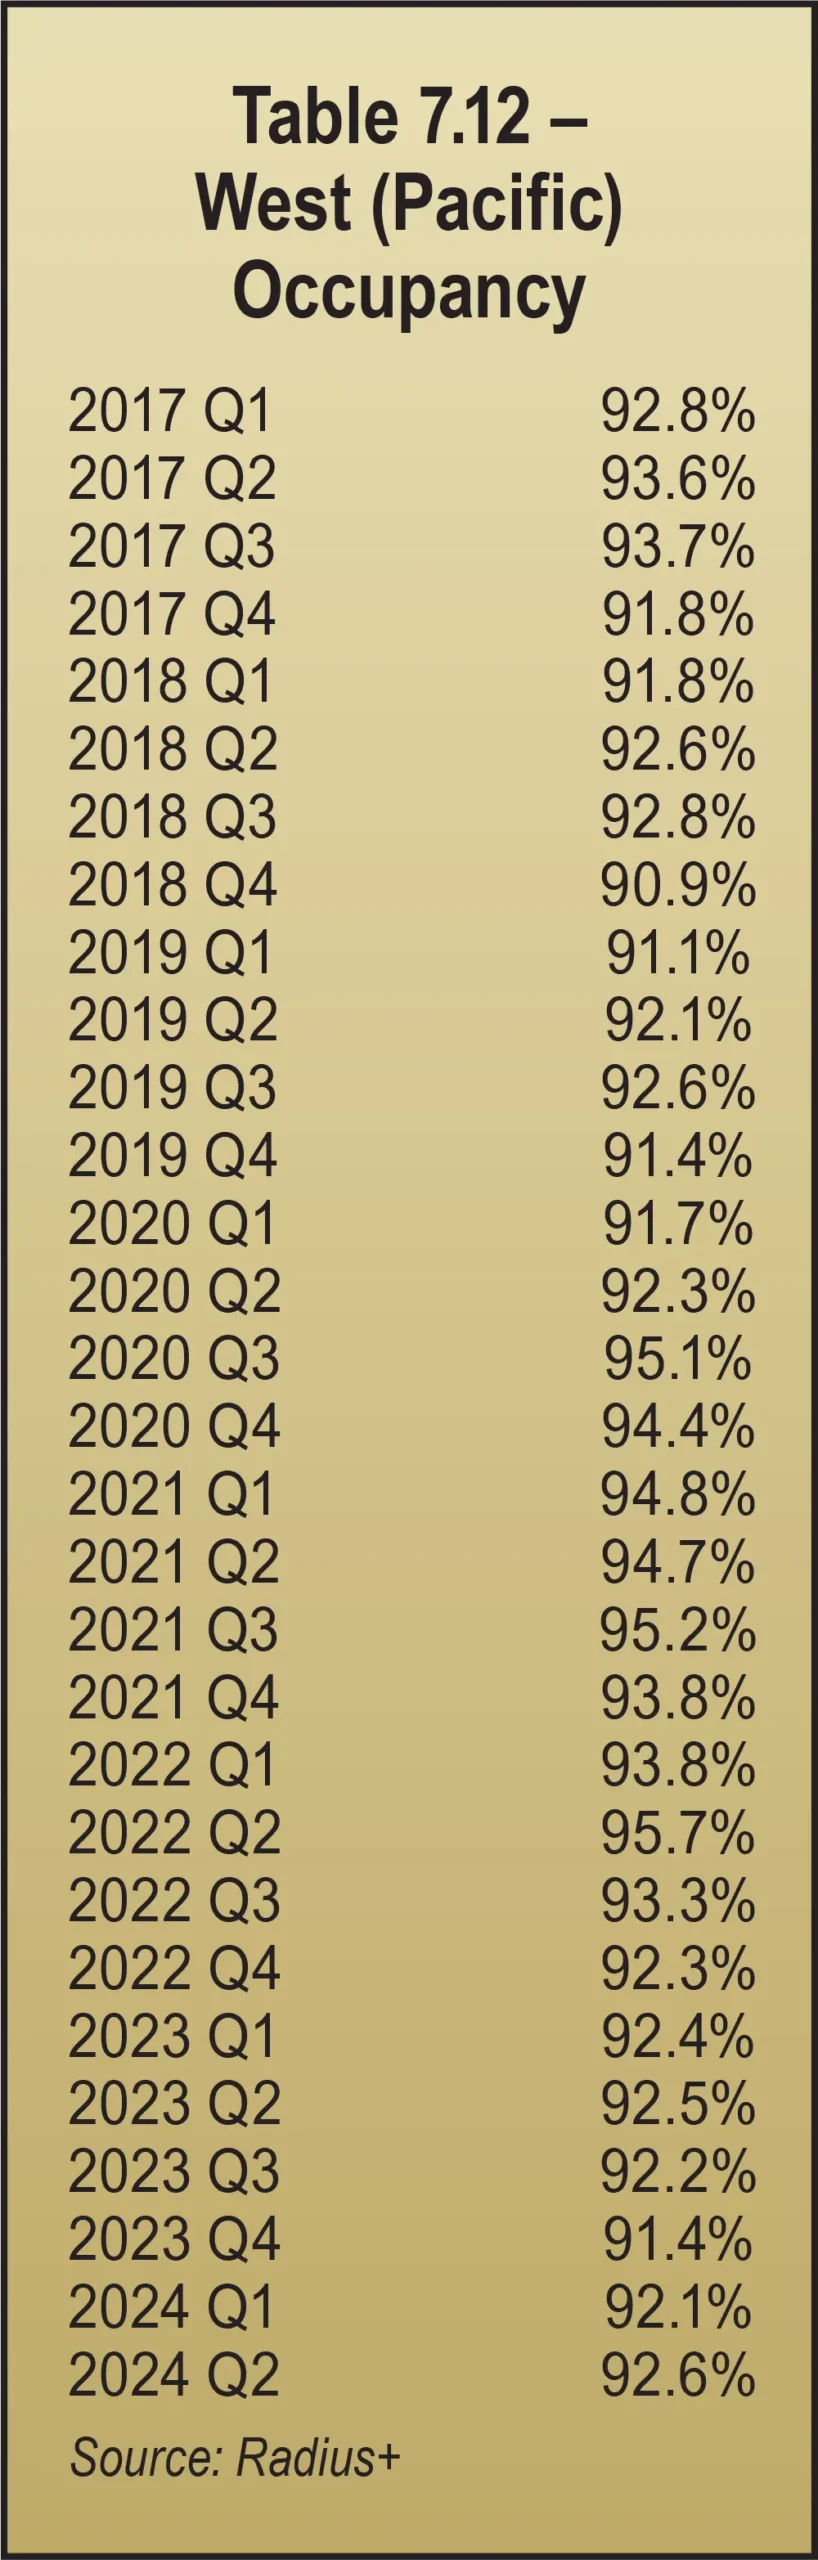
- West (Pacific) – up 0.1 percent in California, Oregon, Washington, Alaska, and Hawaii
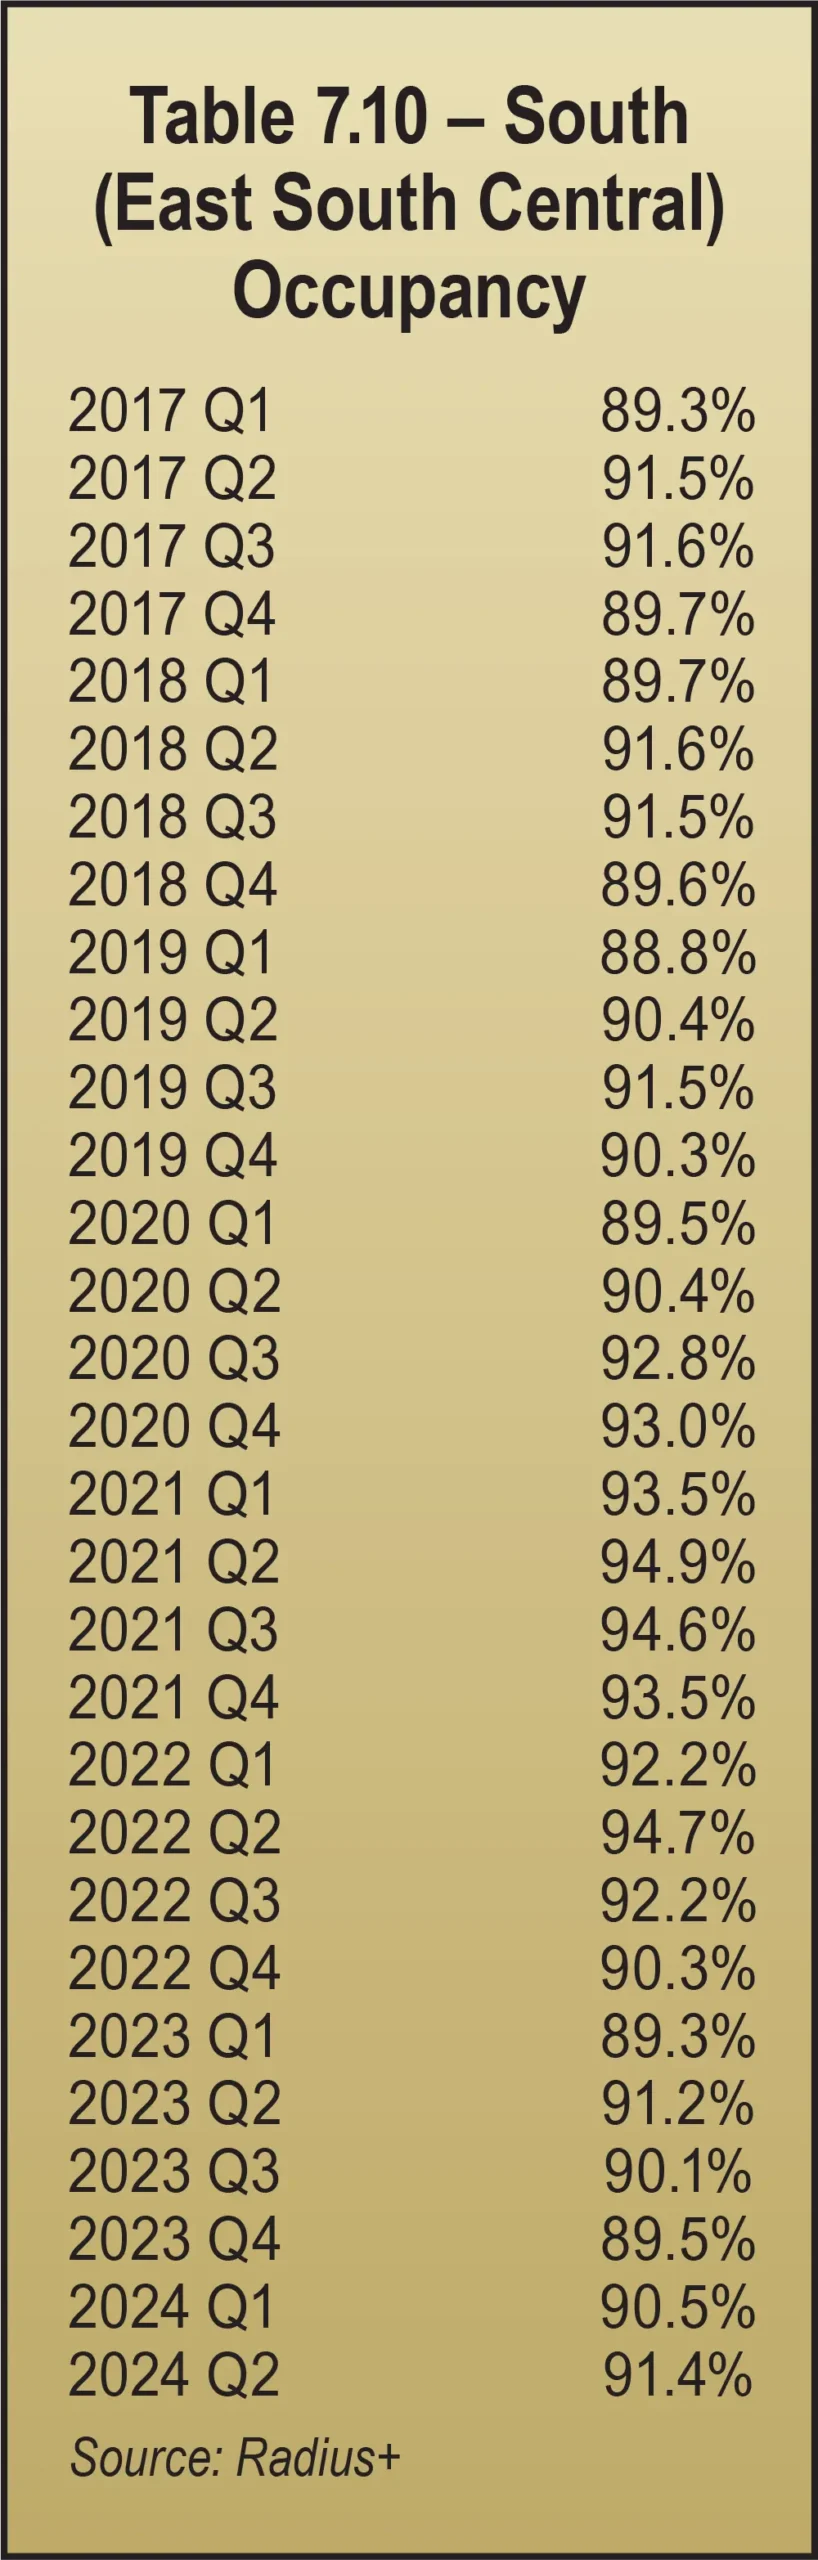
- South (East South Central) – up 0.2 percent in Alabama, Kentucky, Mississippi, and Tennessee
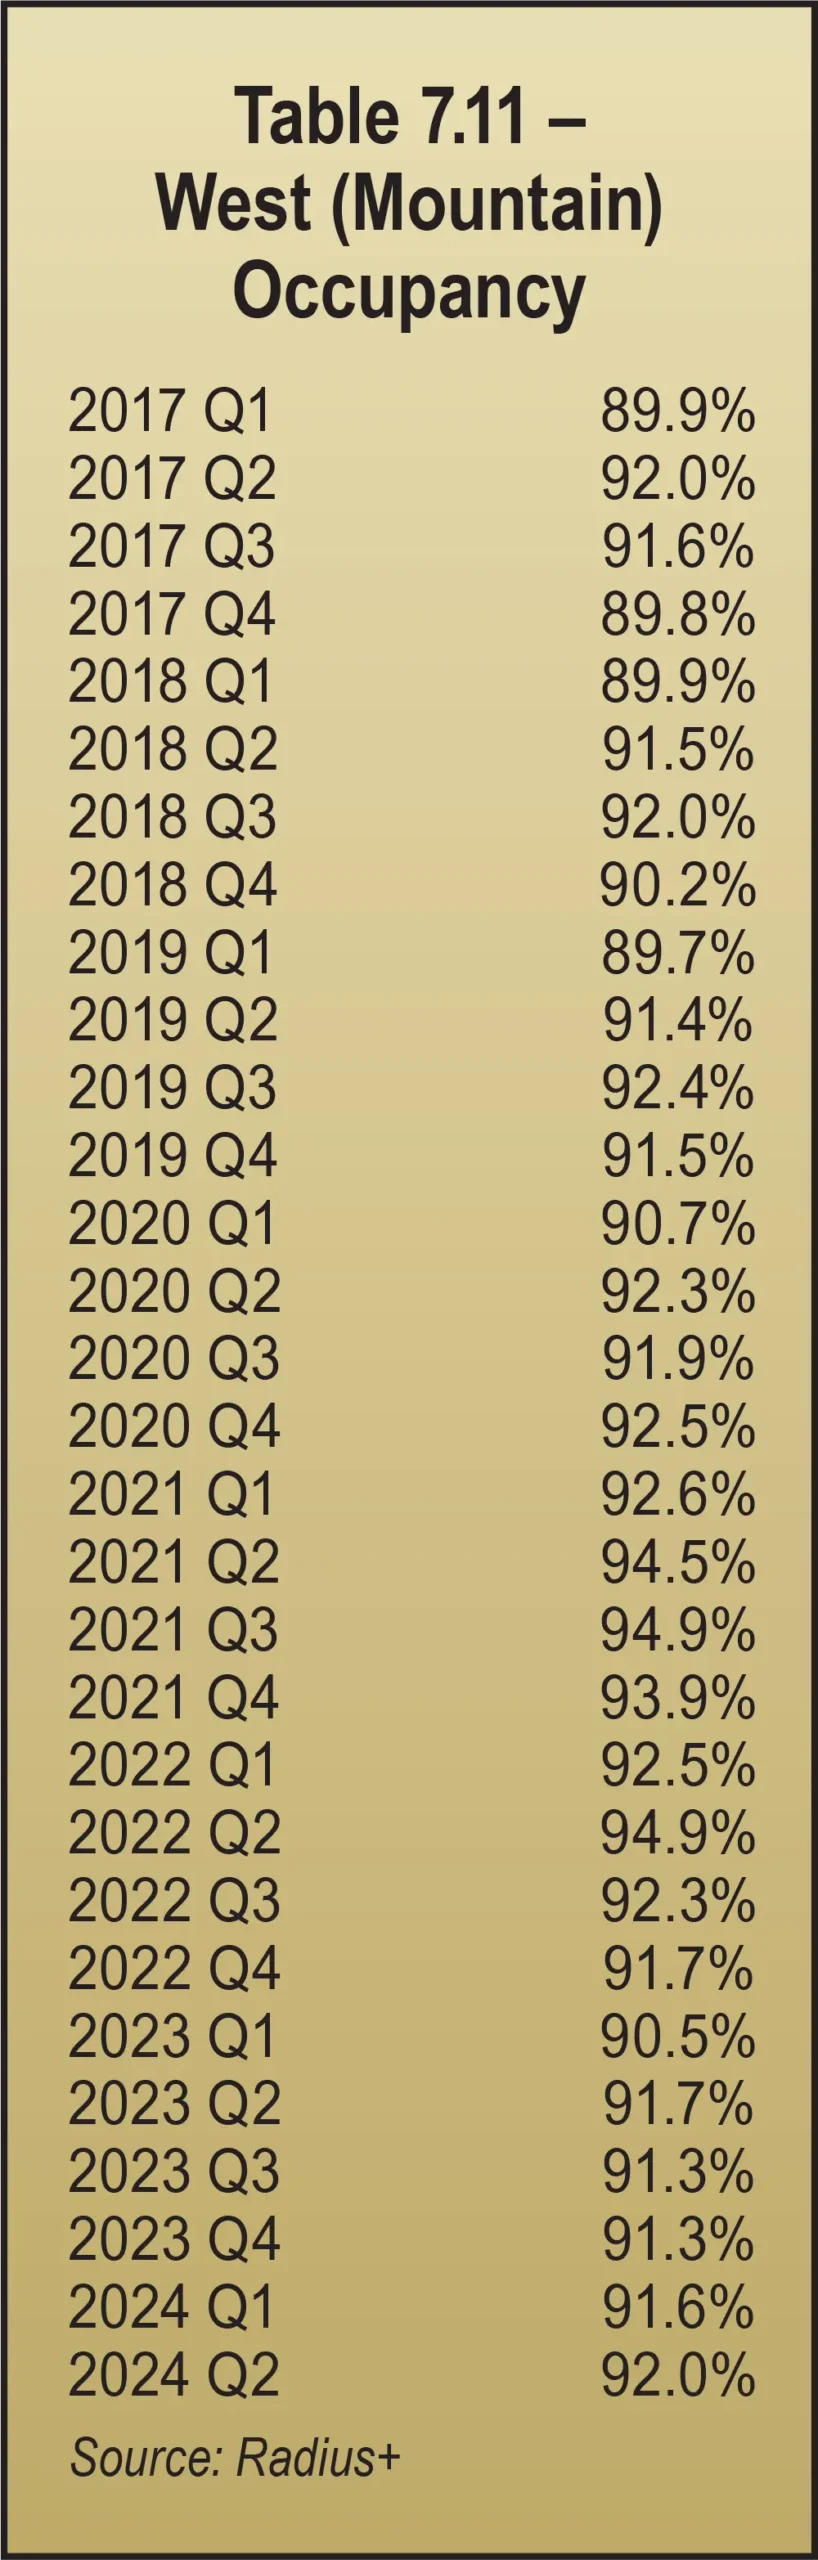
- West (Mountain) – up 0.4 percent in Arizona, Utah, New Mexico, Montana, Colorado, Idaho, Nevada, and Wyoming
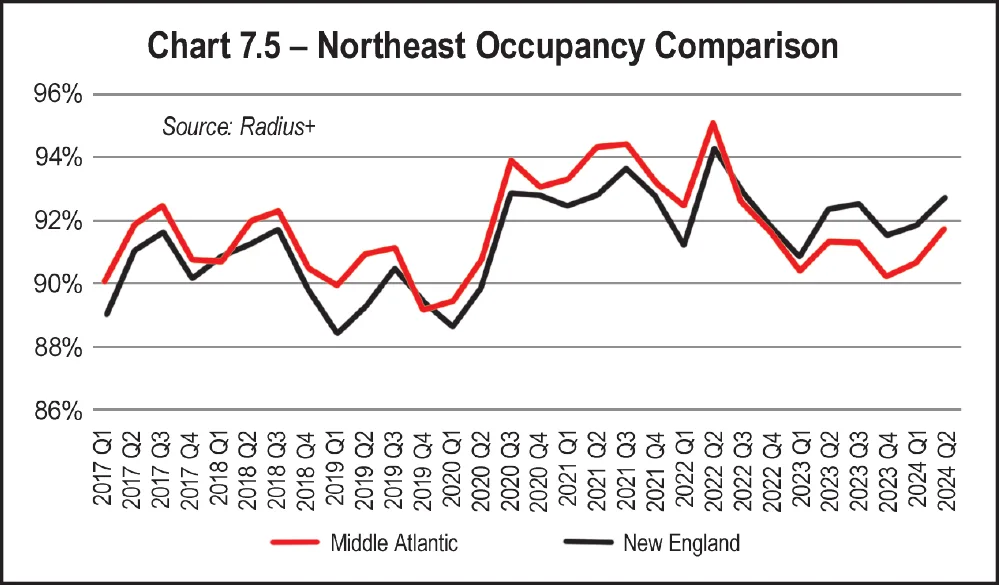
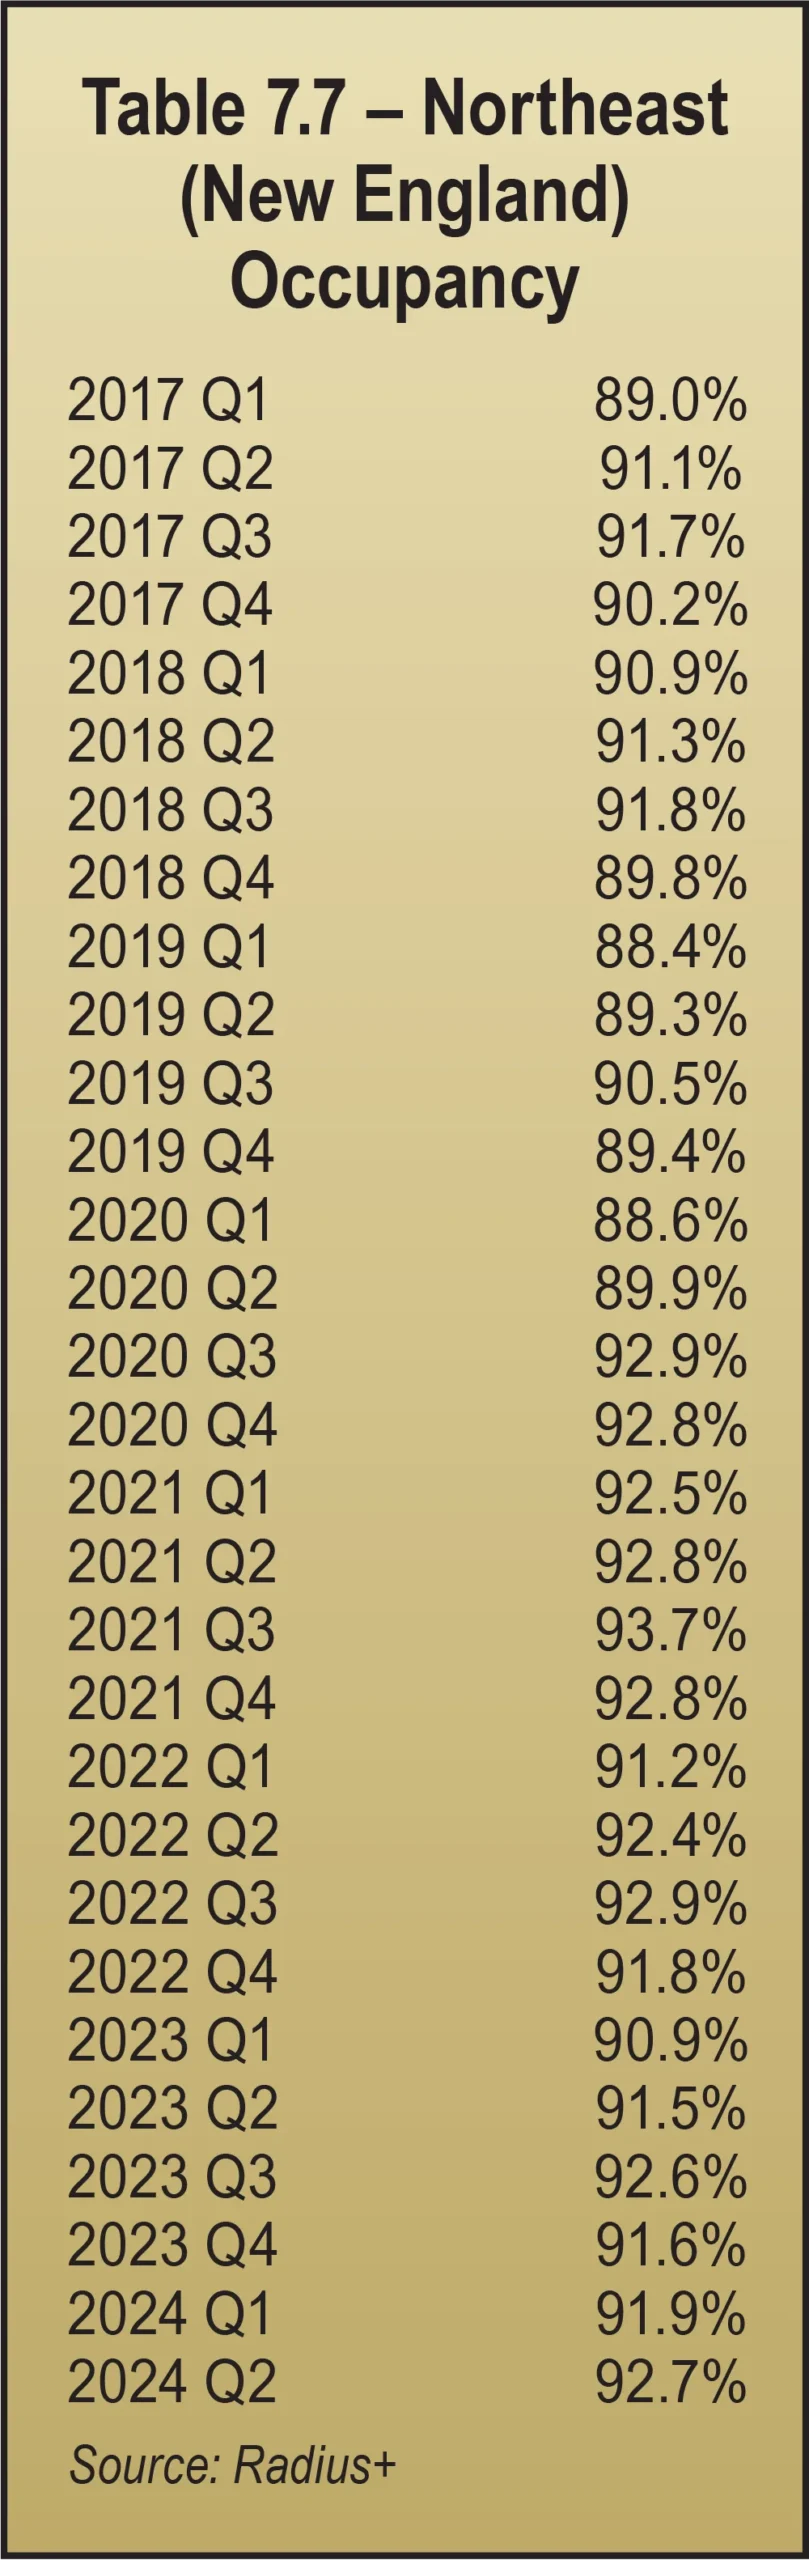
- Northeast (New England) – up 1.2 percent in Connecticut, Maine, Massachusetts, New Hampshire, Rhode Island, and Vermont
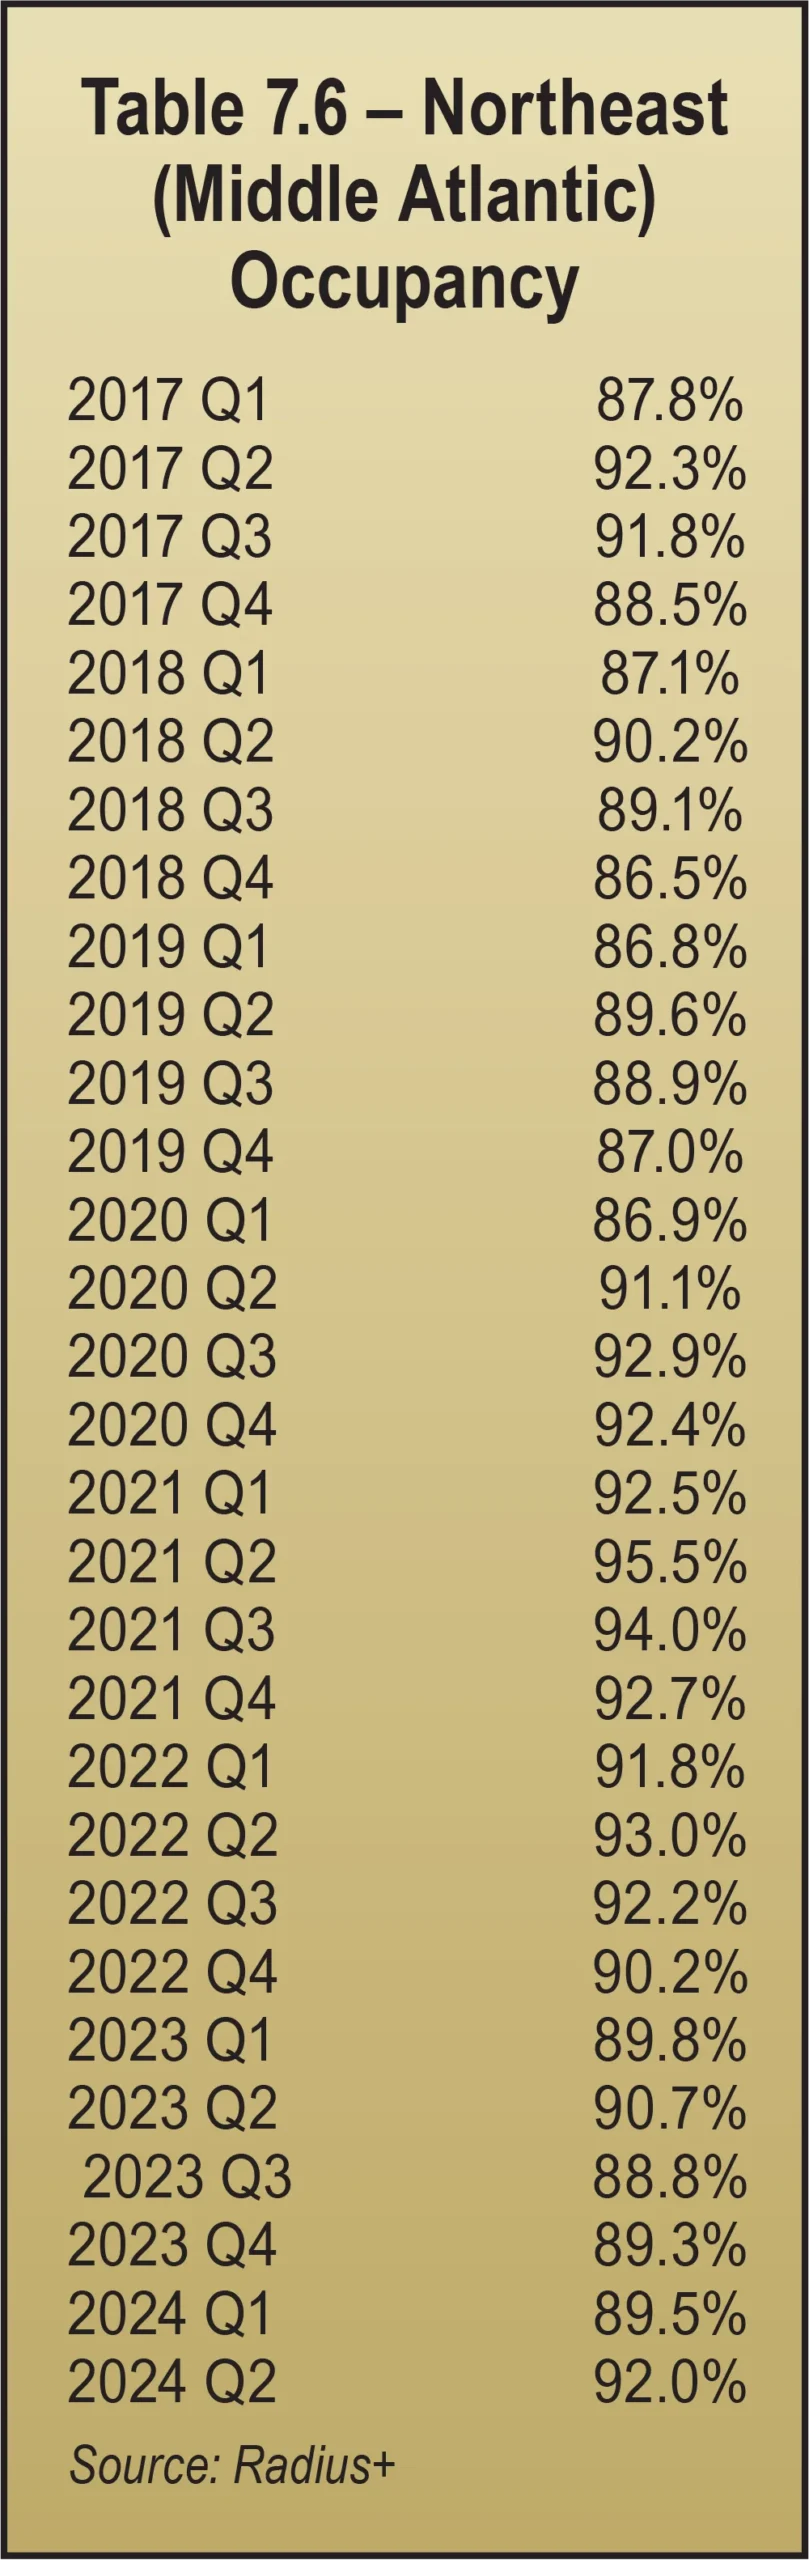
- Northeast (Middle Atlantic) – up 1.3 percent in New Jersey, New York, and Pennsylvania
- Midwest (West North Central) – up 1.3 percent in Iowa, Kansas, Minnesota, Missouri, Nebraska, North Dakota, and South Dakota (west of the Mississippi River)
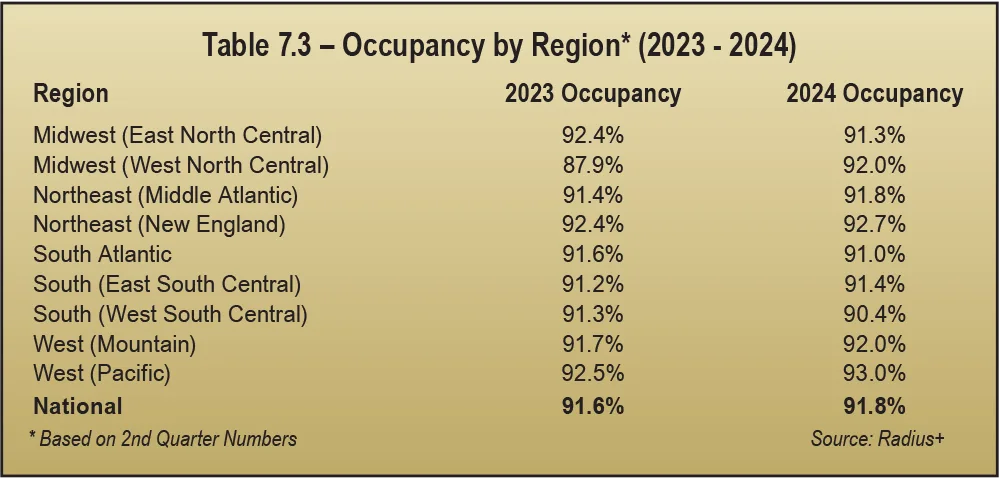
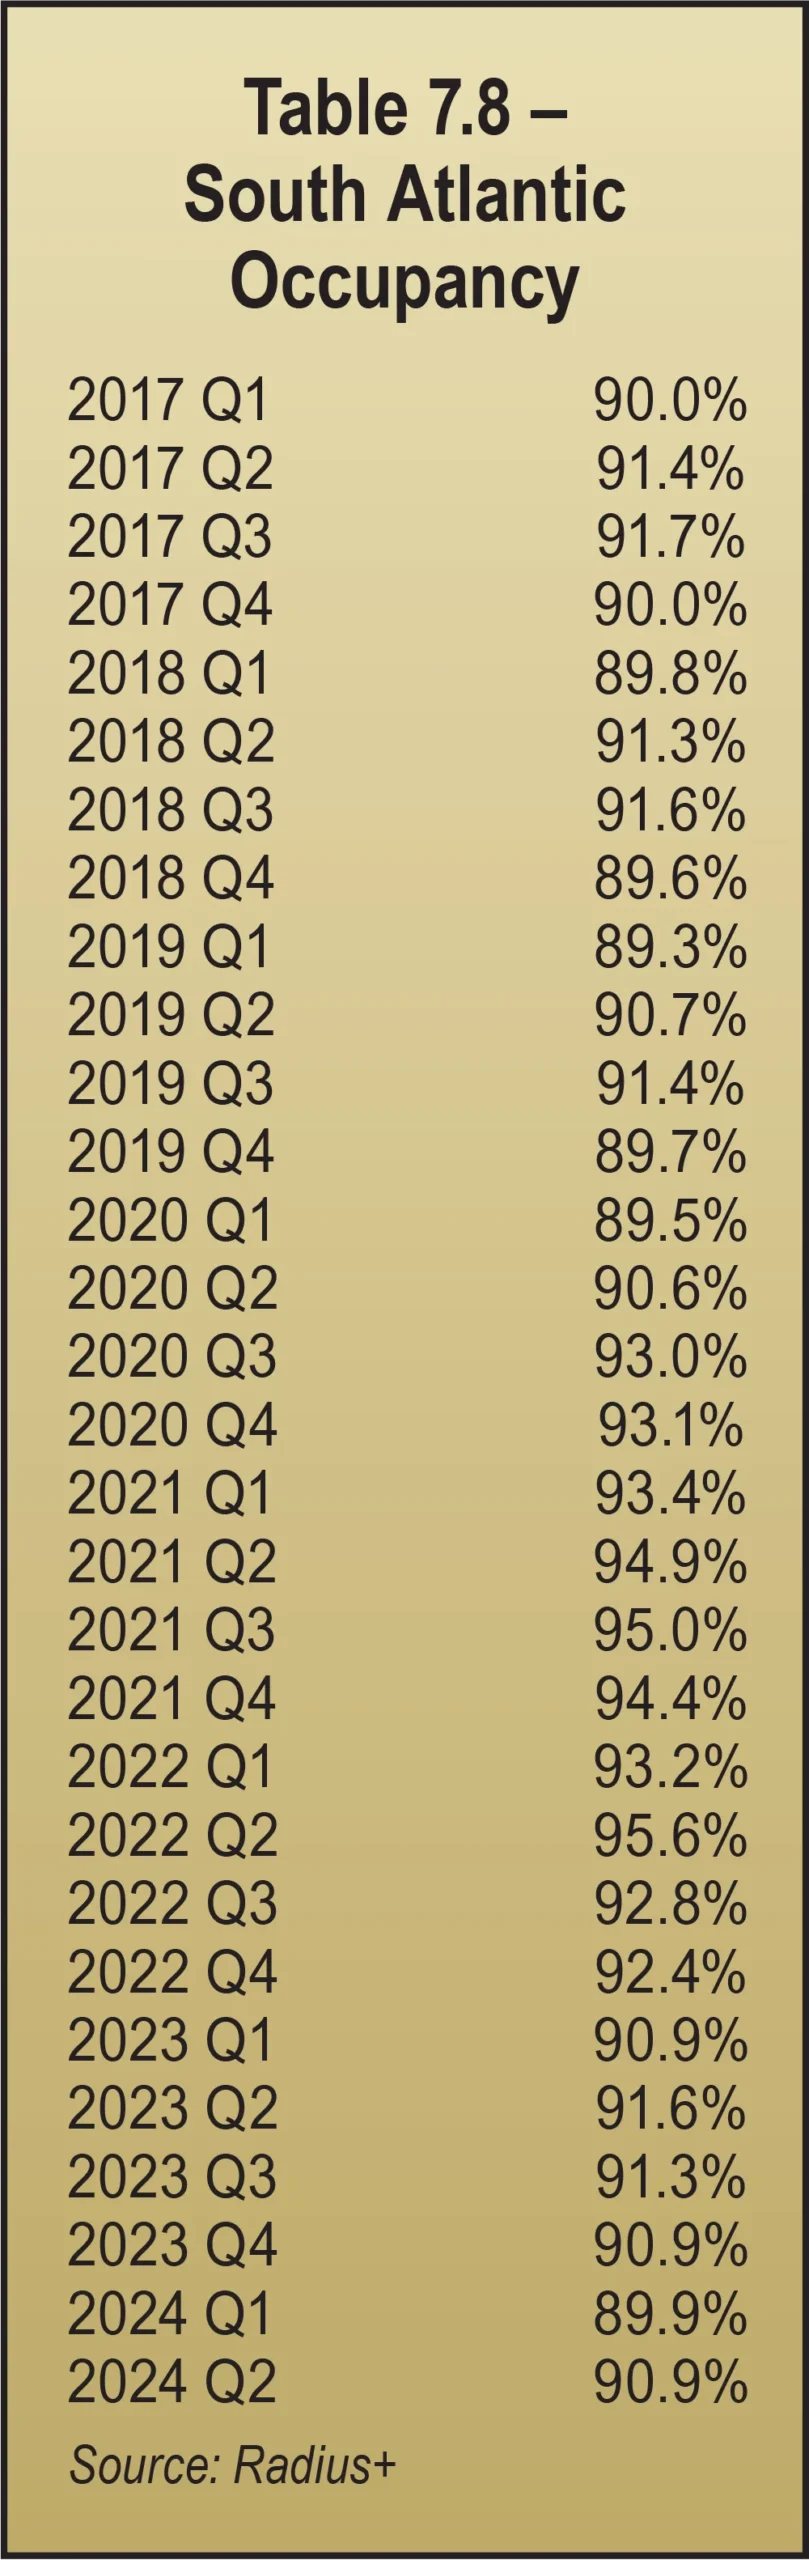
- South Atlantic – down 0.7 percent in Delaware, Florida, Georgia, Maryland, North Carolina, South Carolina, Virginia, West Virginia, and Washington D.C.
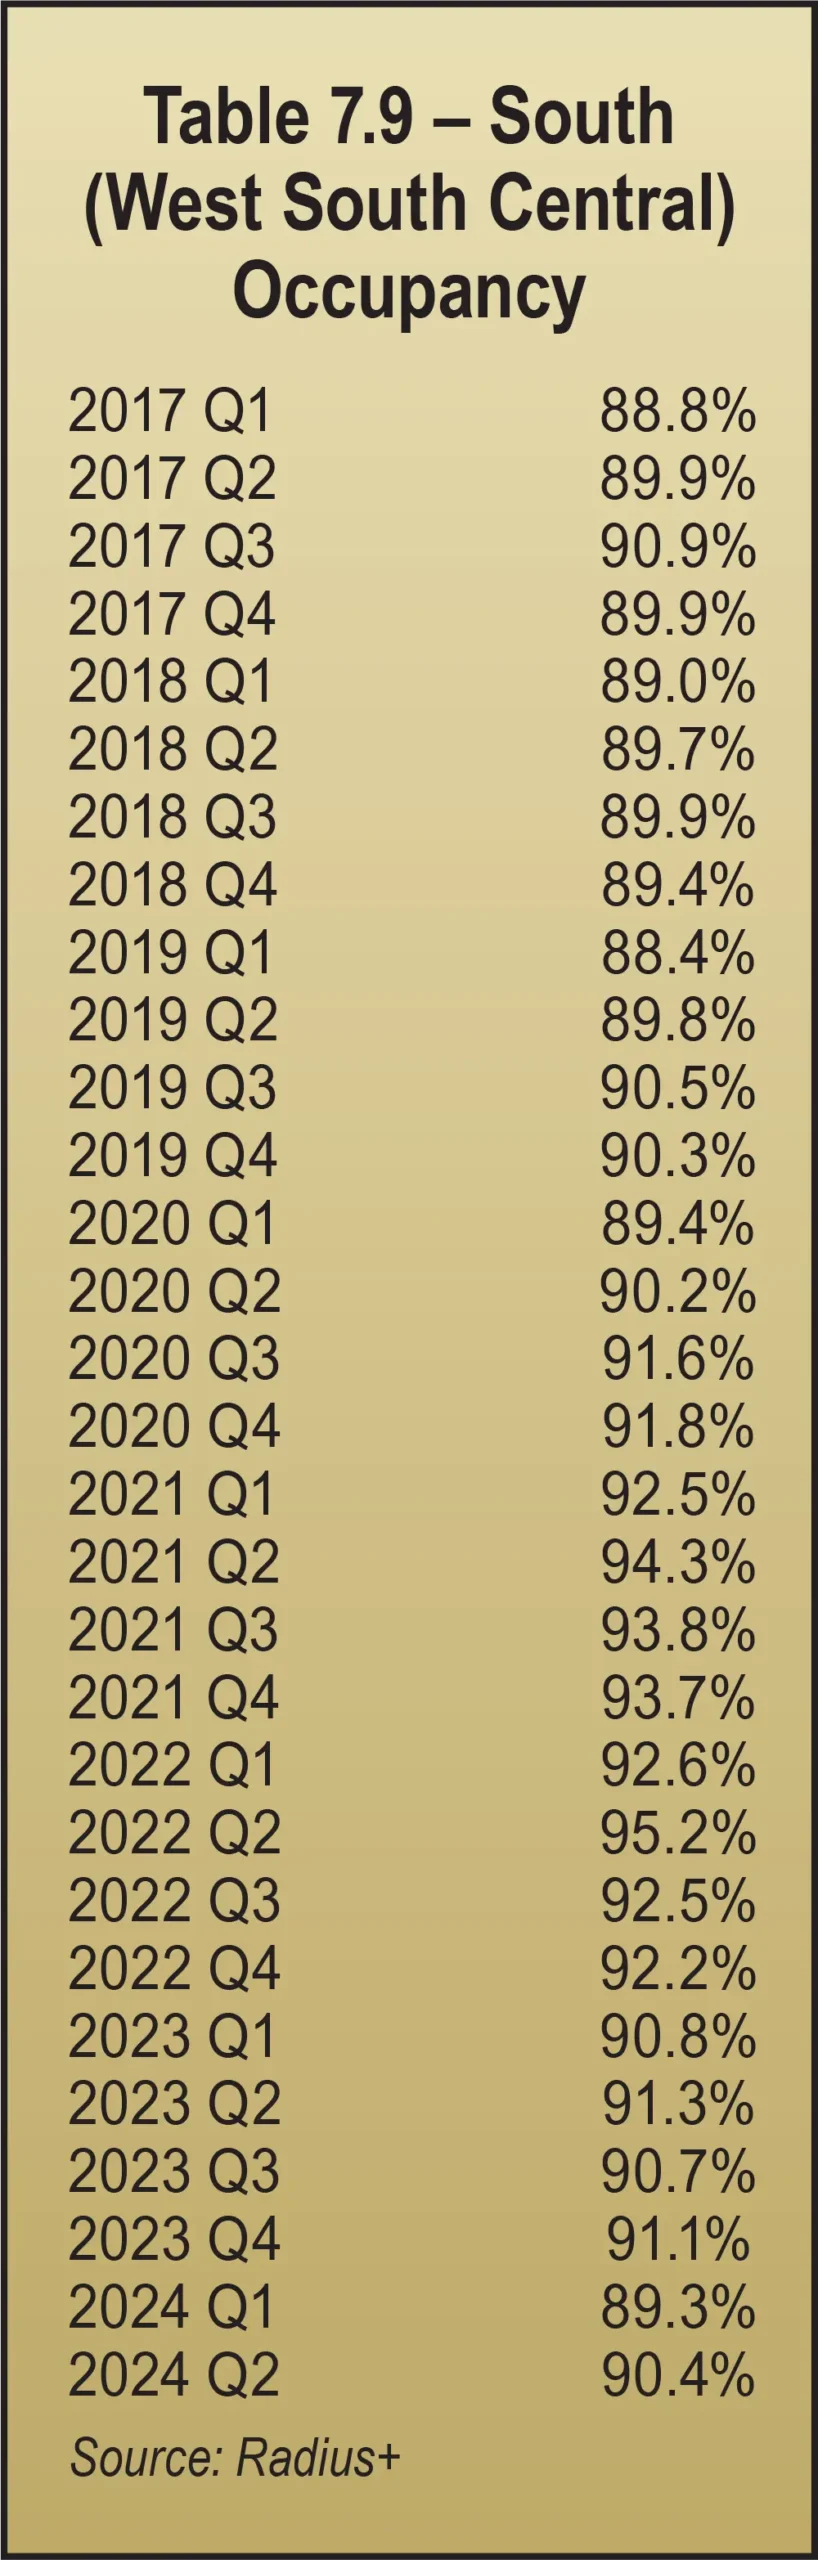
- South (West South Central) – down 0.9 percent in Arkansas, Louisiana, Oklahoma, and Texas
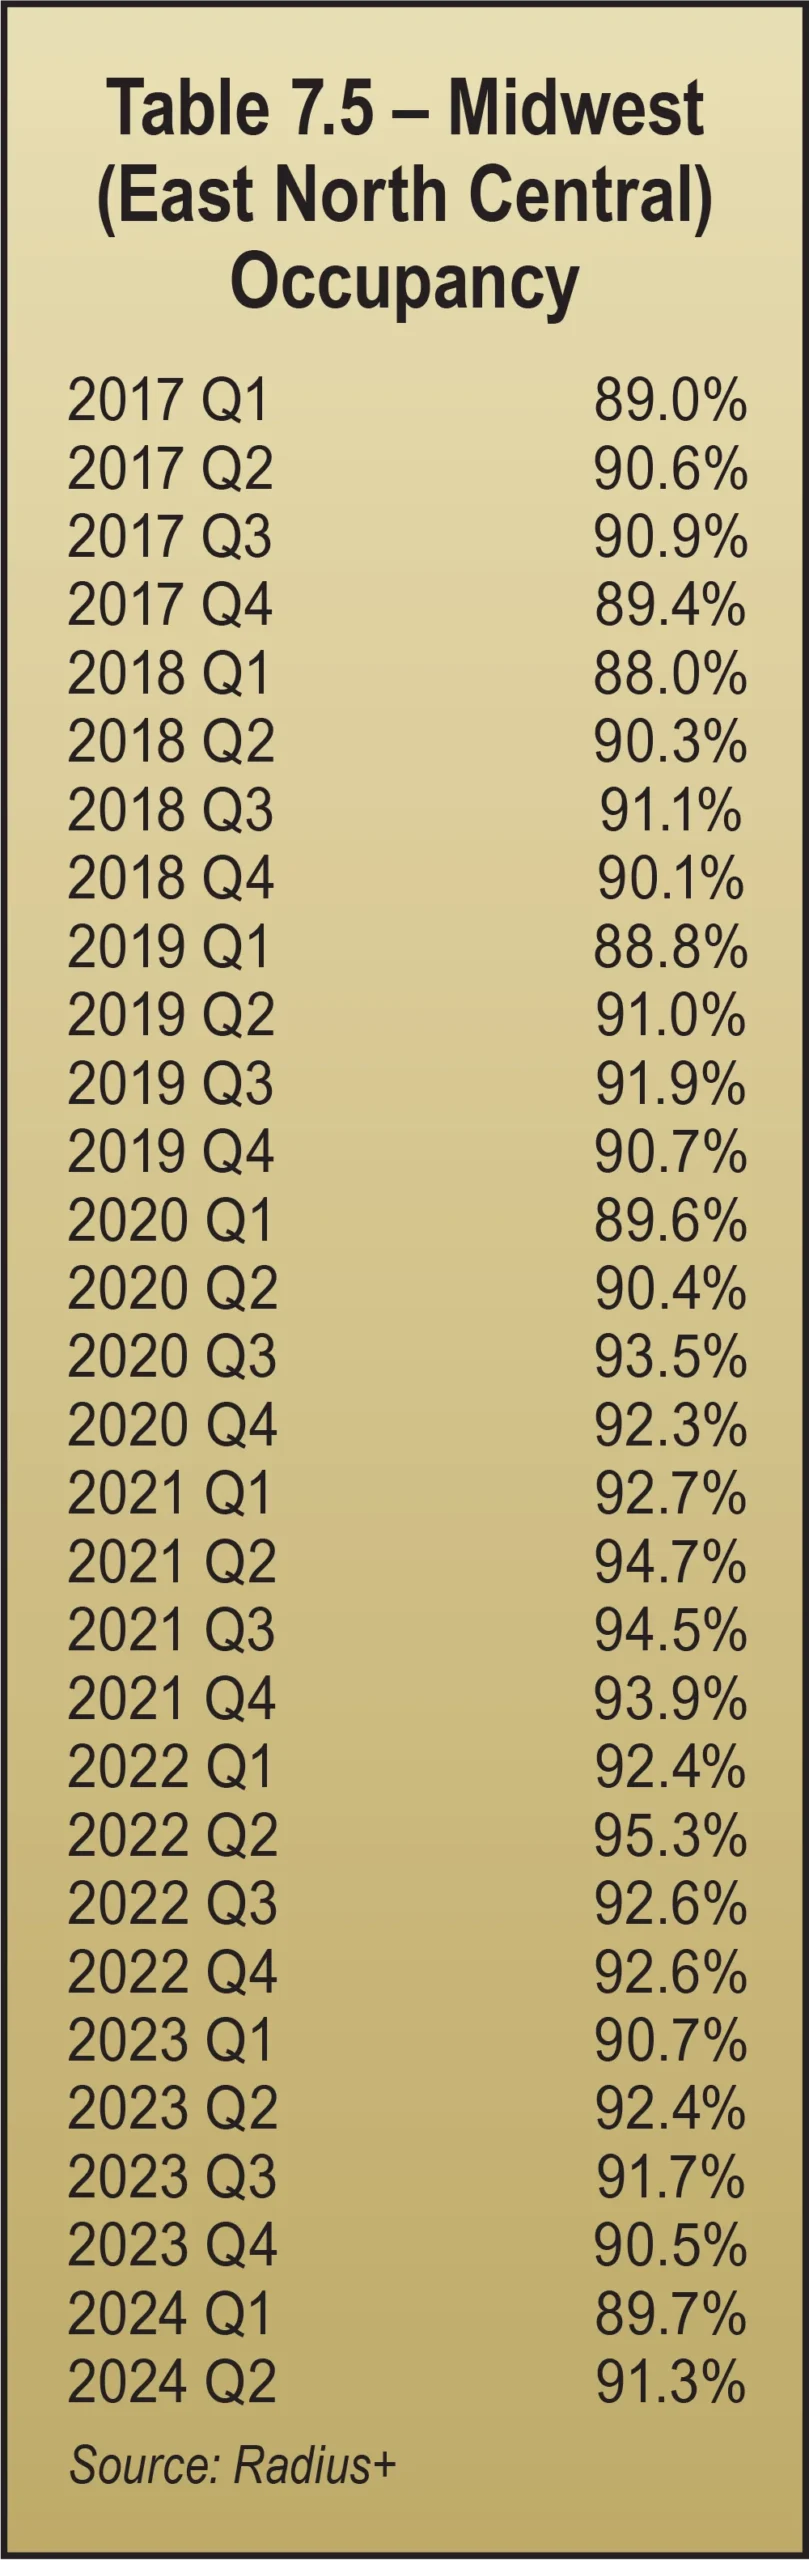
- Midwest (East North Central) – down 1.1 percent in Illinois, Indiana, Michigan, Ohio, and Wisconsin (east of the Mississippi River)
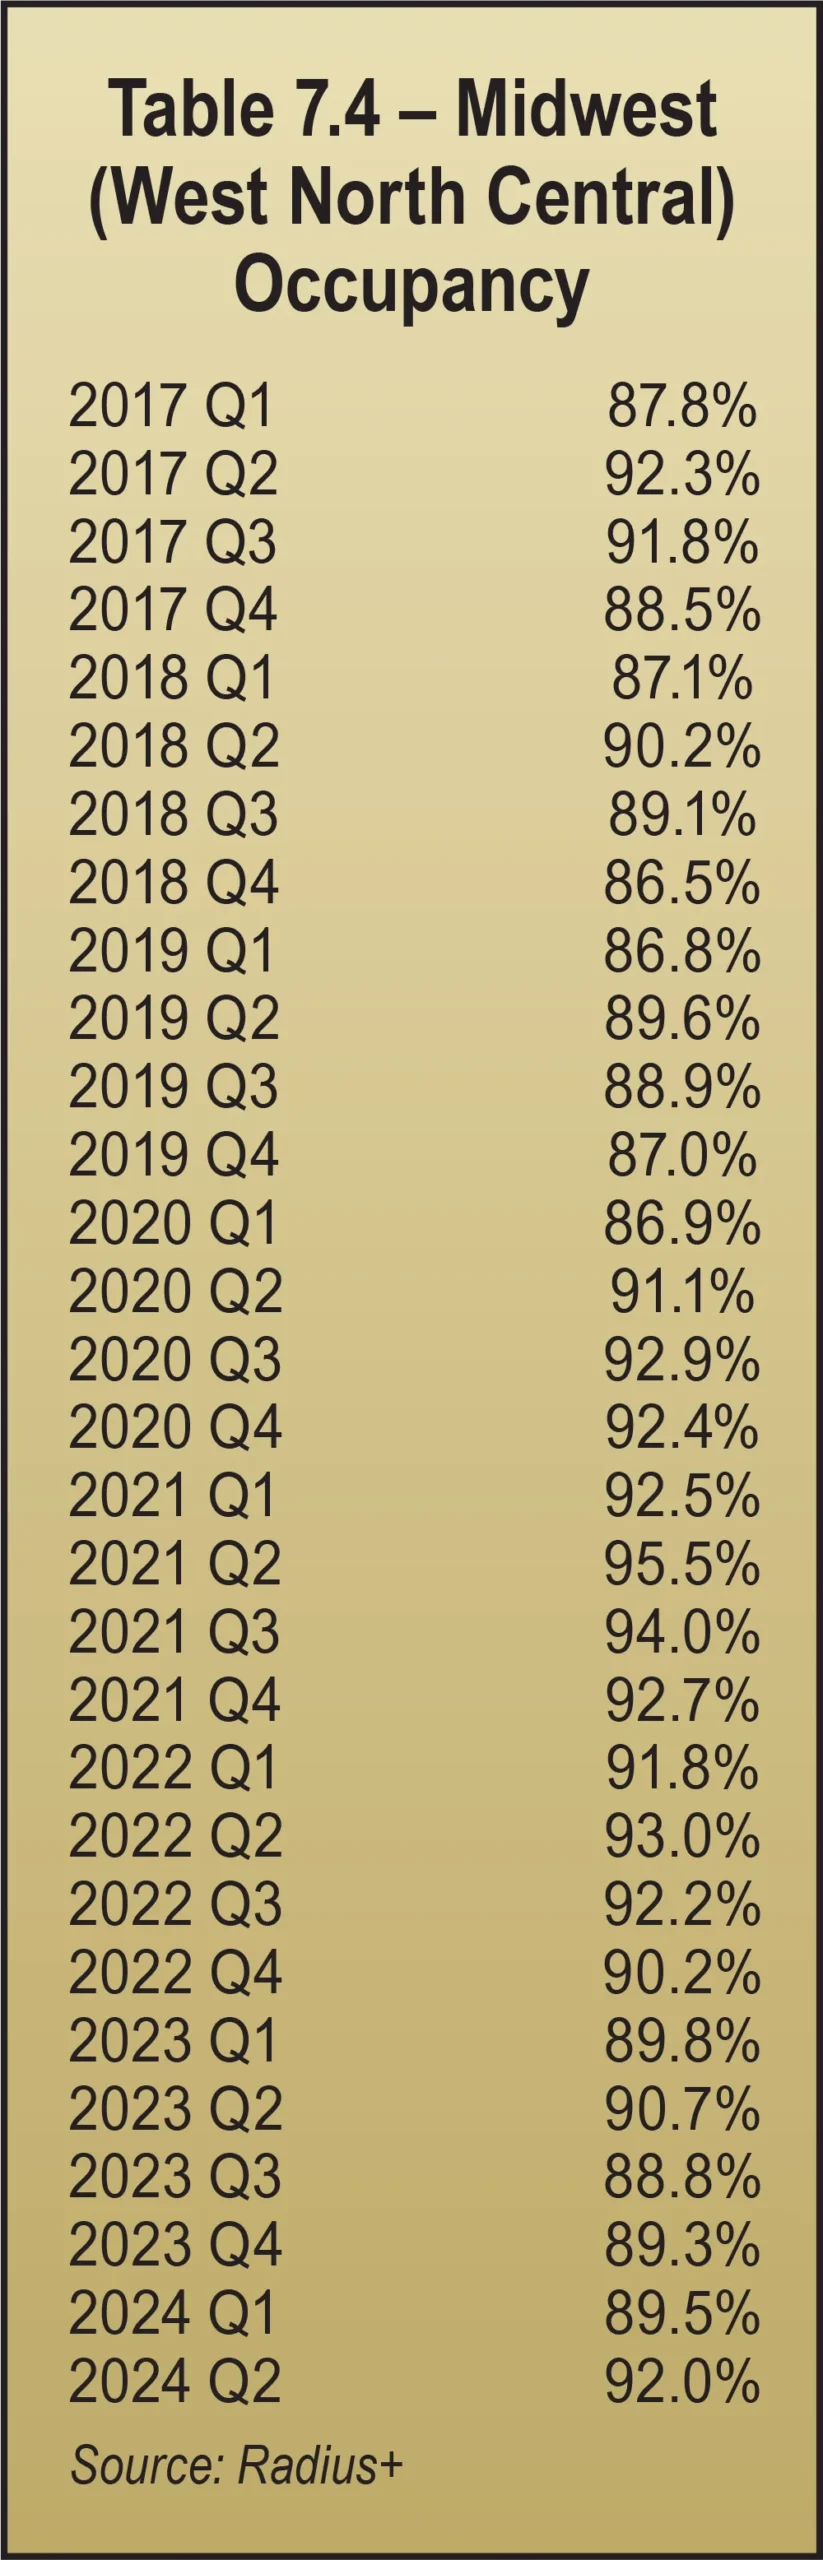
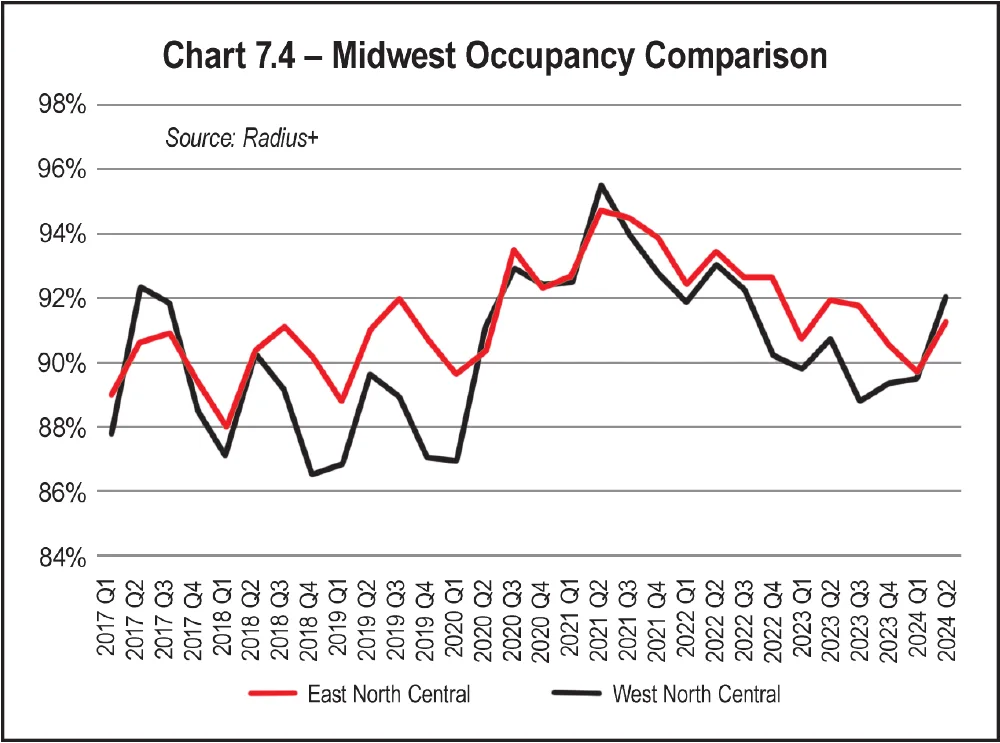
In the 30 quarters reported, the biggest variance is in the Midwest (West North Central), as demonstrated in Table 7.4 and Chart 7.4. Over the past seven years, this region experienced the greatest fluctuation in occupancy, ranging from a high of 95 percent in the second quarter of 2022 to a low of 86.5 percent in the fourth quarter of 2018, which is a 9-point variance.
Chart 7.4 compares the two Midwest regions. The two regions take turns leading in occupancy. Since the middle of 2021, occupancy in the Midwest (East North Central) region edged out occupancy in the Midwest (West North Central) region, but Midwest (West North Central) inched above Midwest (East North Central) in the middle of 2024.
The other region in that area, Northeast (New England), shows a similar gain of 1.2 percent year over year, as Table 7.7 demonstrates.
Chart 7.5 shows occupancy trends over each for these regions, showing the Middle Atlantic generally leading in occupancy.
In Q2 2024, the South Atlantic region experienced a decline of 0.7 percent in occupancy year over year, as seen in Table 7.8.
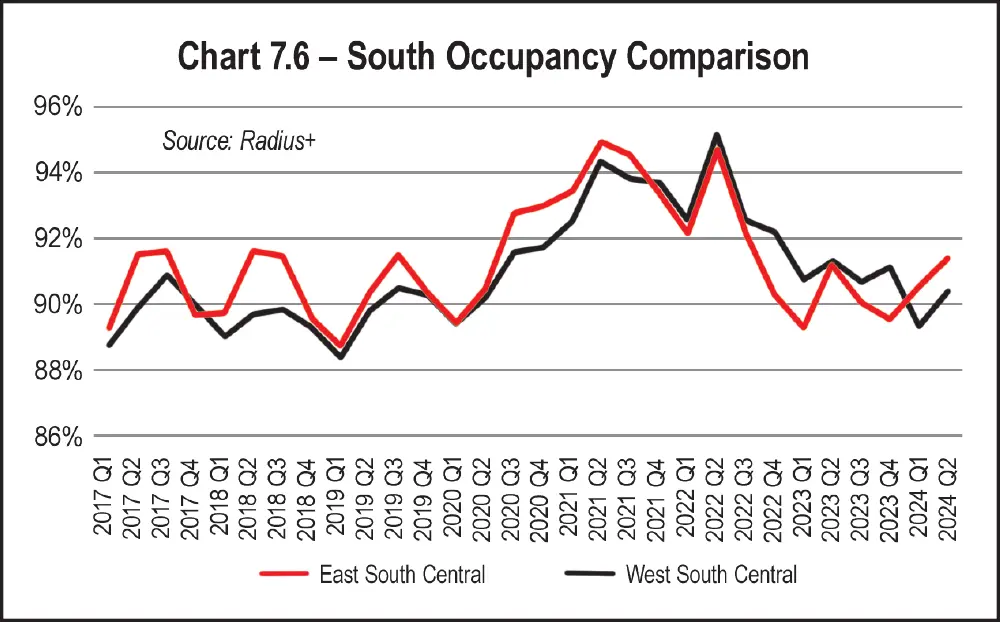
In the third southern region, the South (East South Central) region inched up 0.2 percent in occupancy (see Table 7.10).
The comparison of occupancy in South (West South Central) to South (East South Central) is shown in Chart 7.6. The South (West South Central) lags behind the South (East South Central). That is, until 2021, when the South (West South Central) caught up with the South (East South Central). Occupancy in the South (West South Central) stayed above the South (East South Central) from Q4 in 2021 until Q1 in 2024, when it dropped below the South (East South Central) once again.
On the other side of the country, in the West, occupancies in both regions are slightly up. The Mountain states saw occupancy increase 0.4 percent (Table 7.11), while the Pacific states saw a smaller gain of 0.1 percent in 2024 (Table 7.12).
In the short term, however, there is speculation that both occupancy and rates could go down from 2024 levels, especially if the housing market does not recover quickly. Moving is only one of the five Ds of demand. Even if it declines, the other Ds are still occurring (divorce, death, disease, and disaster), all of which can cause dislocation. Those are the pools to be fishing in for storage demand, leads, and conversions, using every “channel” consumers use (text, live chat, online rentals, walk-ins, two-way video, etc.). And be sure you are optimizing your chances by using a marketing firm that specializes in self-storage and can offer you high-quality search engine optimization (SEO) services. Technical SEO and fully utilizing your Google Business Profile (GBP) and other Google options is more important than ever.
With the presidential election behind us and interest rates on the decline, improvement in the housing market and taming inflation both seem more likely than they did in 2024. Even though housing prices are still at all-time highs, there is certainly pent-up demand to move, and more affordable mortgage rates will tap into that demand. All of this suggests that the worst is behind us and 2023 will stand alone as the year with the worst rate drops and lowest occupancy rates.
As always, we intend to provide the best data available to the self-storage industry. Over the next year, we will continue to monitor changes in data provided by various industry sources to continually present the most accurate data available.