he state of our economy and its projected path provides the groundwork from which businesses and investors make decisions. The cost of capital, building costs, supply chain conditions, and the employment situation inform these decisions. Consumers, too, make financial decisions based on indicators such as the trajectories of interest rates, inflation, and housing costs. Indeed, the economy was the No. 1 issue for voters in the 2024 presidential election.
The pandemic and post-pandemic years created a new economy beleaguered with unexpected disruptions and an uncertain path forward. Yet, in a year of instabilities such as strikes, hurricanes, a dismal October job report, and a heated presidential election, the resilience of the U.S. economy remained a marvel in 2024. The economy grew 2.7 percent in the third quarter when compared with the same quarter in 2023.
The encouraging economic news for 2024, however, was equally mingled with unfavorable aspects. Growth in business investment slowed as the cost of capital remained high. Mortgage rates also remained elevated, keeping many would-be homebuyers out of the market. The jobs market lost its post-pandemic momentum, and the costs of just about everything consumers and businesses purchase remained inflated.
The most significant takeaway is that 2024 didn’t bring the recession many had forewarned of in 2023. While several storms threatened to capsize the ship, the U.S. economy proved to be seaworthy.
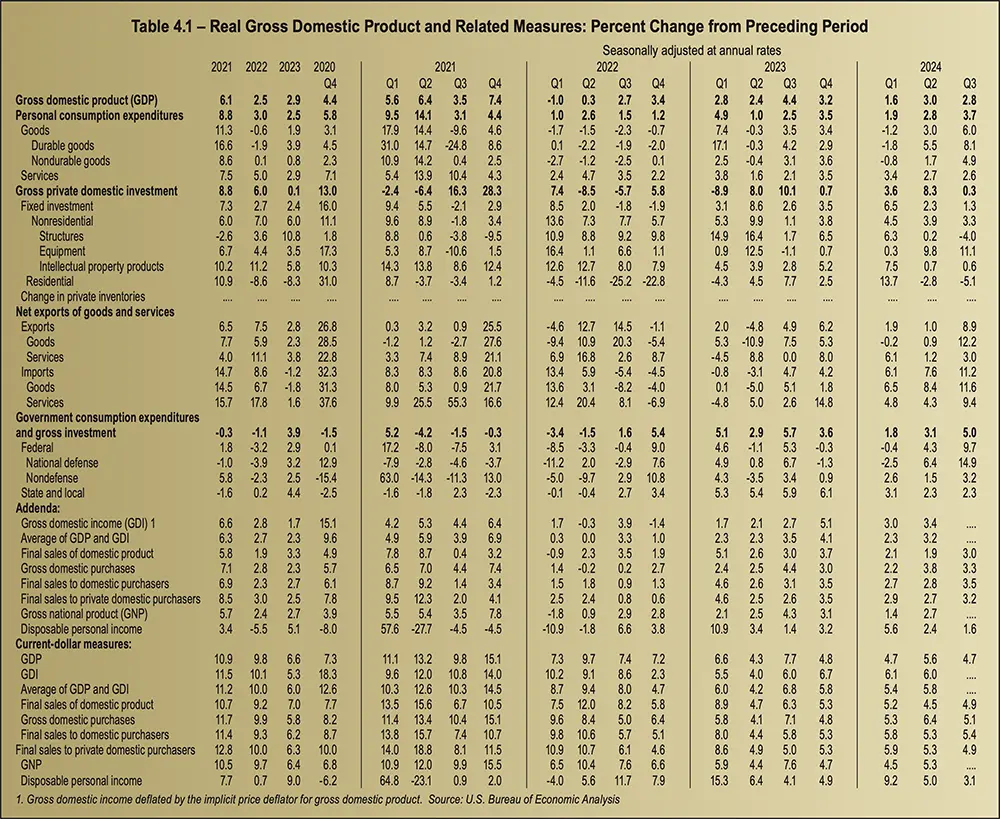
After a disappointing 1.6 percent growth in the first quarter, the increase in real GDP in the third quarter was mostly a result of increases in consumer spending. Real gross domestic product (GDP) increased at an annual rate of 2.8 percent in the third quarter of 2024, following a second-quarter increase of 3.0 percent. See Table 4.1, Real GDP, on page 38.
Hurricanes Helene and Milton caused widespread damage in the Southeastern U.S. in late September and early October, which suggested a slow start to real GDP growth as the third quarter began. Hurricanes and tropical cyclones have cost the U.S. economy roughly $2.6 trillion in lost output since 1980—roughly $60 billion per year on average. A considerable hit to the economy, that amount represents a cut of 0.3 percentage points from year-over-year real GDP growth.
Although these natural disasters cause substantial disruptions to supply chains, services delivery, the output of goods, and labor market activity, rebuilding efforts can reverse some of the detrimental effects on GDP. Construction spending is a large contributor to the overall economy. Total construction spending surpassed $2 trillion in 2024, a 5-percent increase over 2023.
Although rebuilding will help mitigate the economic effects of these disasters, insurance losses from Hurricane Helene may have exceeded $48 billion, and Hurricane Milton and the tornadoes it brought may have caused losses between $50 billion and $100 billion.
Although consumers were still spending in 2024, a decrease in activity is likely in 2025. Real income growth has not kept up with real spending growth since mid-2023. Household savings were at a two-year low in the third quarter, the delinquency rates for credit cards and auto loans were reaching worrisome levels, and the labor market showed evidence of slowing down.
Business investment growth remained unbalanced in 2024 as the cost of capital stayed high and businesses were concerned with the prospect of declining consumer demand and instability in the geopolitical scene. Investment rose in the first quarter as businesses invested in intellectual property such as digital transformation and AI. They also spent on hiring talent. However, investment was low in capital equipment and structures, with the exception of factories.
In the third quarter, equipment spending increased by 11.1 percent quarter over quarter and nonresidential investment continued to rise, with firms purchasing tech, industrial, and transportation equipment. Investment in structures declined by 4.0 percent quarter over quarter. The collapse of commercial real estate prices, primarily driven by a problematic office space market, contributed to this decline.
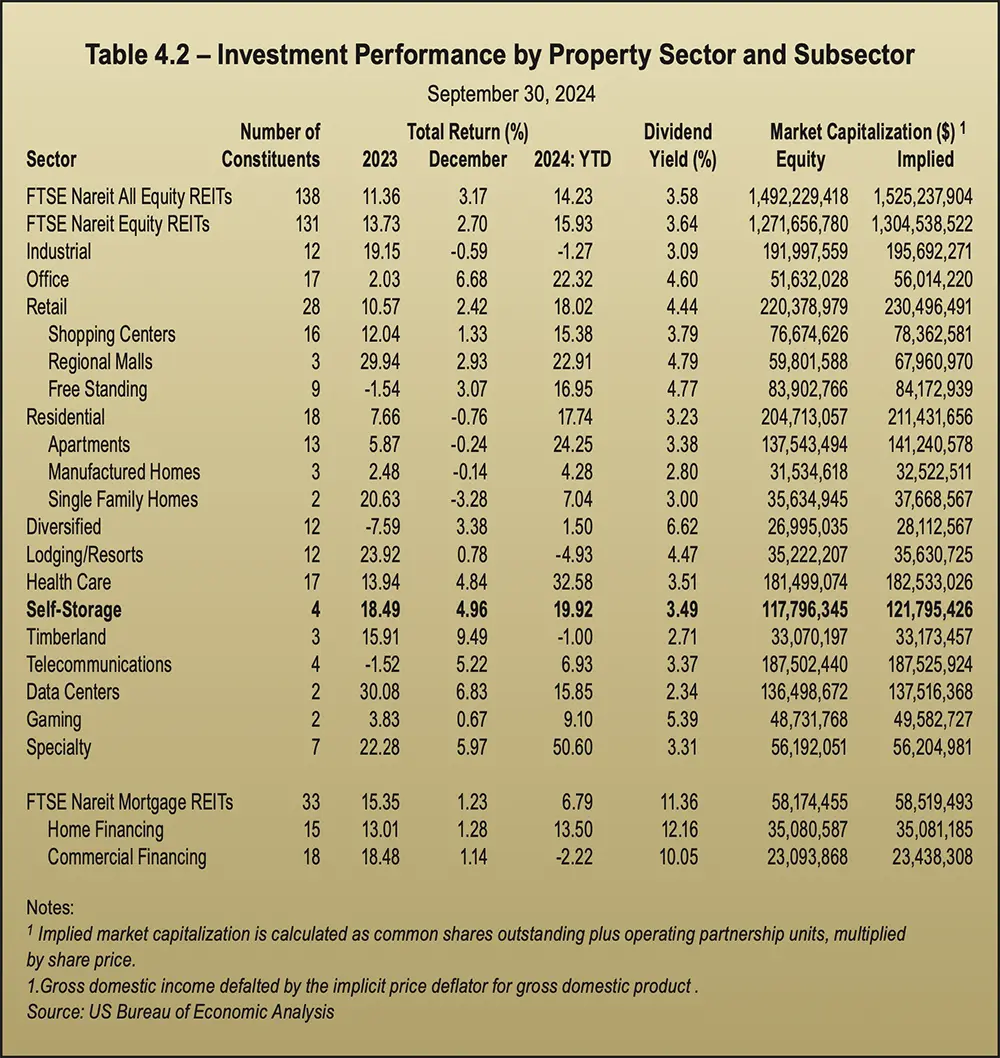
An easing of interest rates helped REIT total returns reach 16.8 percent in the third quarter. The lower rates helped push the FTSE Nareit All Equity REITs Index up 3.2 percent in October, as REITs continued on a positive track that had seen the index up 39.1 percent since October 2023. See Table 4.2, Investment Performance by Property Sector.
The self-storage REIT sector was solid in the third quarter, boasting a 13.3 percent return in August 2024 that made it the best performing of the 13 public equity REIT property sectors for the month. In September, the sector posted a 5.0 percent return. Then, as the fourth quarter began in October, self-storage posted a loss of 9.7 percent.
As demand spiked to a new high during the COVID pandemic, it provided the impetus for a record 40-percent increase in move-in rents from June 2020 to March 2022, as vacancies fell below 3 percent. Post-COVID, steep home prices and rising mortgage rates sharply reduced housing activity, leading to reduced self-storage demand. By the beginning of 2024, self-storage vacancies were above 8 percent, with move-in rents down 15 percent. The new self-storage market conditions, though disappointing, were in line with a healthy self-storage market as vacancies of around 8 percent on average are consistent with the industry target. Current move-in rates are also well above the pre-pandemic average.
By October, however, self-storage REITs were seeing lower move-in rates and higher vacancies. They reported an average same-store revenue decrease of 1.48 percent compared to the same quarter in 2023, when average growth was 2.0 percent, and a significant decrease over 2022’s growth of 13.6 percent in the same quarter.
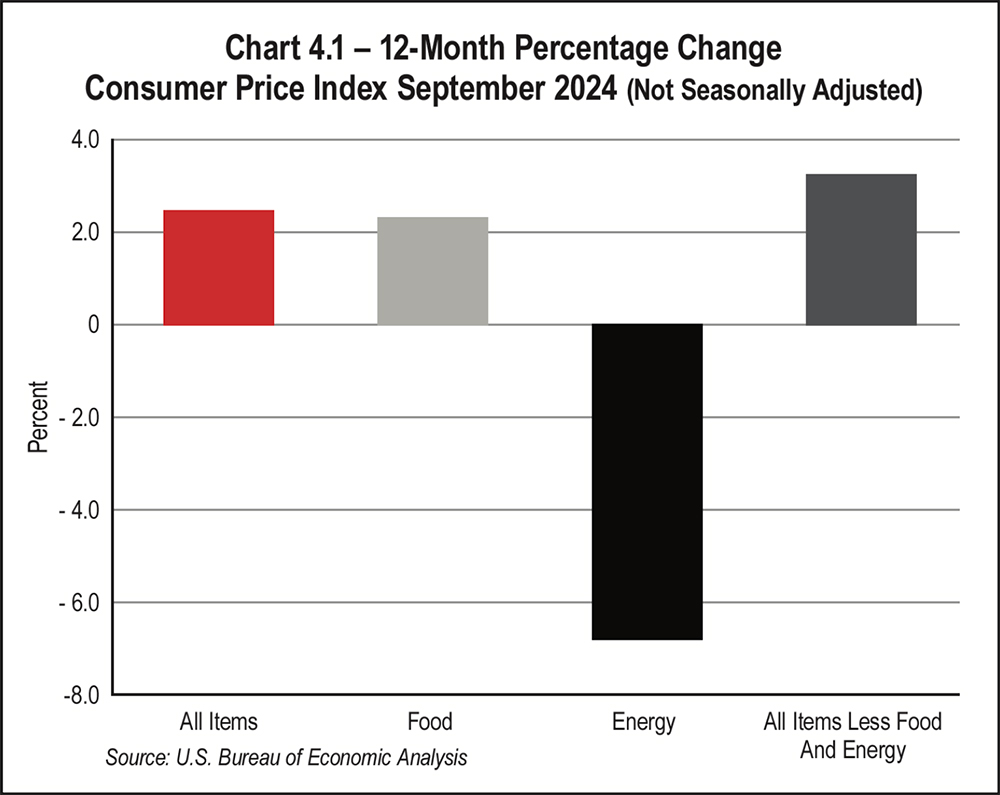
Consumer inflation, which peaked at 9.1 percent in 2022, has since fallen steadily though overall prices are still about 20 percent higher than they were in 2020. Consumer prices increased overall in October as higher food and housing costs offset lower prices for gasoline.
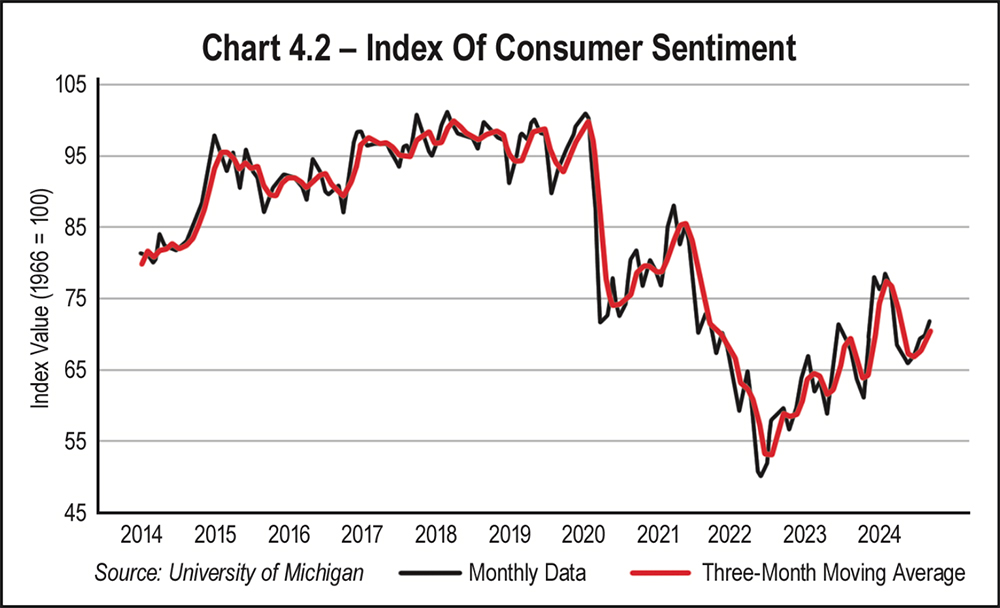
The University of Michigan consumer sentiment index for the U.S. declined five-month high of 70.1 in September. In 2024 overall, consumer sentiment fell far short of pre-pandemic numbers, which remained around 100. While consumers continued to spend, their outlook on the economy remained skeptical due to high prices and unfavorable interest rates. Although consumers’ expectations of income growth rose in October, most consumers expected inflation to exceed income gains in 2025. See Chart 4.2 on the opposite page, Index of Consumer Sentiment.
The growth in real consumer spending continued to outpace real disposable personal income growth, signifying that many households continued to finance their purchases with debt. Auto loan and credit card delinquencies are above pre-pandemic levels. Payments on debt at high interest rates combined with higher prices for goods and services may cause most consumers to rein in spending in 2025. Although higher income families will likely continue to spend, judicious spending by most consumers should help drive disinflation.
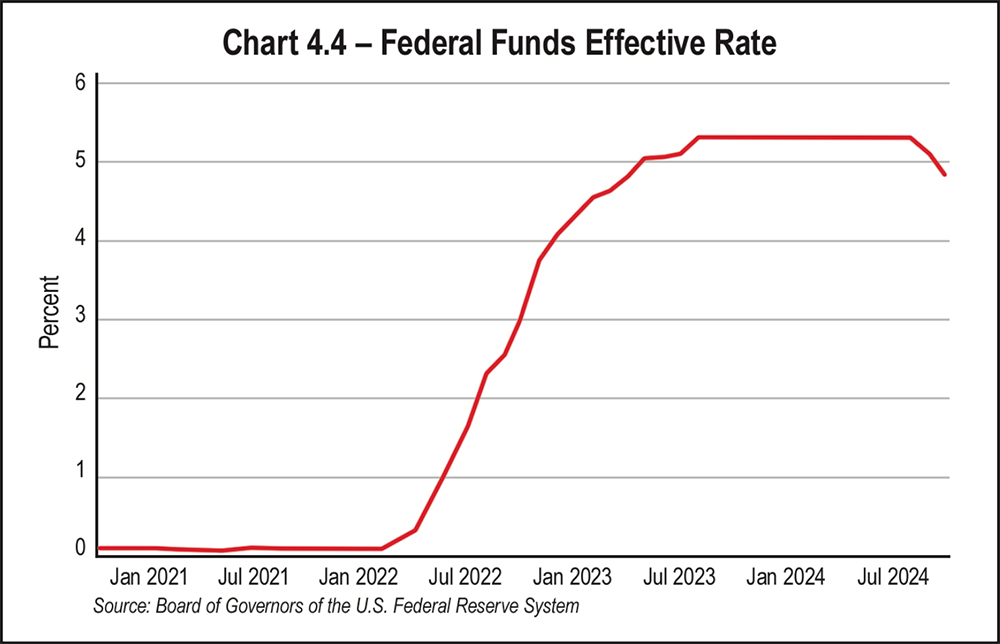
Higher interest rates typically encourage less spending and more saving, which is why the FED began its rate hike strategy to slow down spending to bring down inflation. While spending did cool somewhat, the higher costs of goods and services made saving more difficult. Both consumers and businesses continued spending in the fourth quarter, albeit more cautiously and with greater sensitivity to current costs and interest rates.
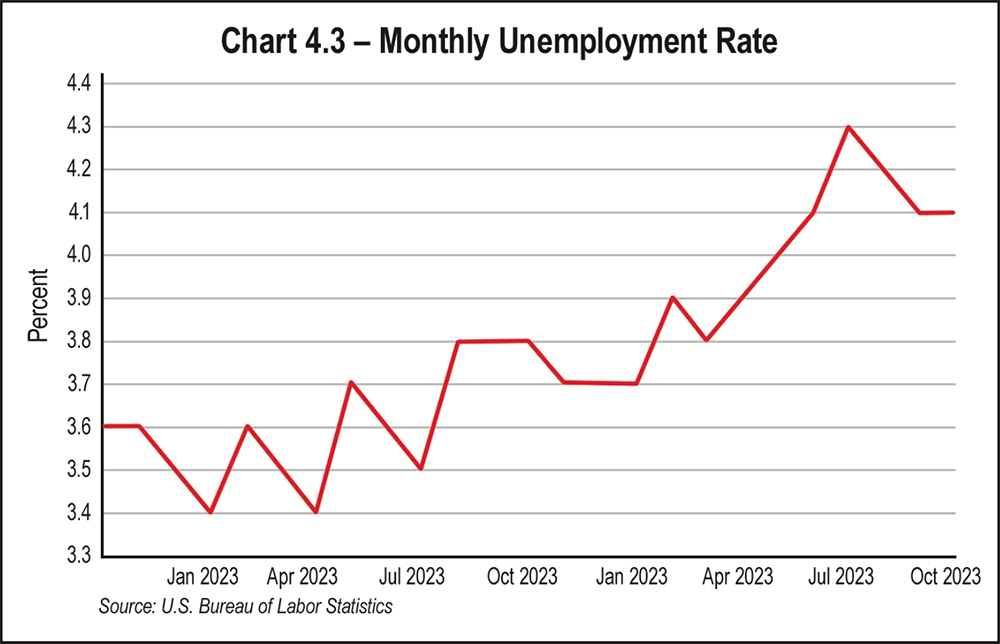
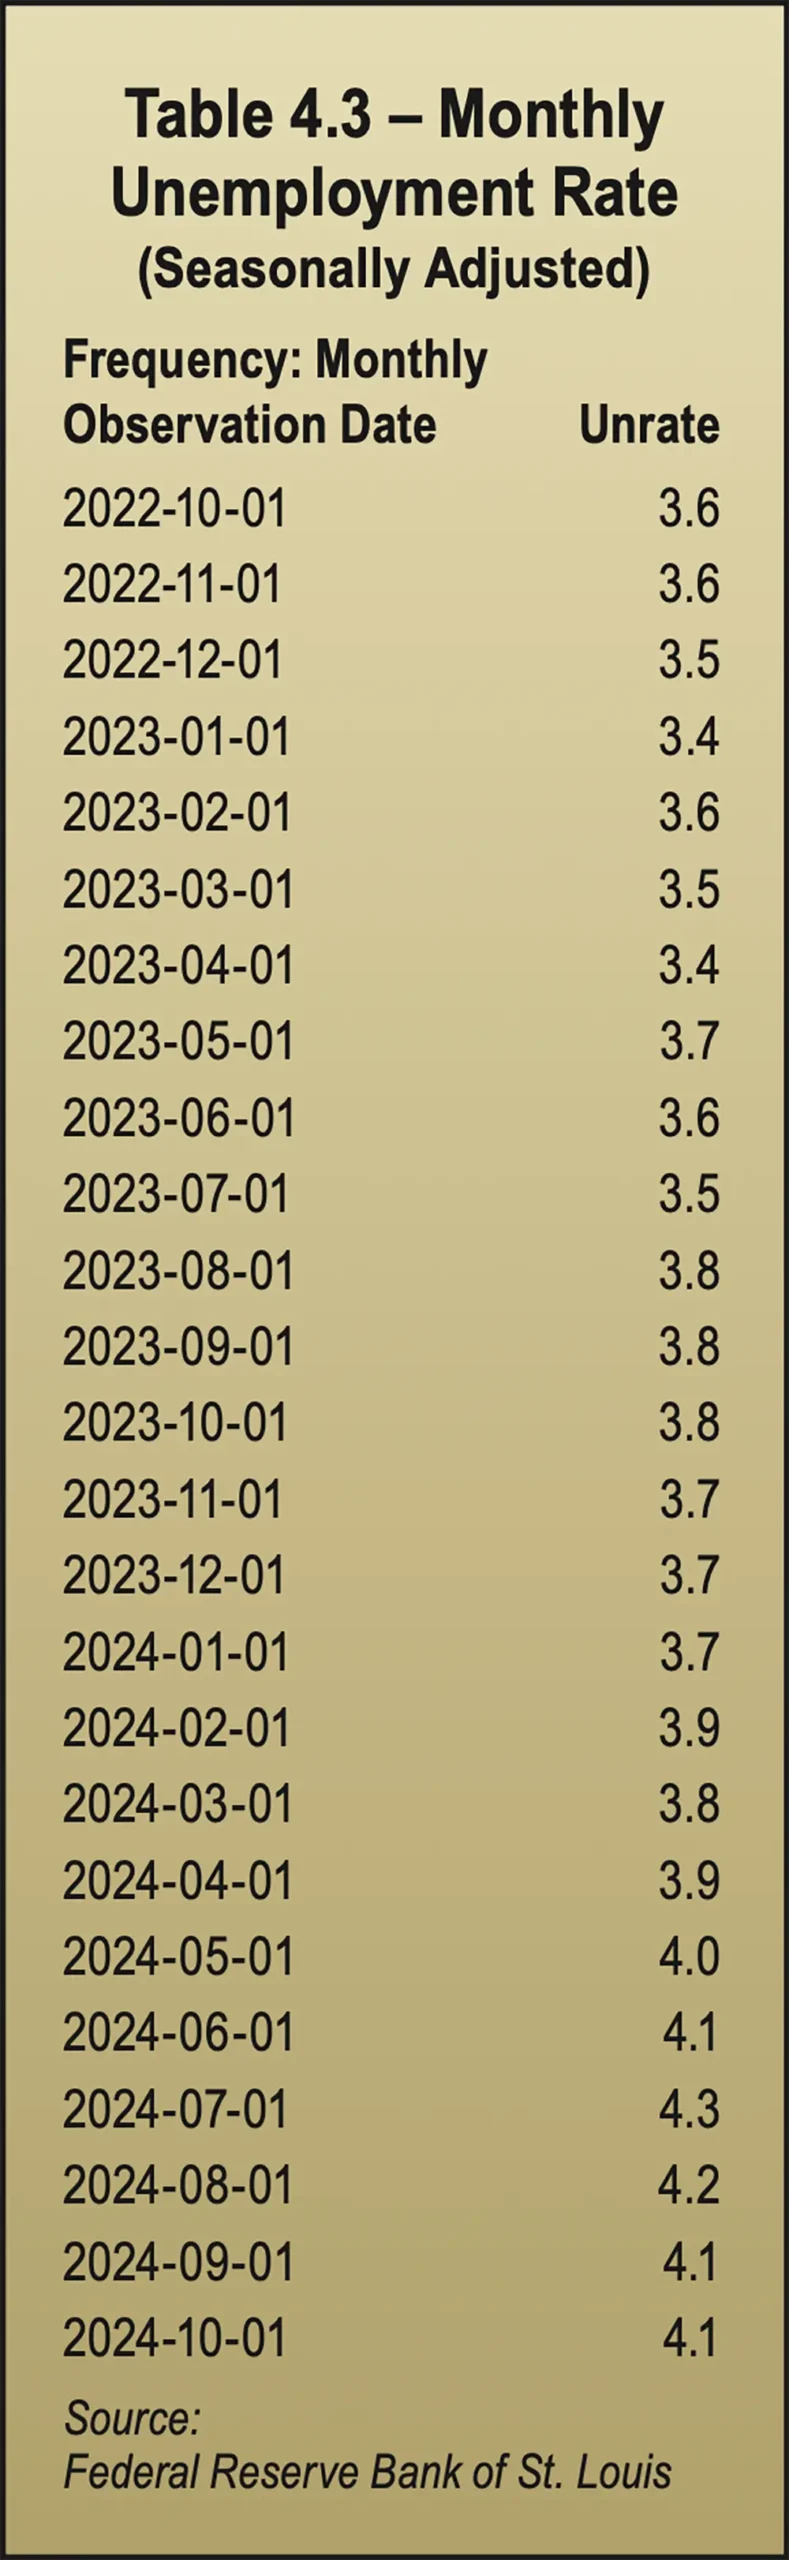
The average hours worked remain steady, as did wage growth. Labor shortages should continue to drive hiring in some industries. These shortages were driven in part by retiring baby boomers as manual labor and front-line manufacturing jobs have become increasingly difficult to fill. Many economists predict that the unemployment rate will rise to 4.5 percent by the end of 2025.
Changes in the job market are set to take place as some jobs may be displaced by automation while creating new opportunities in technology. While traditional industries may have fewer jobs to offer, growth will continue in sectors such as health care, renewable energy, and various technology fields.
By race, Caucasians are far more likely to work remotely and comprise 64.8 percent of those workers, followed by the Hispanic/Latino group at 13.3 percent, and African Americans at 9.6 percent. The largest percentage of remote workers are age 25 to 39, making up 36.5 percent; 29.8 percent are 40 to 54 years old, while 16 percent are 55 to 64 years old, and 10.7 percent are 65 or older. Only 6.9 percent of remote employees are between the ages of 18 and 24, a group that prefers more social interaction.
Overall, the U.S. labor market is showing signs of softening, with workforce participation below pre-pandemic levels. Immigration will continue to help fill jobs, and an improved economy may encourage businesses to hire more workers.
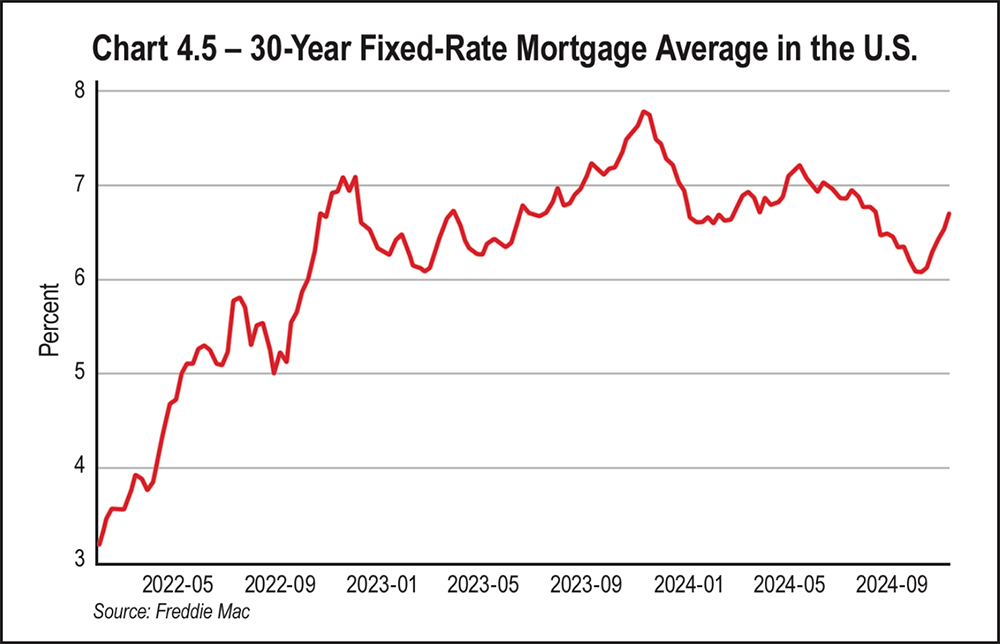
Closely tied to the Federal Funds Effective Rate are mortgage rates. As interest rates increased, mortgage rates followed, jumping from 3.2 percent in January 2022 to 7.08 percent in October of the same year. Not much relief was found in 2023, with 30-year fixed rates averaging 6.81 percent. Mortgage rates hit a high of 7.79 percent in October 2023, the highest rate reached in over two decades.
For much of 2024, the cost of a typical 30-year fixed mortgage had been in the high-6 to low-7 percent range but topped out at 7.22 in May. As of mid-November, 30-year fixed rate mortgages averaged 6.91 percent. See Chart 4.5, 30-Year Fixed Rate Mortgage in the U.S.
By the fourth quarter 2025, Fannie Mae expects the 30-year fixed mortgage rate will average out at 6.2 percent. The MBA expects 6.0 percent, while Wells Fargo forecasts 5.9 percent. At any of these rates, we will still be well above the 3.5 percent to 5.5 percent range mortgage rates that remained for a decade before the pandemic. While a dip in mortgage rates could improve affordability and bring in more buyers, the levels currently projected by these firms won’t bring affordability to the levels seen before the pandemic housing boom.
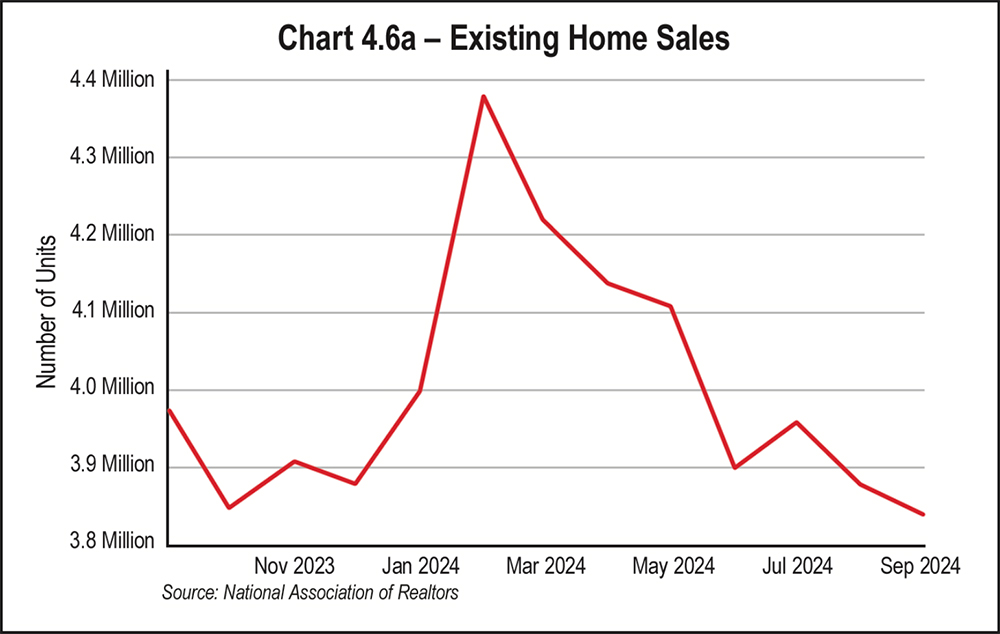
Total housing inventory registered at the end of September 2024 was 1.39 million units, up 1.5 percent from August and 23.0 percent from September 2023. Inventory hit a low in December 2023 when only 990,000 were available. Unsold inventory continued to rise in 2024. In September, it sat at a 4.3-month supply at the current sales pace, which was up from 3.4 months in September 2023.
The median price of existing homes for all housing types in September was $404,500, up 3.0 percent from September 2023 when the median price was $392,700. All four U.S. regions saw price increases. Home prices remain high in periods of low inventory, even if demand softens. The median home sale price dropped slightly from June’s all-time high but still marked the highest median on record for the month of September, according to the National Association of REALTORS®.
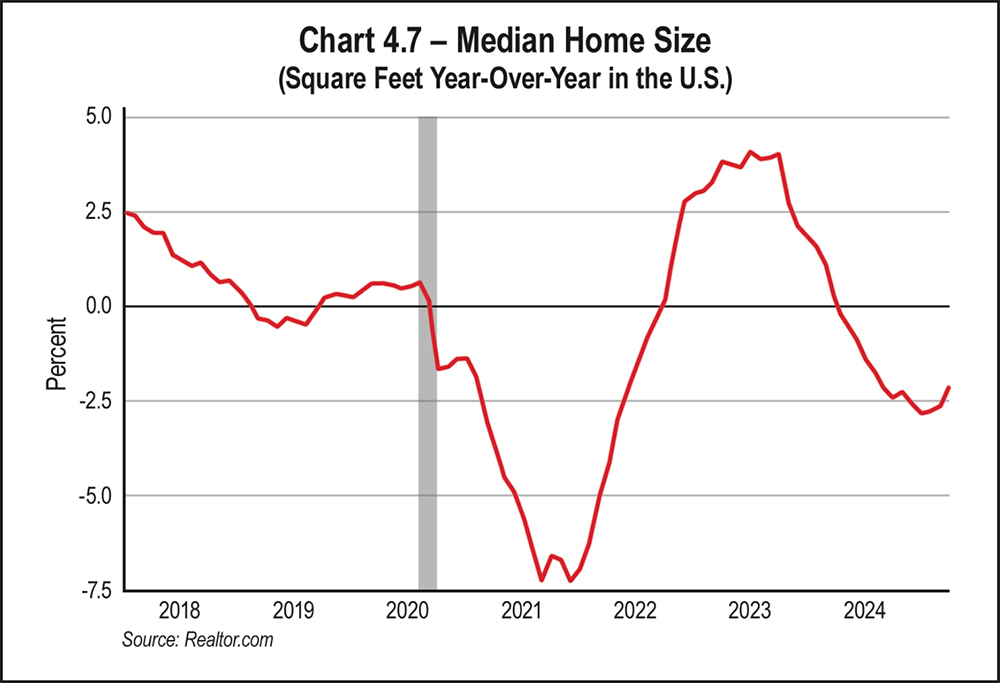
The median home size peaked in 2015 at 2,467 square feet and has slowly declined over the past decade in general, although it has fluctuated from a low of 1,770 square feet in January 2022. In October 2024, median home size was 1,835 square feet. See Chart 4.7, Median Home Size.
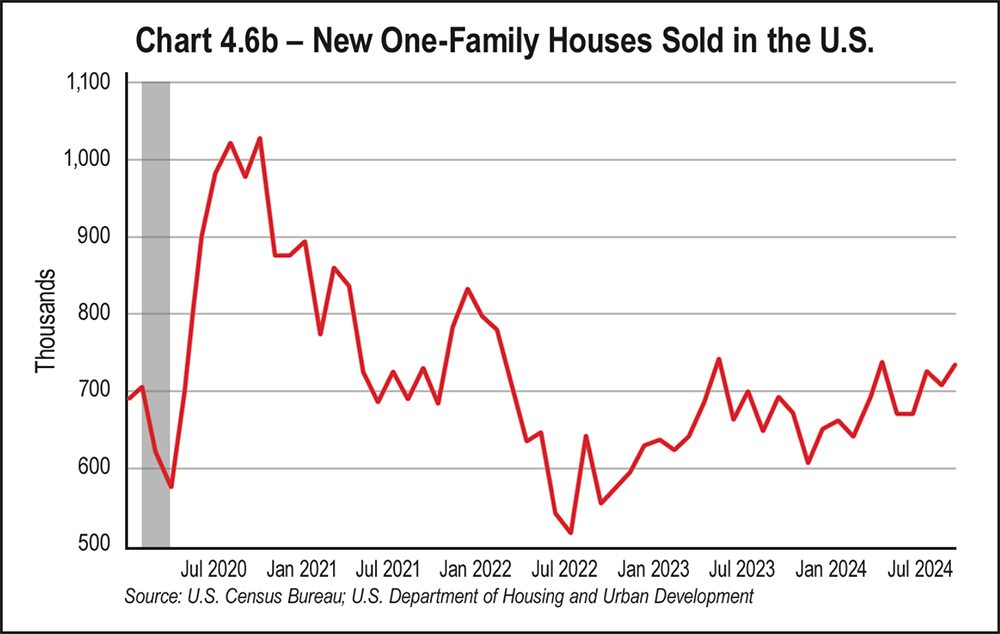
It’s interesting to note that in 1980, the median size of a new home in the U.S. was 1,595 square feet, while in 2018, the median size of newly constructed homes was 2,386 square feet. New builds are shrinking again with median square footage at 2,140 in the first quarter of 2024, down from a median of 2,256 square feet for newly built homes in the first quarter of 2023.
Many factors can account for shrinking home sizes, such as the availability of land to build on, the high costs of construction, and smaller family size. In a tough market, builders are building smaller, more affordable homes simply to bring more buyers into the market. These lower priced new homes were a major factor in 2024’s leveling off of listing prices. In the first quarter of 2024, construction of townhouses increased by 45 percent compared to the first quarter of 2023.
per year between 2045 and 2054, based on CBO projections.
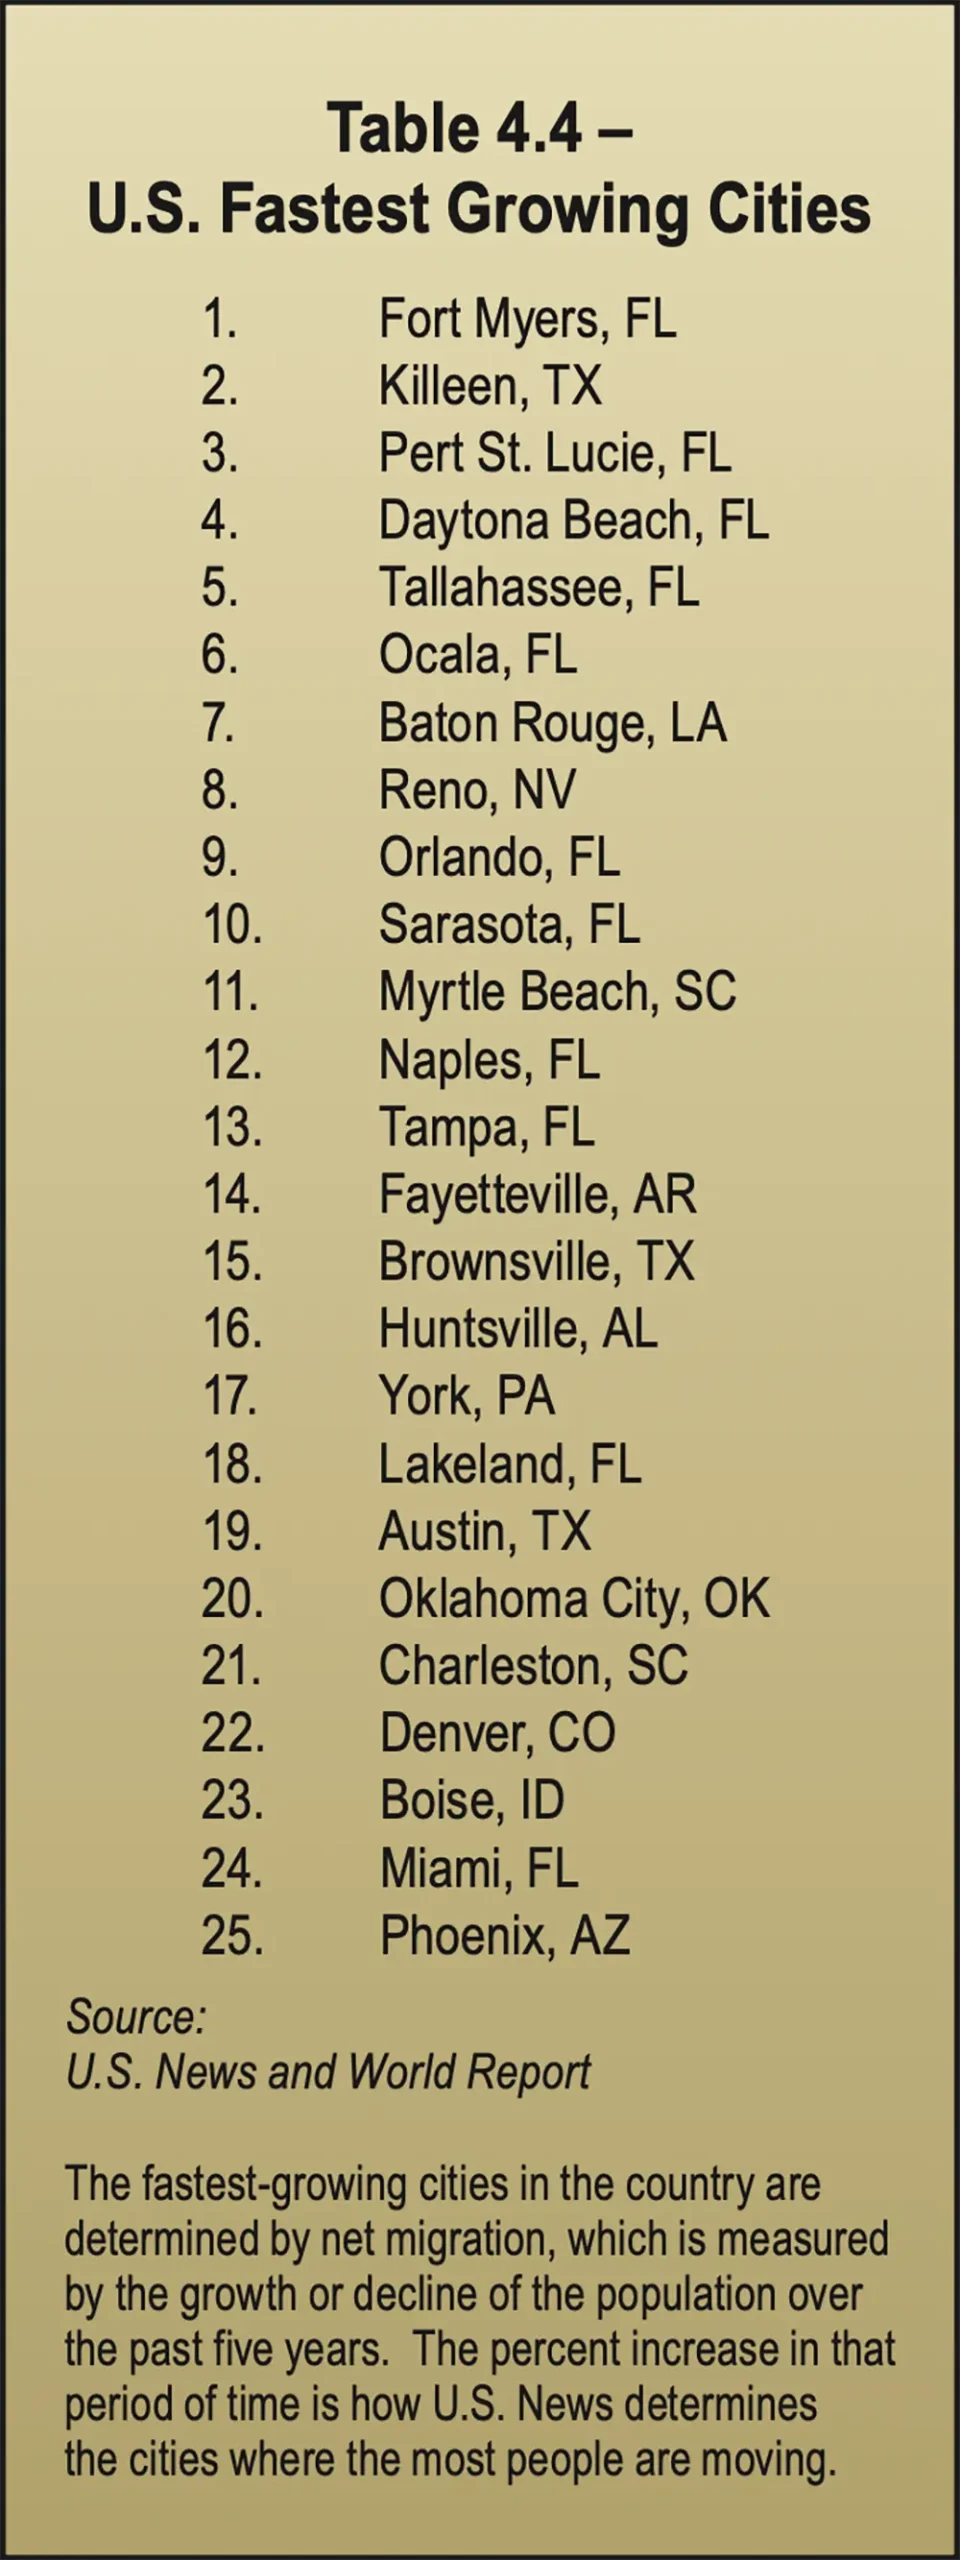
Urban areas lost population to outmigration in 2020 and 2021 as families moved to suburbs seeking more space. The trend reversed over the past few years as more people are moving from one urban area to another. However, the rising costs of housing in popular, high-growth areas has seen many potential homebuyers moving to smaller adjacent markets where housing is more affordable.
Topping U.S. News and World Report’s list of fastest-growing cities in 2024 is Fort Meyers, Fla., followed by Kileen, Texas. Eleven of the list’s top 25 cities are in Florida, while three are in Texas. Many of the fast-growing cities are in the South, continuing the trend of recent years. See Table 4.4 on the opposite page, U.S. Fastest Growing Cities.
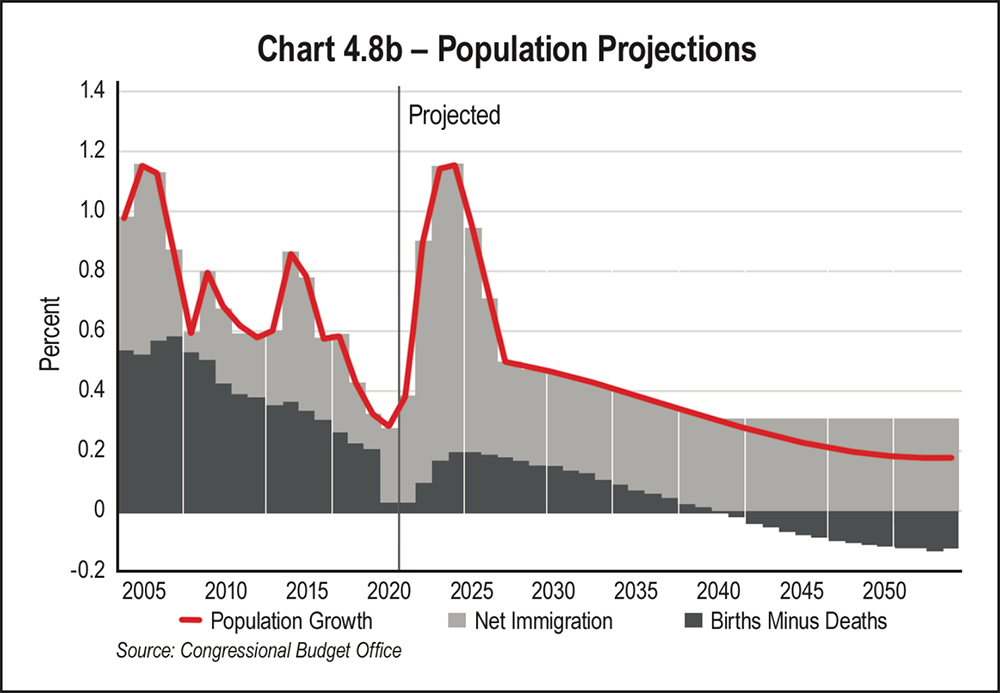
The CBO made upward revisions to its net immigration numbers from 2024 to 2026, which mostly boosted the size and growth of the working-age population (25 to 54 years old). The agency also reduced downward the projected fertility numbers from 1.75 to 1.70 births per woman. The mortality rates for people 65 or older over the first two decades of the projection period was revised downward due to fewer deaths from COVID-19 in that age group than previously projected.
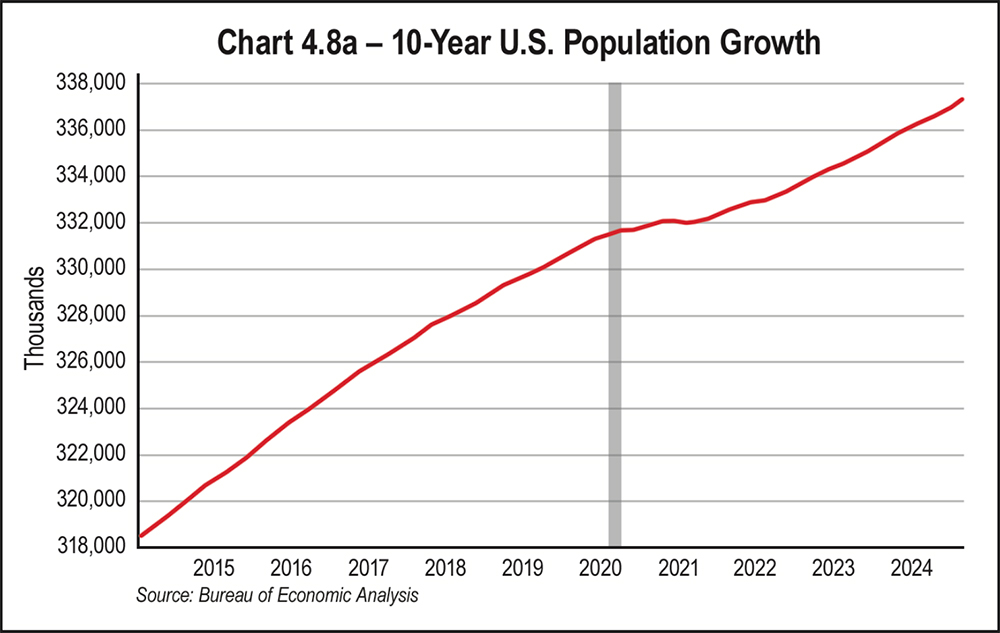
Overall population growth should slow over the next 30 years from an average of 0.6 percent per year between 2024 and 2034 to 0.2 percent per year between 2045 and 2054, based on CBO projections. In their projections, net immigration will increasingly drive population growth and, in fact, will account for all population growth beginning in 2040. Projected birth rates will not be high enough for a generation to replace itself; thus, population growth will rely on immigration from other countries.
The CBO notes that its projections of the rates of fertility, mortality, and net immigration are highly uncertain. Small differences between CBO’s projections of those rates and the actual outcomes could compound over many years and significantly change demographic outcomes.
Census Bureau data demonstrates significant growth in diversity. Non-Hispanic white individuals made up 59 percent of the population in 2024, down from 76 percent in 1990. Meanwhile, the Hispanic population grew to 19 percent, while multiracial and Asian populations experienced the fastest growth.
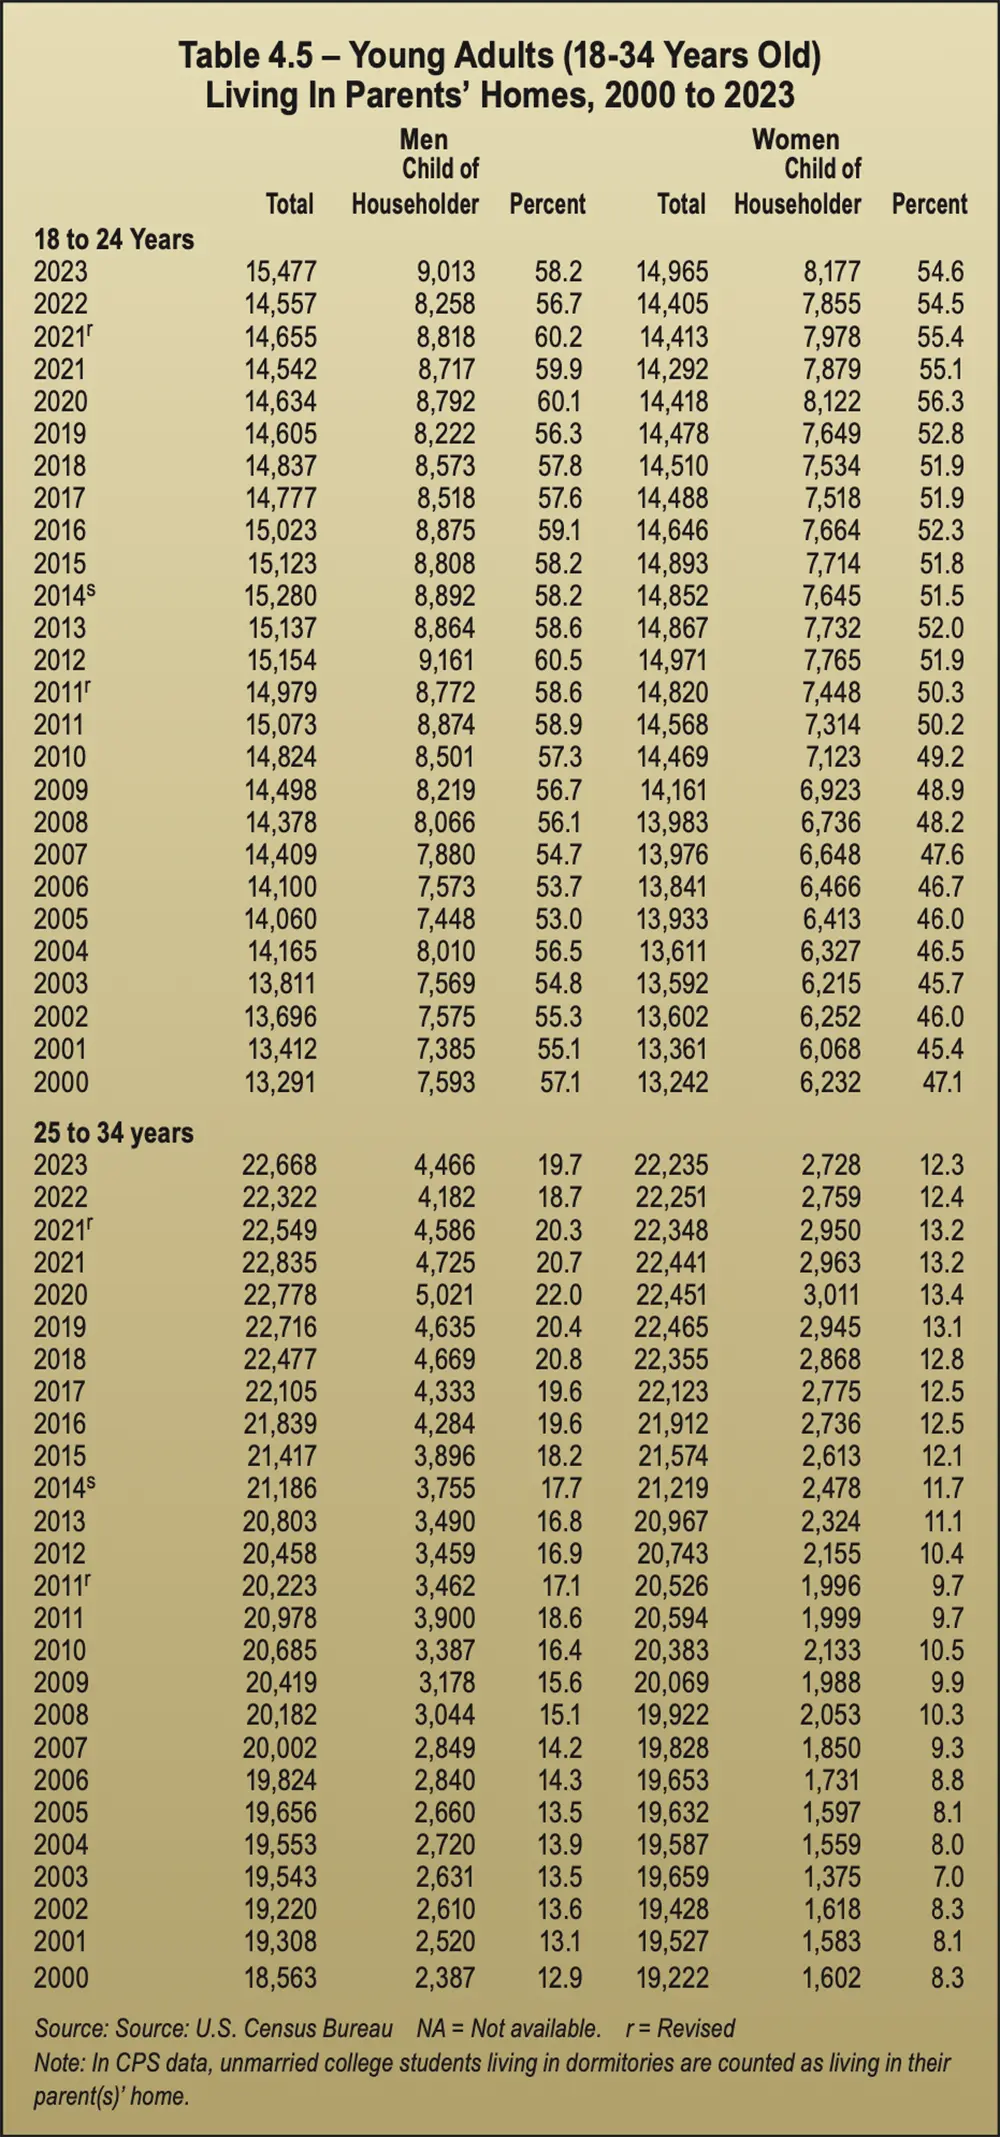
Another demographic shift that’s been on the rise is young adults living in the homes of one or both parents. There were 7.68 million Americans aged 25 to 34 living at home in 2021, representing an 87.4 percent increase over the past two decades. This figure does not account for children living in their parental home with a spouse or child, but it does count college students living in dormitories. See Table 4.5, Young Adults Living In Parents’ Homes.
The numbers rose during the pandemic years as work was halted and young adults were displaced. The trend slacked off somewhat in 2022, but the numbers began rising again in 2023 as inflation and lack of affordable housing drove many young Americans back to their parents’ homes. This displacement may create the need to store items from a previous household and should affect self-storage demand.
The number of men living with parents has outpaced the number of women each year. Surprisingly, the numbers of both men and women aged 25 to 34 who live with parents has been consistently higher than those age 18 to 24 years.
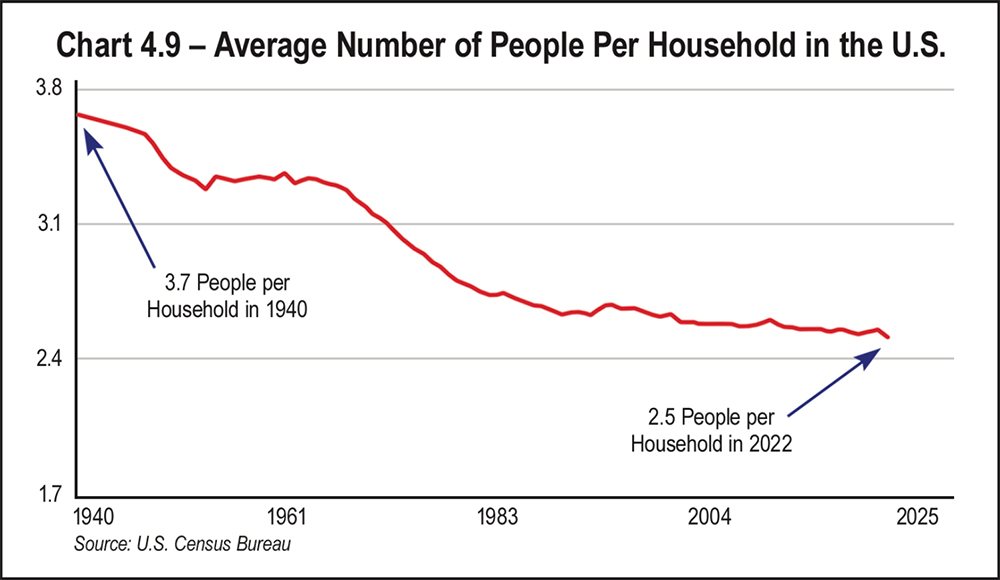
Even with adult children more likely to live at home, the average number of people per household has declined steadily. In 2022, the average household size was 2.5 people compared to 3.7 people in 1940. This could contribute to the trend toward a shrinking median home size in square feet. See Chart 4.9, Average Number of People Per Household in the U.S.
Decreasing household size can be attributed to lower birth rates and people waiting longer to get married and/or to have children. However, with migrants becoming an increasingly higher percentage of our population, this trend could reverse as housing shortages may necessitate more people sharing a home. In addition, some migrant cultures that are adding to the U.S. population traditionally enjoy having larger families.
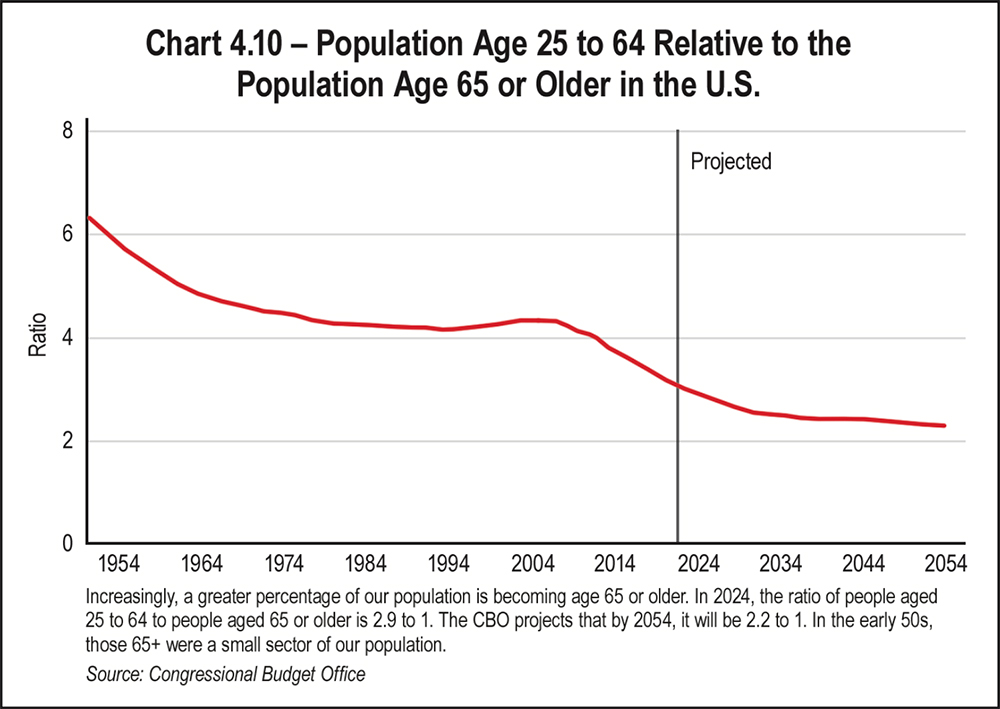
In 2024, Census data showed that the population continues to age, with 18 percent of people now aged 65 or older. This trend affects health care, housing, and labor markets. The percentage of children younger than 18 has declined to 22 percent of the population.
In 2024, the ratio of people ages 25 to 64 to people 65 and older was 2.9 to 1, but the CBO projects that by 2054, it will be 2.2 to 1. This is significant because most of our workforce falls in the 25 to 64 age range. See Chart 4.10.
In the 1950s, people 65 or older were a small segment of the population. Families included more children, and the life expectancy for older Americans was lower. Both trends have reversed. In 1950, life expectancy in the U.S. was 68 years. In 2024, the life expectancy for Americans was between 78.7 and 82.2 years, depending on which agency made the projections.
If the Fed reaches its goal and inflation abates, real GDP growth should rise slightly above 2 percent on a quarterly annualized basis by the end of 2025. Although the CBO’s projections call for a growth rate of 2.1, economic surprises such as the many we’ve experienced over the past five years could affect that forecast.
The Conference Board Leading Economic Index® (LEI), a composite index that looks at early indicators of where the economy is heading, reported declines of key indicators in the third quarter of 2024. This signals uncertainty for 2025. Therefore, the board predicts only moderate growth in early 2025.
Consumer spending should cool as families become increasingly constrained by debt. Consumers will spend more cautiously and with more price sensitivity. Unemployment is projected to reach 4.5 percent this year, which may also affect spending. The good news is that most agencies are forecasting relief on inflated prices and high interest rates. Relief in either of these areas could put more money in the pockets of consumers, and given recent trends, they are more likely to spend it than to save it.
Economic and demographic trends will have an immense impact on self-storage demand in 2025 and beyond. An aging population can mean more seniors moving to care facilities or moving in with their adult children. The trend to move to urban areas where living space is smaller will increase demand in these cities. And the availability of remote work may see more people moving to Sun Belt states if earning a living is not dependent on location.
Lastly, the anticipated soft landing of the economy will affect demand as consumers get relief from financial pressures, allowing them to buy a new home or to begin remodeling projects. In addition, a lower cost of capital may reignite plans for development, facility expansions, or improvements that have been on the back burner.