he overall capitalization rate or “cap rate” is used to convert income to value. One of the easiest ways to think of the relationship of a cap rate to value is the acronym IRV: Income divided by Rate = Value or I/R = V. As the cap rate goes down, the value goes up. Officially, the direct capitalization is defined by The Appraisal Institute in the Dictionary of Real Estate as follows (page 65):
To complicate matters, a cap rate can be calculated on last year’s net operating income (often called trailing), a forecast of next year’s expectations of net operating income (forecast). Moreover, the “true” cap rate is often a perspective, not a fact. For example, the seller may believe the cap rate was a 5.50 percent, implying a higher value, while the buyer may believe the cap rate was a 6.0 percent, implying a higher return. And, the broker involved in the deal may report a 5.75 percent cap rate. While all three perspectives are important to understand, it doesn’t exactly determine the cap rate.
For comparison purposes, it is best to understand the forecast or stabilized cap rate (for example, this is the cap rate used in an appraisal) and the trailing cap rate to understand expectations of buyers and sellers in the transaction. It is also important to understand if expenses were adjusted to market, particularly real estate taxes, in the forecast of a stabilized cap rate. For the purposes of this article, the stabilized or forecast (sometimes called Year 1) cap rate will be addressed because it is typically the most consistent cap rate considered for comparison purposes (for example, it is the basis of Investor Survey’s on cap rates).
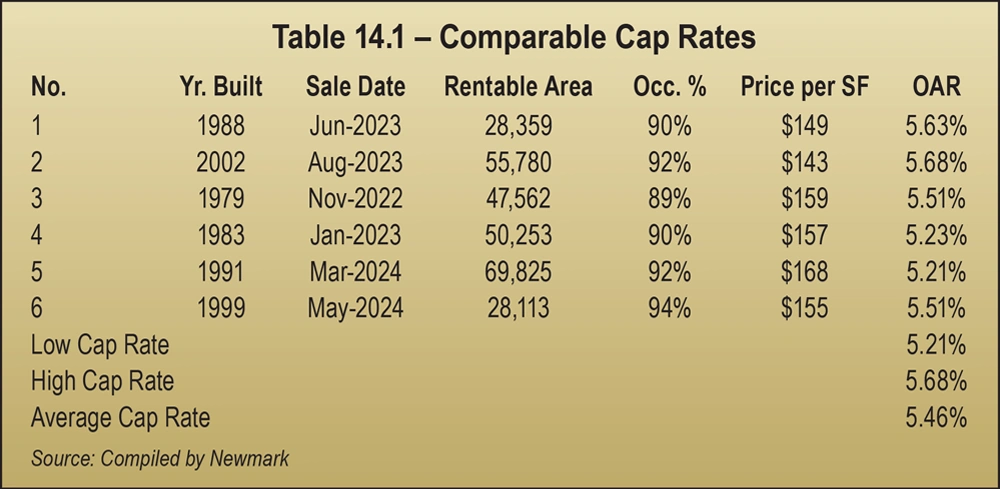
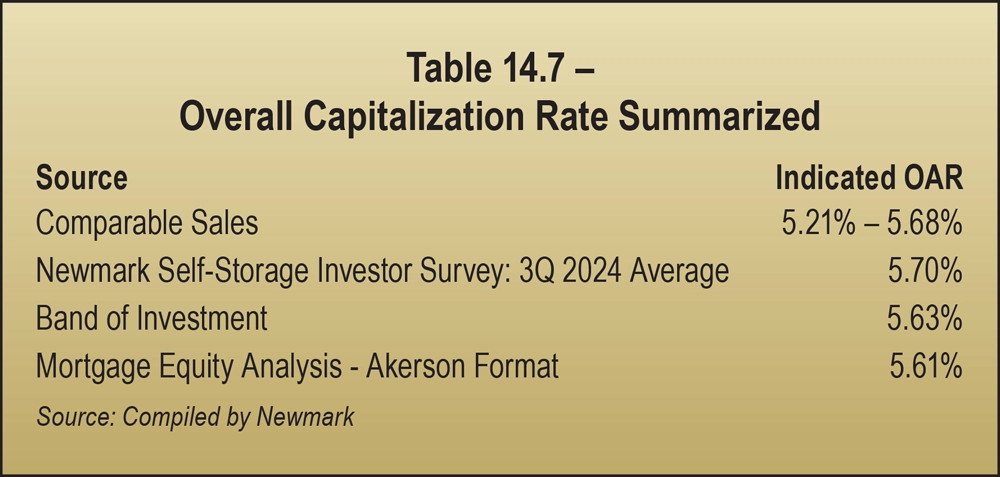
- Direct Cap Comparables – Deriving comparables from similar properties that have sold is generally the preferred technique when sufficient information is available. For example, what cap rate is reported? The trailing or the stabilized? Comparable cap rates are summarized in Table 14.1 below.
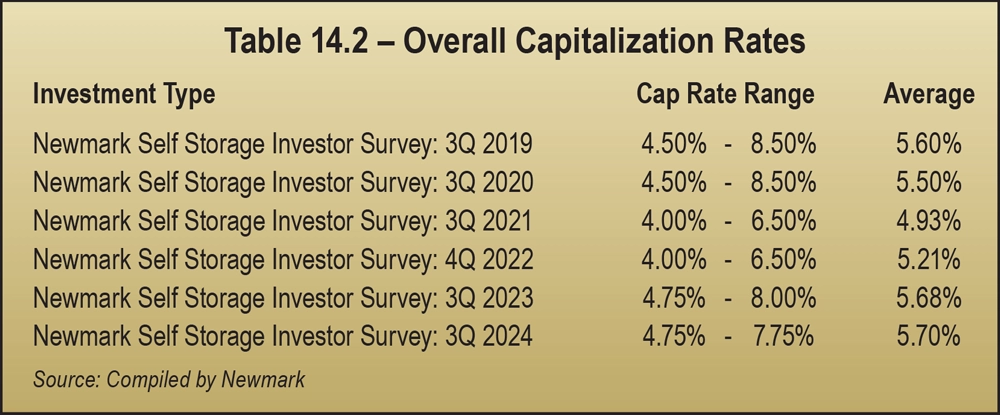
- Investor Surveys – Survey research is based on periodic publications of the current thinking of investors, compared to historical performance data of comparable sales. Surveys are generally used as support and should not be relied upon as a primary source. They are very useful to understand real-time market dynamics. Surveys can vary in scope of research, so it is worthwhile to review a wide variety of publications. The results of the most recent self-storage investor surveys are summarized in Table 14.2 on the previous page.
- Band of Investment – This technique is based on returns to debt and equity, sometimes called a built-up model. It accounts for market-based financing with a market-based return to equity. The return to equity for a single asset is typically higher than a comparable self-storage annual return to investor or dividend from a self-storage REIT or stock (does not account for appreciation of the asset). Another way to look at the equity dividend, or cash on cash, is the annual return on every dollar of equity. Since most properties are purchased with a combination of debt and equity, the technique has relevance in the market. A Band of Investment Analysis example is summarized in Table 14.4 on the opposite page.
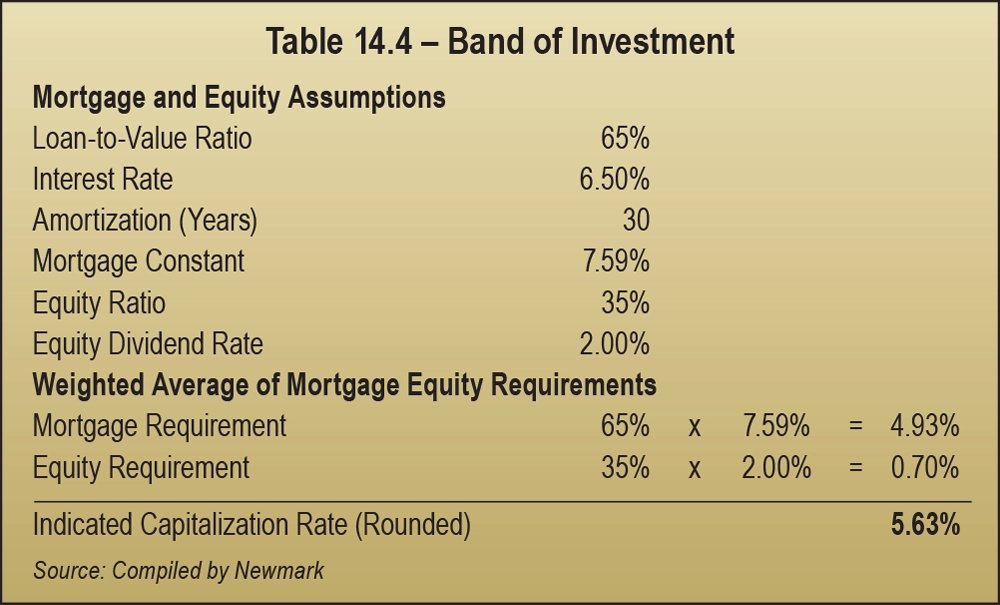
Over the past year, the return to equity has changed significantly higher due to lower interest rates. In the past, some investors were willing to underwrite a negative return in the initial year to make a deal pencil, but that means significant upside is expected in rents. Common to industrial and apartment sectors, this is new for self-storage. It is another indicator that institutional investors have confidence in the self-storage asset class in bull and bear markets. Over the past year, a significant increase in equity dividend indicates a stronger emphasis on cash flow in the year ahead.
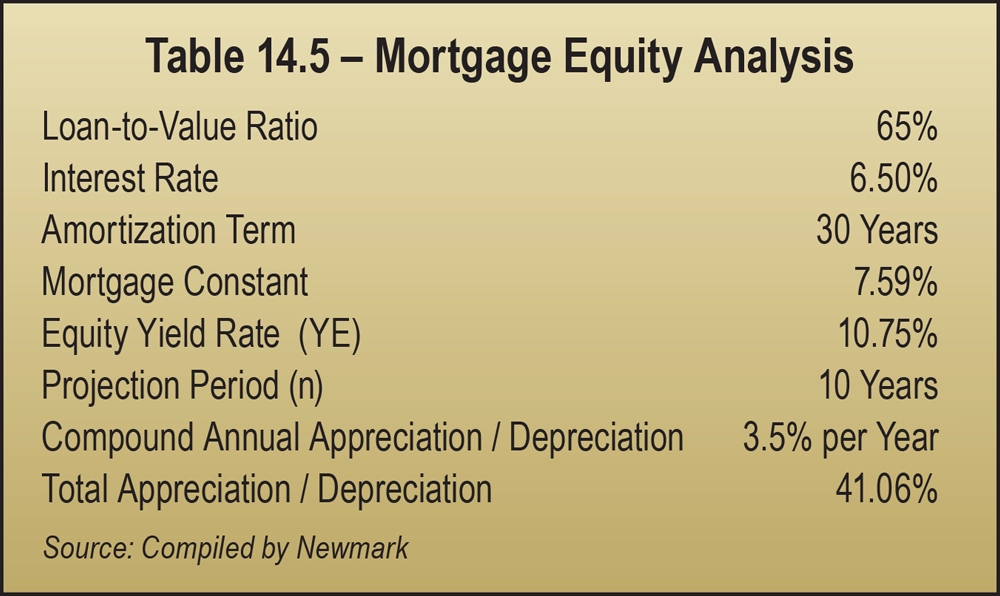
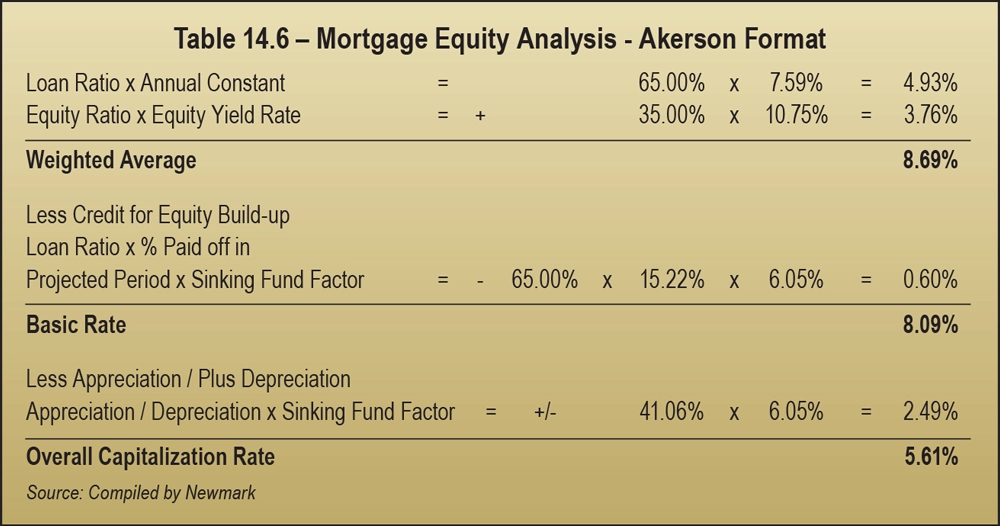
- Mortgage Equity Analysis – This analysis derives from the idea that real property investments are a combination of two components: debt and equity. It differs from the Band of Investment because it accounts for total yield: equity dividend and appreciation over time. It is a useful tool because it solves for a levered equity yield (that includes both cash flow or equity dividend and appreciation over time). Self-storage as an asset class has demonstrated superior returns for many years. For example, comparing total return of self-storage REITs over the last 25 years, self-storage has provided an 17.33 percent return on average and is superior to other core sectors such as office, industrial, retail, or apartments (based on NAREIT data or publicly traded companies only). As a result, institutional investors have been storing capital in the sector. The Mortgage Equity Analysis solves for equity yield, a common metric of the comparison of returns among investments for the institutional market. The equity yield rate estimated is lower for a single asset (in this case estimated at 10.75 percent) than publicly traded REIT data because REITs offer greater liquidity. The mortgage equity example, with the same mortgage requirements as the Band of Investment example for consistency, is presented in Tables 14.5 and 14.6.
In general, market derived data is best. However, the data represents historical views. Survey research represents what investors view now going forward and is the best estimate of current market sentiment. These analyses are further supported by two mathematical techniques to test the reasonableness of the cap rate market data presented. There are other good tools and analyses, such as a Debt Service Coverage Ratio, debt yield, and residual techniques that can provide tests of reasonableness to a cap rate conclusion (not presented here). For instance, the EGIM multiplier tests the effective gross income (all income after vacancy and collection loss) compared to expense ratios. Using the formula of 1 – expense ratio \ the EGIM = cap rate. This multiplier is market derived, and the analysis tests overall assumptions of the net operating income forecast, such as income, vacancy, and expenses, to the concluded cap rate. Altogether, these analytical tools can be effective resources in concluding a reasonable and credible cap rate for a self-storage property.