he RV and boat storage sector has emerged as a lucrative niche in the self-storage industry, driven by strong demand for secure and specialized parking solutions. With a growing number of RVs and boats in use nationwide, coupled with restrictions on residential parking, the need for dedicated storage facilities is on the rise. As this segment gains investor interest, understanding market dynamics, trends, and challenges is essential.
U.S. boat registrations totaled 11.5 million in 2023, showing a 1.9 percent decline from 2022. The state with the most boats registered in 2023 was Florida, but it showed a sizable 8.1 percent drop; the state with the most significant increase was Iowa, with 7.9 percent more boats registered in 2023. The NMMA also pointed out that unregistered boats are becoming a substantial portion of the landscape—23.9 percent of the total is now unregistered.
Towable RVs, led by conventional travel trailers, ended the month up 4.2 percent from last September with 22,279 shipments. Motorhomes finished the month down 30.1 percent compared to the same month last year, with 2,316 units. Park Model RVs finished September down 12 percent compared to the same month last year, with 294 wholesale shipments. To date, all RVs are up 7.7 percent compared to the same period last year, with 256,412 units shipped through September.
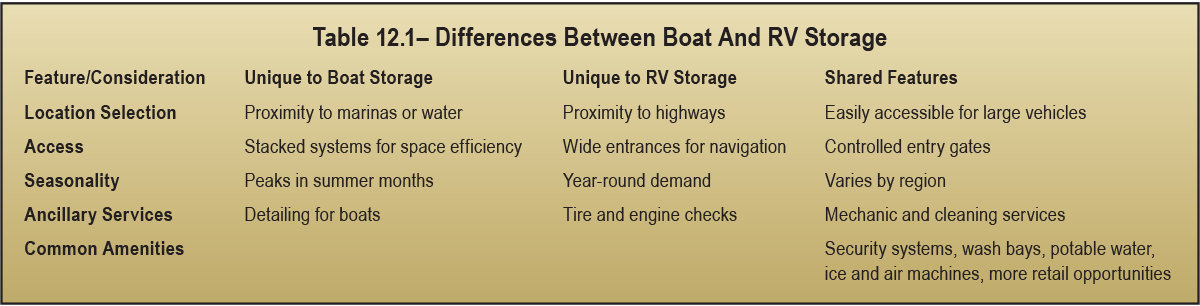
- Dump stations are essential for waste management and provide a critical service for RV owners between trips.
- Wash bays offer convenience for cleaning and maintenance of RVs and boats before and after use.
- Potable water and air stations ensure readiness for travel by allowing users to fill tanks and tires conveniently on site.
- Solar charging stations are eco-friendly options that enable owners to maintain battery health with trickle charging at individual stalls.
- Play areas for kids encourage family-friendly use of the facility, especially during extended visits for vehicle maintenance or preparation.
- Dog parks cater to pet owners, adding a layer of convenience for families traveling with dogs.
- On-site mechanic shops save customers time and create additional revenue streams.
- Free ice machines are a simple yet attractive feature for boaters and RVers preparing for long trips or fishing outings.
- Advanced security systems with high-quality surveillance and controlled access systems offer peace of mind to customers storing valuable vehicles.
- Paving options (asphalt, concrete, or permeable paving) – Depending on location and environmental considerations, paved lots provide easier navigation and reduce wear on vehicles.
Facilities offering a mix of these amenities are likely to attract a loyal customer base and justify premium pricing.
Automated properties use technology to manage customer interactions, access control, and other management tasks. These systems often include keypads, mobile apps, security cameras, and online reservation/payment platforms.
Pros
- Cost Savings – There are lower operational costs due to the reduced need for on-site staff.
- Convenience – Customers can access the facility 24/7 without waiting for assistance.
- Scalability – It’s easier to expand operations or manage multiple locations remotely.
- Efficiency – Automated systems streamline processes such as billing, reservations, and gate access.
- Enhanced Security – Technology can offer real-time monitoring, access logs, and alerts.
Cons
- Limited Customer Interaction – The lack of personal touch may deter customers who prefer in-person support.
- Higher Upfront Costs – A significant investment is required for automation infrastructure.
- Technical Issues – System failures or outages could disrupt operations and frustrate customers.
- Reduced Oversight – Absence of on-site staff may result in slower response to maintenance issues or emergencies.
In-Person Managed Properties
Properties that are managed in person use staff to manage day-to-day operations, customer service, and facility maintenance.
Pros
- Personalized Service – Customers appreciate having staff available for questions, assistance, and guidance.
- On-Site Problem Solving – The immediate resolution of issues such as mechanical failures or access problems prevents downtime and business interruption.
- Human Oversight – Staff can provide additional security and ensure proper use of the facility.
- Upselling Opportunities – Staff can promote ancillary services such as detailing, repairs, or premium amenities.
Cons
- Higher Operating Costs – Payroll and benefits for employees increase expenses.
- Limited Hours – Staff availability may restrict customer access outside regular working hours.
- Scalability Challenges – Managing multiple locations requires more staff and administrative oversight.
- Inconsistent Quality – Customer experience can vary depending on staff performance.
Many facilities employ a hybrid approach, merging automation with limited on-site personnel. For instance, automated systems manage the basic, everyday functions of entry and payment. Staffing is kept to a minimum, but personnel are available during peak hours as well to provide more complicated, specialized services. Benefits of a hybrid model include:
- Balance of Cost and Service – It reduces overhead while maintaining a level of personal interaction.
- Flexibility – It offers 24/7 access with support during critical times.
- Customer Satisfaction – It combines convenience with the reassurance of human oversight.
The decision between automated and in-person management depends on the facility’s target market, location, and operational goals. Automated systems work well for tech-savvy customers and urban areas, while in-person management excels in rural or community-focused settings. A hybrid approach often provides the best of both worlds, maximizing efficiency and customer satisfaction.
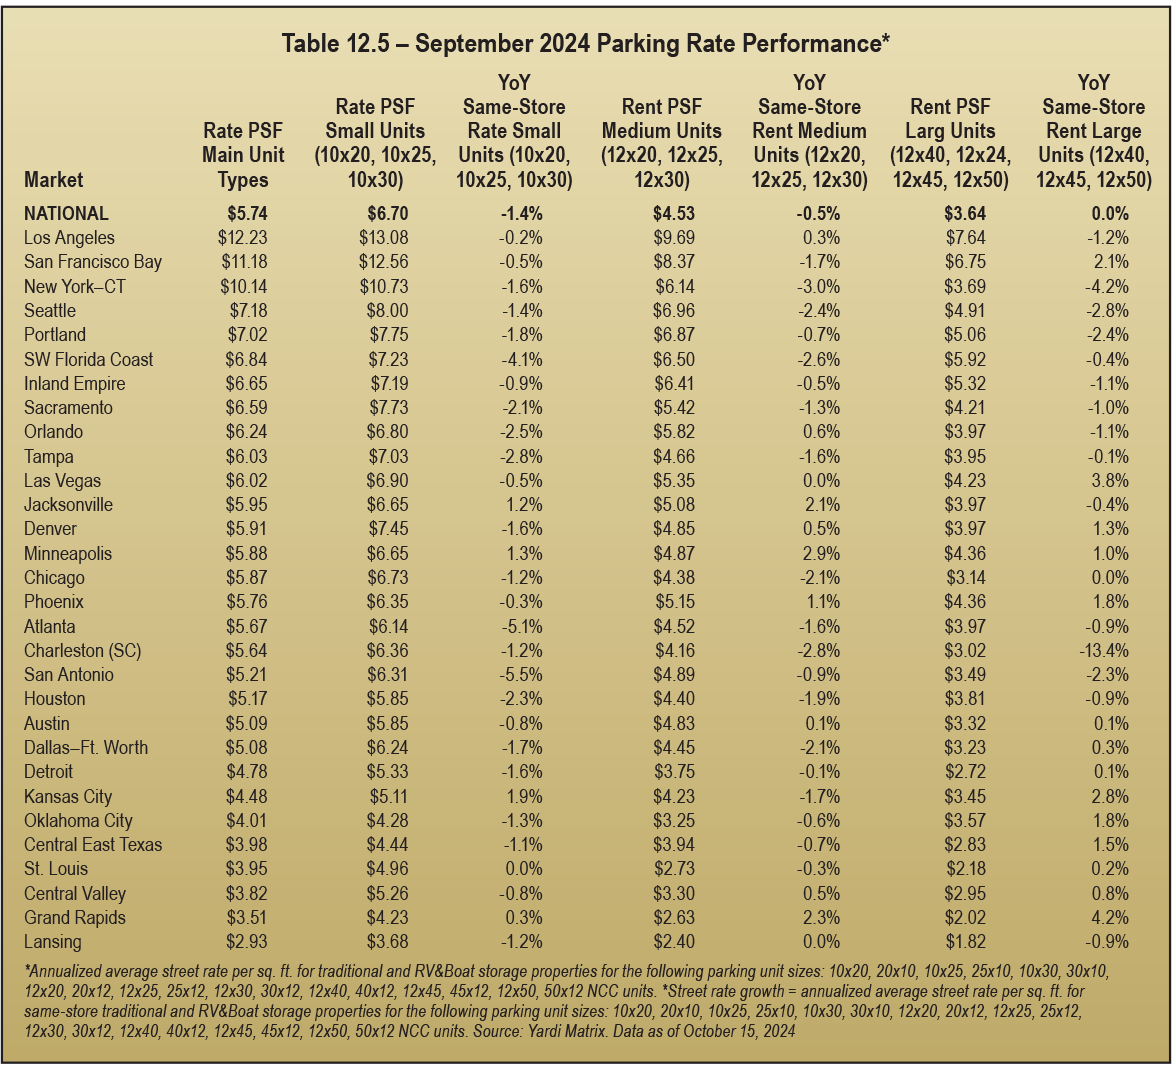
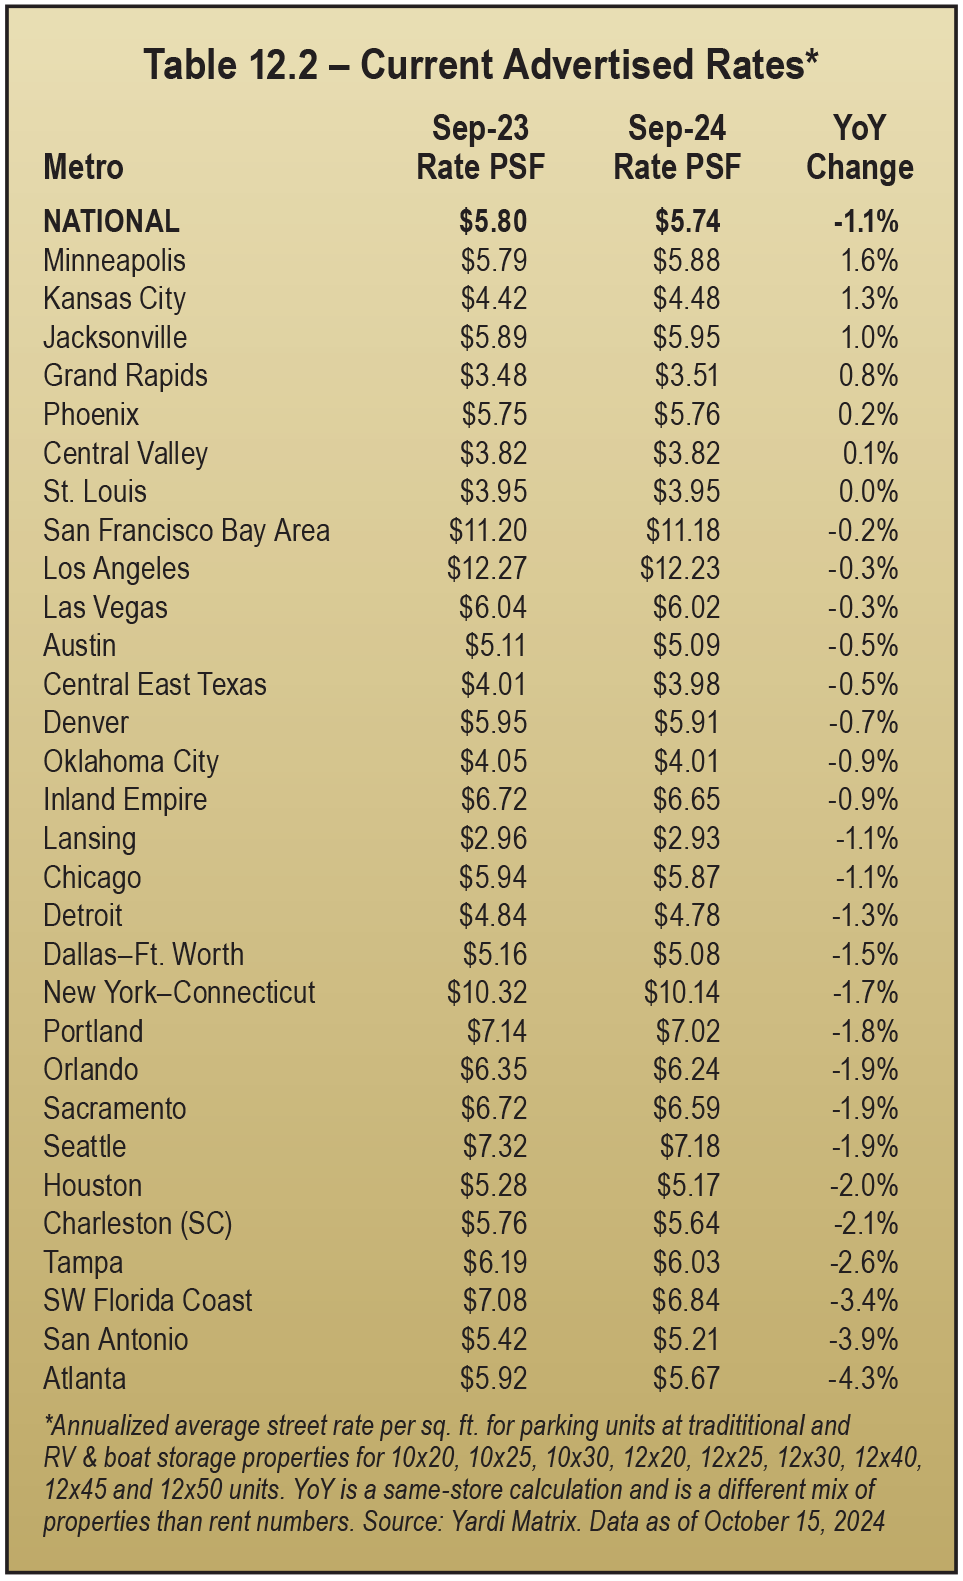
Rent growth also decelerated to -1.1 percent from -0.5 percent in June. Month-over-month declines were more severe in Q3 2024 than Q3 2023, but the sector is outperforming traditional self-storage, where rents dropped 3.5 percent year over year in September. Rent declines were more noticeable in smaller parking units (10-by-20, 10-by-25, and 10-by-30), down 1.4 percent, versus larger units (12-by-40, 12-by-45, and 12-by-50), where rents have remained flat from last year.
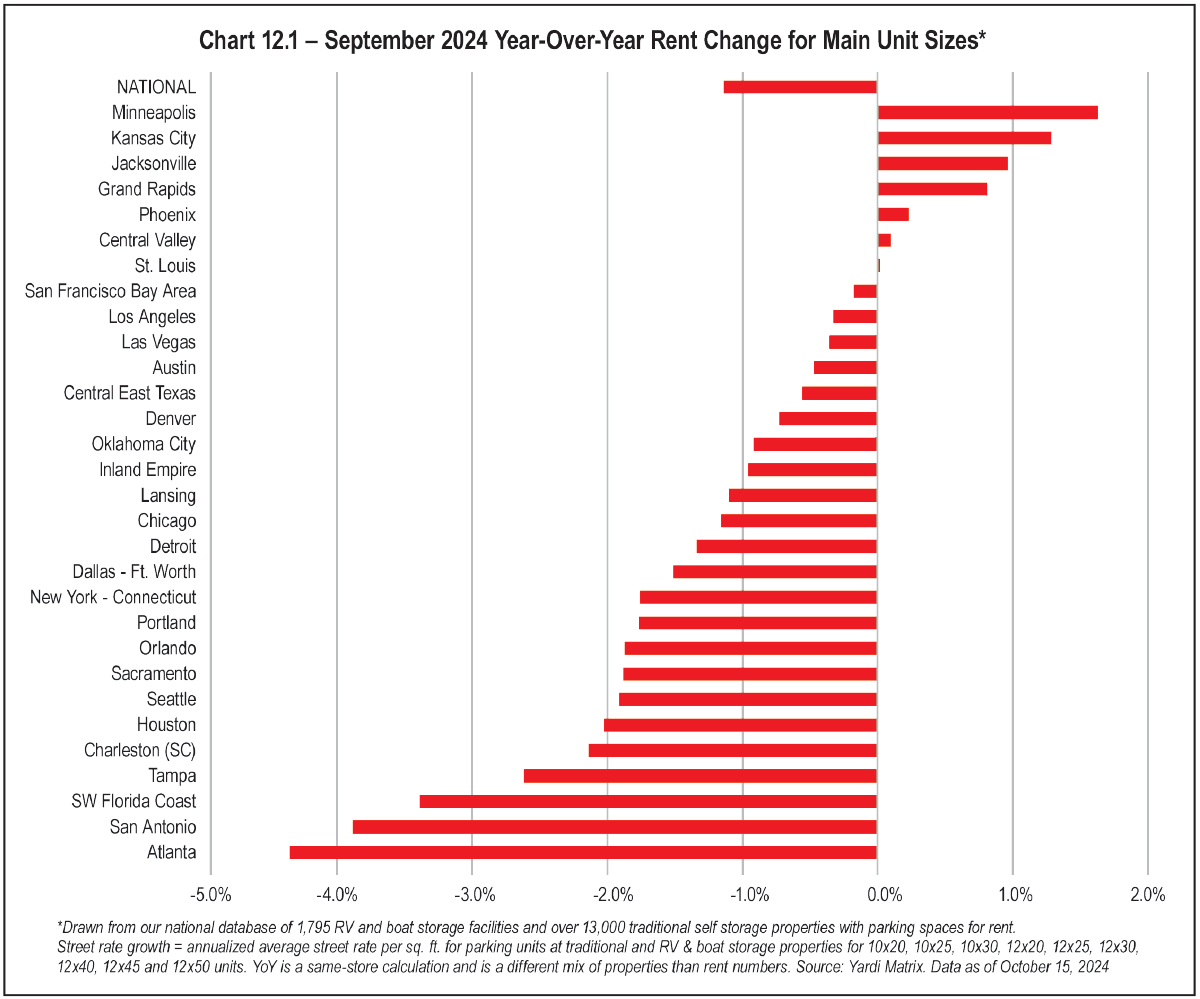
Rent growth has varied by market, with seven posting rent growth year over year, led by solid growth above 1 percent in Minneapolis and Kansas City. Sun Belt markets, which tend to have more existing supply, have seen the greatest declines in rates. Atlanta, San Antonio, and Southwest Florida have experienced growth below -3 percent. Most of the markets with the greatest declines in rates have also seen some of the biggest declines in self-storage rents, suggesting a correlation with self-storage performance, although all these markets have also shown more moderate rate growth in the larger parking space sizes.
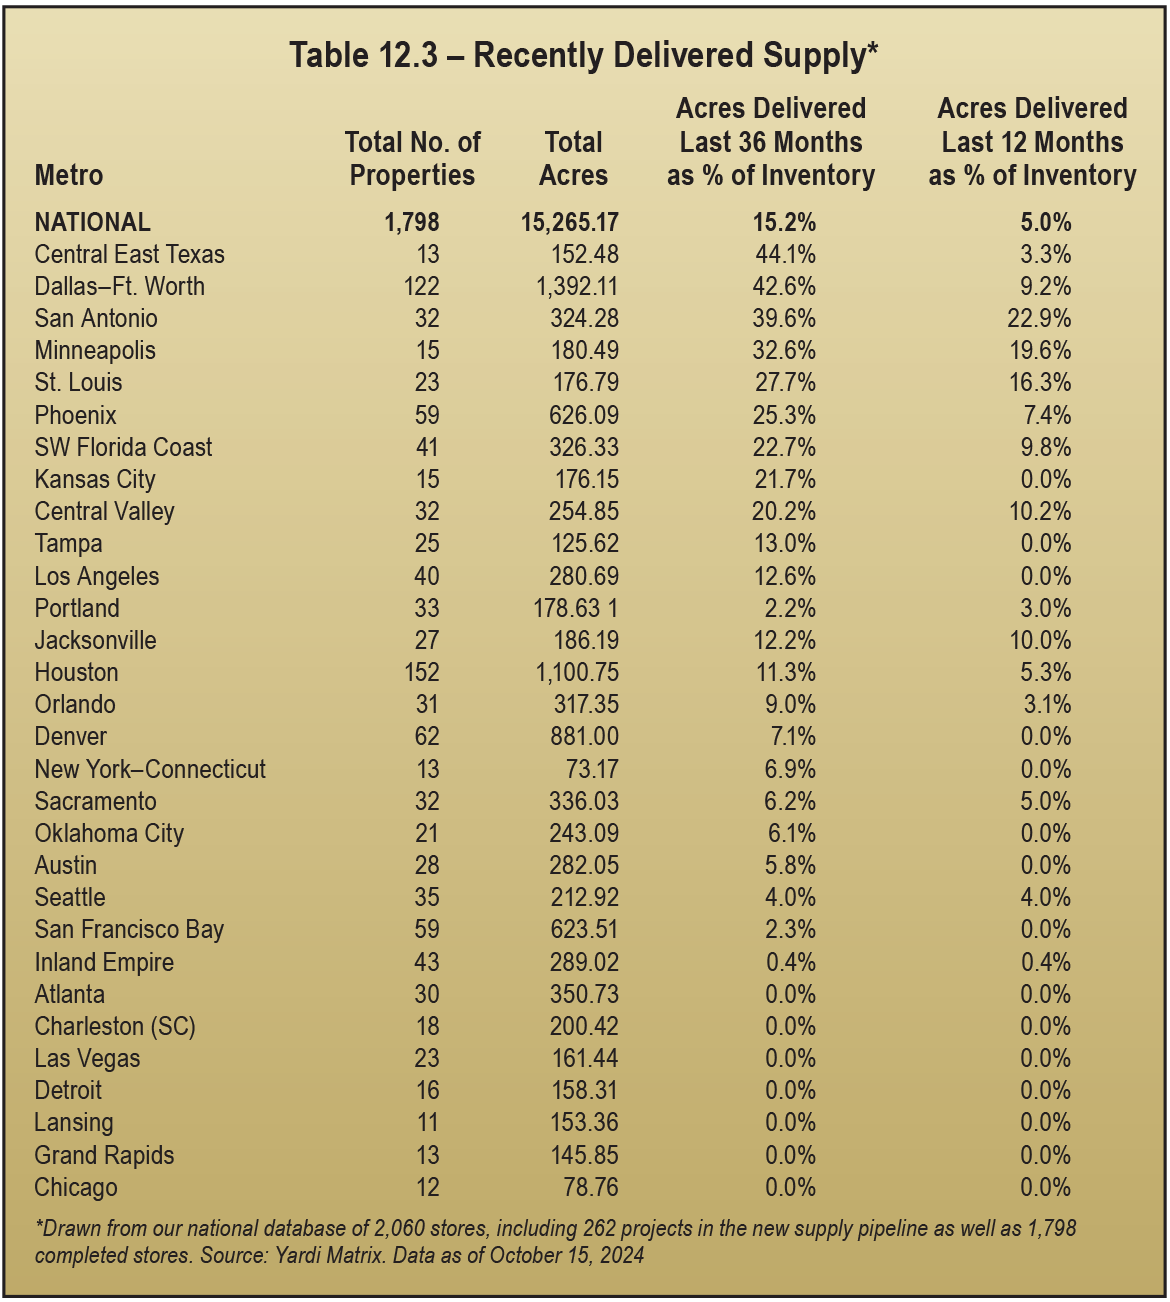
RV and boat registrations have both fallen from record levels in 2021, while at the same time construction of new dedicated RV and boat storage facilities has increased, particularly in smaller markets in the Midwest and Southeast. There is still a supply-demand imbalance caused by the increase in RV and boat sales during the pandemic and a lack of Class-A dedicated RV and boat storage properties nationally.
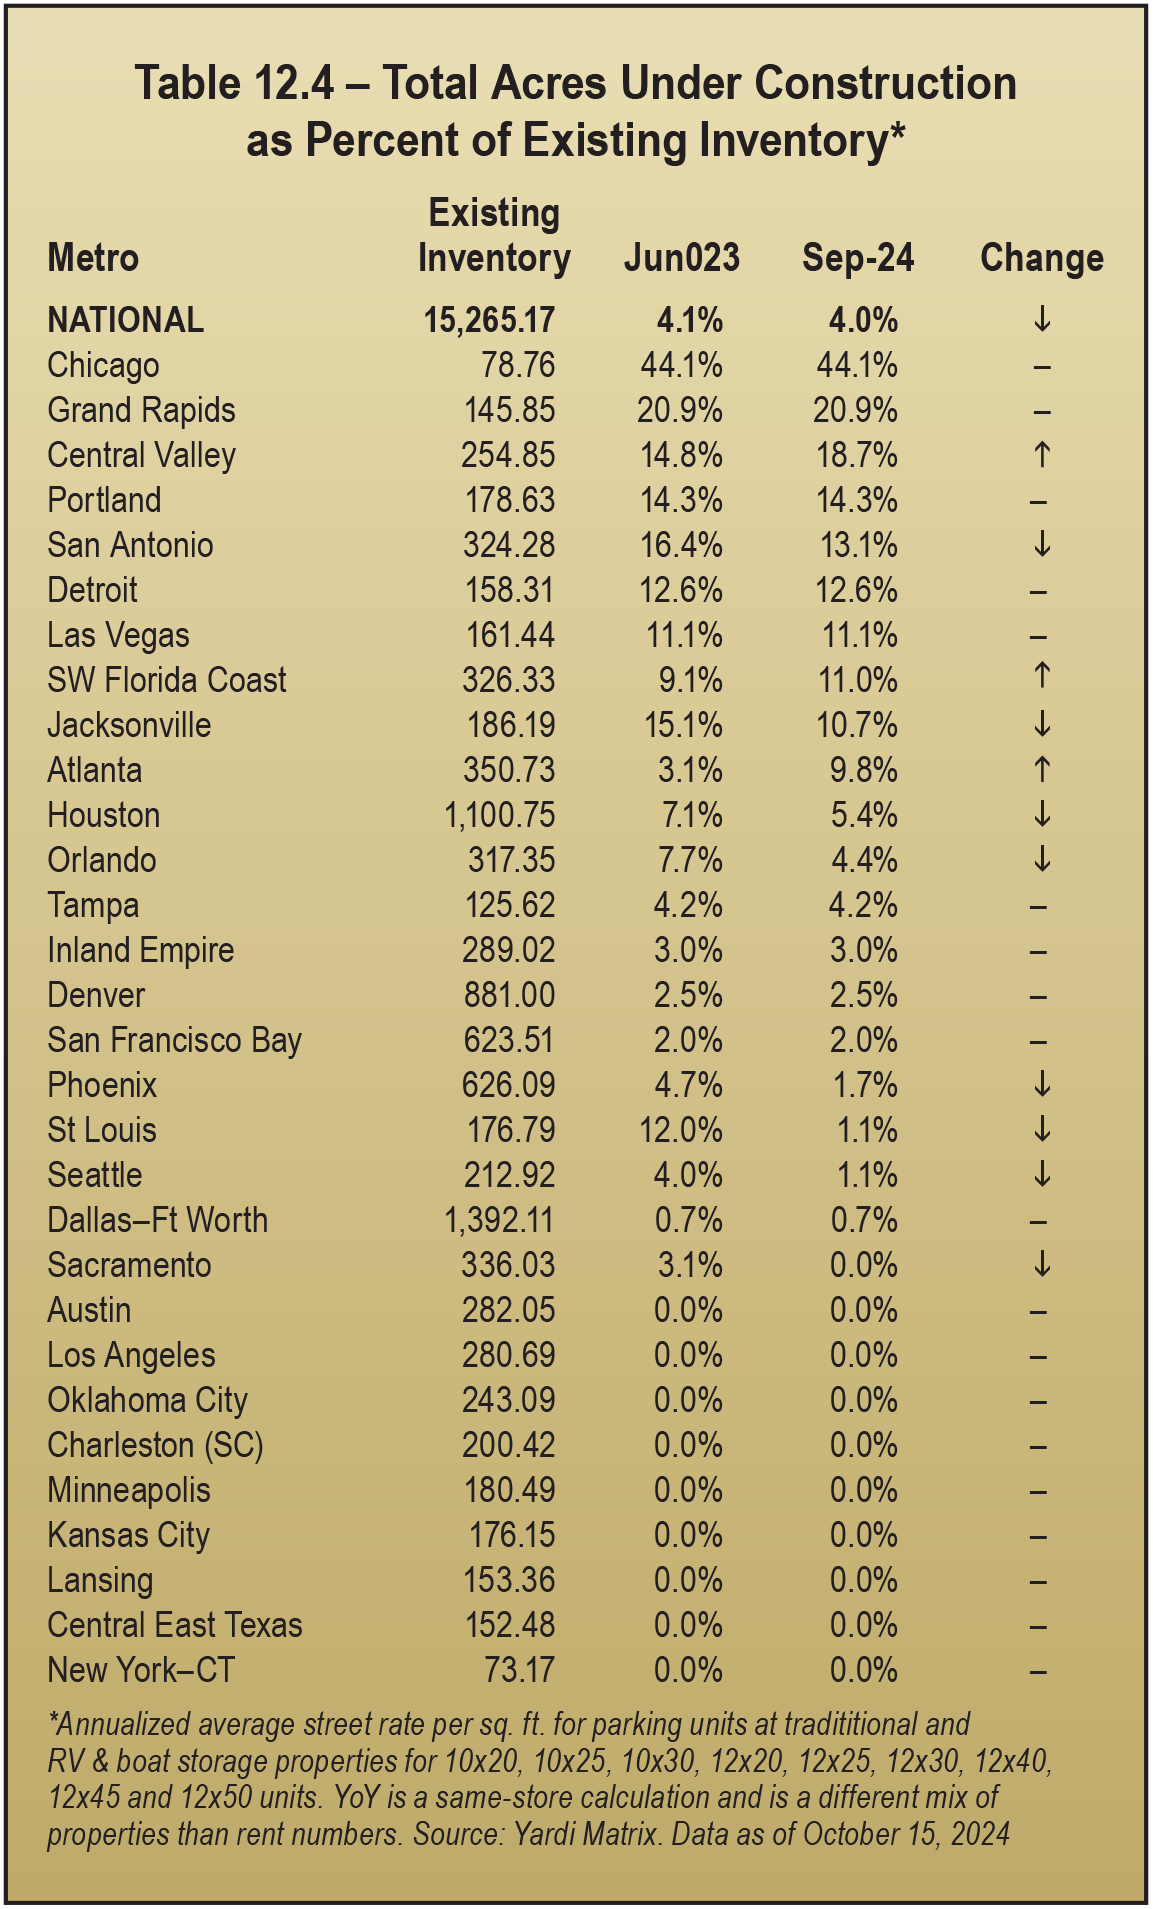
Development interest picked up over the summer, with Yardi Matrix tracking 56 dedicated RV and boat storage facilities under construction and 162 planned in September, an increase from June. Despite a growing pipeline, trailing 12-month completions (net rentable square feet) as a percent of stock was 4.4 percent, down 20 basis points in the past three months.
Sales of dedicated RV and boat storage properties picked up in the summer, with 16 sales since July, bringing the number of properties sold in 2024 to 39. Sales volume is still behind 2023, with about 342 acres sold by fall 2024, down nearly 30 percent from October 2023 year-to-date but higher than pre-pandemic years (2014 to 2020). Average sales price per acre was also down to $627,283, versus $685,774 in 2023 and $768,287 in 2022.
A few smaller Midwest markets like Minneapolis, Kansas City, Grand Rapids, and St. Louis have been seeing more resilient rent growth, despite some recently delivered supply in these places. On the other hand, Sun Belt markets with recent high migration have fared worse. Below-average growth in Atlanta, San Antonio, the Southwest Florida Coast, and Tampa corresponds with new dedicated RV and boat storage supply in these places and below-average self-storage rent growth.
Rate declines recently have been mostly concentrated in the smaller parking units. Only five markets saw flat or increasing rates in 10-by-20, 10-by-25, and 10-by-30 spaces, which are usually only suitable for personal vehicles, trailers, and boats. This compares to 15 markets with increasing rates in the larger unit sizes of 12-by-40, 12-by-45, and 12-by-50, which can fit a modern full-size recreational vehicle. Grand Rapids saw a 4.2 percent year-over-year increase in rents for large parking units, followed by Las Vegas at 3.8 percent growth, Kansas City with 2.8 percent growth, and the Bay Area with 2.1 percent growth.
Above-average supply has not had an impact on rent growth in Minneapolis, St. Louis, or Kansas City, which posted above-average rent growth in September. Conversely, Atlanta and Charleston have posted below-average rent growth despite no new dedicated RV and boat storage supply being built in the past three years. These markets could feel pressure from multiple new traditional self-storage properties that include substantial parking.
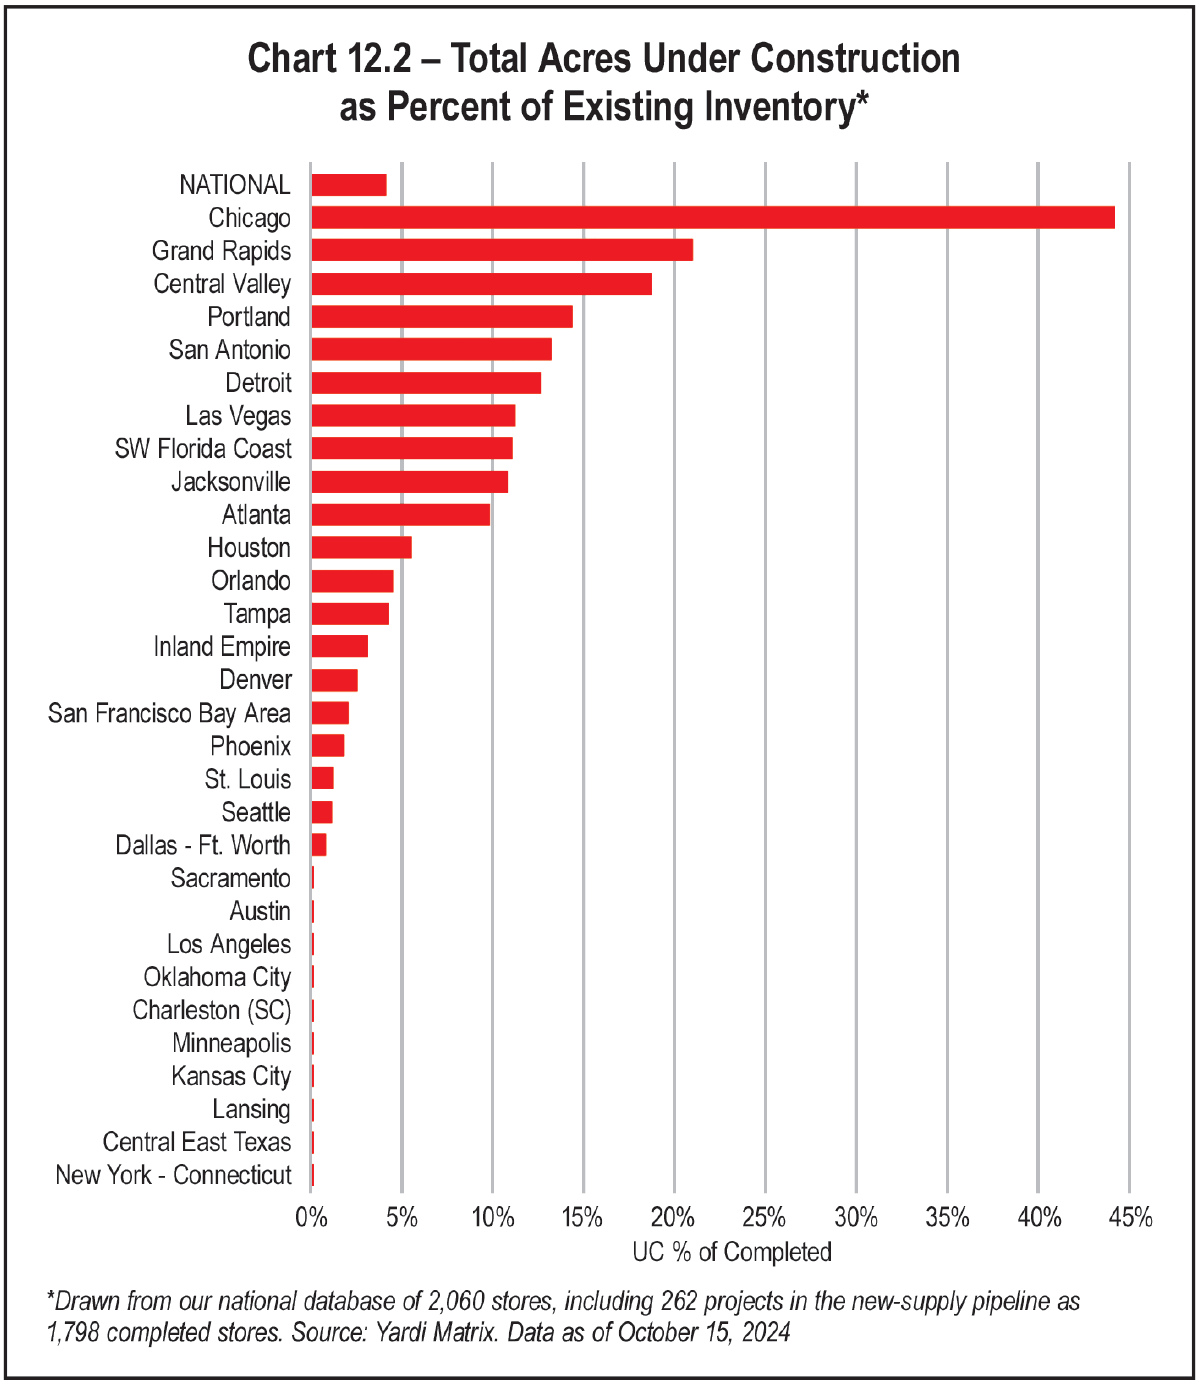
Total acres under construction as a percent of stock was 4 percent in September, a small 10-basis-point drop from the last report in July as developments have been completed, and a 50-basis-point decline from the three-year peak in October 2023. Construction financing and decline in rate growth are two potential reasons for a slowdown in construction activity. Despite this, three markets (the Central Valley of California, the Southwest Florida Coast, and Atlanta) have seen an increase in supply under construction since June as new projects have broken ground.