ow more than ever, having the right data is essential for the success of your self-storage business. As such, for over 30 years, the annual Self-Storage Almanac has provided the industry with the best data available. Over the years, how that data is collected has evolved, from handwritten paper surveys in the early days to data purchased outside the industry to highly refined data collected by companies that specialize explicitly in self-storage data.
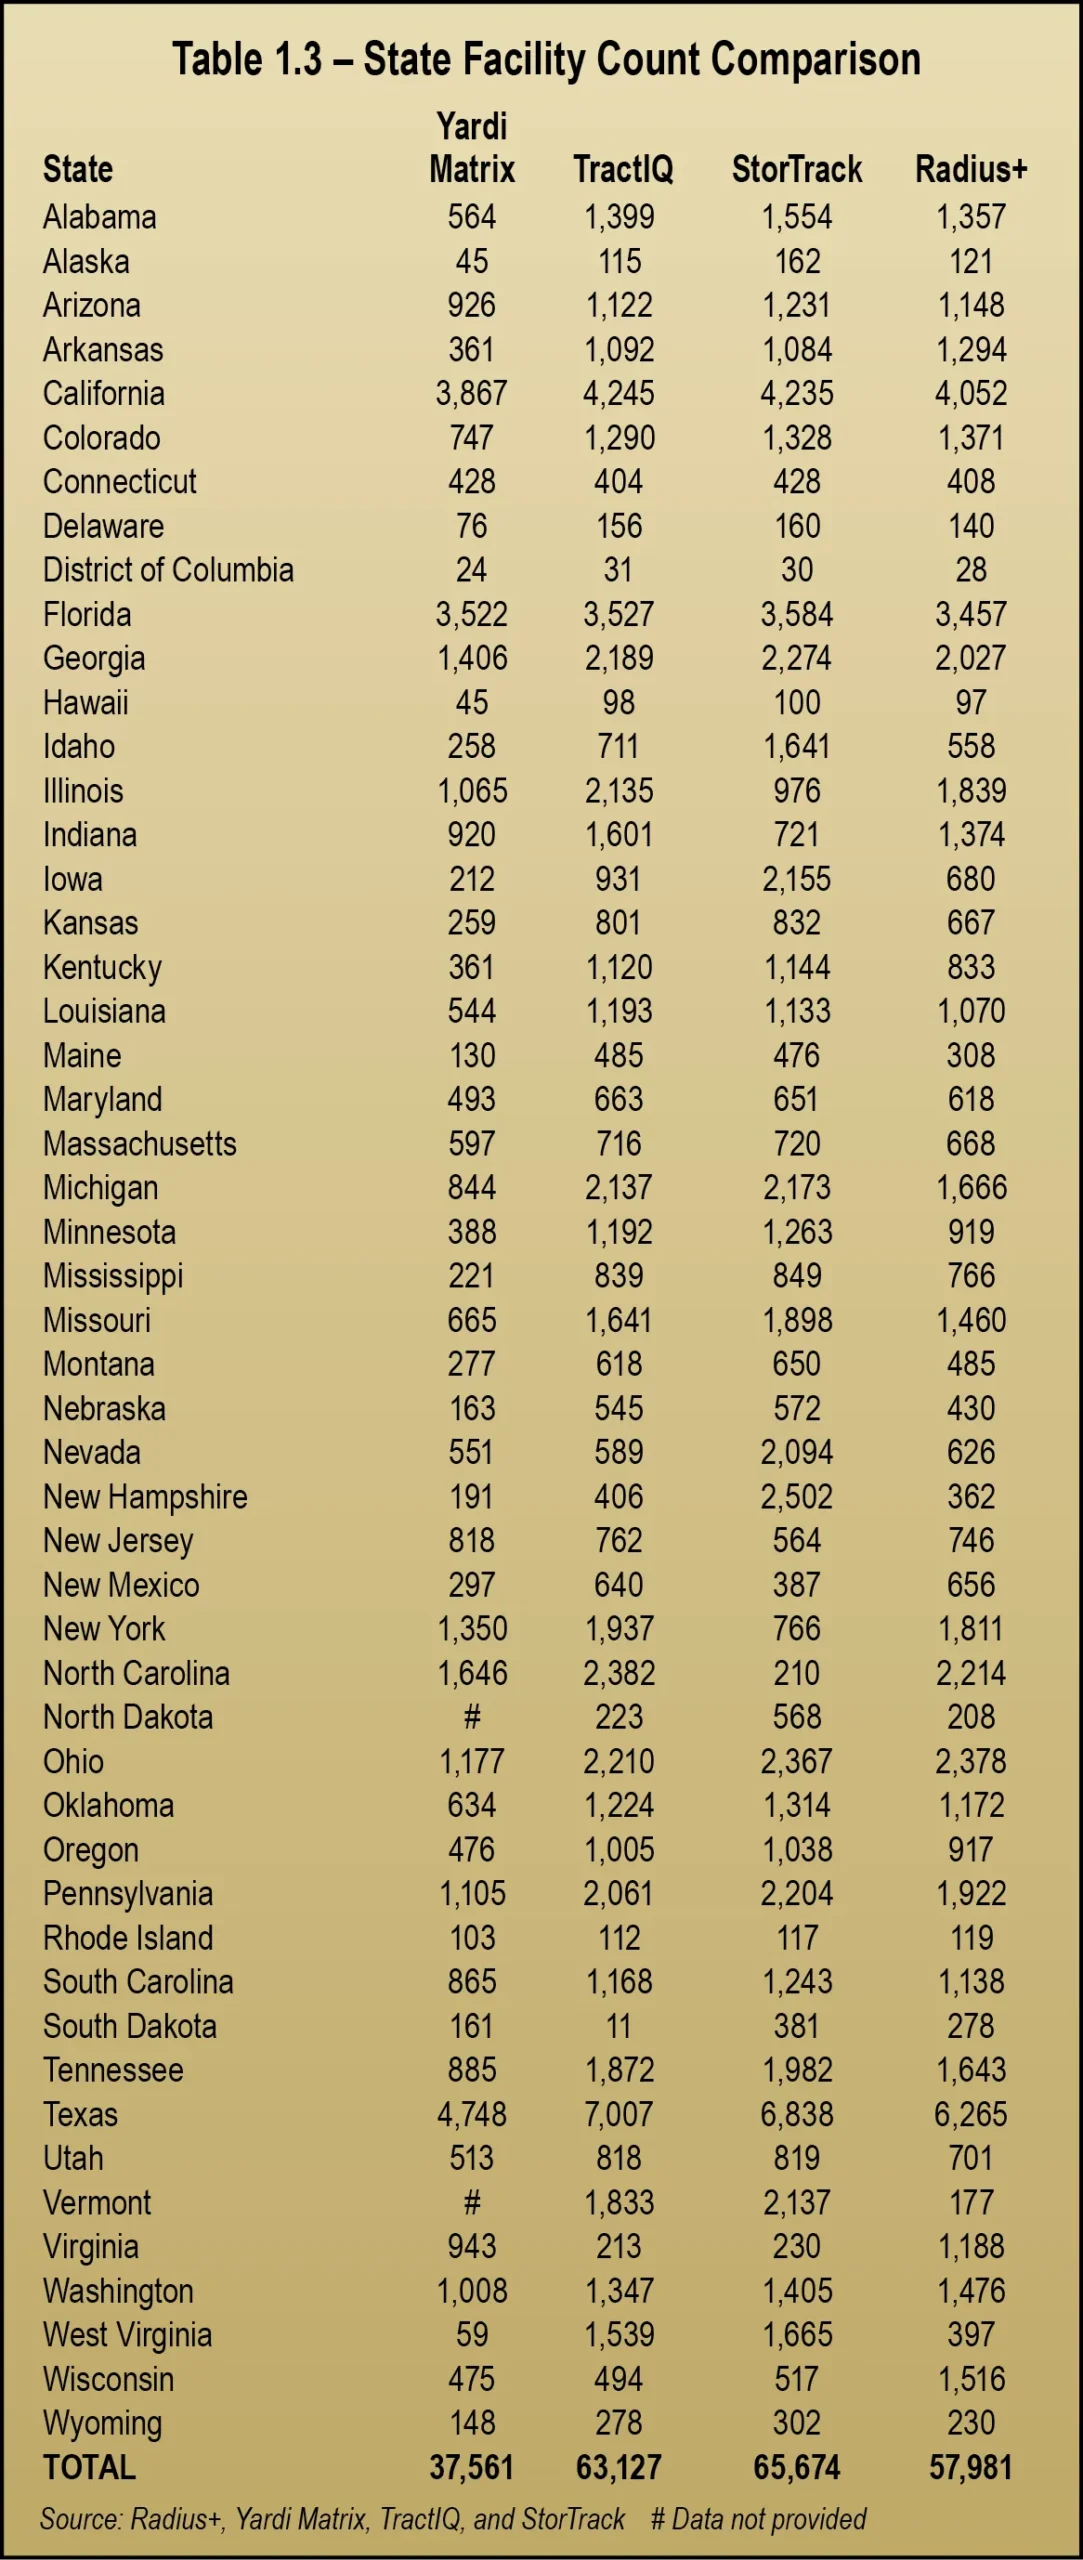
In 2017, Union Realtime (now Radius+) became the Almanac’s official data partner. Once again, this year, Radius+ is our data partner, providing state and CBSA data as well as occupancy and rental rate data. In this section, however, we will also compare state facility count data from several other prominent data sources in the industry. This aligns with our goal to continually provide the best data available.
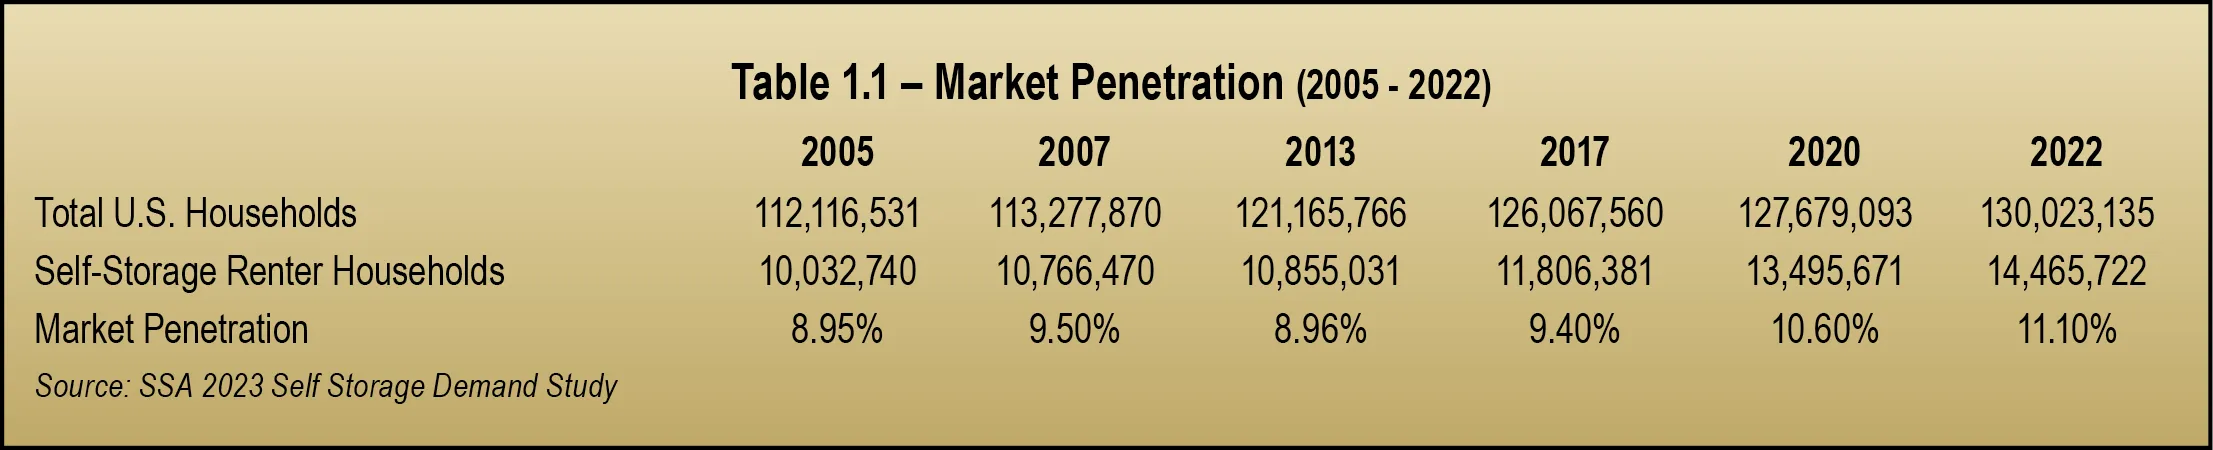
The SSA’s 2023 Self Storage Demand Study indicates that of 130,023,135 households in the U.S., 14,465,722 use self-storage, representing a market penetration of 11.1 percent. As seen in Table 1.1 below, market penetration has increased by 2.15 percent since 2005. Simplified, approximately 4,432,982 more households utilize self-storage today than in 2005. Moreover, since 2020, the industry has seen an uptick in market penetration of 970,051 households.
According to current projections, the self-storage industry is expected to experience significant growth in 2025, with the market size reaching approximately $68.75 billion. This growth represents a compound annual growth rate (CAGR) of 8.1 percent from 2024. Key drivers include a surge in mobility as more people plan to move, increased demand for short-term storage options, and a growing reliance on technology for online booking and virtual facility tours.
A surge in mobility continues to drive demand for self-storage operations. According to XPS Solutions, one of the most significant shifts expected for 2025 is the increase in moving activity across the United States. Recent data indicates that 37 percent of respondents are planning or considering a move in the next six to 12 months, up from 25 percent in early 2024.
Regarding rental rates, Argus states that while rates continued to fall in 2024, modest growth in 2025 is expected. Most markets’ rental rates will grow in the 2 percent to 3 percent range as demand starts to improve due to improving economic drivers and consumer confidence.
The Argus report also states that operators will be concerned about growing operating costs such as insurance, payroll, and real estate taxes. Reducing spending and office hours, implementing technology, and pushing for contactless rentals/payments will help with payroll costs. However, the industry will continue to see elevated real estate taxes and insurance costs for the foreseeable future.
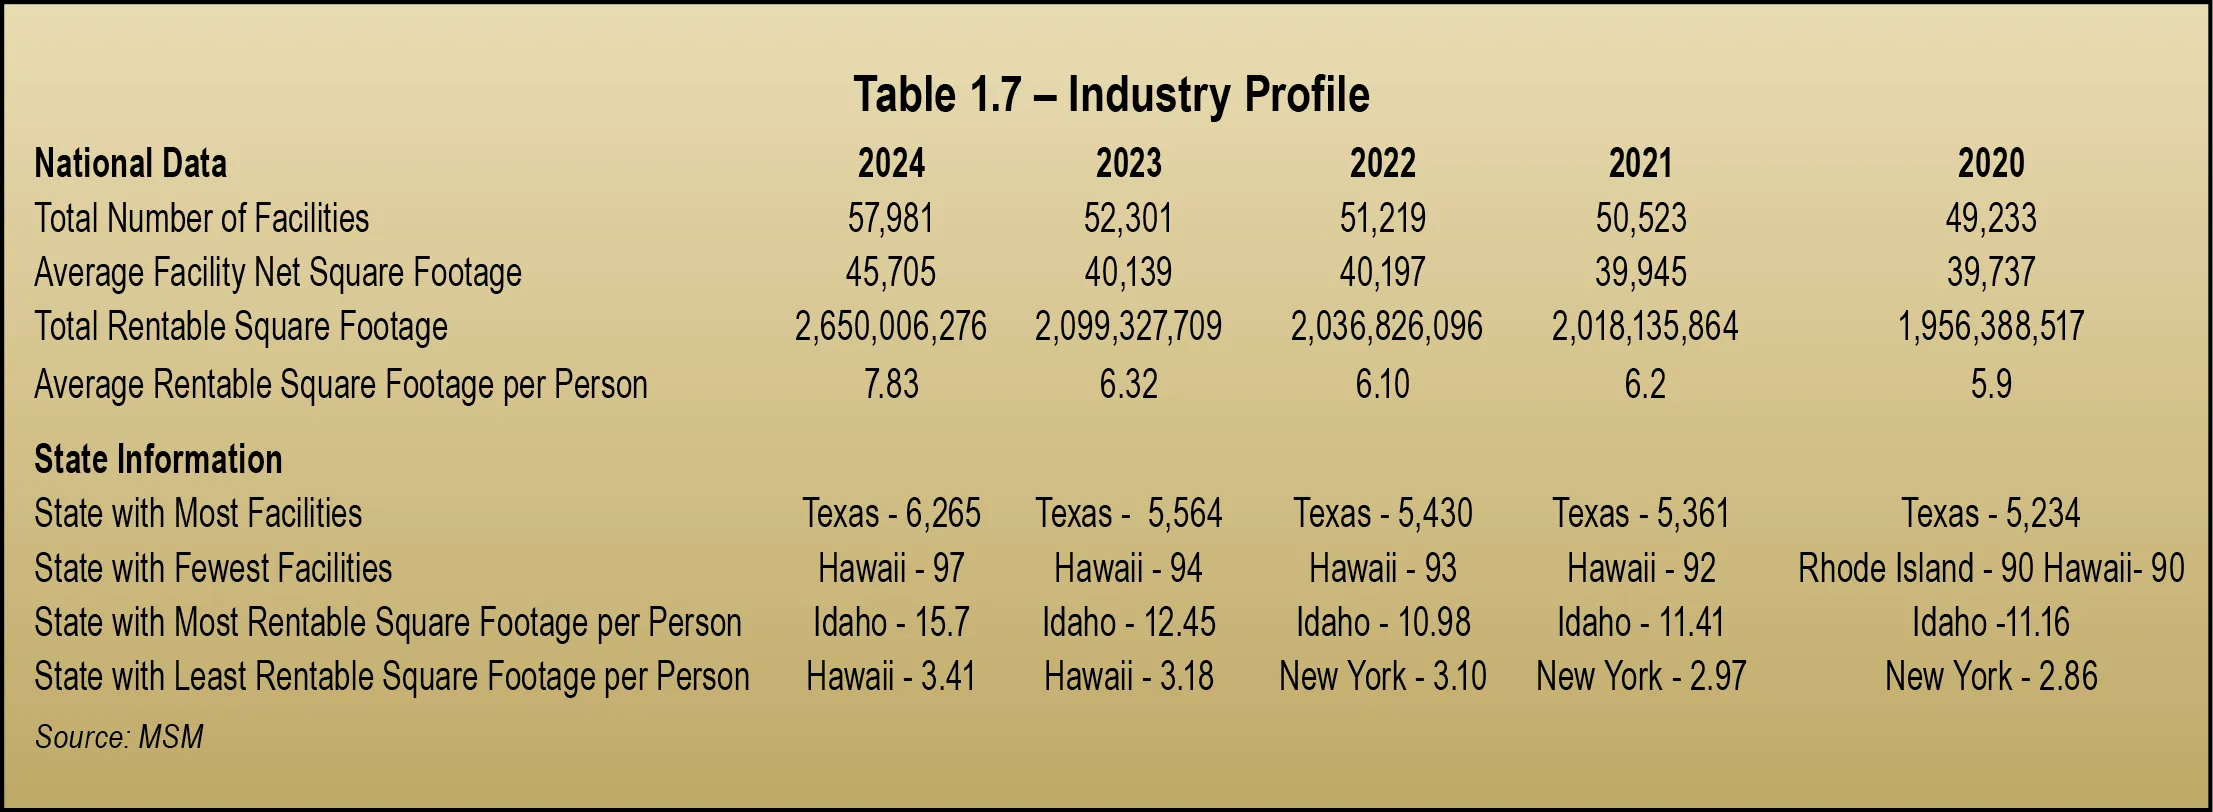
The industry’s total rentable square footage, according to Radius+, is 2,650,006,276, up from 2,099,327,709 last year, representing a gain of 550,678,567 square feet. This is substantially more than the increase of 62,501,613 from 2023.
Table 1.7 on page 19 looks at the industry profile for the past five years. Texas is still the state with the most self-storage facilities (6,265), while Hawaii still has the fewest (97). This equates to an increase of 701 and three facilities, respectively.
In line with data from the past five years, Idaho continues to have the highest rentable square footage per capita at 15.7. For the second year in a row, Hawaii has the lowest rentable square footage per person at 3.41.
A breakdown of this data by CBSA can be found in Section 13, Market Conditions, starting on page 143. Likewise, information for RV and boat storage can be found in Section 12, which starts on page 133.
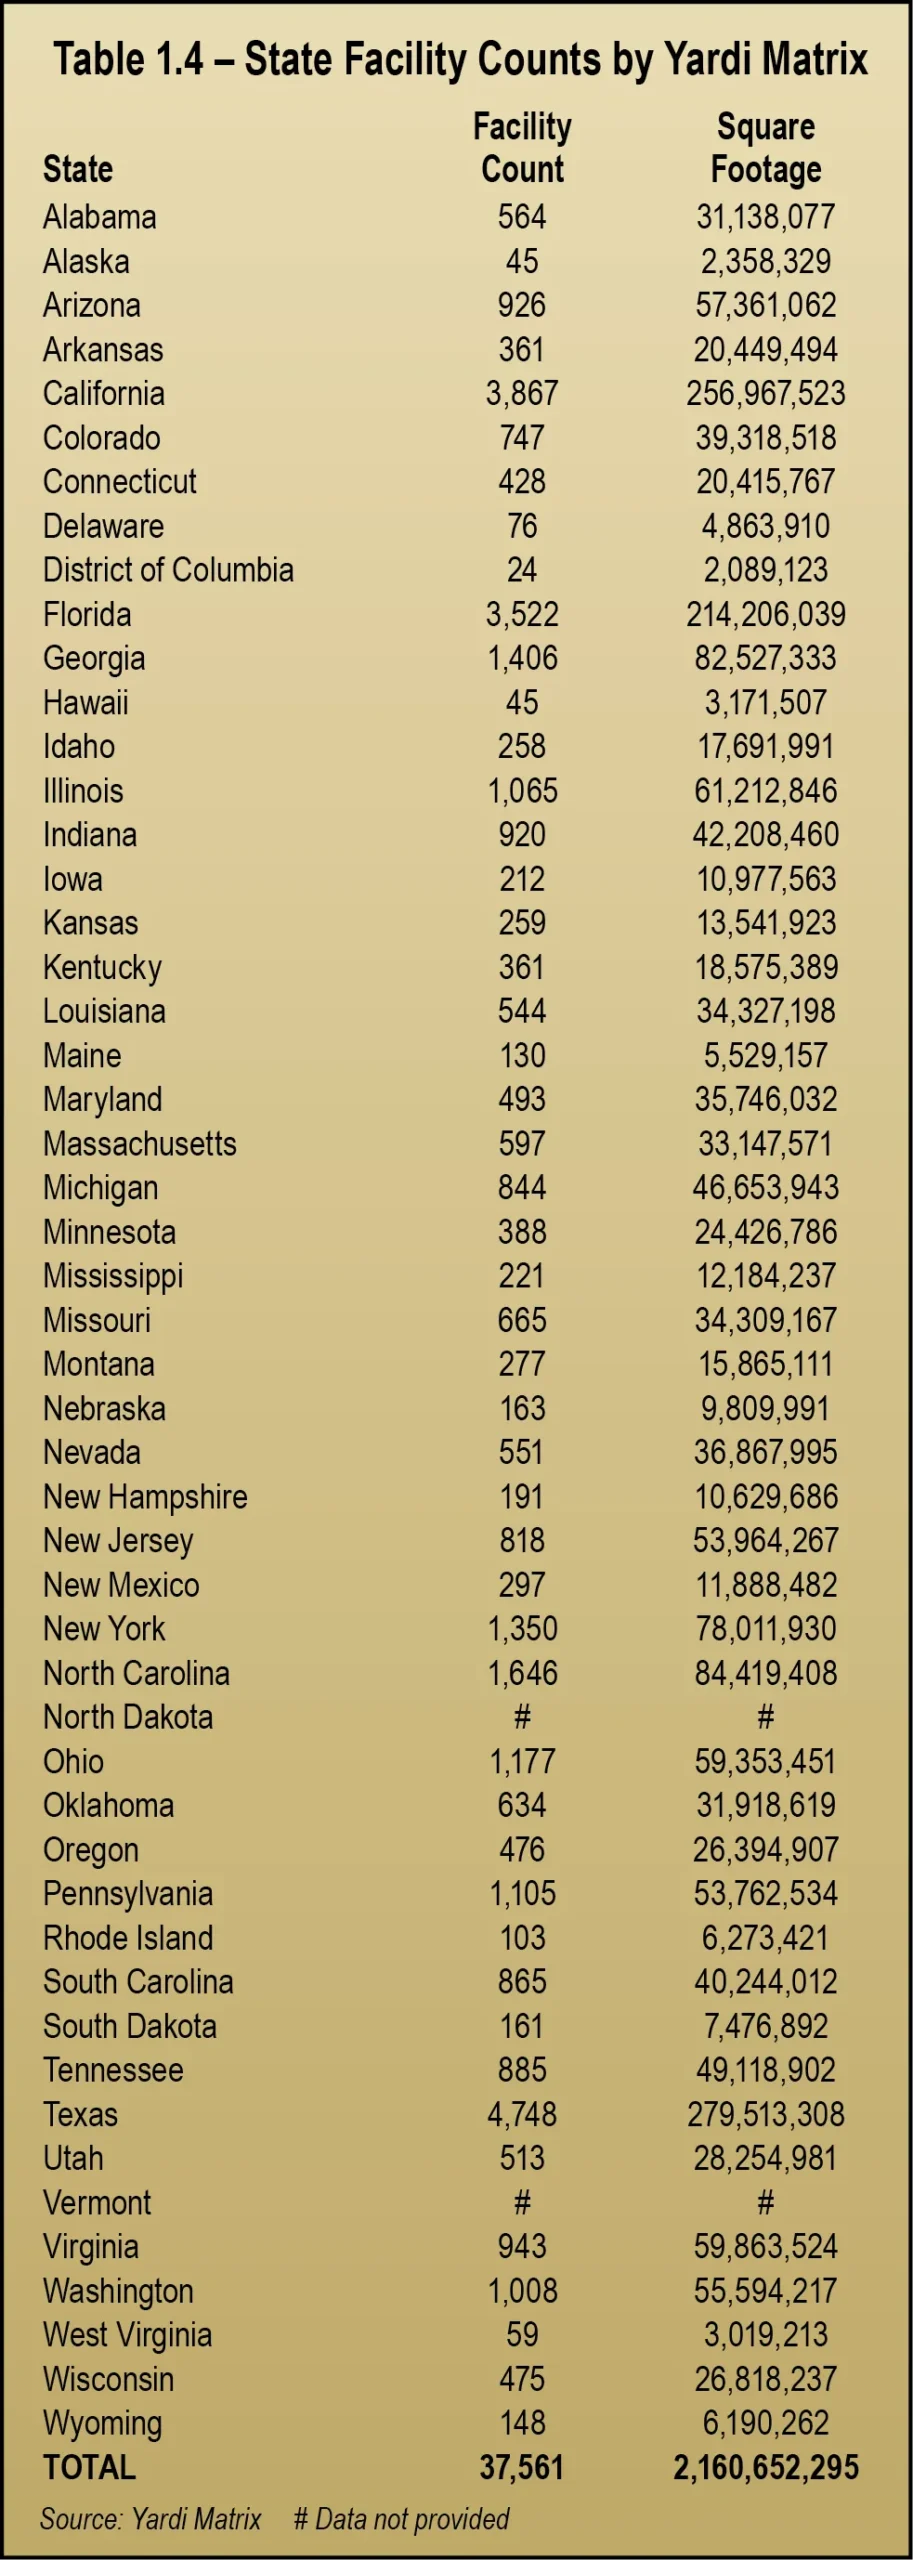
Yardi Matrix researches and compiles static and dynamic self-storage market data specific to individual self-storage properties and to general self-storage market conditions. The company’s research methods are formulated to allow quick and accurate access to the information that a wide spectrum of investors, owners, and developers need to maximize their business strategies.
Information is developed through a combination of original research calls from their research team representing themselves as consumers, industry studies, and various references to secondary sources. Its manner of sourcing and compiling information is defined within its subscription portal. See Table 1.4 on page 17.
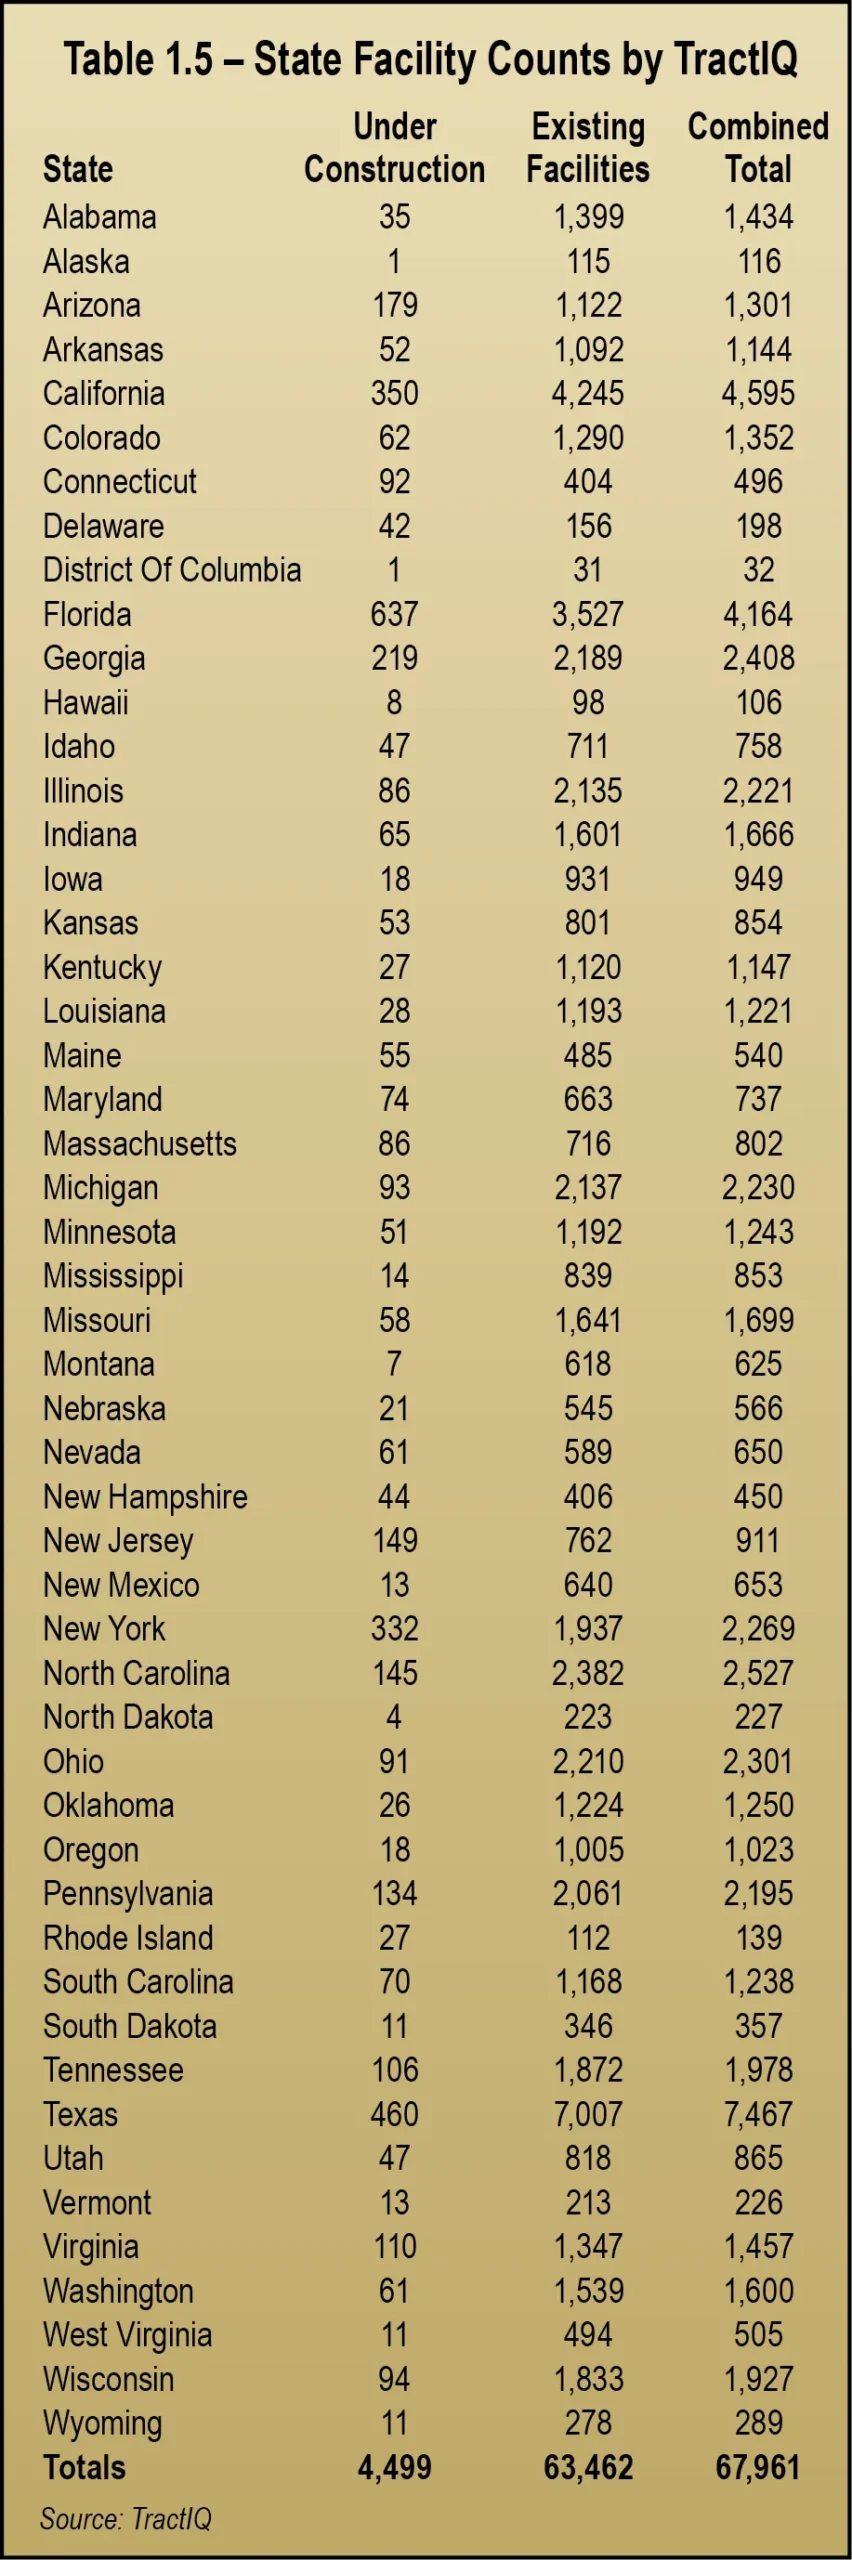
In terms of facility supply, TractIQ’s data pipelines continually interact with hundreds of sources across the internet to identify facilities. Every facility in its database is then reviewed by a qualified storage data expert to confirm not only its existence, size, and offering but also to uncover hard-to-find metadata like owner information. Additionally, users continuously help by verifying site information as sites are built, expand, and change hands.
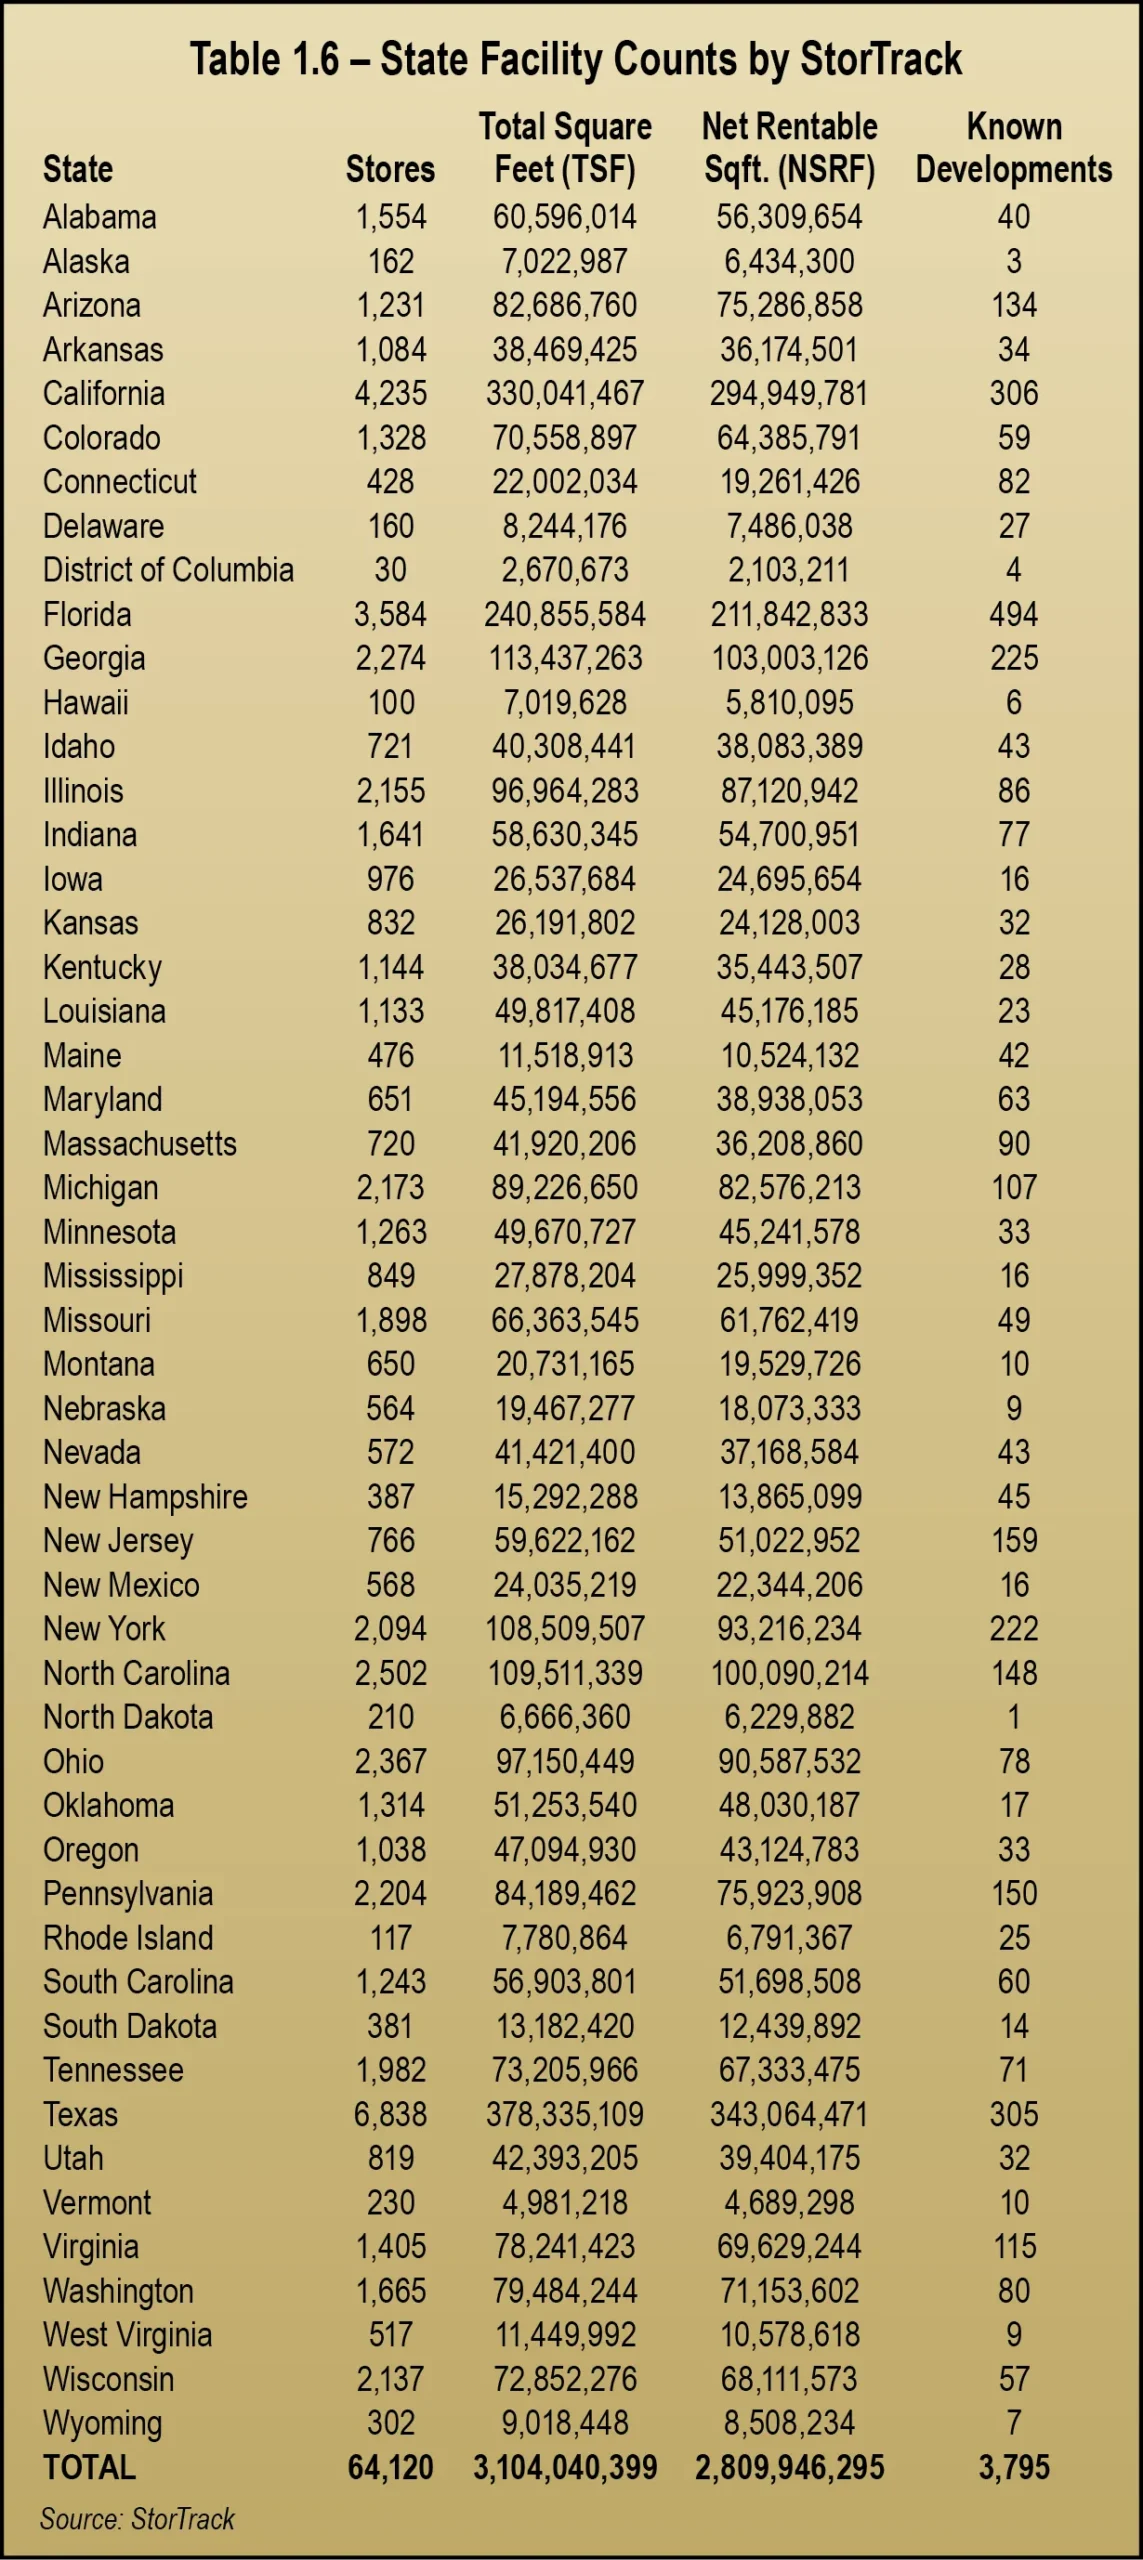
StorTrack has been helping self-storage professionals get the insights they need to make smarter, data-driven decisions since 2014. The company’s extensive data coverage spans not only the United States but also Canada, the U.K., Europe, Australasia, and parts of Asia. With a database that now includes over 90,000 facilities around the world, including boat and RV storage facilities, StorTrack provides the reliable data needed for market analysis, pricing strategies, and development planning.
StorTrack identifies self-storage facilities using a wide range of sources, including internet searches, business directories, news articles, and public records. This comprehensive approach ensures that it captures a broad and accurate view of the market, covering both well-known facilities and smaller, independently operated properties.
The Radius+ process for validating storage is proprietary, but the company states that it hand maps every facility to ensure they meet its definition of self-storage and to ensure accuracy of square footage, climate mix, name, and open date.