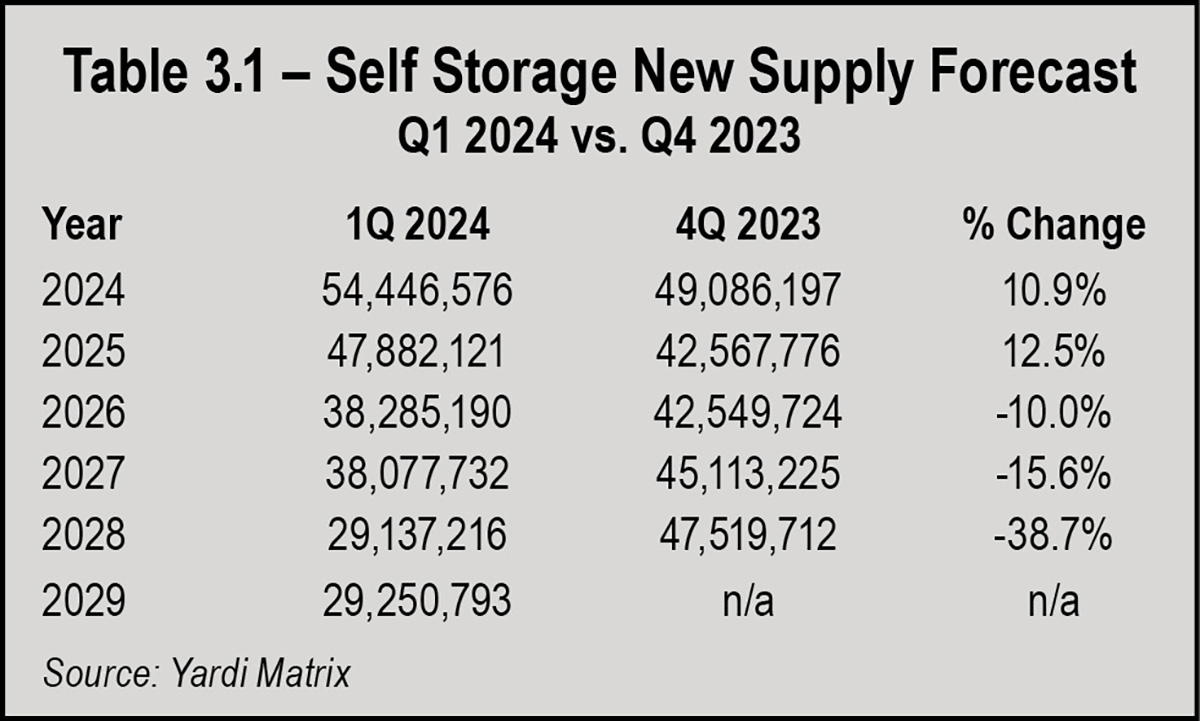
he Q1 2024 self-storage supply forecast update has increased forecast deliveries for 2024 and 2025. For the later years, the forecast has been reduced. See Table 3.1 at the right.
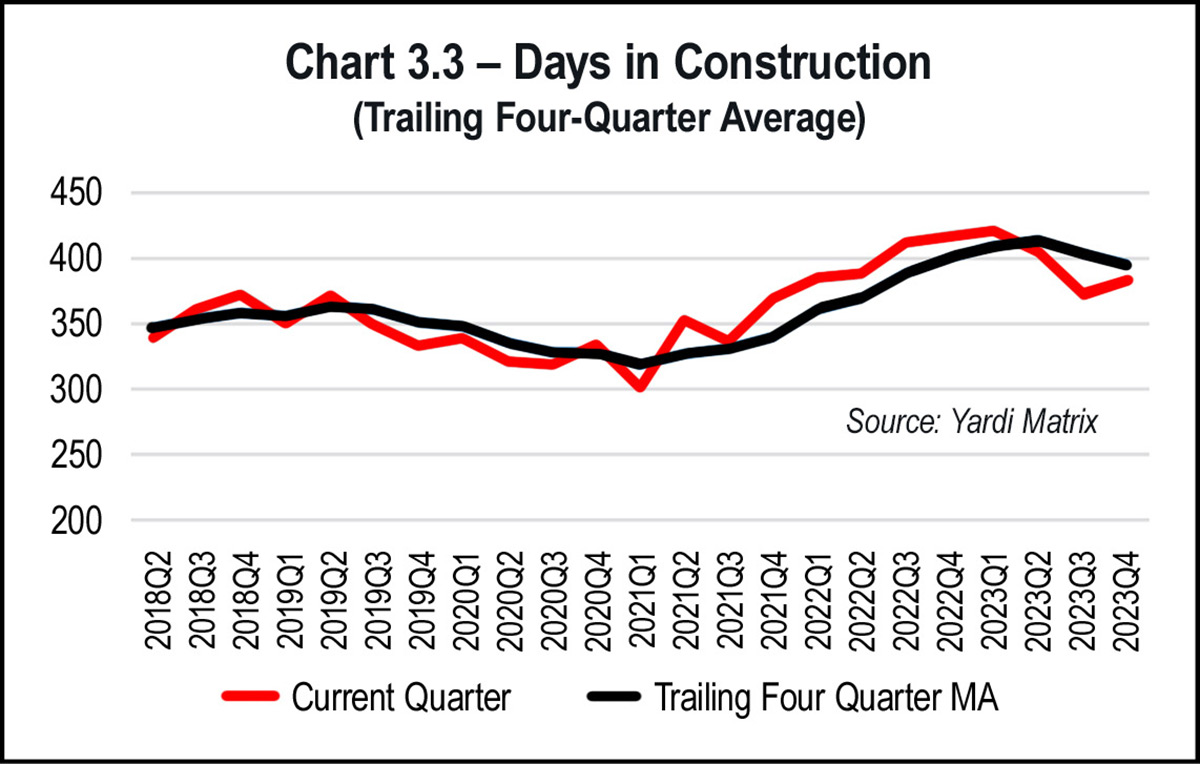
Days in construction continues to moderate, albeit at levels well above long-term averages. To date, Yardi’s database has identified 124 properties completed in Q4 2023, on average in 383 days. This is slightly above Q3 2023’s 372 average days in construction, but still below the trailing four-quarter average of 395 days. See Chart 3.3 on page 28.
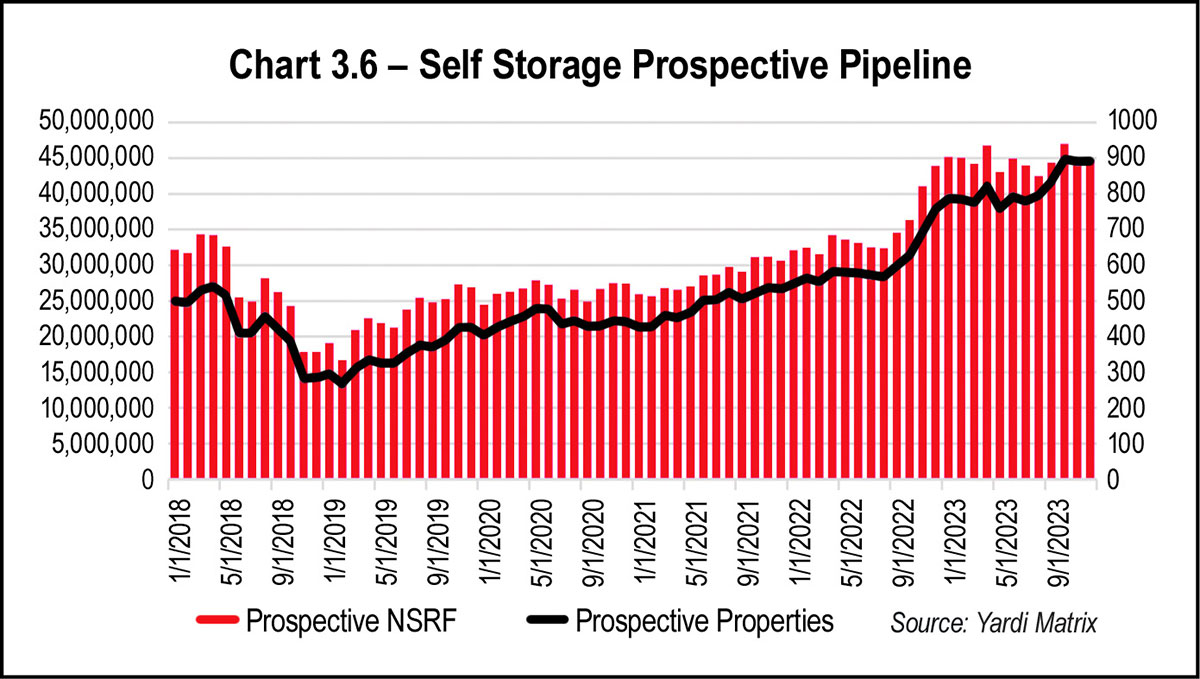
After increasing noticeably in late 2022, the prospective pipeline has been flat for most of 2023. Currently, there are 44.8 million NRSF in the prospective pipeline, a 1.0 percent increase quarter-over-quarter and a 2.06 percent increase year over year. See Chart 3.6 on the opposite page.
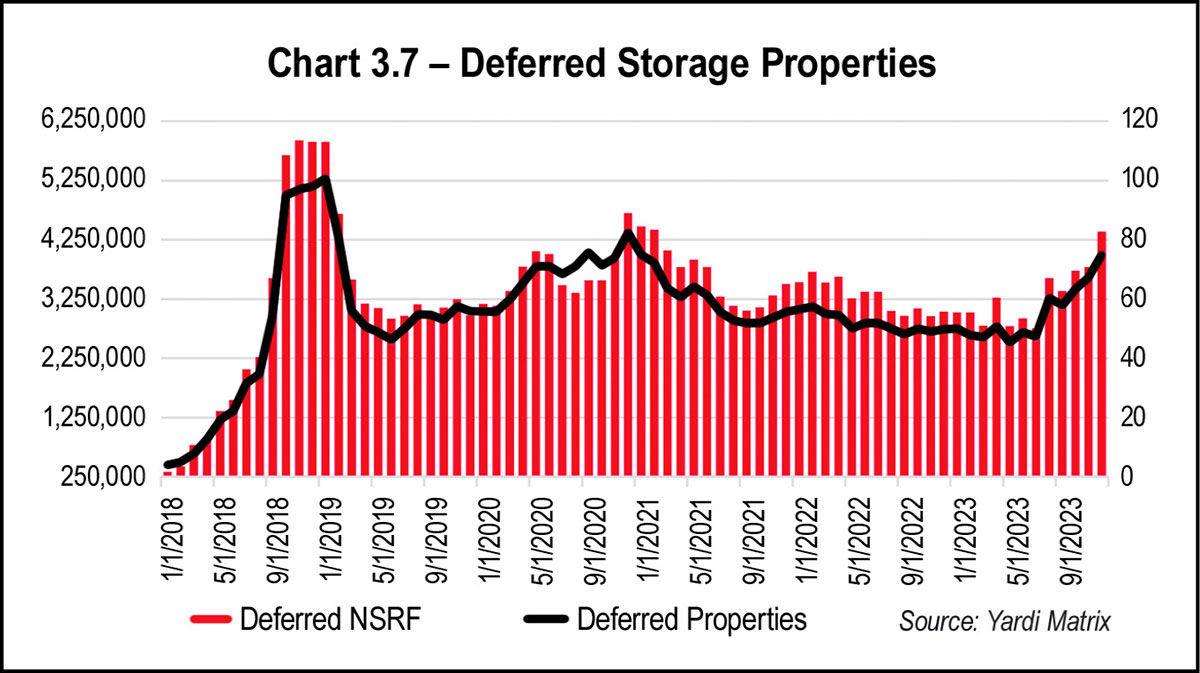
Since mid-year 2023, the number of properties with a deferred status has increased substantially. Currently, 78 properties totaling 4.39 million NRSF are categorized as deferred, a 29.6 percent increase quarter over quarter and a 44.5 percent increase year over year. See Chart 3.7 on the opposite page.
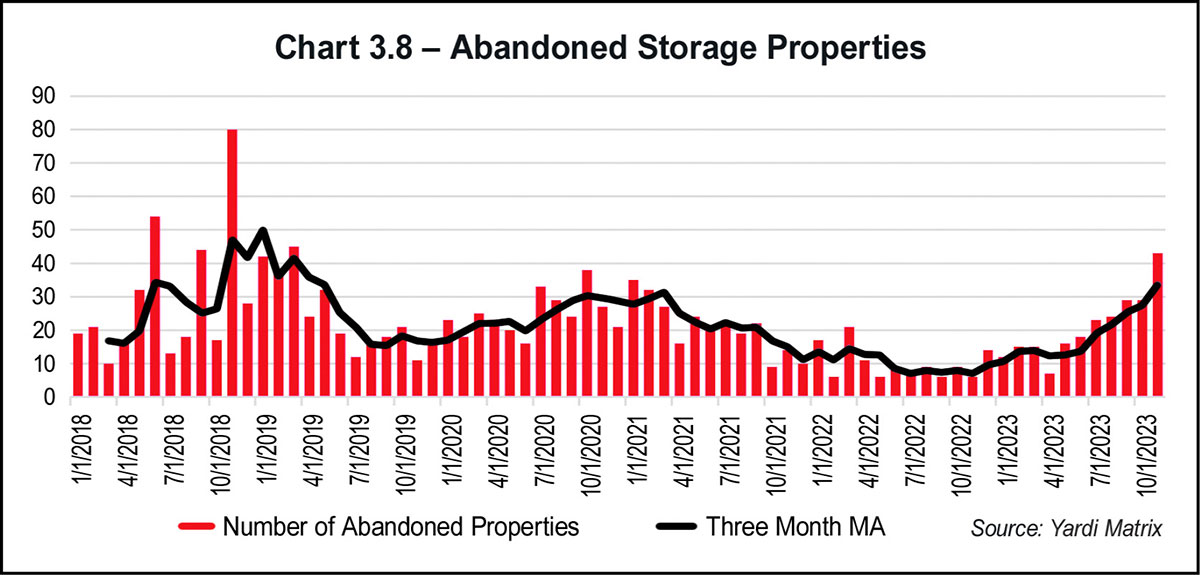
The number of abandoned storage properties increased throughout 2023. On average, eight properties per month entered abandoned status during the latter half of 2022; in November 2023, 44 properties entered abandoned status. For full year 2023, 245 properties have been categorized as abandoned, a 104.2 percent increase over the level recorded in 2022. See Chart 3.8 below right.
