here’s cautious optimism for self-storage REITs despite mixed Q1 2025 performance. The self-storage REITs reported mixed Q1 2025 results, with mostly flat but improving trends in same-store performance. Revenue and NOI growth averaged 0.1 percent and -1.1 percent year over year, respectively, driven by a modest occupancy decline (average 90.2 percent, down 30 bps) and a slight uptick in achieved rents (up 0.2 percent). The rent growth turnaround reflects accelerating advertised rates early in the year, leading to the first sequential revenue improvement since Q1 2022. Market-level performance was uneven; urban markets like Chicago and New York outperformed, while Sun Belt regions such as Atlanta, Phoenix, and Southwest Florida struggled with elevated supply and softer demand. Despite ongoing headwinds, REITs expressed cautious optimism for a return to more normalized performance later in 2025.
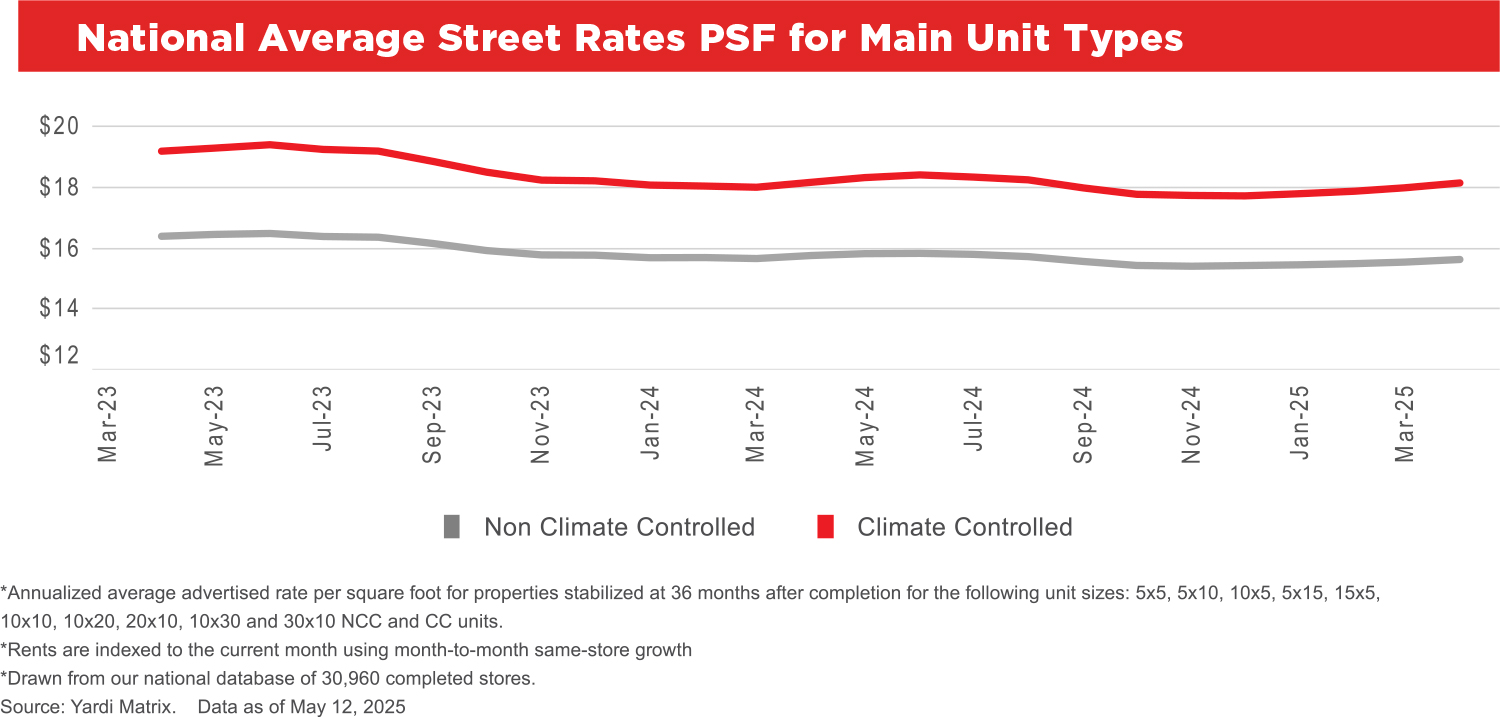
Many top metros saw advertised rates increase year over year. Nationwide advertised rate growth remains negative year over year. However, rates are declining at a much slower rate than in the past two years. National advertised rates were down 0.4 percent year over year in April, with an annualized average rent per square foot of $16.66 for the combined mix of unit sizes and types. This is a slight drop from -0.2 percent in March and an improvement from -0.8 percent in February and -1.1 percent in January.
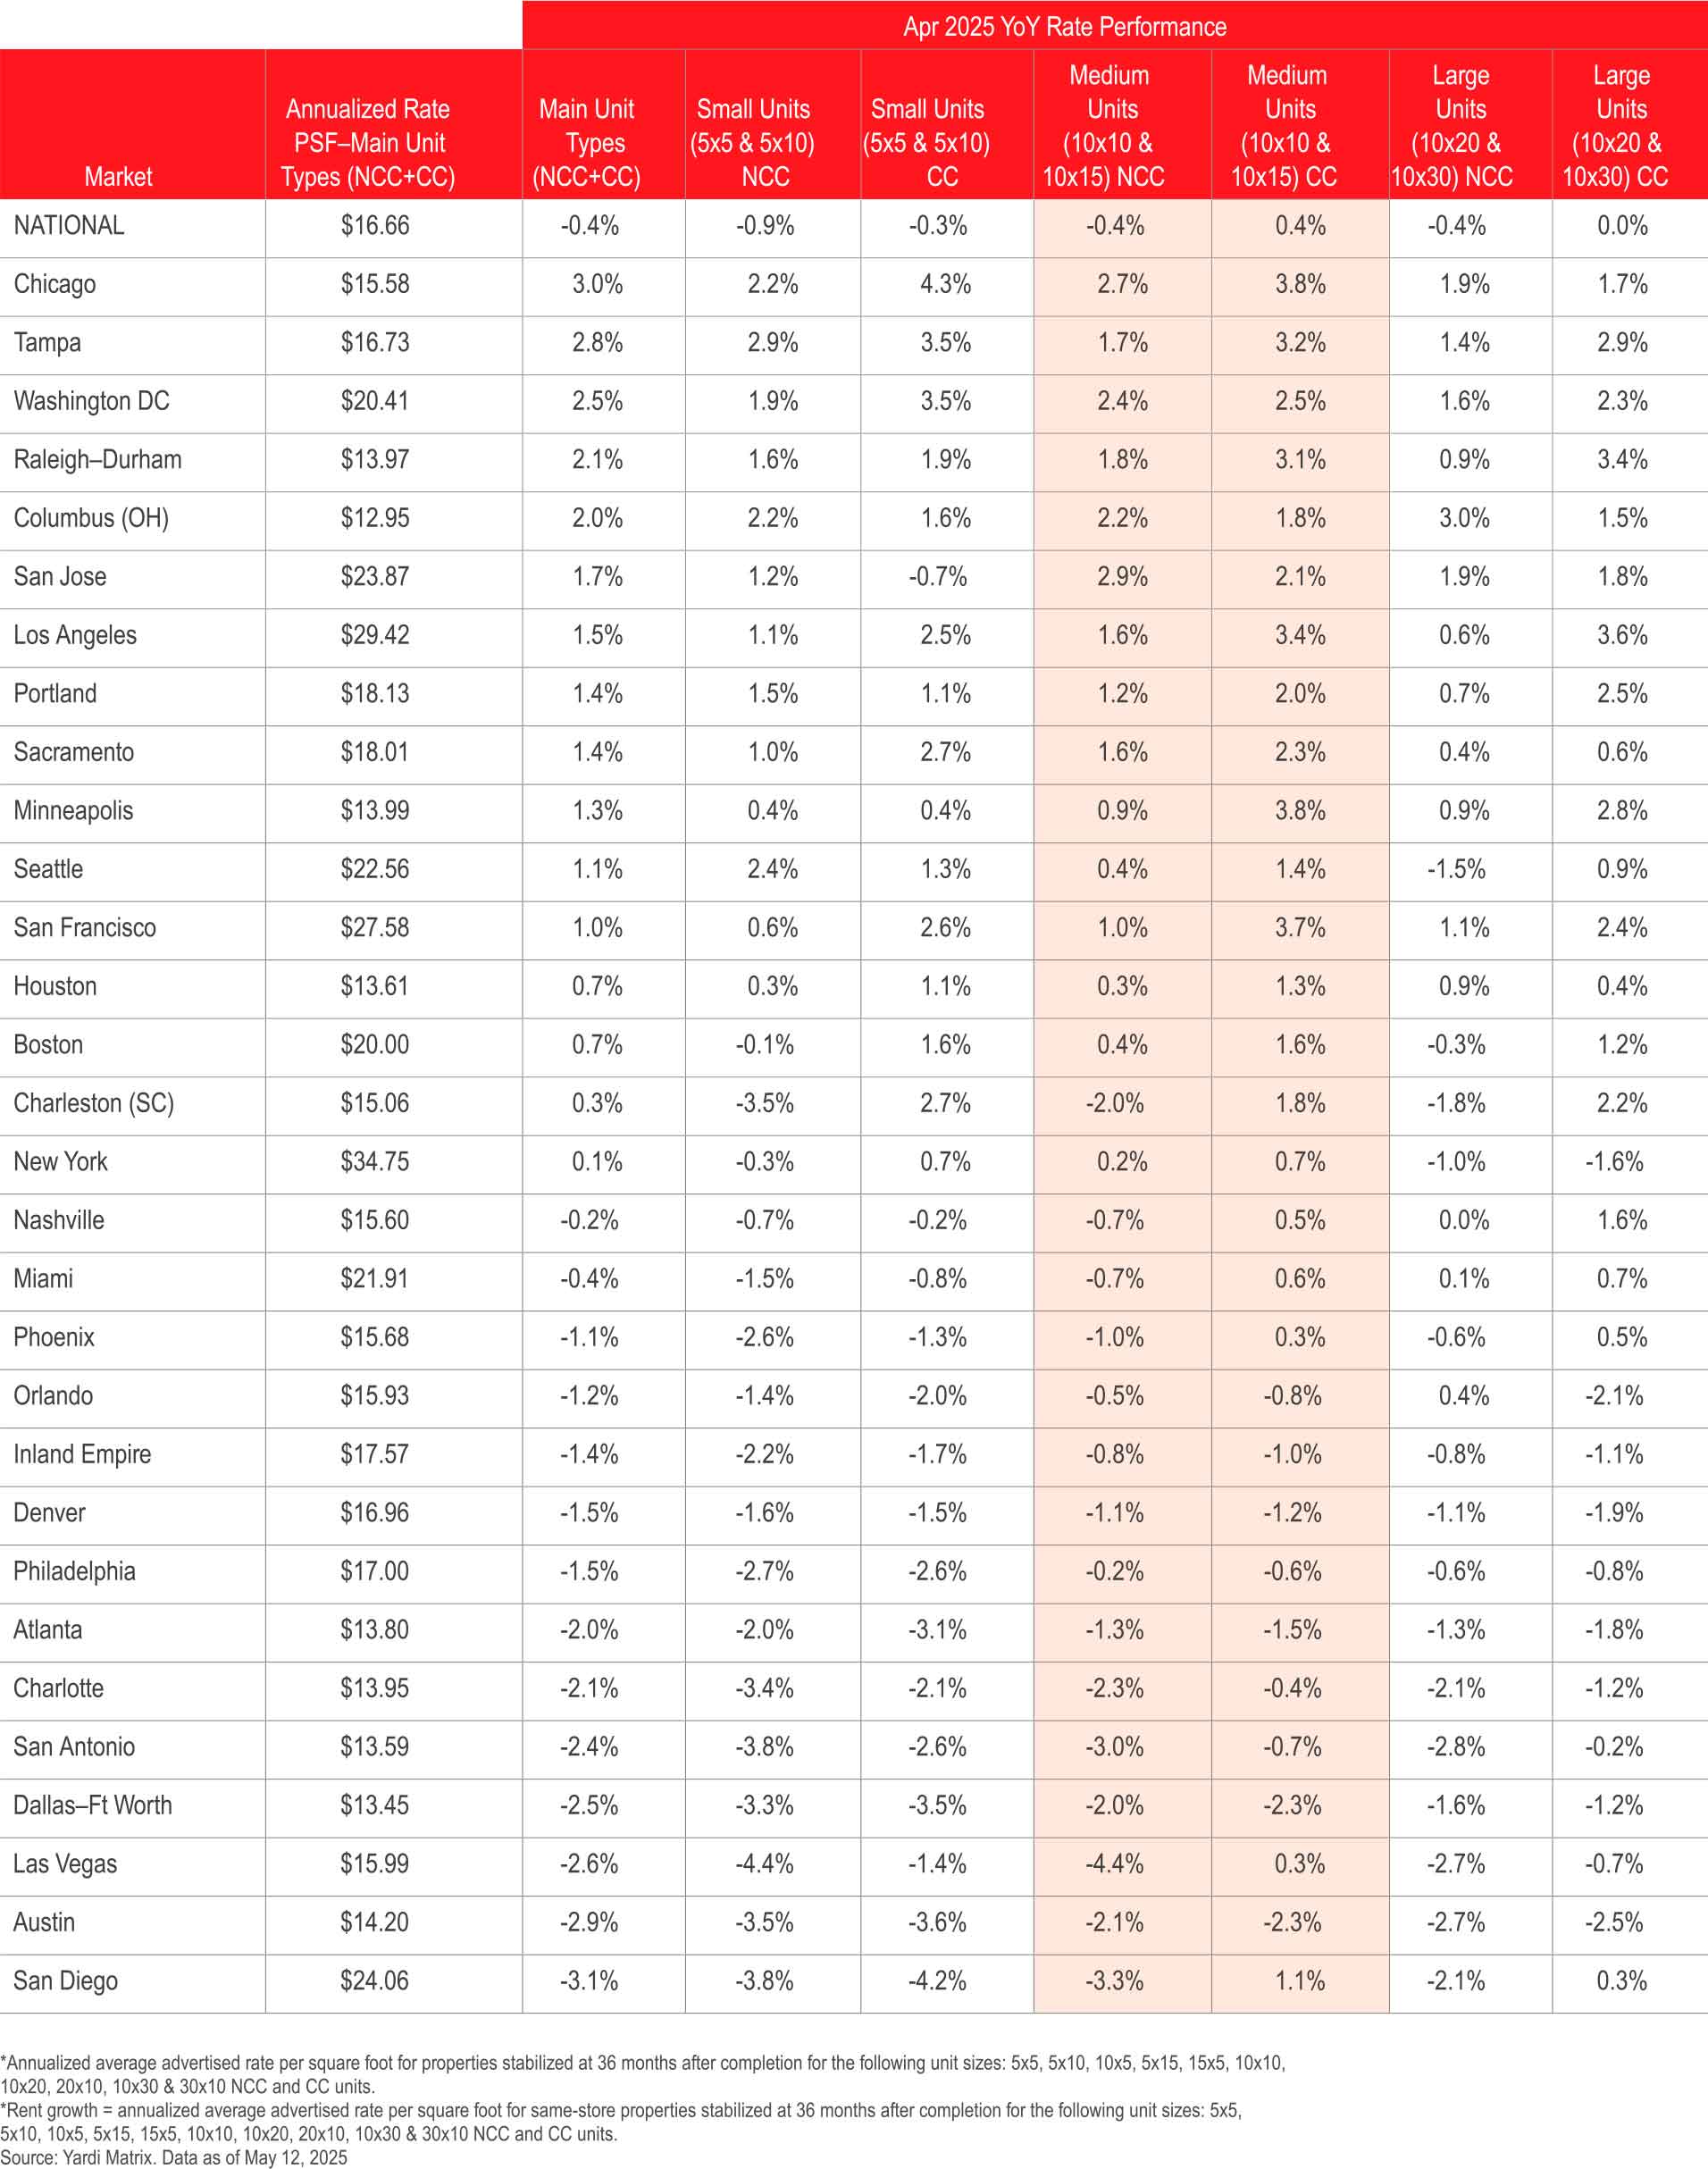
Roughly half of the Yardi Matrix top metros saw advertised rates improve year over year in April. Same-store rates for non-climate-controlled (NCC) units increased in 14 of the top 30 metros. For climate-controlled (CC) units, rates increased in 17 of the top 30 metros year over year. While most top metros saw rate growth decelerate from last month, all of the top 30 have seen rate growth accelerate compared to April 2024.
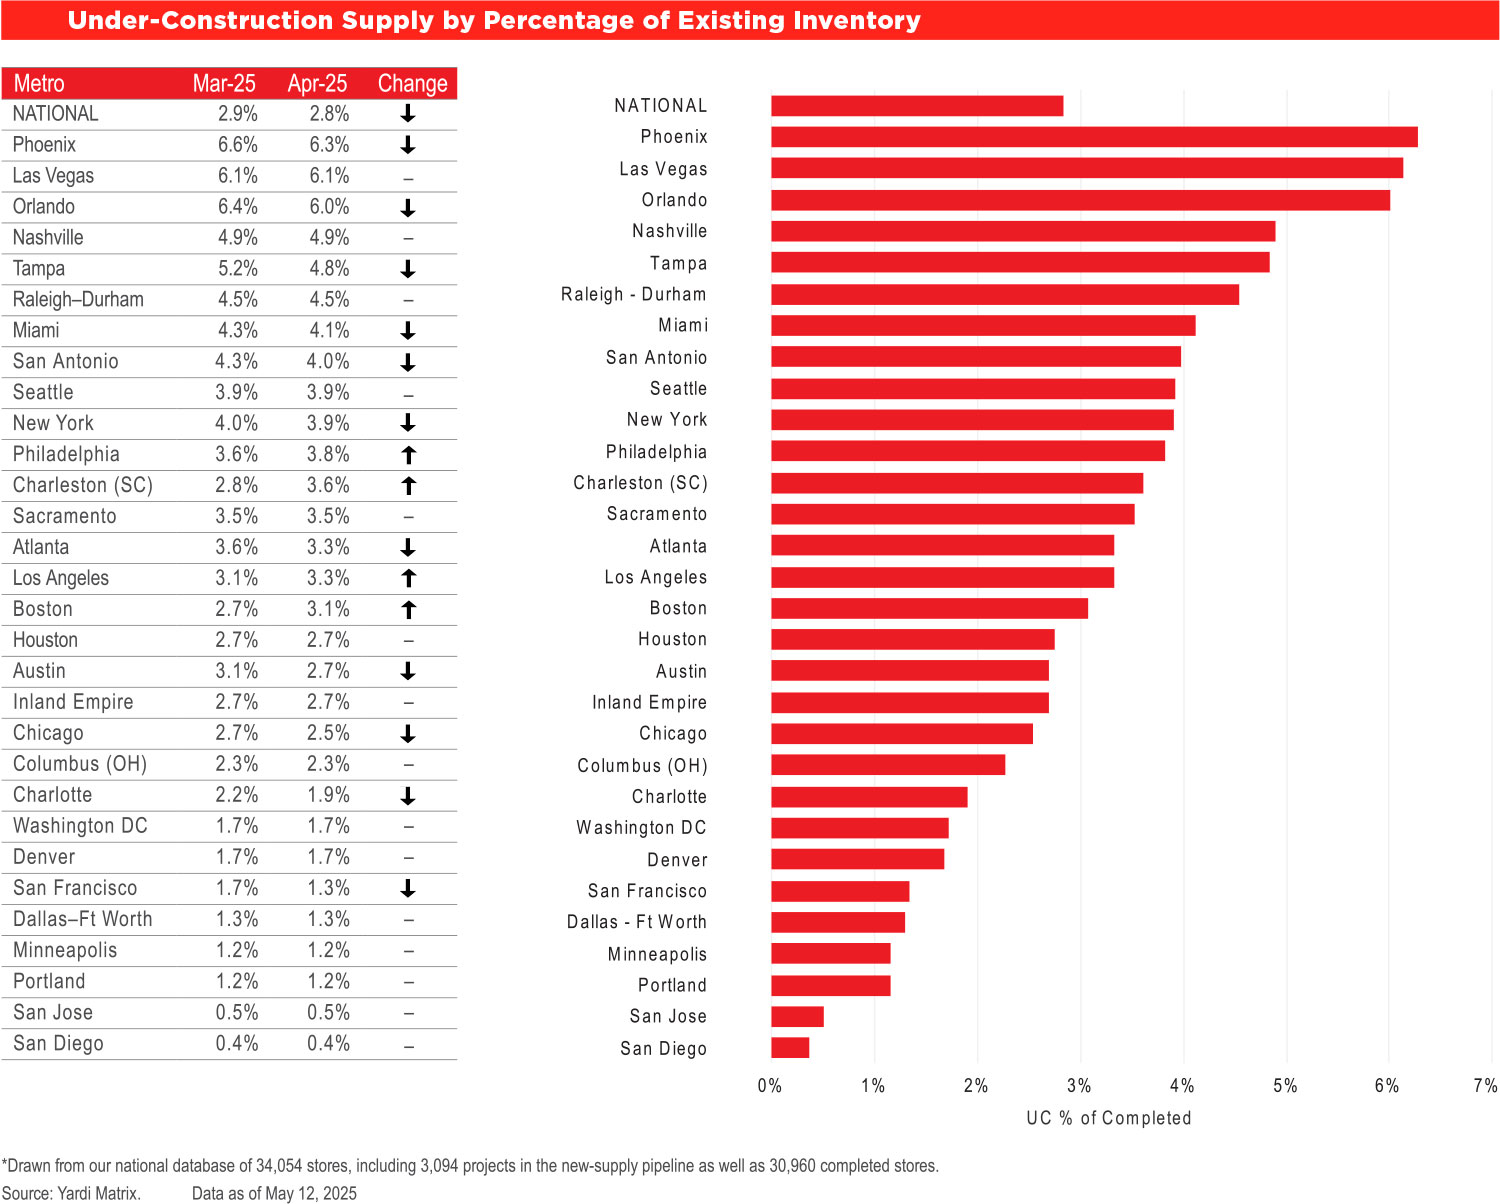
Nationally, Yardi Matrix tracks a total of 3,094 self-storage properties in various stages of development, including 732 under construction, 1,955 planned, and 406 prospective properties. The share of projects (net rentable square feet) under construction nationwide was equivalent to 2.8 percent of existing stock through the end of April, a 10-basis-point decrease from March.
Yardi Matrix also maintains operational profiles for 30,960 completed self-storage facilities in the U.S., bringing the total dataset to 34,054. We are happy to announce the release of our new Jonesboro, Ark.; Champaign, Ill.; Erie, Pa.; and San Angelo, Texas, storage markets, as well as the expansion of our existing Kansas City, Mo., storage market, all now available to Yardi Matrix customers on the subscriber portal.
Self-storage REITs were again more aggressive with advertised rate increases than their non-REIT competitors in April. Same-store advertised rents at stabilized properties for all REITs were up 1.3 percent year over year versus -1.1 percent for their non-REIT competitors in the same markets nationwide. REITs were most aggressive increasing rents in smaller markets, as well as in Tampa (6.3 percent year over year), Raleigh-Durham (5.2 percent), and Chicago (4.9 percent).
See April 2025 Year-Over-Year Rent Change for Main Unit Sizes.

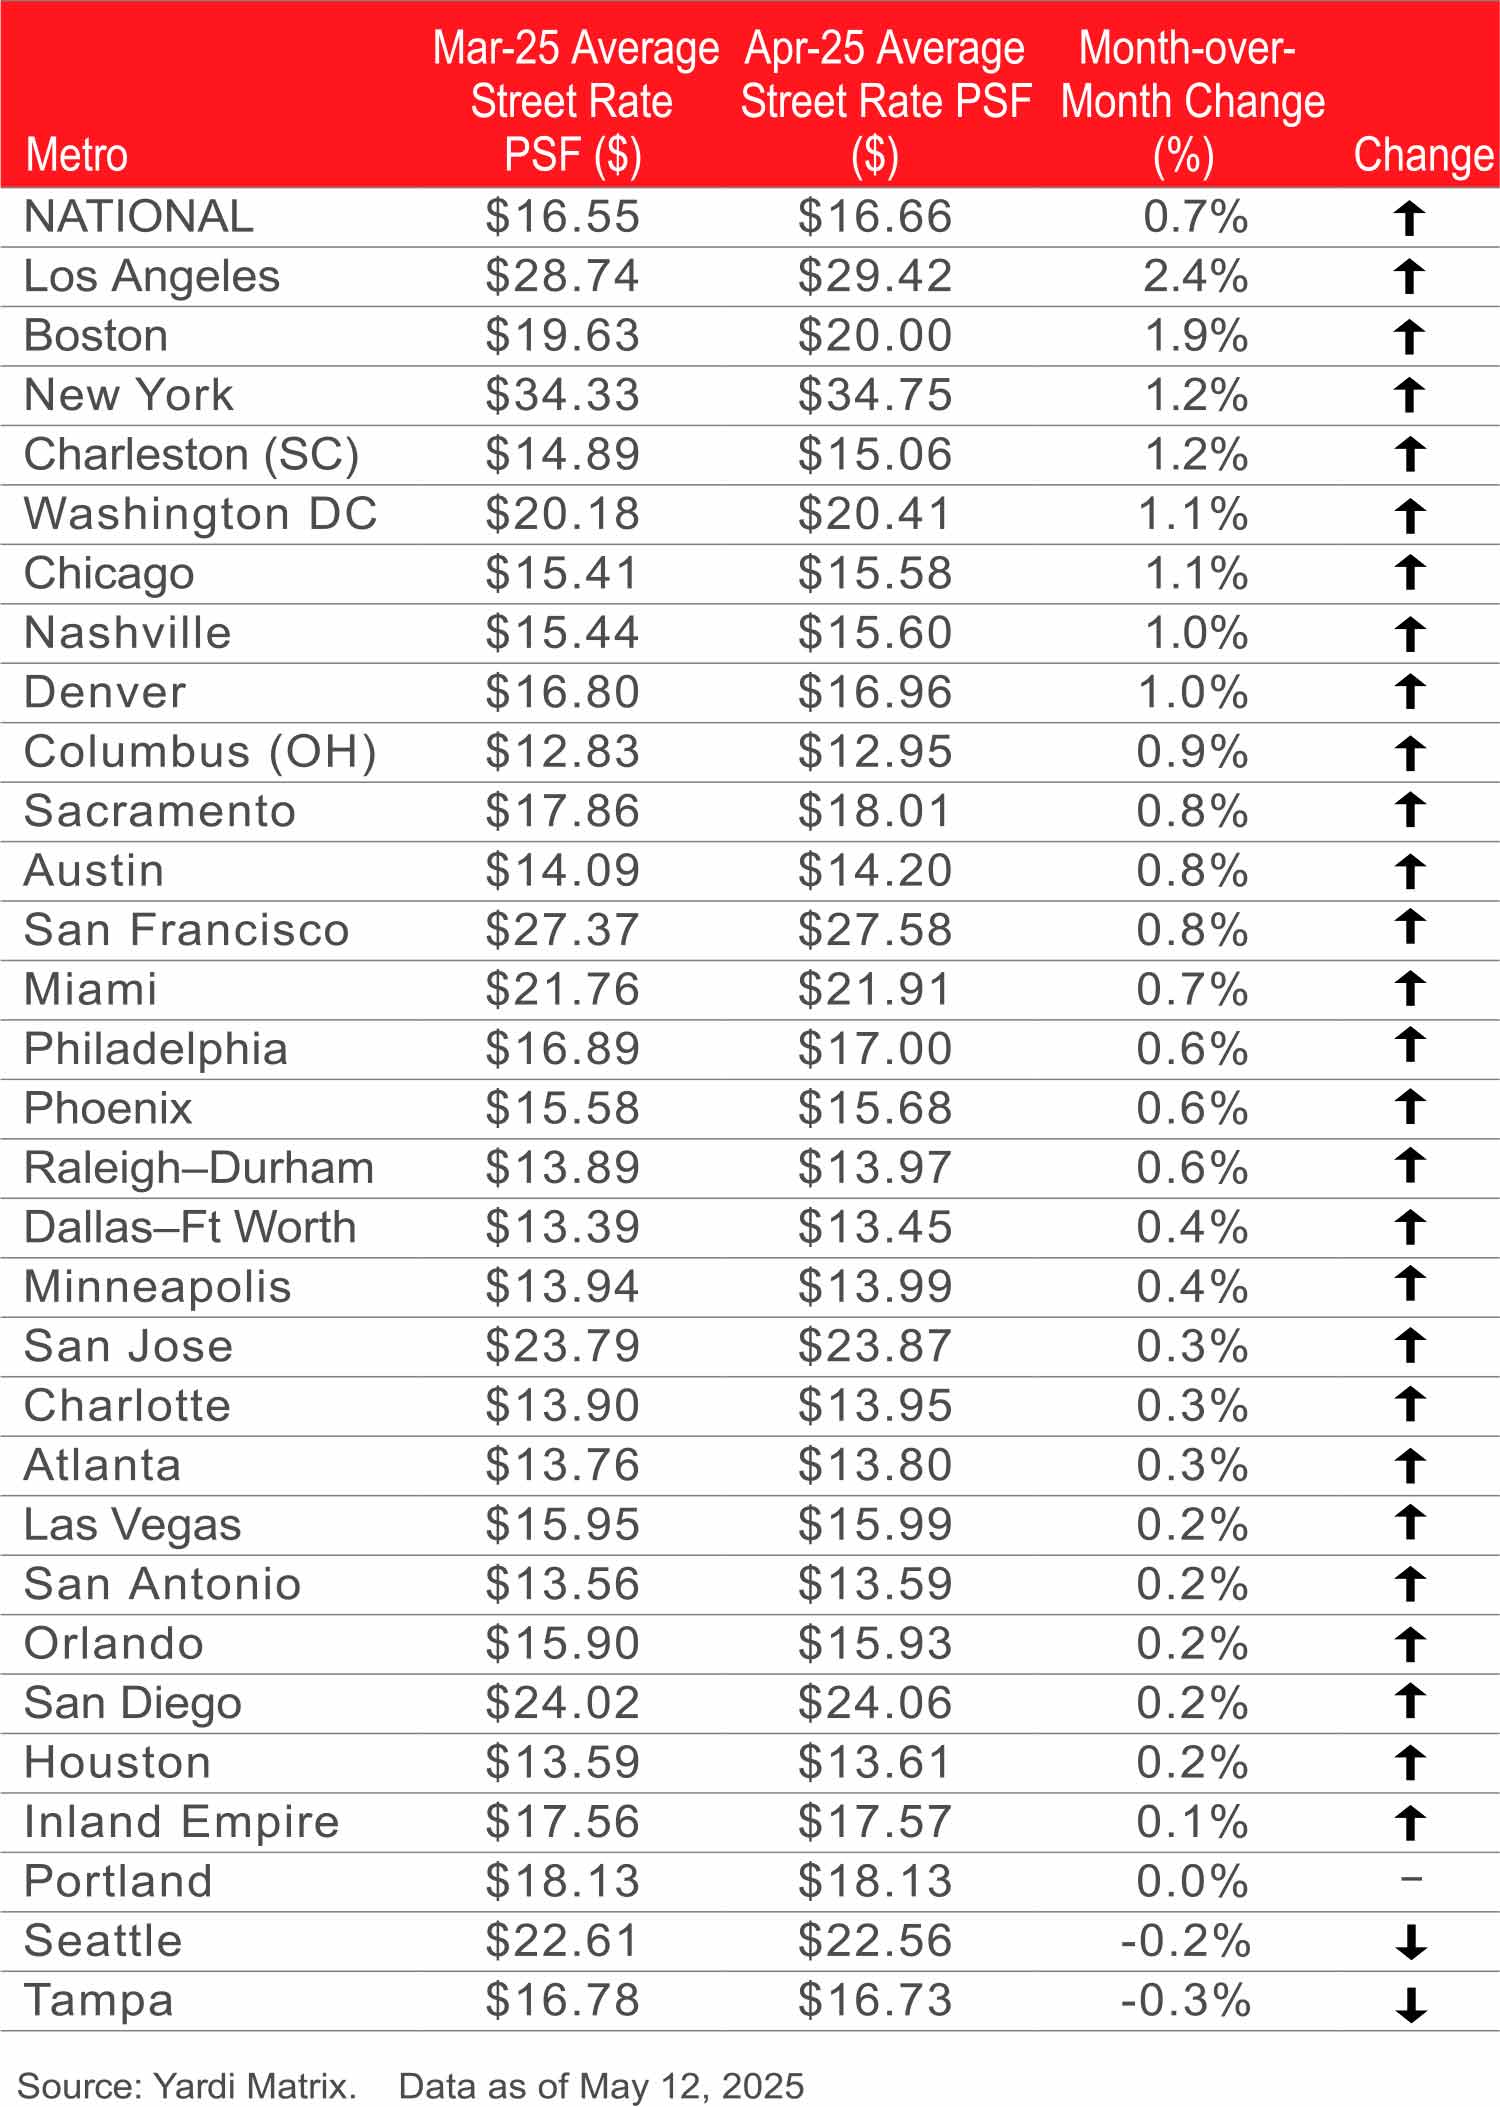
The increase in sequential asking rates was also broad-based across markets, with same-store advertised rates rising month over month in 27 of the top 30 metros in April.
Tampa was one of the only top metros that saw advertised rates drop month over month. While Tampa still has among the strongest year-over-year rate growth, its hurricane-driven demand may be waning. In addition, lease-up supply continues to increase in Tampa, with deliveries over the last three years equal to a substantial 14.6 percent of stock, which will further impact rate growth as demand returns to normal.
See Metro Rates Table and National Average Street Rates PSF for Main Unit Types.
In Los Angeles, advertised rate growth accelerated compared to last month. Advertised rates increased 1.5 percent year over year in April, a notable improvement from 0.1 percent in March. In response to the ongoing wildfires earlier this year, Los Angeles has pricing restrictions in effect until January 2026 that prevent self-storage operators from increasing rental rates more than 10 percent above those that were charged to existing renters before the emergency declaration. Operators are likely pushing advertised rates due to these restrictions on existing customer rate increases, leading to stronger asking rent growth in the Los Angeles metro.
See Self-Storage Major Metro Summary.
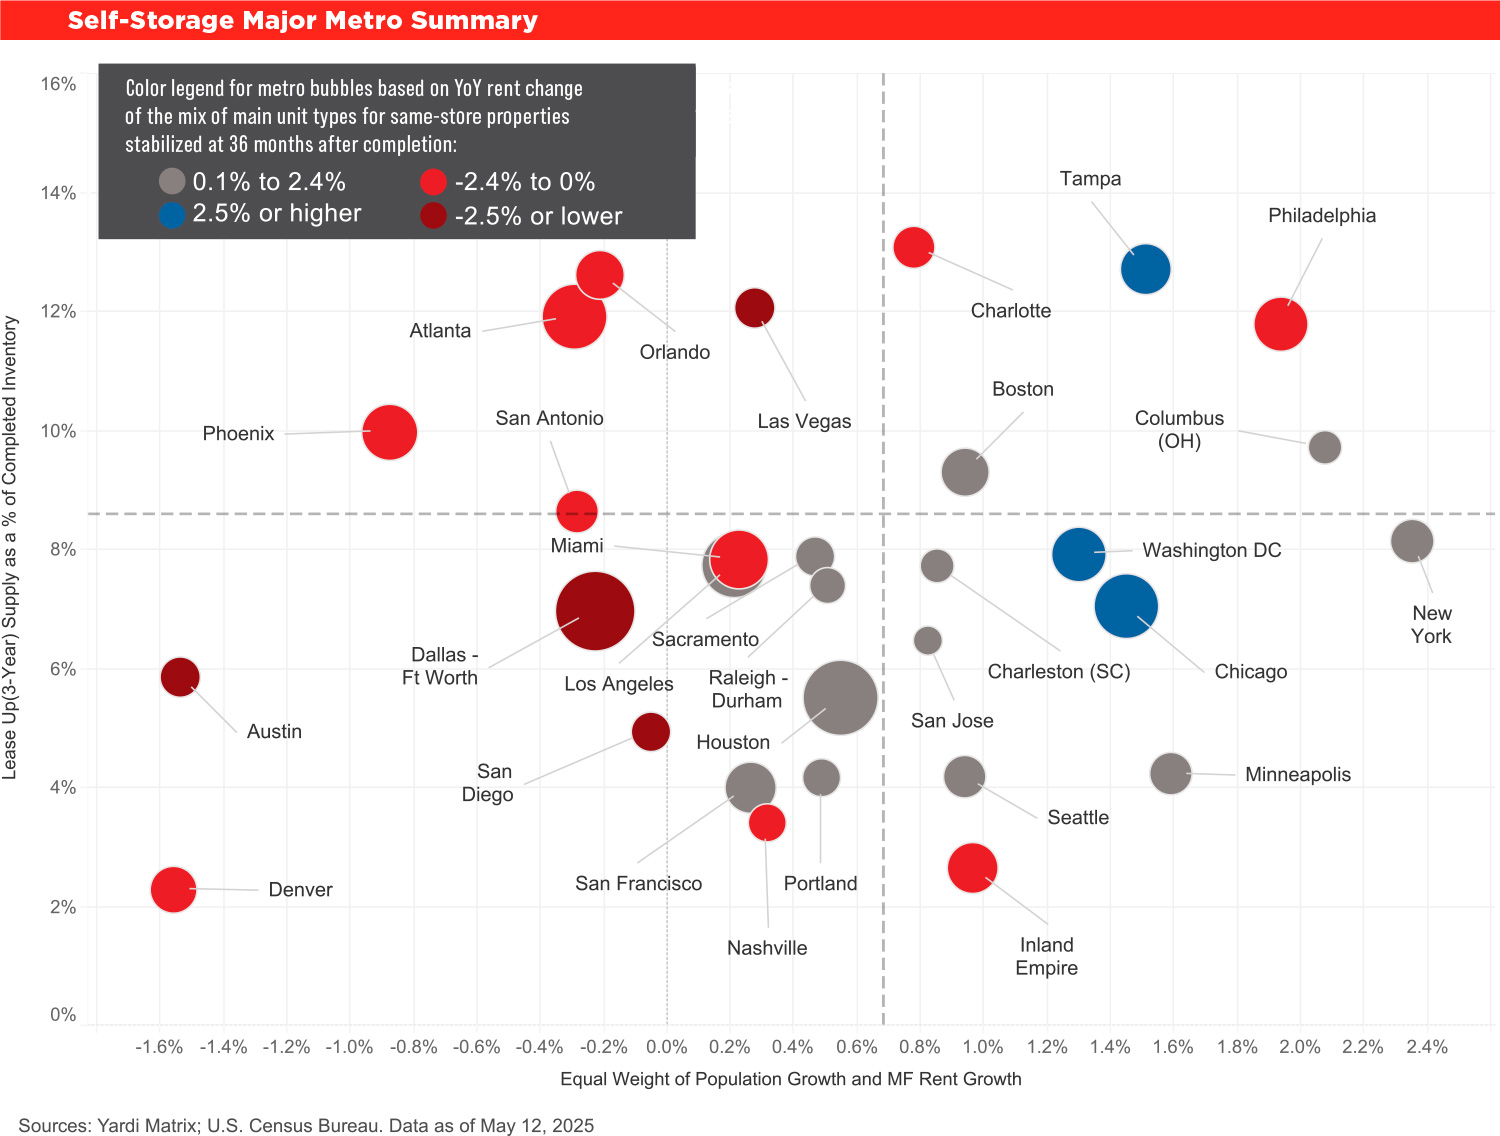
Most of Yardi Matrix’s top 30 metros currently have a lower level of lease-up supply than the national average. However, the majority of the top 30 have more supply under construction than the national level as new supply shifts back to the top markets.
See NRSF Delivered Over the Last 36 and 12 Trailing Months.

Yardi Matrix development pipeline data suggests a gradual slowdown in new development activity in the near term. For Matrix markets that have been open for at least 24 months, construction starts for full year 2024 decreased compared to 2023. This led to an annual reduction in the under-construction pipeline in the first quarter of 2025, while the planned pipeline also saw a slight drop of nearly 4 percent.
Month over month, Charleston had the largest increase in construction activity, up 0.8 percent. Over the past year, Charleston has seen its construction pipeline increase 170 basis points from 1.9 percent of existing stock in April 2024. As a result, it is forecast to see new supply increase by 2.5 percent of stock in 2025.
See Under-Construction Supply by Percentage of Existing Inventory and Monthly Rate Recap Table.